Article

Adsorption Pore Volume Distribution Heterogeneity of Middle and High Rank Coal Reservoirs and Determination of Its Influencing Factors

1
School of Safety Science and Engineering, Anhui University of Science and Technology, Huainan 232001, China
2
PetroChina Coalbed Methane Company, Beijing 100028, China
3
College of Earth Sciences & Engineering, Shandong University of Science and Technology, Qingdao 266590, China
4
Department of Mechanical, Materials and Manufacturing Engineering, Faculty of Engineering, University of Nottingham, Nottingham NG7 2RD, UK
*
Author to whom correspondence should be addressed.
Processes 2025, 13(2), 429; https://doi.org/10.3390/pr13020429
Submission received: 2 January 2025 / Revised: 18 January 2025 / Accepted: 26 January 2025 / Published: 6 February 2025

Abstract

:
Heterogeneity of adsorption pore volume distribution affects desorption and diffusion processes of coal reservoirs. In this paper, N2 and CO2 adsorption and desorption experiment tests were used to study the pore structure of middle and high rank coal reservoirs in the study area. The fractal theory of volume and surface area is used to achieve a full-scale fractal study of adsorption pores (pore diameter is less than 100 nm) in the study area. Firstly, adaptability and control factors of volume fractals and surface area fractals within the same aperture scale range are studied. Secondly, fractal characteristics of micro-pores and meso-pores are studied. Thirdly, fractal characteristics within different aperture scales and the influencing factors of fractal characteristics within different scale ranges are studied. The results are as follows. With the increase in coal rank, pore volume and specific surface area of pores less than 0.8 nm increase, and dominant pore size changes from 0.55~0.8 nm (middle coal rank) to 0.5~0.7 nm (high coal rank). As coal rank increases, TPV and average pore diameter (APD) decrease under the BJH model, while SSA changes are not significant under the BET model. Moreover, as the pore diameter decreases, the correlation between the integral dimension of pore volume and degree of coal metamorphism decreases. This result can provide a theoretical basis for the precise characterization of the target coal seam pore and fracture structure and support the optimization of favorable areas for coalbed methane.

1. Introduction

The storage space of coal reservoirs is mainly composed of defect spaces (solid solution state) between molecules on the surface of the coal matrix and micro pores developed at the nanoscale. Coalbed methane (CBM) is mainly physically adsorbed on the surface of nano pores [1]. The pore structure, including pore morphology, pore size distribution, and pore connectivity, determines the pore and permeability characteristics of coal, thereby affecting the adsorption and transport state of gases [2,3,4]. Therefore, the homogeneity of pore structure has become an important factor in CBM enrichment and development.
Fractal theory has become an effective method for studying pore structure heterogeneity in porous media. Different methods from various perspectives were used to study fractal dimension: these methods include gas adsorption, small-angle X-ray scattering, mercury porosimetry, image analysis, and small-angle neutron scattering [5,6]. Among them, the simplicity of the mercury intrusion/gas adsorption method makes it a universal method for studying the fractal dimension of coal reservoirs. Meanwhile, two curves containing pore structure information were obtained through high-pressure mercury intrusion porosimetry (MIP) and low-temperature N2 adsorption (LPN2 GA), and a series of fractal calculation models were gradually formed, such as the Menger model, Sierpinski model, BET fractal model, FHH (Frenkel Halsey Hill) fractal model, thermodynamic fractal model, and multifractal model [7,8,9].
Based on IUPAC pore classification criteria and the adsorption and permeation characteristics of different pore sizes, Yao et al. (2008) and Liu et al. (2015) believe that pores with a diameter smaller than 100 nm provide the main space for gas adsorption and storage. Pores with a diameter larger than 100 nm provide the main migration channels for gas and water, which can be divided into adsorption pores and seepage pores [10,11].
However, due to the higher molecular diameter and instrument accuracy of N2 (0.36 nm), the pore structure of 2 nm is difficult to characterize by using LPN2 GA, so this method could obtain a pore distribution of 2–100 nm (transition pores and micropores) [12,13]. Zhao et al. (2016) showed that micro-pores in middle and high rank coal are developed; then it provides the majority (>99%) of surface area (SSA) [12]. Micro-pore surface area has a good positive correlation with methane adsorption capacity, indicating that CO2 adsorption can characterize the micro-pore structure of coal reservoirs. Micro-pores (pore diameter is less than 2 nm) have not been fractally studied, and the differences in fractal characteristics among adsorption pores (2–100 nm) also need to be studied. Moreover, Song et al. (2017) studied the fractal characteristics of the surface area of differently structured coal based on theoretical analysis, but there is insufficient research on surface area fractals and volume fractals [14]. A large number of fractal theories rely on volume fractals to study surface area fractals in high rank coal pores with a specific surface area of up to 100 m2/g.
In this paper, LP N2 GA and LTCO2 GA tests were used to study the pore structure of middle and high rank coal reservoirs in the study area. The fractal theory of volume and surface area is used to achieve a full-scale fractal study of adsorption pores (pore diameter is less than 100 nm) in the study area. The main research objectives of this article are as follows. Firstly, adaptability and control factors of volume fractals and surface area fractals within the same aperture scale range are studied. Secondly, fractal characteristics of micro-pores and meso-pores are studied. Thirdly, fractal characteristics within different aperture scales and the influencing factors of fractal characteristics within different scale ranges are studied.

2. Experimental Methods and Related Theories

2.1. Geological Setting

A total of 9 groups (20 × 20 × 15 cm3) of middle- and high-order primary-fractured structural coals were collected in this experiment in the Qianxi-Diandong region, including the Tucheng mining area and the Laochang mining area. Nine coal samples were collected from the Longtan Formation in nine different coal mines, all of which selected primary structural coal, and the differences in the content of microscopic components among all the samples were relatively small. The coal-bearing strata in this area are in the Permian Longtan Formation. The depositional environment is a deltaic–tidal ping–lagoon depositional system, affected by the regional uplift, along the SE to the stratum of the deepening of the depth of burial, and the coal is mainly bituminous, anthracite-based coal. The Tucheng mine is dominated by middle coal rank coal seams, and the Old Factory mine is dominated by high coal rank coal seams. The buried depth of coal seams ranges from 600 m to 800 m, the tectonic development of the sampling area is stable, and the coal samples are mostly dominated by weak brittle deformation [15].

2.2. Sample Preparation and Experimental Test

The collected samples were treated with special packaging and quickly transported to the laboratory for pre-experimental processing and a series of experimental tests and analyses according to the specification GB/T 19222-2003 for coal rock samples [16]. Firstly, each group of samples was analyzed according to the reference standard GB/T 18023-2000 for determination of coal type (bright coal, semi-light coal, semi-dark coal and dull coal) [17,18]. The microscopic maceral analysis was prepared on 3 × 3 cm2 polished slabs with a total of 500 points (GB/T 6948-1998) [19]. The proximate analysis was conducted on all 12 samples following GB/T 212-2001, with the results of the ash, volatiles, moisture, and fixed carbon contents of the coals reported on a dry and ash-free basis [20].
Selected 3~4 g of the coal samples were crushed to 2~4 mm using AutoporeIV9500 mercury pressure meter produced by McIlroy, USA to conduct the mercury pressure test; to ensure the reliability of the results, we deleted the pore size > 10,000 nm data. Finally, the remaining samples of each group were ground into 40~60 mesh, and the appropriate amount was taken for low temperature liquid nitrogen and CO2 adsorption and desorption experiments. A TrostarⅡ3020 specific surface area and pore size distribution tester was used for the cryogenic liquid nitrogen experimental test at 77 K. The pore distribution was determined by using the BJH model, and the pore specific surface area was determined by using the BET model [21]. CO2 adsorption and desorption experiments were conducted using the ASAP2020 specific surface area and pore analyzer from Micrometitics at a temperature of 273.15 K.
The micro-pore SSA and PV were comprehensively revealed through DFT, Dubinin–Radushkevich (D–R), and the Dubinin–Astakhov (D–A) model. The micro-pore size distribution was calculated through the DFT mode (Song et al., 2017) [14].

2.3. Fractal Theory

Based on the high-pressure mercuric pressure, low-temperature N2 adsorption and CO2 adsorption tests, the volume fractals and surface area fractals were comprehensively analyzed, and their values characterized the pore volume homogeneity and surface area homogeneity, respectively.
The Frenkel–Halsey–Hill (FHH) model is the most commonly used fractal model in LPN2 GA to characterize adsorption pores ranging from 2 to 100 nm. Its expression is as follows:
ln ( V V m ) = C + A ln ln ( P 0 P ) , D F V = 3 A + 3   D F V = A + 3
where P is the equilibrium pressure, MPa; P0 is the saturation pressure of N2, MPa; V is the volume of N2 adsorbed at each equilibrium pressure P, cm3/g; Vm is the volume of monolayer coverage, cm3/g; C is a constant; A is the power-law exponent, which is dependent in the fractal dimension (D) and the mechanism of adsorption.
There are two fractal relationships between volume fractal DFV and slope A at different adsorption stages, which have been proven by numerous scholars to be applicable D F V = A + 3 [22].
Using the Sierpinski fractal model to describe the volume fractals of micropores [14], the fractal expression is
ln ( V ) = ( 3 D s v ) ln ( P P t ) + ln
where V is the adsorption volume, cm3/g; P and Pt are the experimental pressure and threshold pressure, respectively, MPa; Dsv is the volume fractal dimension of micro-pores; and is the fitting constant.
Equation (3) is used for the surface fractal calculation of adsorption pores such as micropores and mesopores (Song et al., 2017) [14].
ln S ( r ) = ln ( S 0 K S ) + C ln r
where S(r) is the total specific surface area (TSS), Ds is the slope of the lnS/lnr curve; the r is the diameter; then the surface fractal dimension (Ds) is Ds = 2 + C or Ds = (C − 3)/3.

3. Results and Discussion

3.1. Microscopic Composition and Industrial Analysis

The results shows that Ro, max of all the samples is 0.93~3.16%, water content (0.88~2.64%, with an average of 1.79%) increases from middle to high rank coal, ash content is 4.48~25.04%, volatile content decreases from middle coal rank (average value of volatile content is 27.8%) to high rank coal (average value of volatile content is 8.45%), and the fixed carbon content of all the samples increases with the increase in coal rank, with a trend of 49.04~84.58%. Moreover, the coal rock type is semi-bright and bright coal; then the coal structure is relatively simple, consisting of a primary fragmented structure.

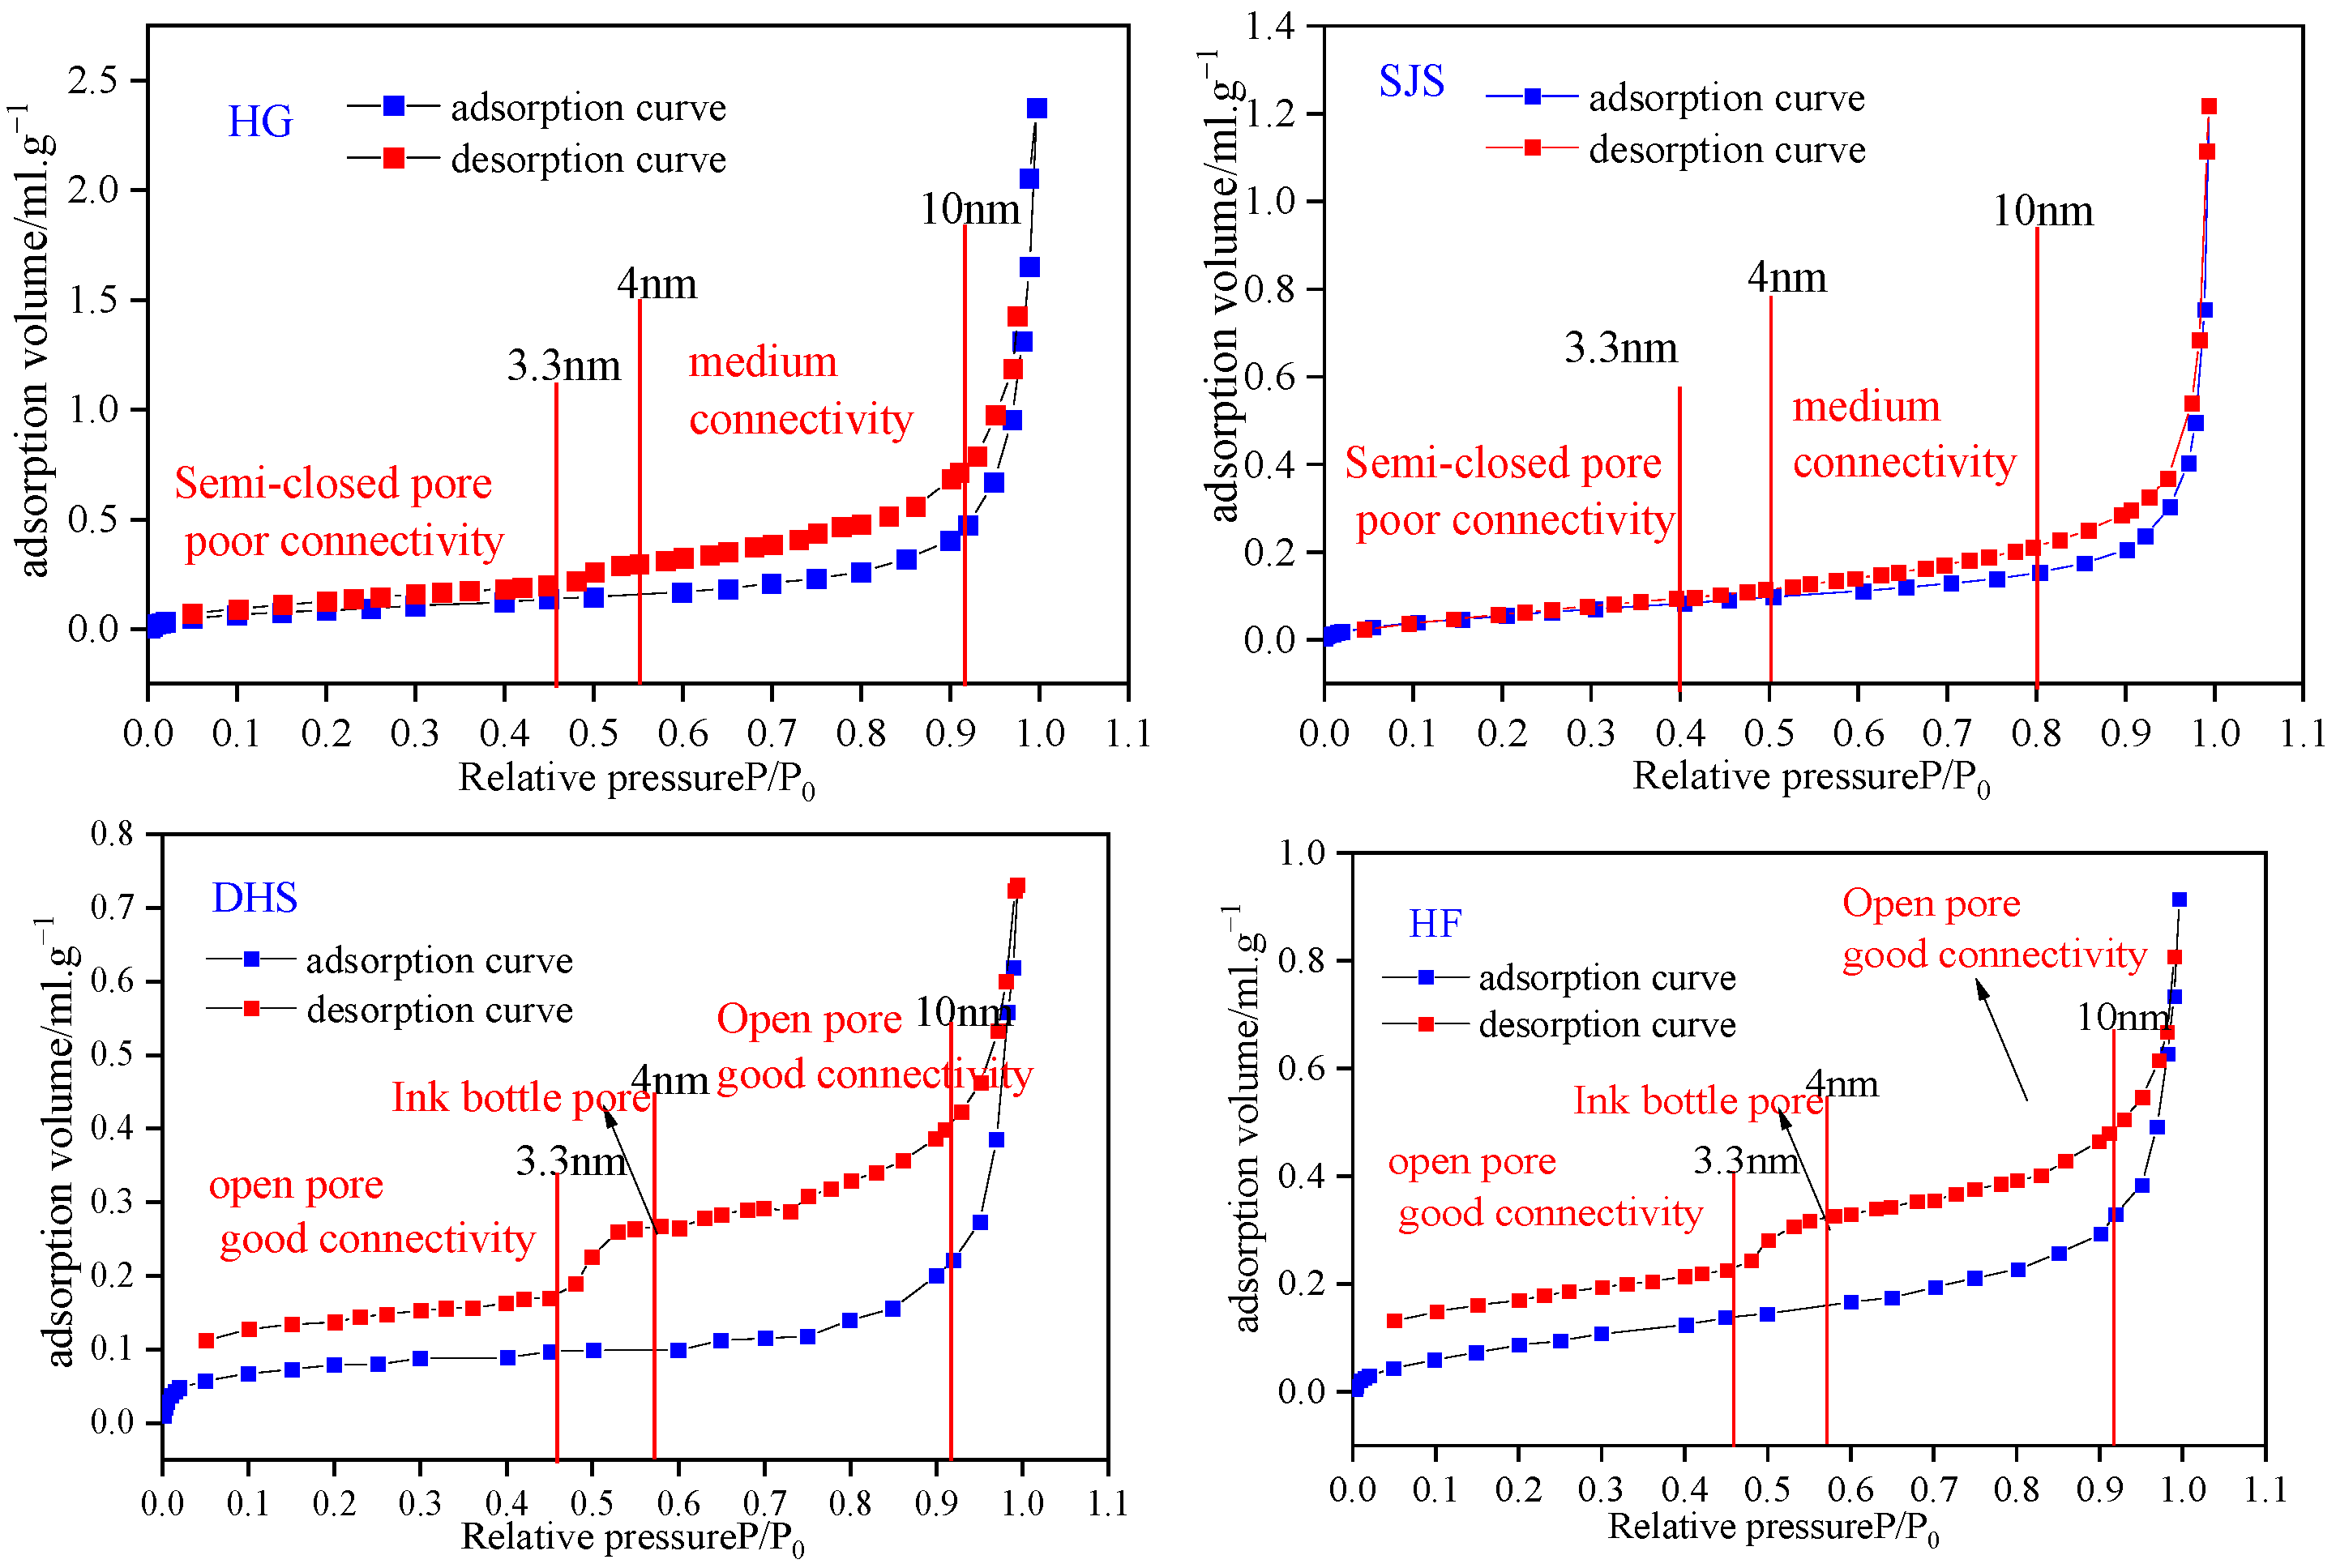
3.2. Pore Types and Connectivity of Adsorption Pores

Adsorption pore types are studied by using LPN2 GA tests. Figure 1 shows that the adsorption isotherms of the nine coal specimens exhibit a type IV with H3 type hysteresis loop by using the classification method proposed by IUPAC [3,4,5,6,7,23]. Different adsorption curves are classified into three types by using pore types and connectivity.
Type A samples belong to middle rank coal samples (HG, SJS, FZ). Within the range of relative pressure of 0.4~1, the hysteresis loop is narrow. When the relative pressure is less than 0.8 (pore diameter is less than 10 nm), adsorption and desorption curves are close to overlapping. As relative pressure increases (pore diameter is larger than 10 nm), the adsorption curve rapidly increases. The pore volume is provided by open meso-pores and macro-pores with good connectivity, while closed micropores provide the main specific surface area of the coal sample [24]. The adsorption curve and desorption curve of this type of sample almost overlap, indicating that the pore connectivity of this type of sample is good. Although the adsorption capacity of this type of sample is weak, the good pore connectivity is conducive to the migration of bulk methane, which is beneficial for higher coalbed methane production capacity.
Differing from type A samples, type B samples mostly belong to high rank coal (DHS, HF). Throughout the entire pressure range, both the adsorption and desorption curves of liquid nitrogen exhibit hysteresis loops with a wide hysteresis loop. When there is a clear inflection point when relative pressure is 0.5, the pore types are roughly divided by pore diameter is 4 and 10 nm. Micro-pores are mainly open pores with openings at both ends, indicating good pore connectivity, The meso-pore in the range of 4~10 nm are mainly in the form of ink bottle-shaped pores and narrow slit flat plate-shaped pores, with relatively good pore connectivity. Pores with pore diameter larger than 10 nm pore are mainly cylindrical open pores with open ends, indicating that these typee of open mesopores and ink bottle pores provide the main SSA and TPV for the coal sample. The adsorption curve and desorption curve of this type of sample are almost parallel, and there is a clear back loop, indicating that the pore connectivity of this type of sample is poor. Although this type of sample has strong adsorption capacity, the poor pore connectivity is not conducive to the easy production of methane after desorption, which is not conducive to achieving high coal gas production capacity.
The hysteresis loop of type C samples (JZJ, SJD, DS, SB) is narrow when the relative pressure is less than 0.5, indicating that pores with a diameter is less than 4 nm are closed at one end, and the pore connectivity within this range is poor. The open pores and ink bottle pores in this type provide the main pore volume, while closed micro-pores provide the main pore surface area.

3.3. Adsorption Pore Volume Distribution

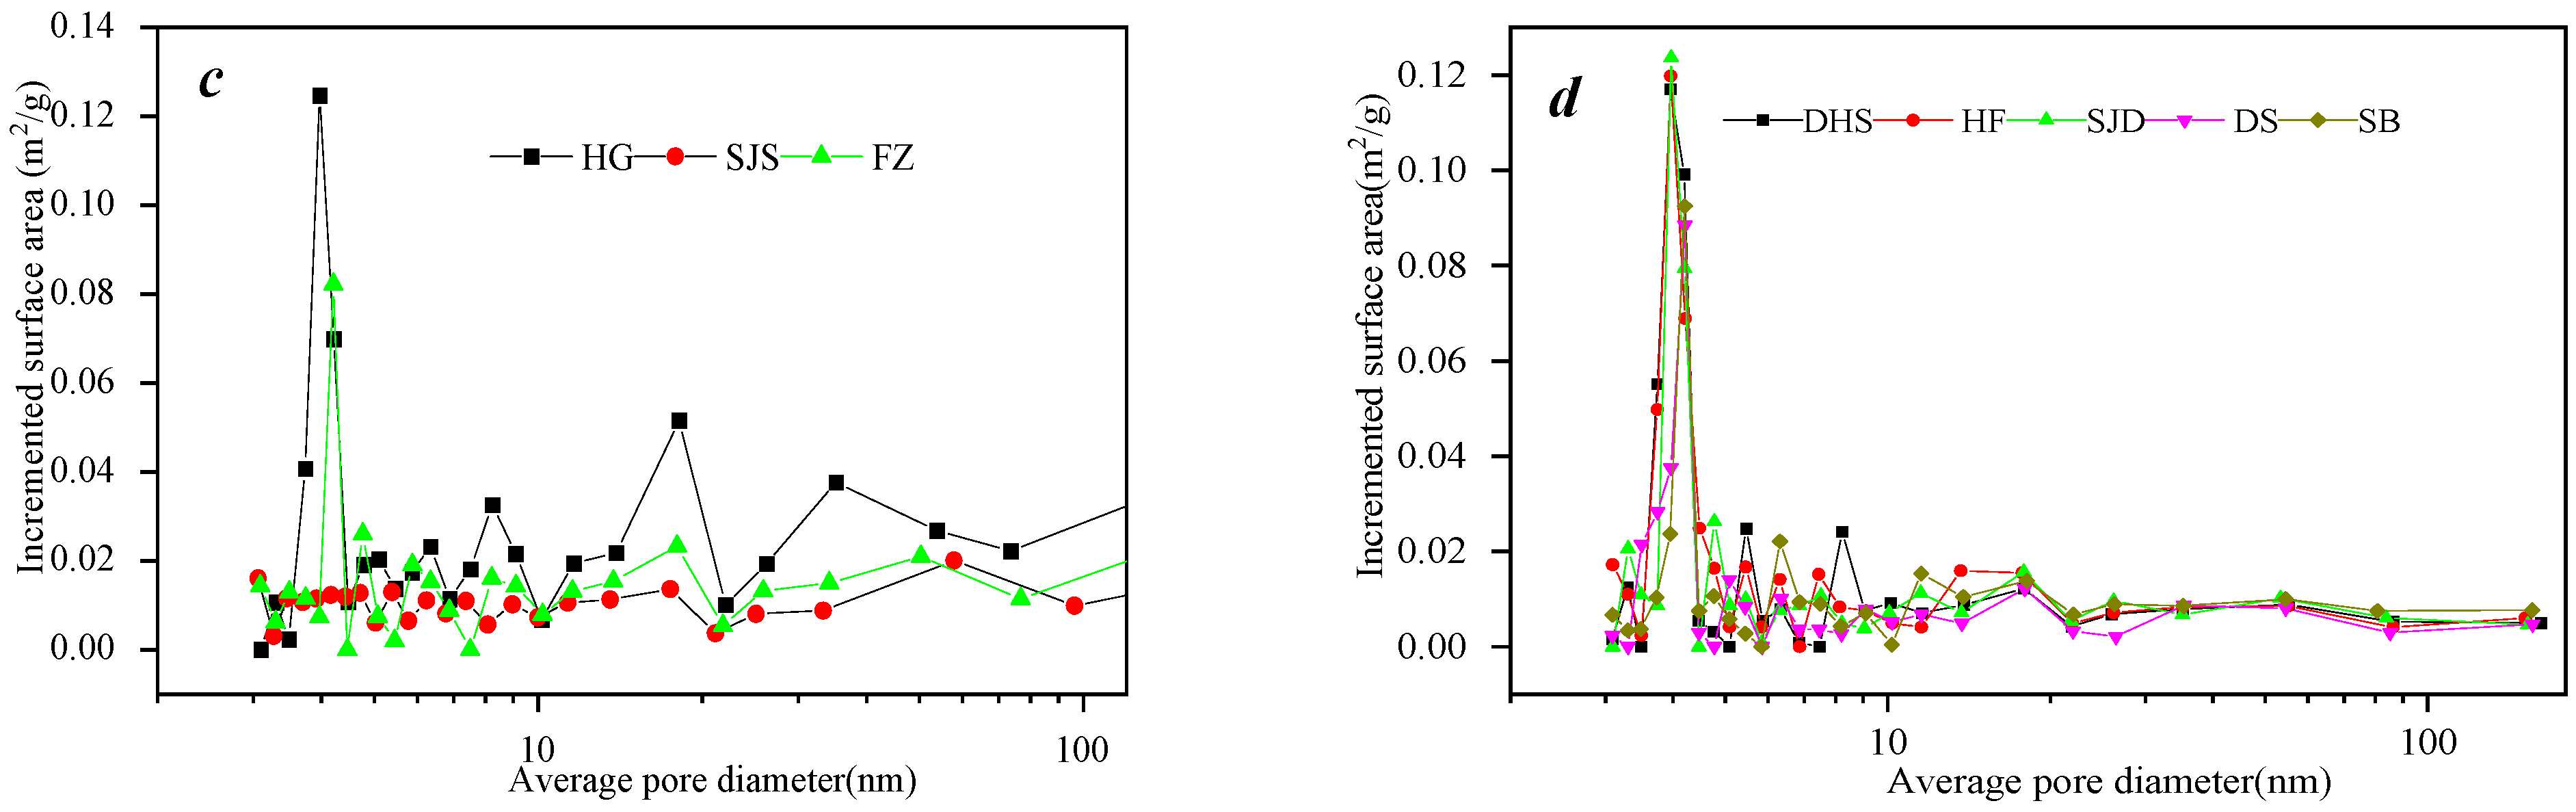
3.3.1. Pore Volume Distribution of 2~100 nm by Using LPN2 GA Tests

LPN2 GA test results show there are significant differences in pore structure parameters among those samples (Table 1). Among them, the specific surface area (SSA) and total pore volume (TPV) of sample DS are the smallest, being 0.14 m2/g and 0.001 cm3/g, respectively. The SSA and TPV of sample HG are the highest, being 0.34 m2/g and 0.0038 cm3/g, respectively. Its average pore diameter ranges from 3.41 to 5.37 nm. As coal rank increases, TPV and average pore diameter (APD) decrease under the BJH model, and the correlation between SSA and coal grade of all samples is weak. The results suggest that the BET theory is obtained by using multi-layer physical adsorption. When the relative pressure is 0.05–0.3, the BET model is used to measure the SSA of meso-pores rather than micro-pores, and its results are easily affected by the testing environment [23,24]. At the same time, it is influenced by the interaction potential of micropore walls, which makes physical adsorption of micro-pores much higher than that of meso-pores and external pore walls, making it difficult to accurately measure the SSA of micro-pores [25].
The results show that the pore diameter distribution of the type A sample is significantly different from that of type B and C, and it suggests that it is related to the degree of coal metamorphism. Pore types of middle rank coal samples (type A) are 10~100 nm. At this stage, pores provide the main pore volume of coal samples and a considerable part of the SSA (36~39%). In addition, the majority of sample SSA is provided by mesopores within the range of 2–10 nm (61~64%). The dominant pore size in the type B and C samples (high-rank coal) is 2–10 nm. The SSA is provided by meso-pores of 2–10 nm, and the contribution of meso-pores and macro-pores with 10~100 nm to SSA decreases (12~21%). At this stage, the pore size mainly contributes to the TPV of some coal samples. Meanwhile, it should be noted that the distribution of type B and C are influenced by the degree of coal metamorphism, and the correlation with pore structure is weak due to the constraints of sample quantity (Figure 2).

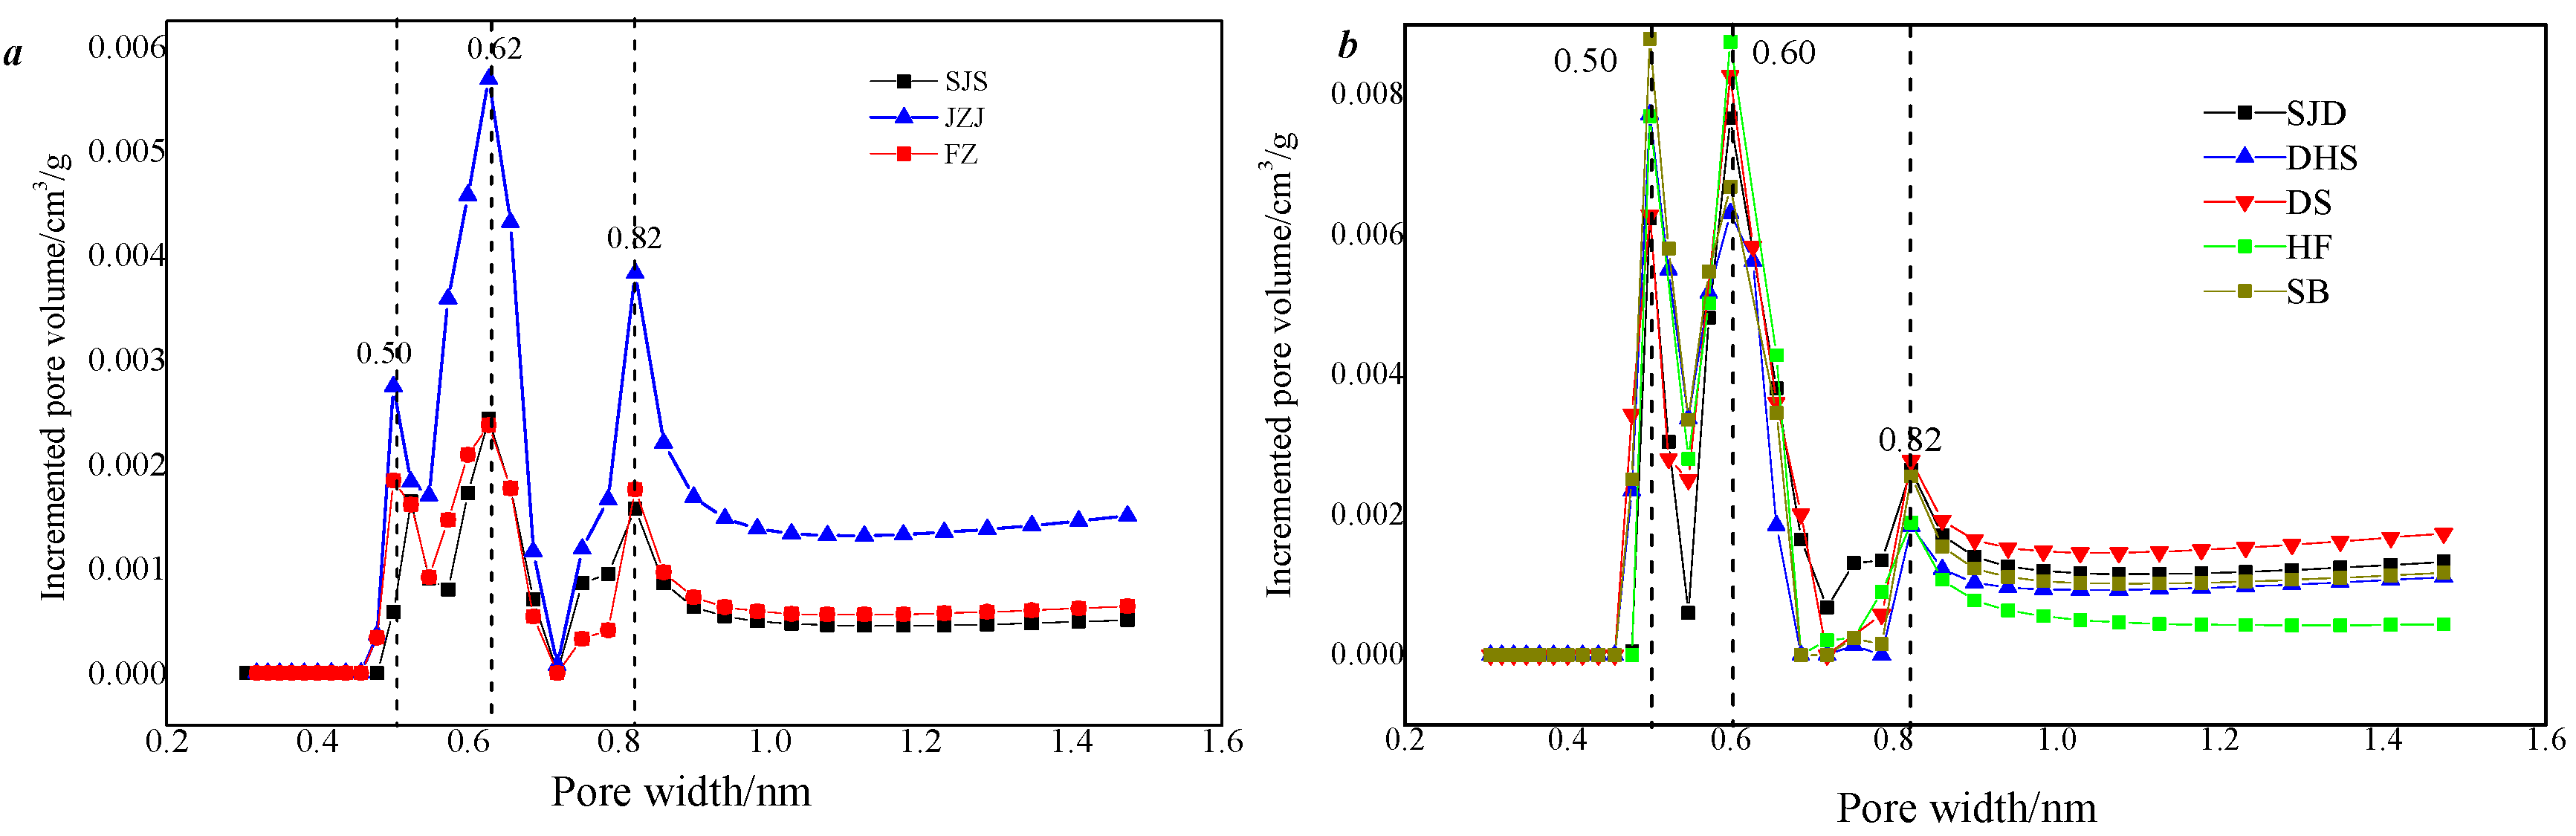
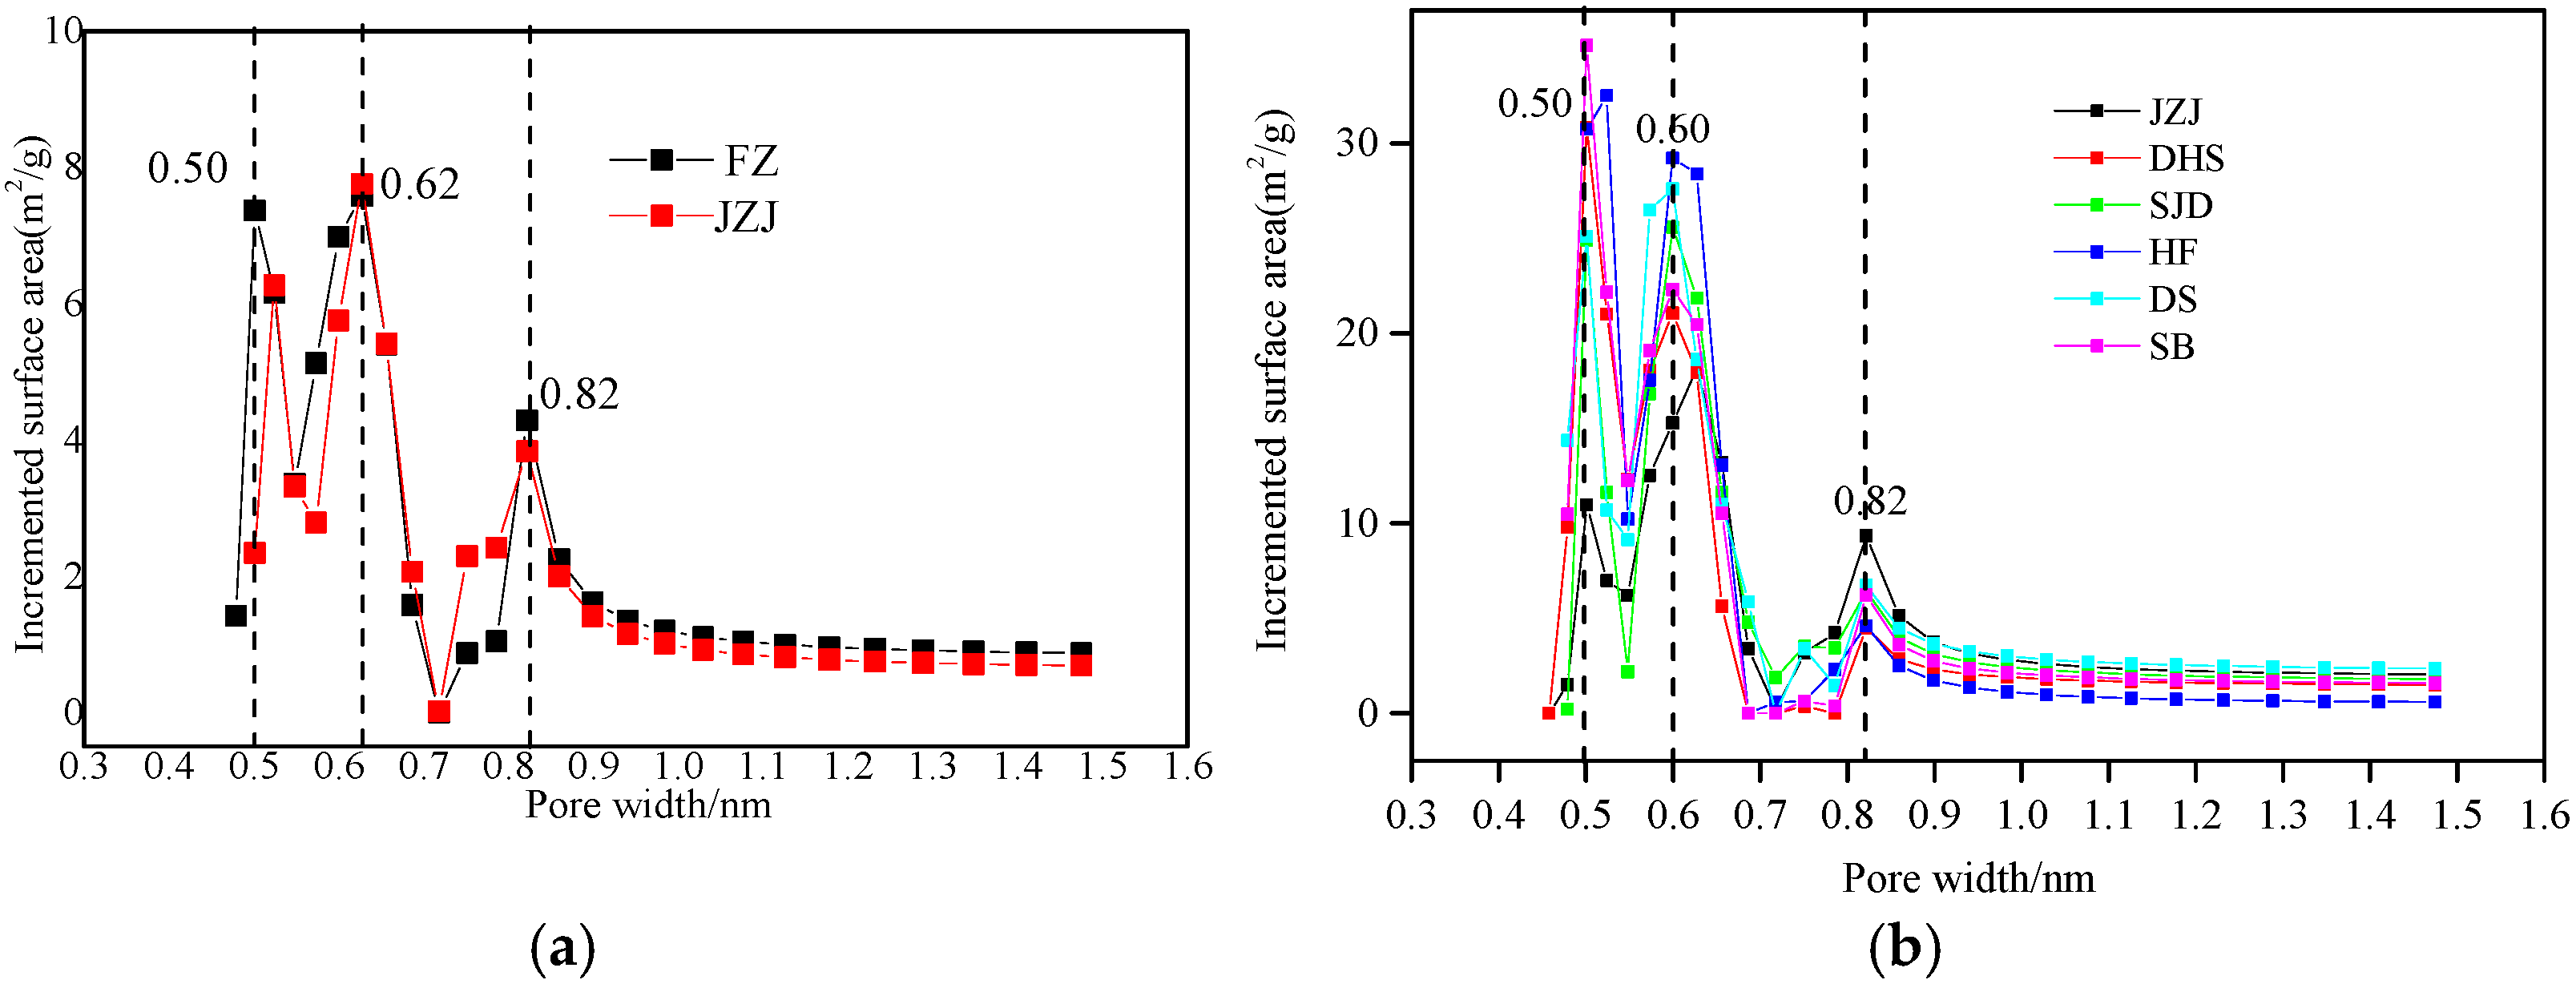
3.3.2. Micropore Distribution Characteristics Based on LPCO2 GA Test

Comparing and analyzing the CO2 adsorption curve (Figure 3), the adsorption capacity of high rank coal samples (13.67~18.75 mL·g−1) is much larger than that of medium rank coal samples (5.67~6.29 mL·g−1), and the curve shape gradually changes from nearly linear to concave with the increase in coal metamorphic degree, which is also consistent with the results of Zhao et al. (2016) [24].
The SSA, PV, and average micro-pores test results of the measured samples are shown in the following table. With the increase in coal metamorphism, the micropore SSA and PV gradually increase while the average pore size tends to decrease. The DFT, D–R, and D–A models tend to be consistent. In addition, the PV and SSA under the DFT model are lower than those under the D–R and D–A models (Table 2).
Figure 4 and Figure 5 show that 0.5~0.9 nm is the main dominant pore size of micropore surface area and pore volume. The cumulative specific surface area and pore volume of micropores are mainly provided by <0.9 nm (71~91% and 81~95% of the cumulative SSA and PV, respectively). The pore size of each sample was mainly distributed in three peaks: peak 1 (0.50~0.53 nm), peak 2 (0.60~0.62 nm), and peak 3 (0.82 nm). In this study, there was no significant change in the peak position of each peak with the increase in coal rank. The pore volume and specific surface area corresponding to peak 1 and peak 2 increased significantly, and the pore volume corresponding to peak 3 tended to decrease. The dominant pore size changed from 0.55~0.8 nm (medium coal rank) to 0.5~0.7 nm (high coal rank). This result is consistent with the conclusion of Qu et al. (2015) that the weak and medium deformations have little effect on the pore volume and peak position of each peak, and the corresponding deformed coal has no obvious change in pore volume and peak position with the increase in coal rank except for the slight increase in pore volume of peak 3 [26].

3.4. Pore Volume Distribution Heterogeneity of Adsorption Pore

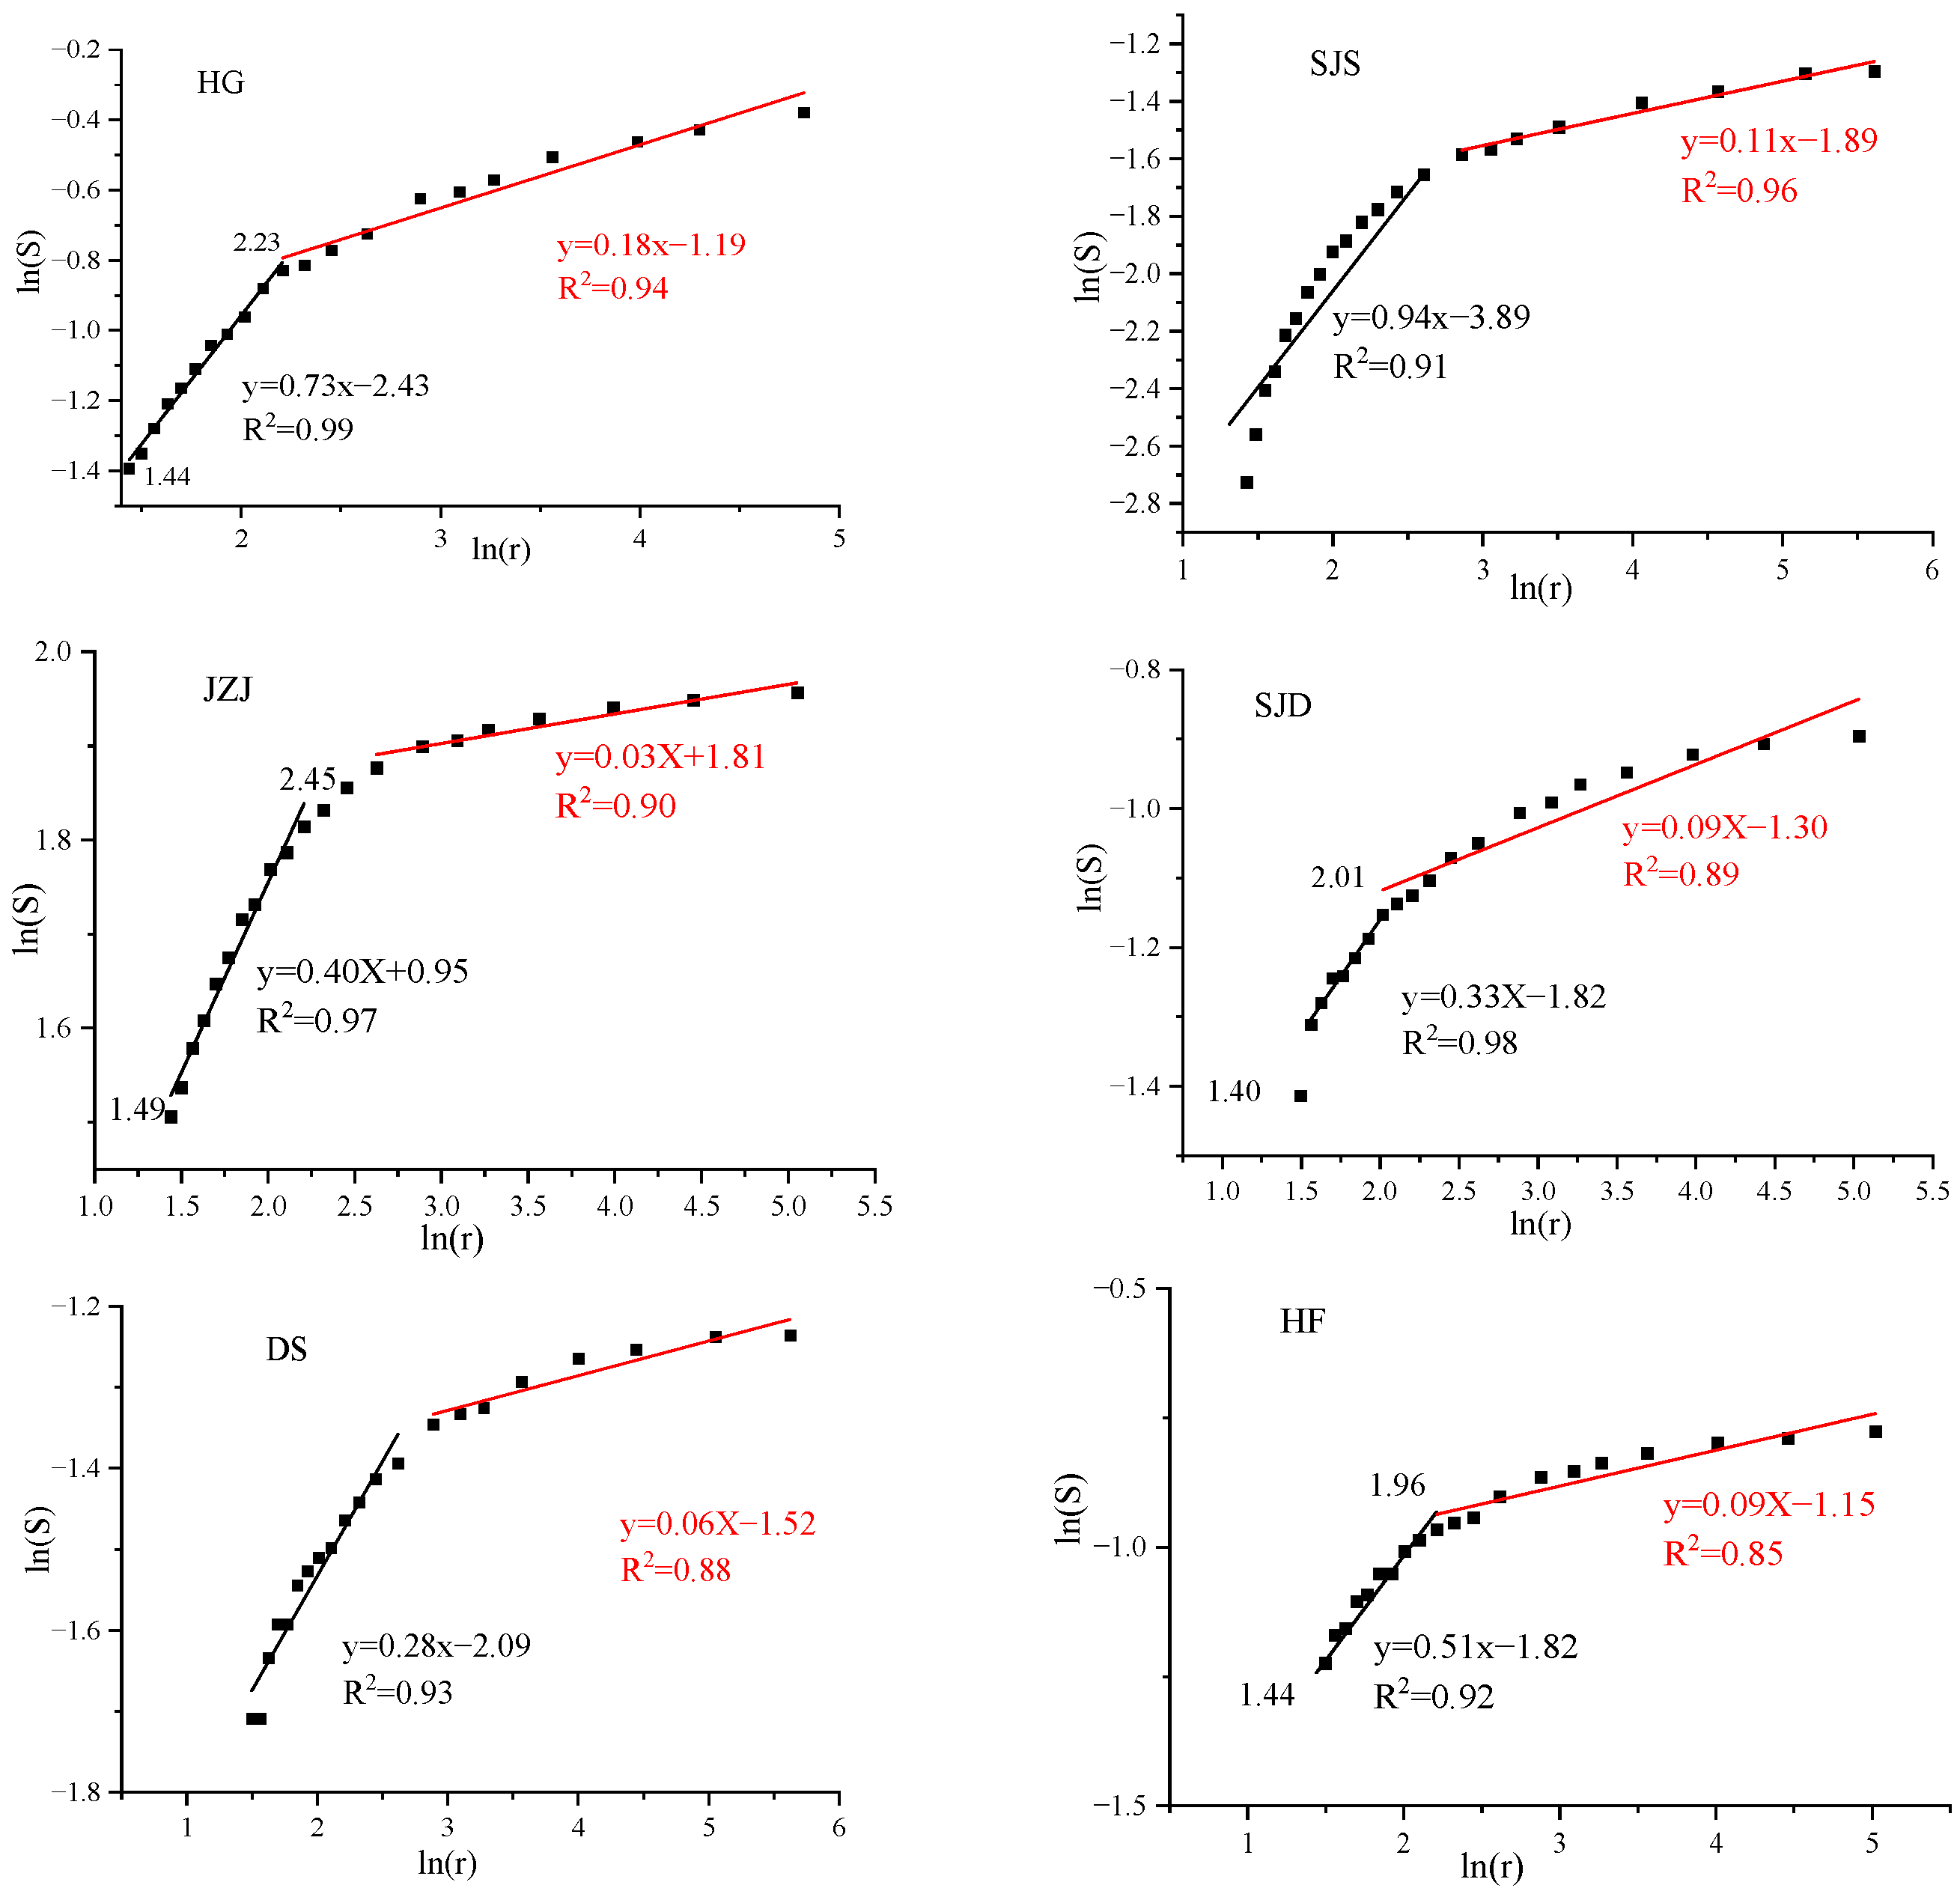
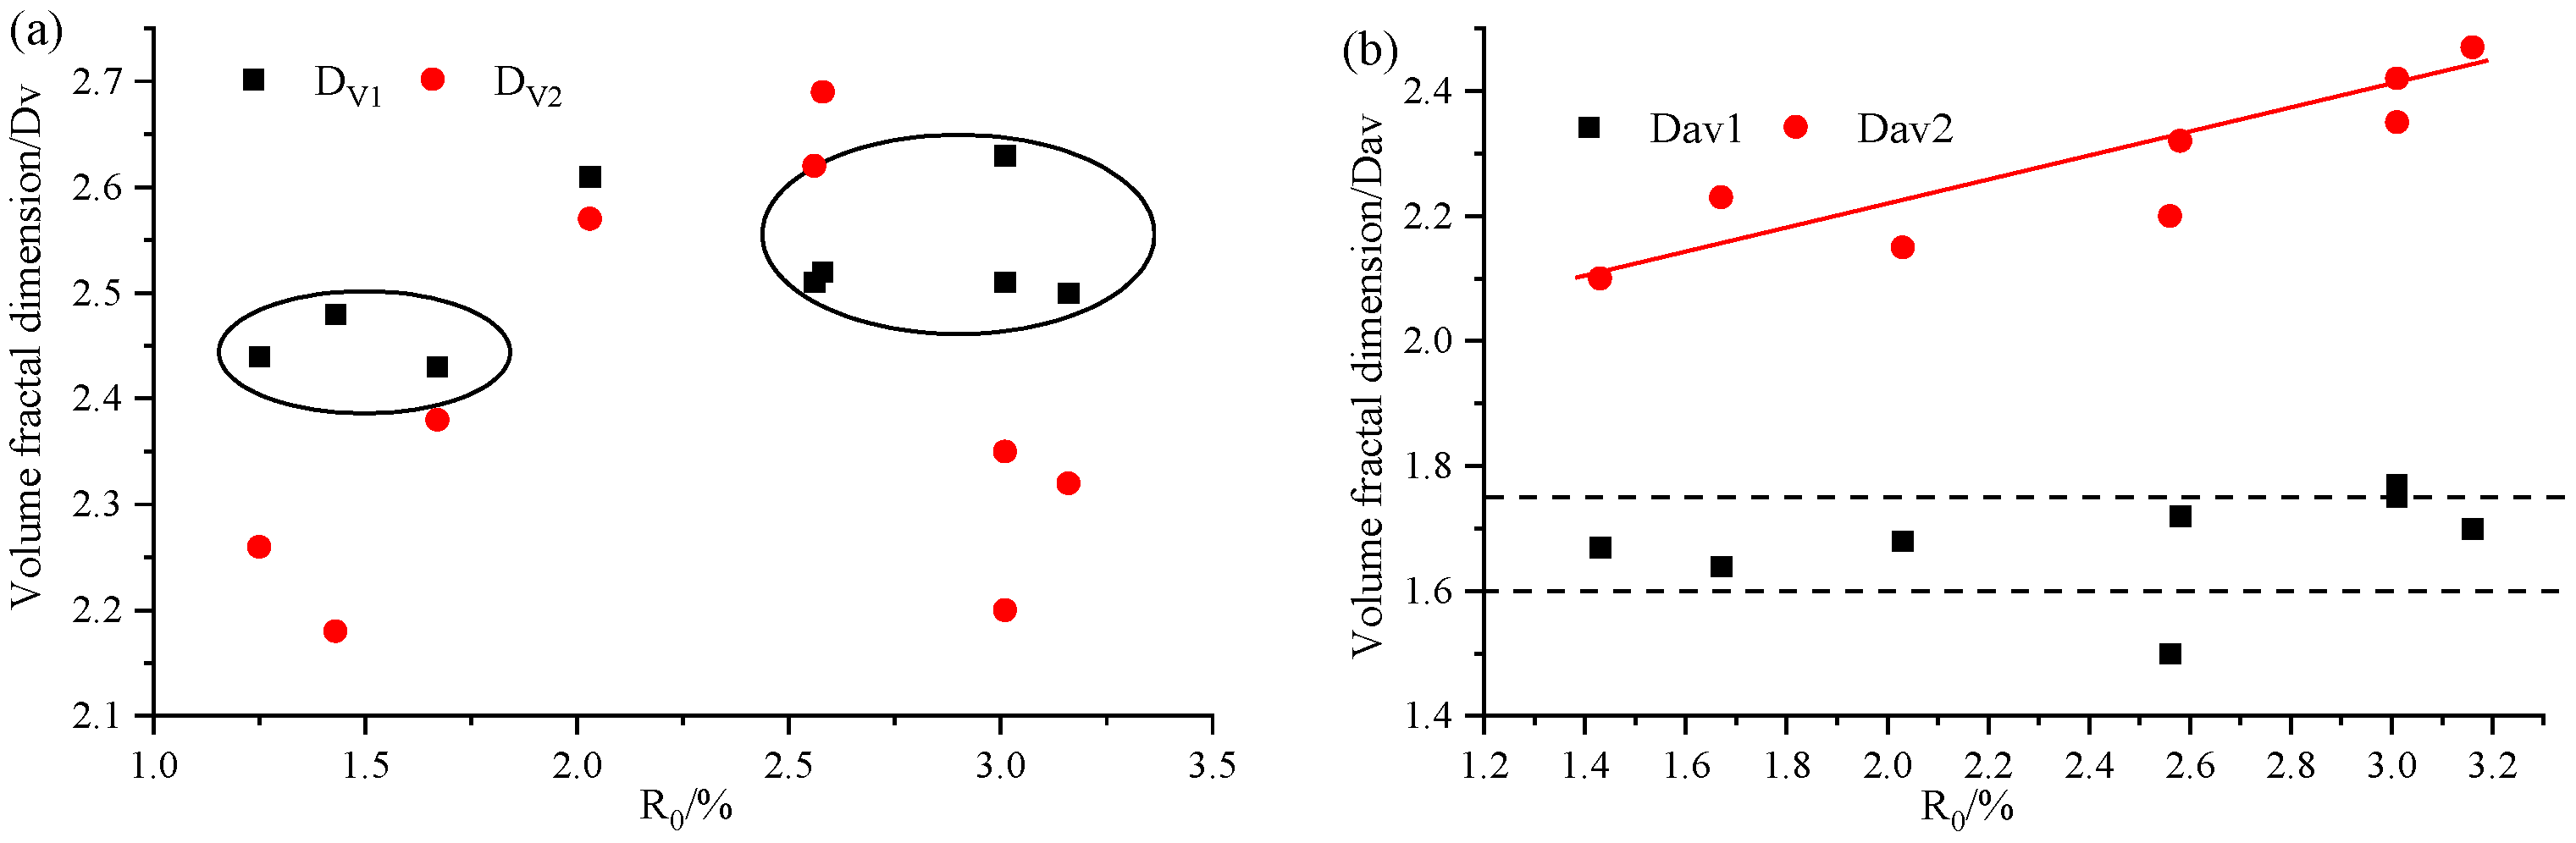
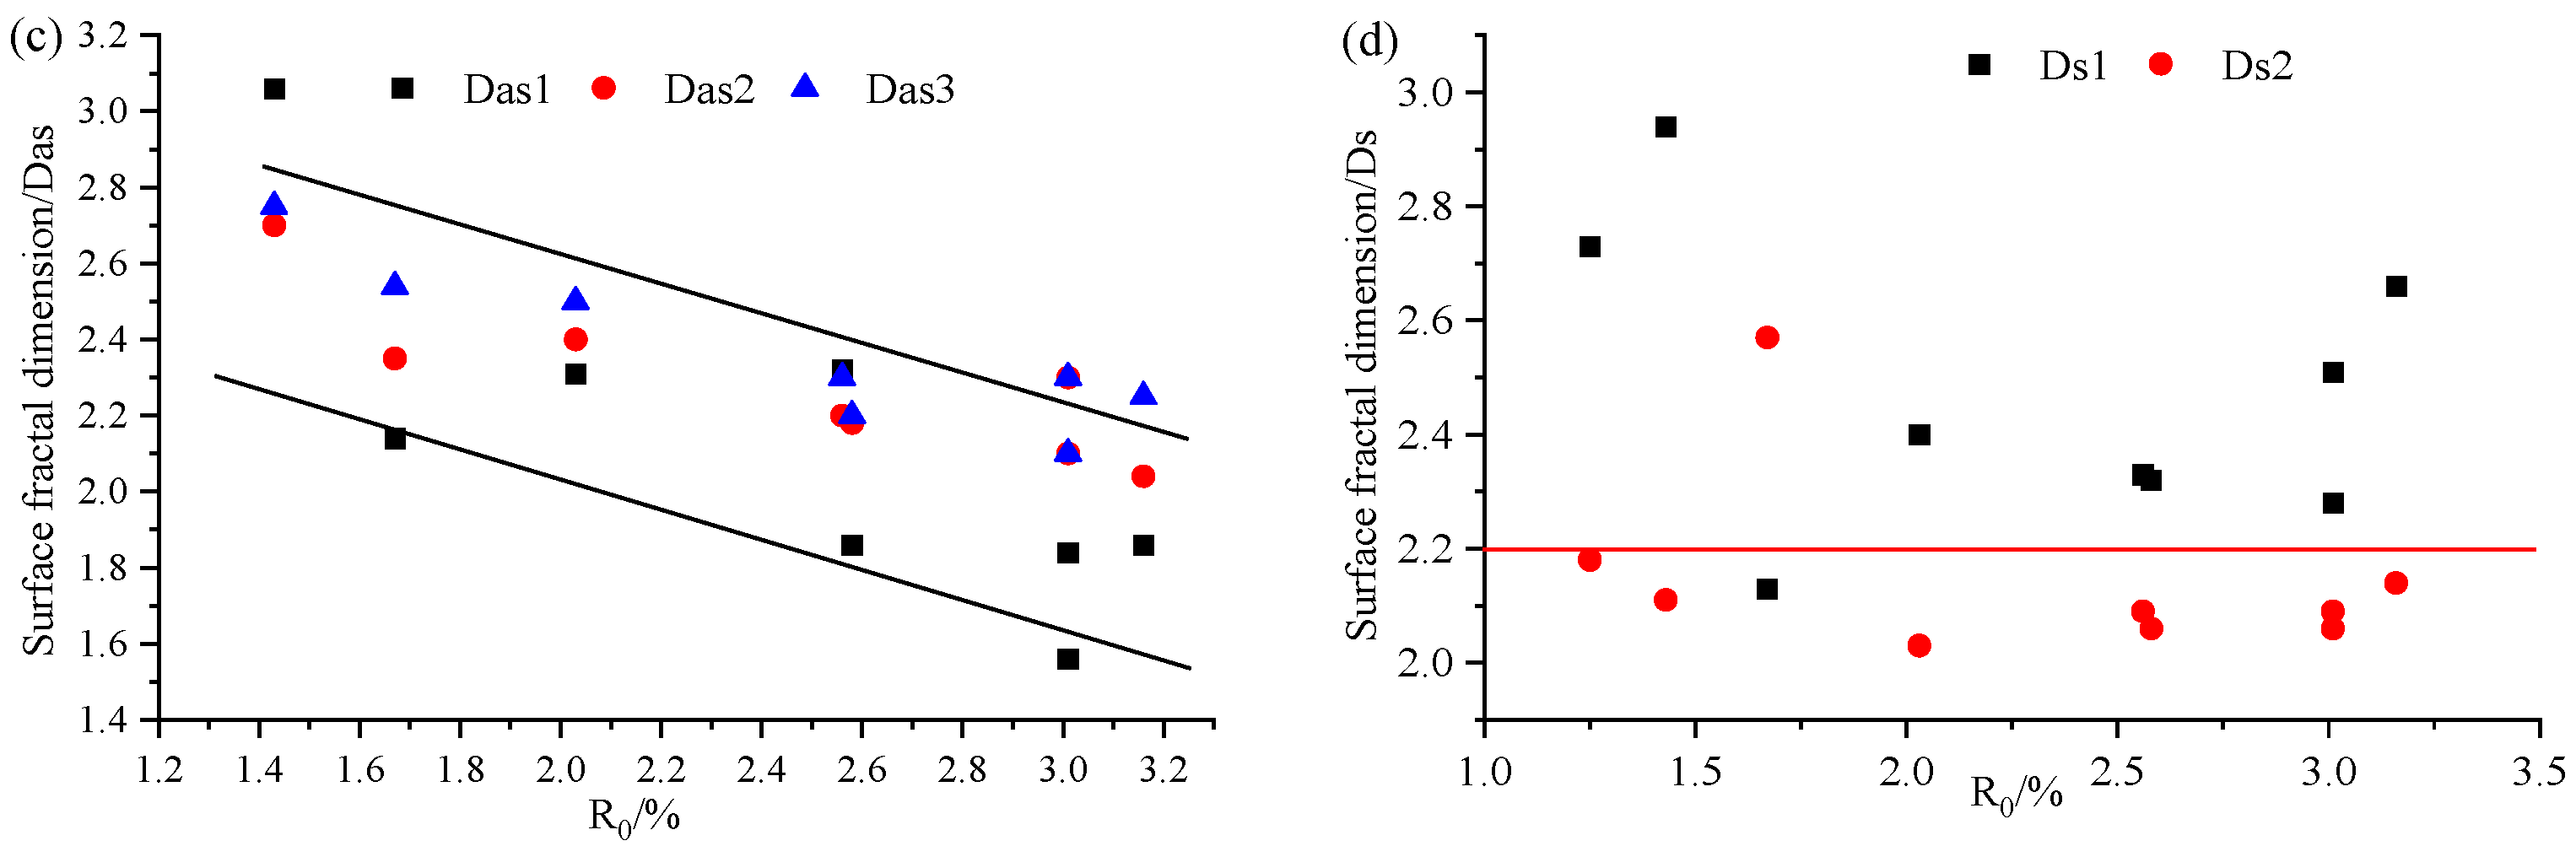
3.4.1. Fractal Dimension by Using LPN2 GA Data

The FHH fractal model results indicate that the fractal characteristics are clearly divided into two stages with P/P0 = 0.5 as the boundary, namely Dv1 (P/P0 < 0.5, 2~4 nm), Dv2 (0.5 < P/P0 < 1, 4~100 nm) (Figure 6), indicating that there are different gas adsorption mechanisms within the two pore sizes. This result is consistent with the research of Zhu et al. (2016) and others [27].
The above literature shows that D v 1 can characterize the pore structure morphology, while D v 2 can characterize the coal pore surface morphology [23,28,29]. Figure 6 shows that fractal curves could be divided into two parts; that is, the pore diameter is smaller than 4 nm when the relative pressure is smaller than 0.5, and the pore diameter is larger than 4 nm when the relative pressure is larger than 0.5. Therefore, pore volumes of (2–4 nm) (4–100 nm) were studied, and the results show that the linear relationship between the specific surface area percentage of 2~4 nm and D v 2 is significantly better than that of 2~10 nm pores (Table 3).
Based on Equation (3), the pore surface characteristics of LPN2 GA test data were studied. The boundary between lnS and lnr in the figure is roughly represented by ln(r) = (1.41–1.50) and (1.96–2.23), showing a clear three-stage structure. According to the average boundary value, it can be roughly divided into D s 1 (2 < r < 4 nm)\ D s 2 (4 nm < r < 10 nm)\ D s 3 (10 nm < r < 100 nm), indicating that the fractal characteristics of PDT relative to the volume in the adsorption pores are more obvious, and the SSA fractal law of the pores is more pronounced (Figure 7).
The overall fractal characteristics of the surface during this stage are as follows: (1) As the pore size of the same sample increases, the pore surface characteristics tend to become simpler. It is worth noting that the fractal characteristics of pores with d = 2 < r < 4 nm are significantly different from those with d = r > 4 nm. On the one hand, it is analyzed that the percentage of total surface area occupied by pores in this stage is relatively high, resulting in a relatively rough surface morphology of pores in this stage. On the other hand, as mentioned earlier, the relative pressure (P/P0 = 0.5) in LPN2 GA exhibits significantly different adsorption mechanisms, corresponding to a point pore size of d = 4 nm. It is worth noting that due to the fractal dimension Ds = 2 + C or Ds = (C − 3)/3, D s 1 cannot be directly compared in complexity with D s 2 / D s 3 using fractal dimensions. Therefore, this section focuses on discussing D s 2 (4 nm < r < 10 nm), D s 3 (10 nm < r < 100 nm) (Figure 8).

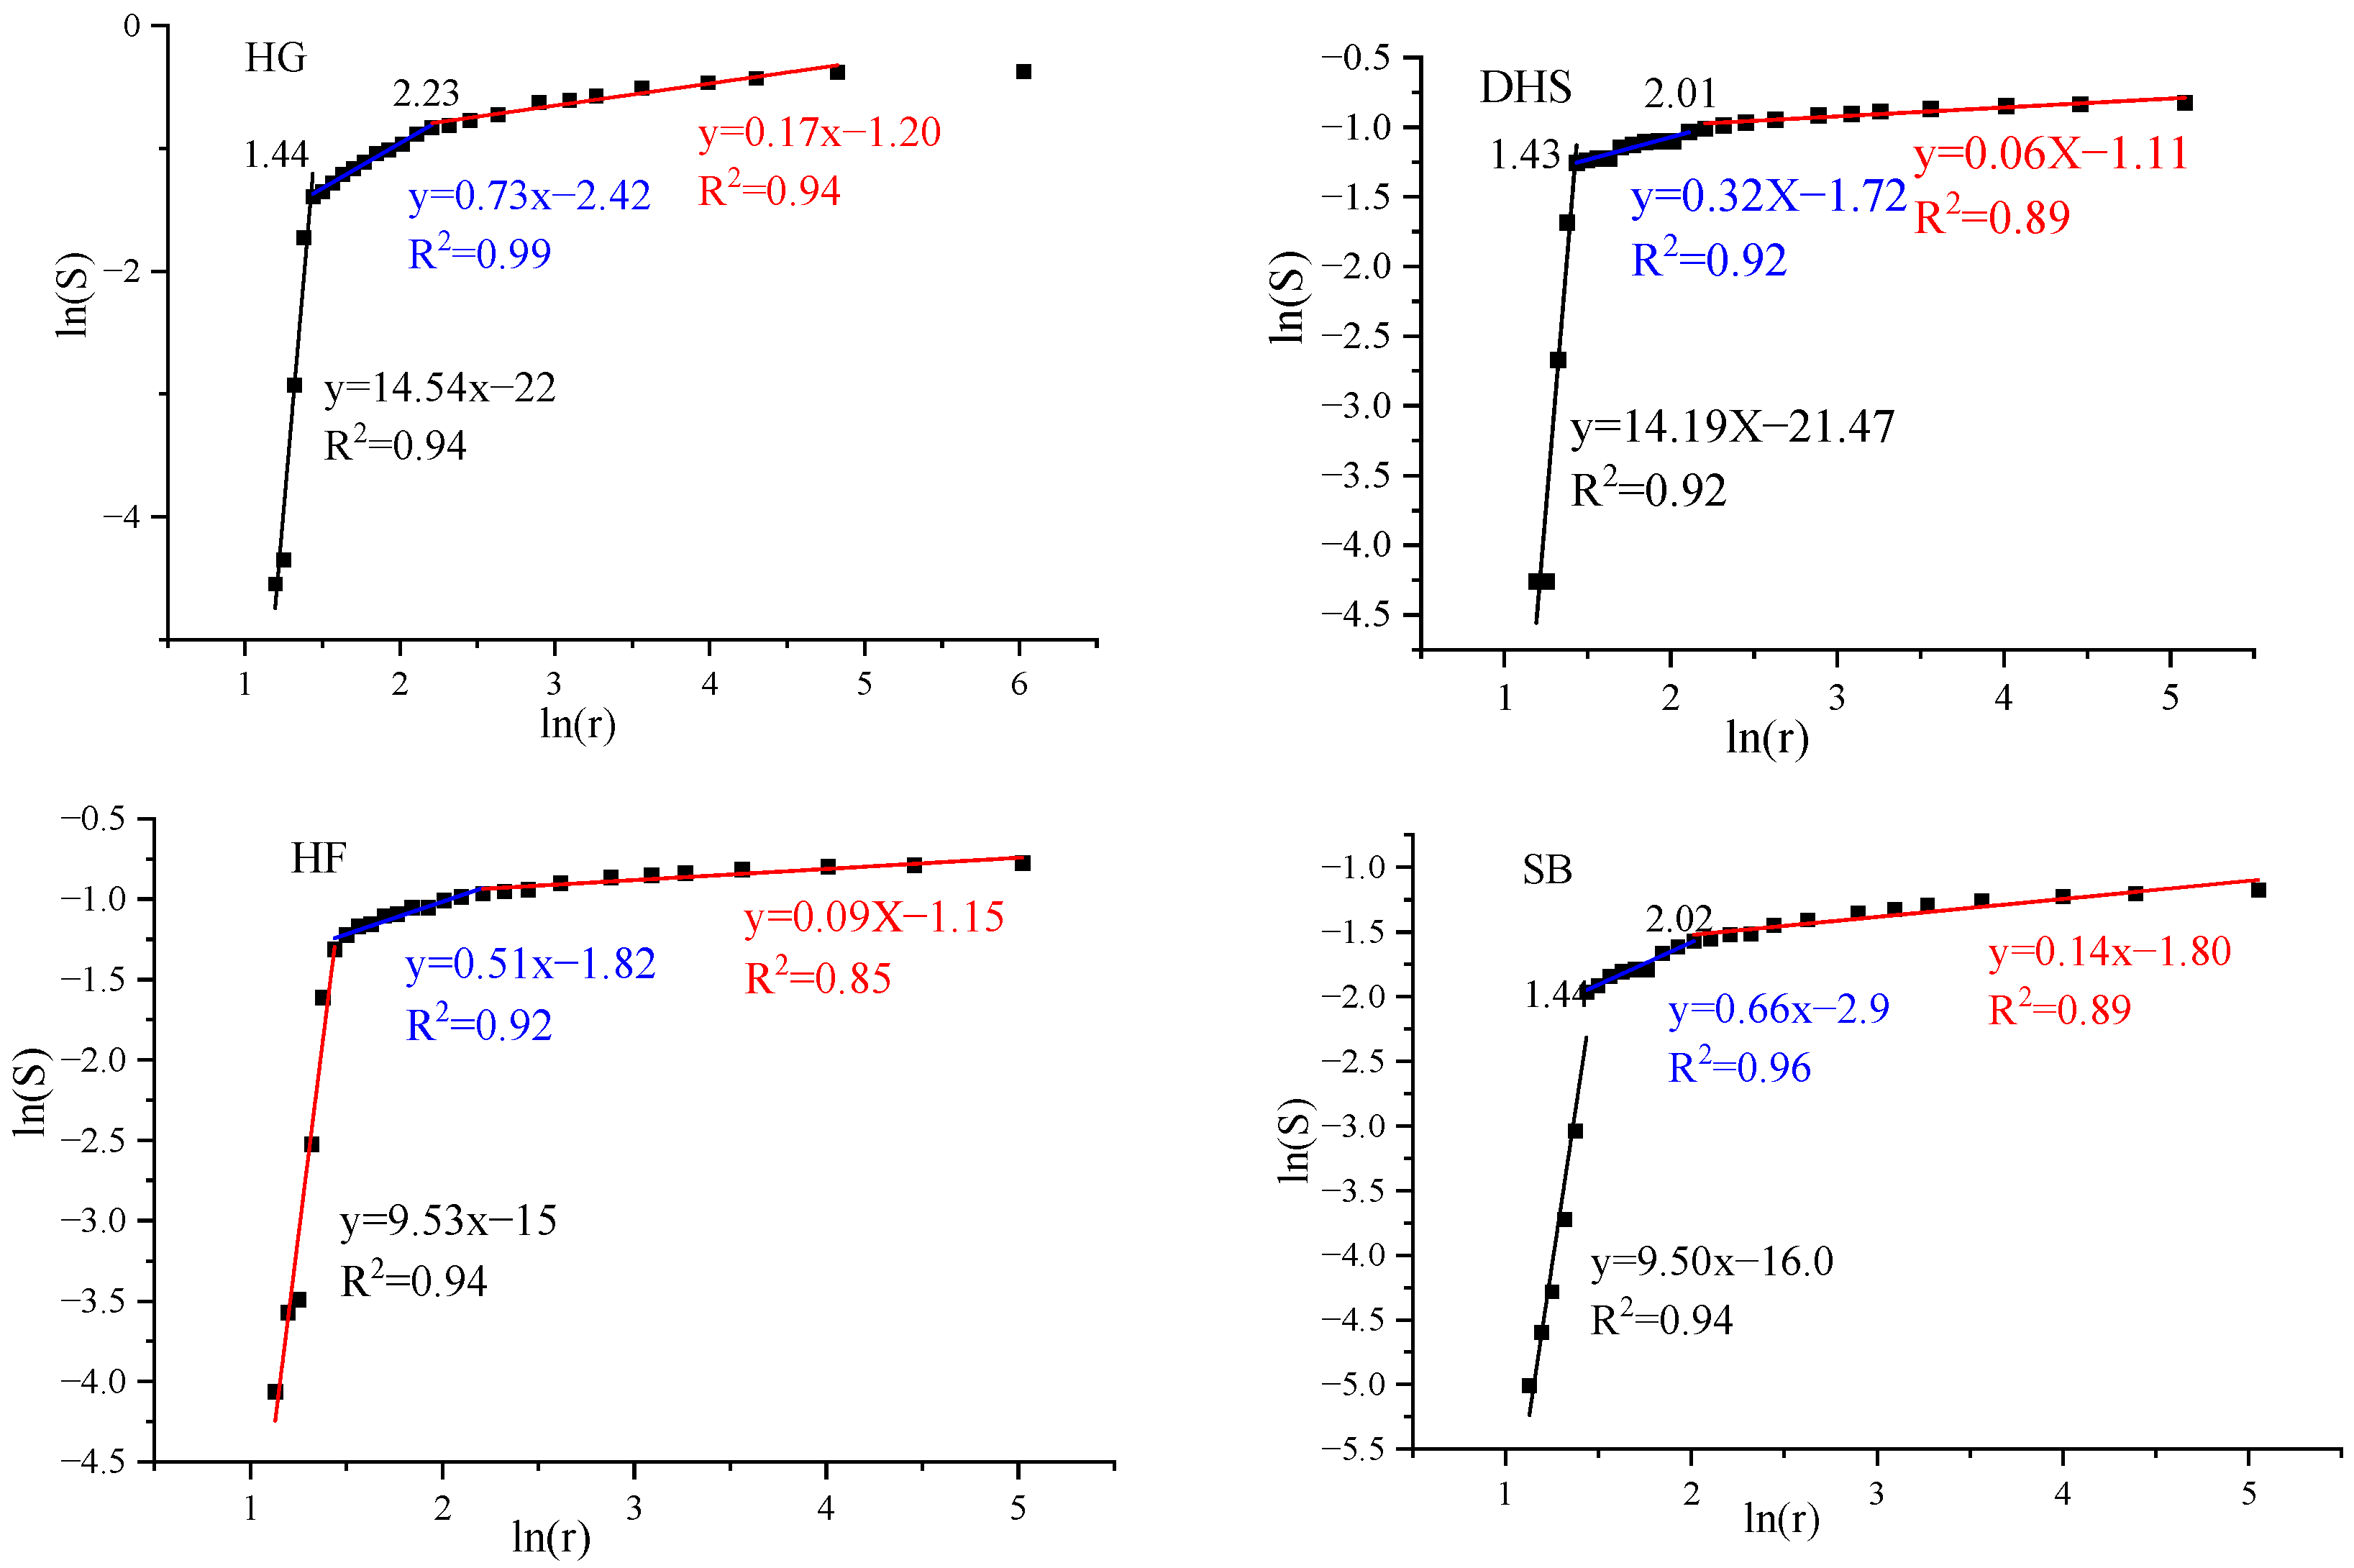
3.4.2. Fractal Dimension by Using LPCO2 GA Data

For the fractal description of the micropore volume characteristics, in the figure, there is a good linear relationship between lnV and ln(PPt) roughly bounded by ln(PPt) = −4.5, that is, D a v 1 (r < 0.8 nm) and D a v 2 (0.8 nm < r < 2 nm), indicating that the TDC of micropores has good Sierpinski fractal features. D a v 1 < D a v 2 show that the volume complexity of 0.8 nm < r < 2 nm pores is stronger than that of r < 0.82 nm pores (Figure 9). In the middle and high coal steps ( D a v 1 , D a v 2 ) are (1.64~1.68, 2.10~2.23) and (1.50~1.77, 2.20~2.47), respectively. D a v 1 tends to be stable within the same coal scale range, and the differences in different coal grades are more obvious, while D a v 2 is manifested as the gradual increase in the degree of coal deterioration with the trend of increasing height. It shows that the volume homogeneity of the micropores of (0.8 nm < r < 2 nm) is more sensitive to the degree of coal deterioration than that of the micropores of (r < 0.8 nm).
Based on Equation (3), surface area features of micropores are described. The surface integral curve is obviously expressed as three different fractal features with ln(r) = −0.45/−0.2 as the boundary, which correspond to the radius pores of d = 0.62 nm/0.82 nm, respectively. This result corresponds to the double peaks in Figure 10. With respect to consistency, it shows that there is a significant difference in the surface homogeneity of the pore area of 0.40~0.62 nm, 0.62~0.82 nm, and 0.82~2.0 nm in the microporous range. The combined diagram also further verifies that the surface area heterogeneity in the micropore range is obviously stronger than the volume heterogeneity. In addition, 0.40~0.62 nm, 0.62~0.82 nm, and 0.82~2.0 nm micropore ratio surface integral shape dimensions are expressed by D a s 1 \ D a s 2 \ D a s 3 , respectively. The range of D a s 1 in medium- and high-order samples is 0.50~1.06, and it shows a trend of gradual decrease with the increase in the degree of deterioration, indicating that the heterogeneity of the micropore surface of 0.40 nm < d < 0.62 nm is weak and the pore complexity tends to decrease with the increase of the pore surface area (Figure 10). The measured samples D a s 2 \ D a s 3 are 2.04~2.70 and 2.10~2.75, respectively, indicating that the 0.62 nm~2 nm micropore edge has a complex 2D surface [14]. The pores within this aperture range show two characteristics: the same sample D a s 1 < D a s 2 D a s 3 , indicating that in the same structural environment, the surface heterogeneity of the same coal order 0.62 nm~0.82 nm micropore is weaker than the 0.82~2.0 nm micropore pores, and the homogeneity of the micropore surface tends to stabilize with the decrease of the pore diameter; the surface fractal dimension D a s 1 D a s 2 D a s 3 with the increase in the degree of coal deterioration, the overall trend of gradual decreases, and the high coal stage D a s 2 D a s 3 gradually tends to be consistent; that is, ln(s) and ln(r) gradually evolve from three-stage to two-stage with the increase in coal rank. It shows that the transformation effect of the coal scale on the surface heterogeneity gradually weakens with the reduction of the aperture, and to a certain extent, it also shows that there are completely different pore characteristics in the micropore range with a boundary of 0.62 nm.

3.5. Fractal Dimension Analysis

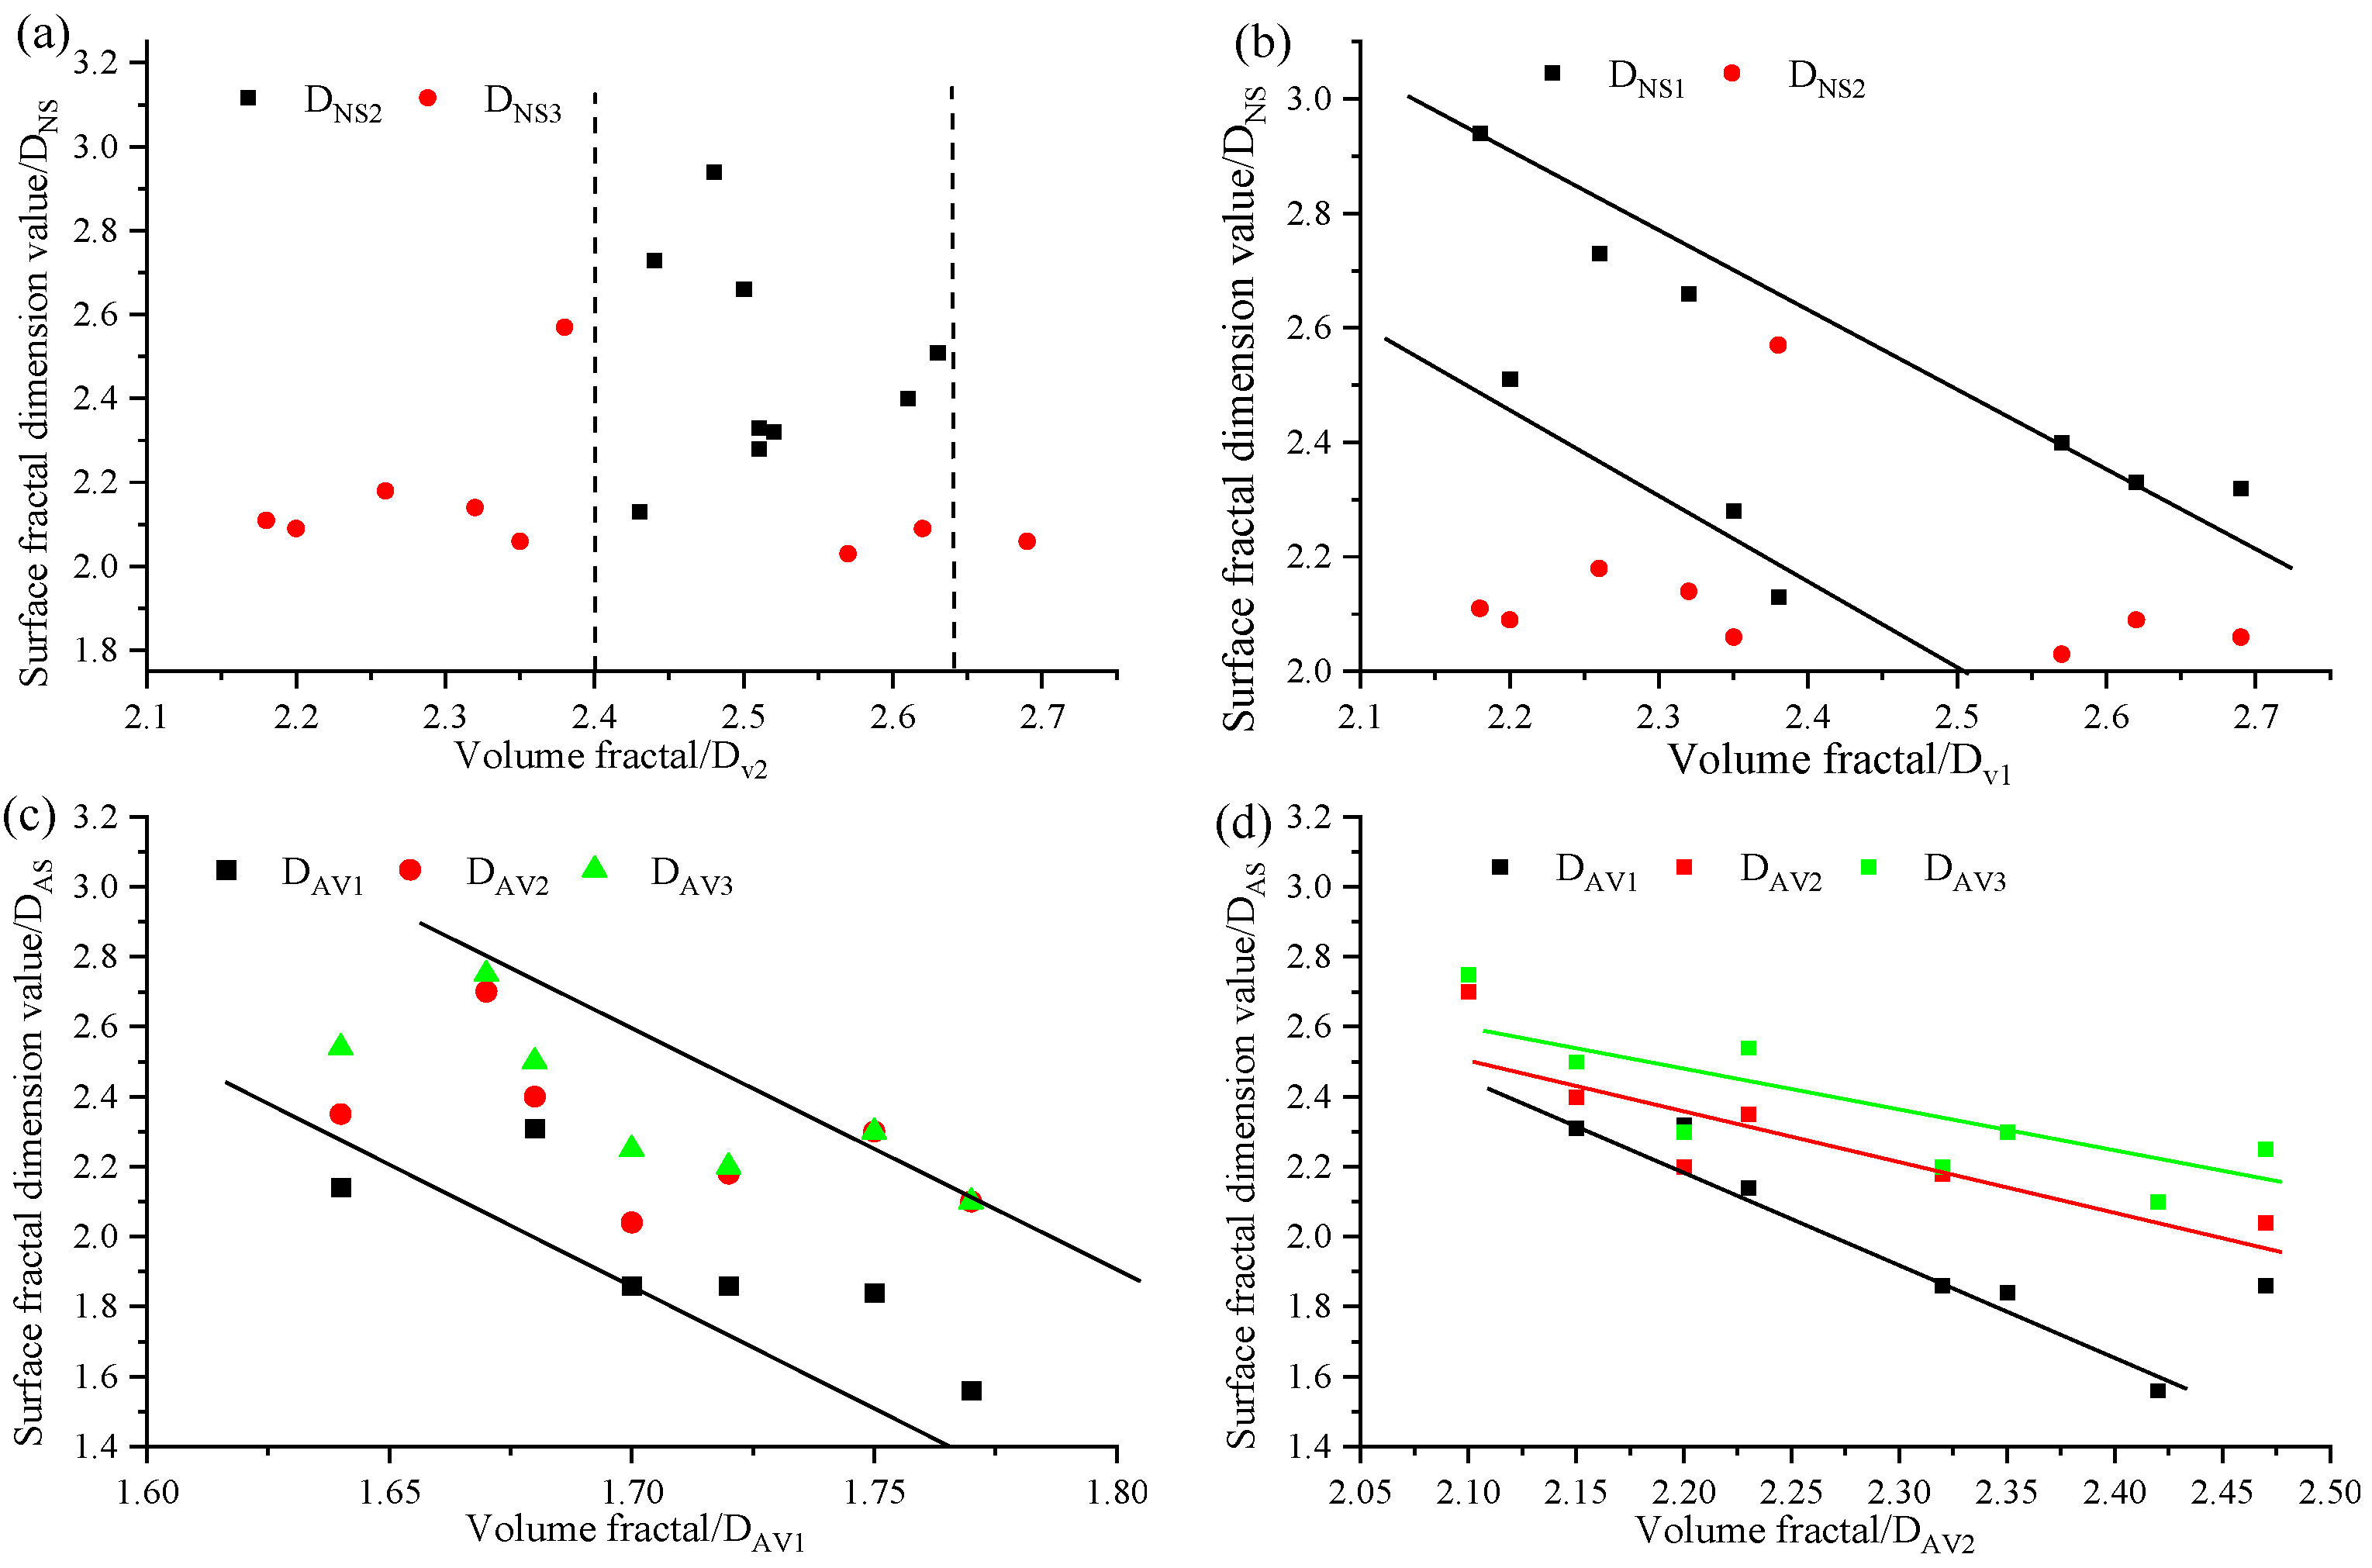
3.5.1. Relationships Between Volume Fractal and Surface Fractal Dimensions

The adsorption pore volume fractal can be divided into (2.0~4.0 nm) and (4.0~100 nm), and the adsorption pore surface fractal can be divided into (2 < r < 4 nm), (4 nm < r < 10 nm), and (10 nm < r < 100 nm). It is consistent with the conclusion that the surface complexity of the coal pore structure can be used to characterize the surface morphology of coal pores [23,28,29].
Based on Section 3.4.2, the micropore volume fractal is divided into (r < 0.8 nm) and (0.8 nm < r < 2 nm), and the adsorption pore surface fractal is divided into (0.40~0.62 nm), (0.62~0.82 nm), and (0.82~2.0 nm). Figure 11 shows that the volume/surface fractal correlation of the micropore stage is significantly better than that of other stages. There is a significant negative correlation between/and the surface fractal dimension of each micropore stage, and the regularity of 0.8 nm < d < 2 nm pore segment is the best. It shows that the complexity of micropores increases, and the heterogeneity of pore surface area decreases (Figure 11).

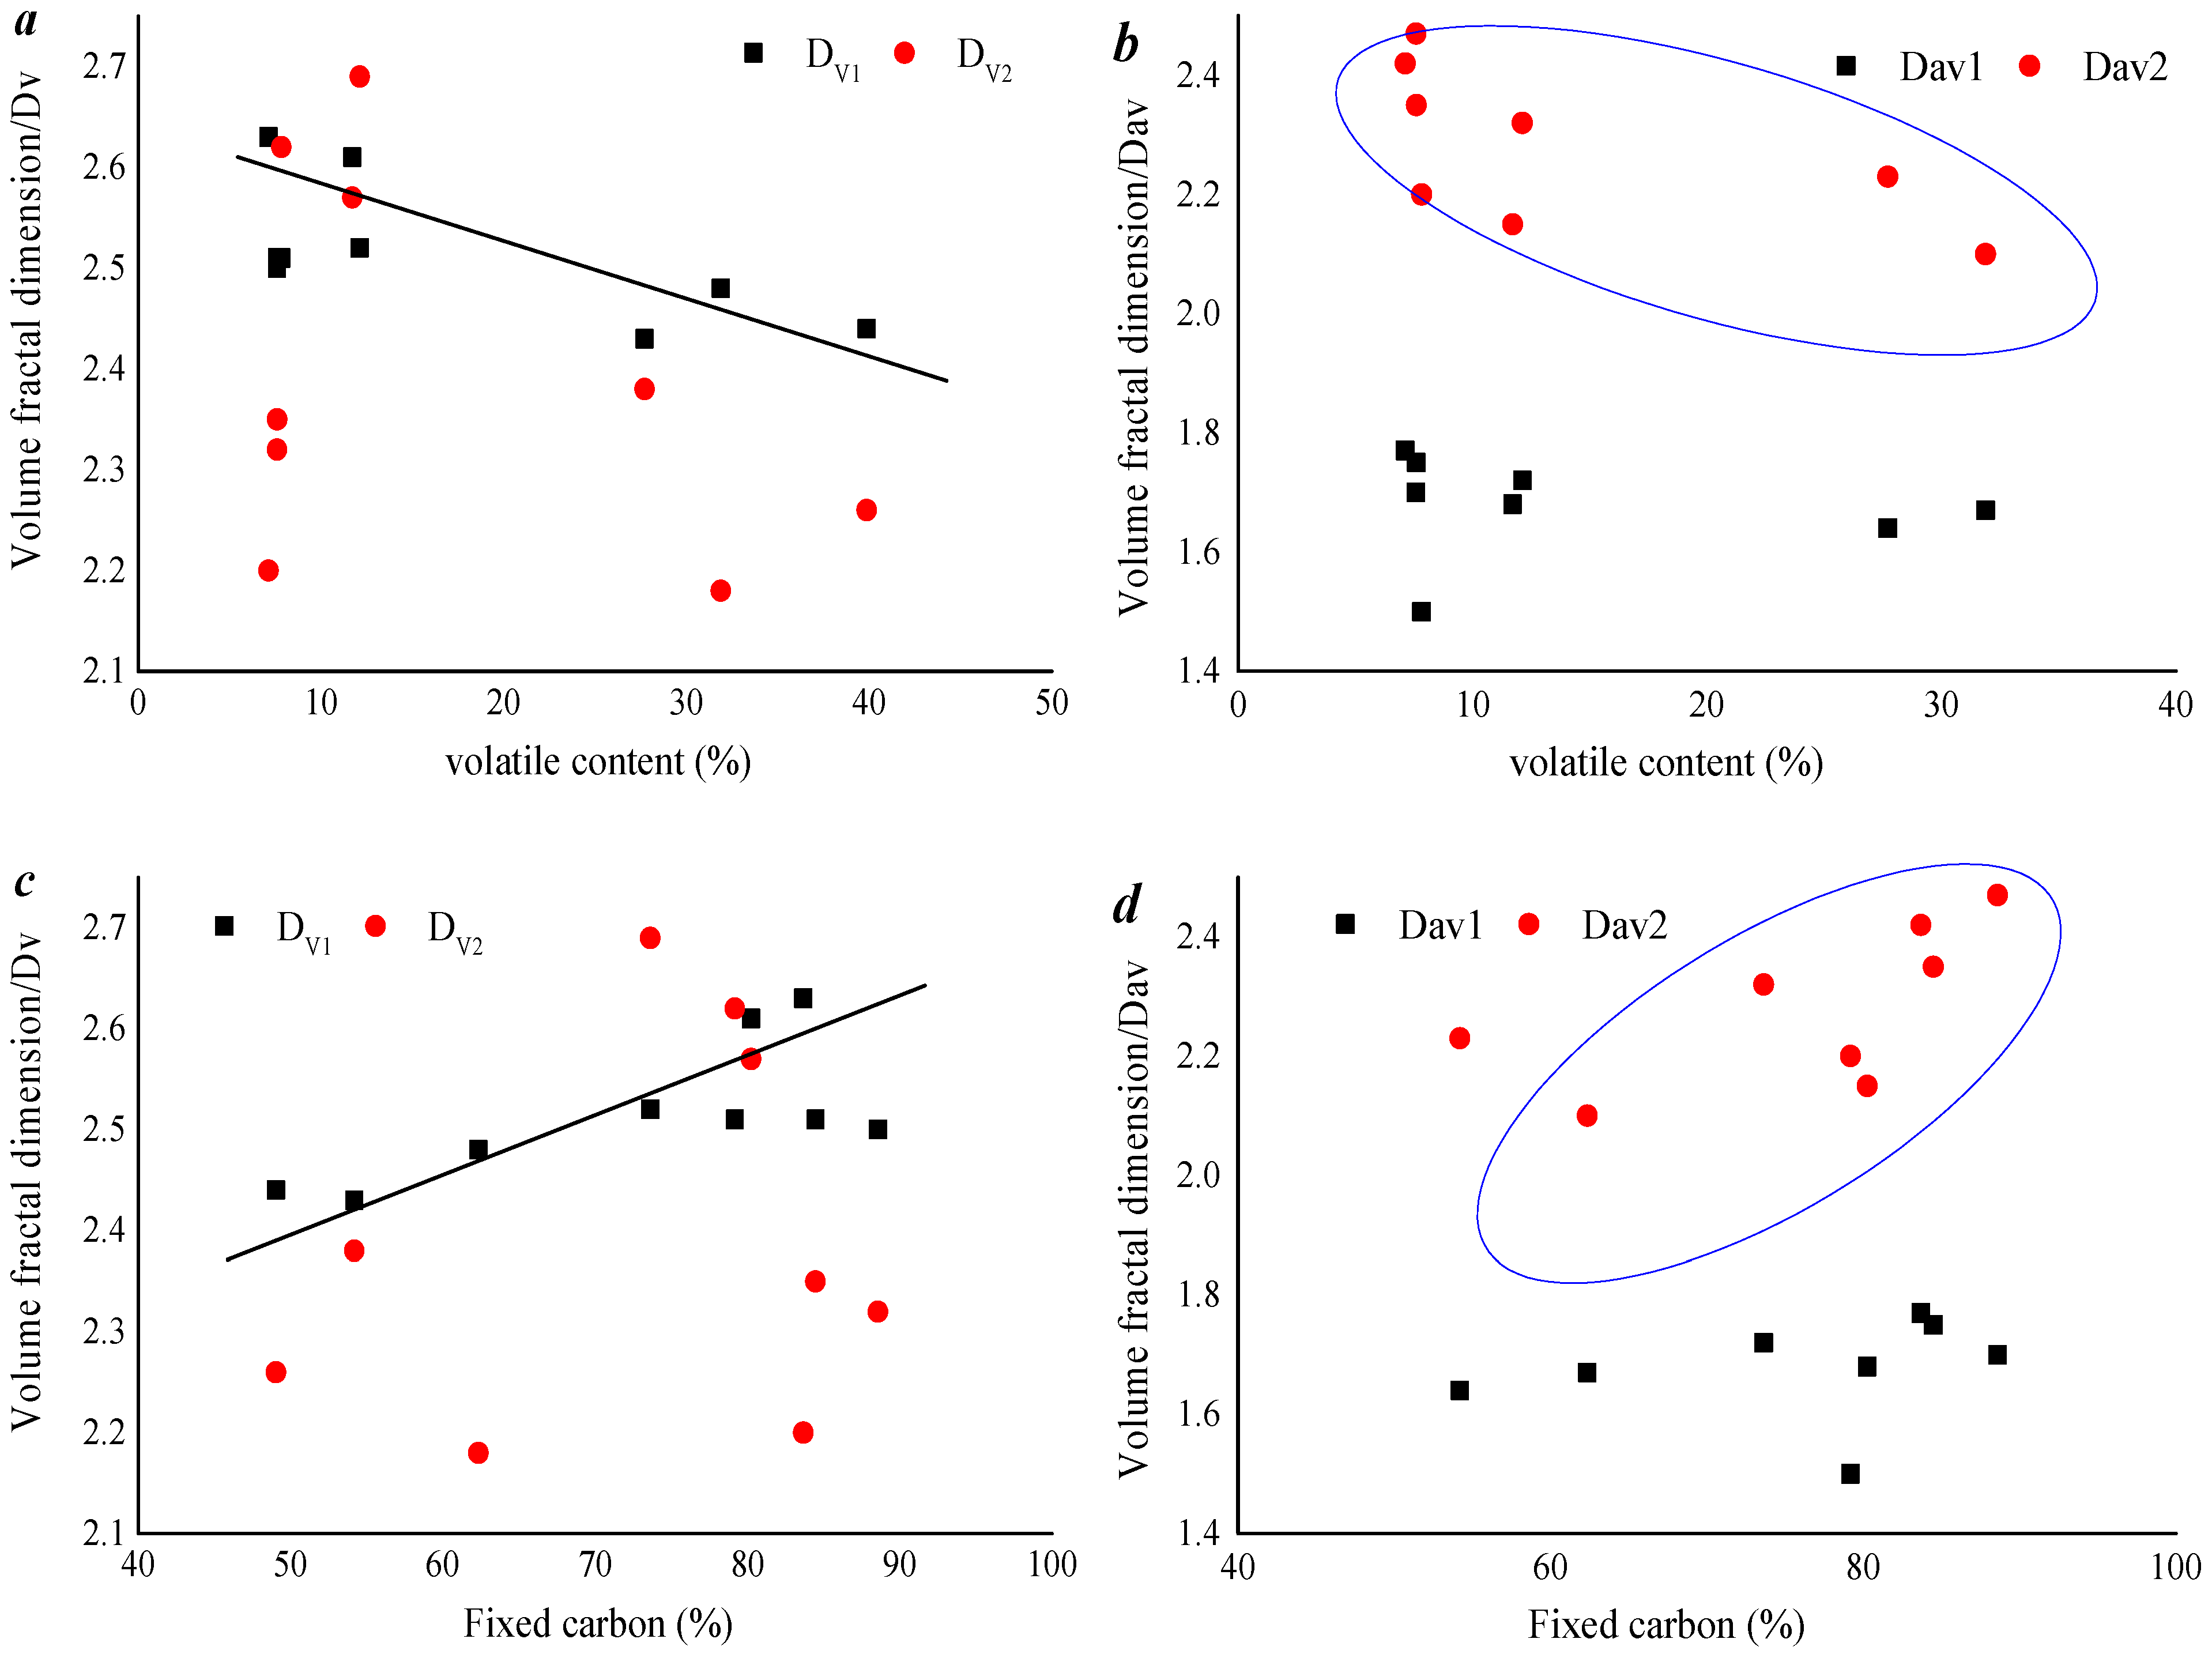
3.5.2. Effects of Coal Rank and Composition on Fractal Dimensions

Studies have shown that the fractal dimension of coal is affected by the degree of coal metamorphism and composition [29,30,31,32,33]. The figure shows that the correlation between the volume fractal and vitrinite reflectance of each sample is higher than that of the surface fractal, and the fractal characteristics of micropores in the pore range have the best correlation with vitrinite reflectance (Figure 12). The seepage pore volume fractal of medium and high rank coal samples in the study area shows a linear increase with the increase in coal rank, but the correlation between pore volume fractal and coal metamorphism tends to decrease with the decrease in pore size, which is mainly related to the gradual decrease of pore volume in the stage. With the gradual increase in coalification, many micropores are developed in the coal reservoir, and the specific surface area increases rapidly, so that the relationship between the heterogeneity of the micropore surface and the coal rank is much greater than that of the medium and large pores.
As mentioned above, D v 1 is mainly related to mesoporous TPV with an average pore size of 2~10 nm, and D a v 2 is characterized as the pore volume of 0.8~2 nm. Figure 13a,b show that the pore diameter distribution heterogeneity of 0.8~2 nm and 2~10 nm decreases, which indicates that higher volatile matter content leads to a gradual decrease in the heterogeneity of pore volume in this part of the pore size. Differing from the volatile matter content, higher fixed contents leads to a gradual increase in the heterogeneity of pore volume in this part of the pore size (Figure 13c,d). The precipitation of volatile matter is an important step in the pyrolysis or coking process of coal. The release of volatile matter is accompanied by the release of gases, and the channels or cavities formed by these gases in the coal matrix will eventually become pores. Therefore, the precipitation of volatile matter is one of the key factors in pore formation. The amount of volatile matter released is related to factors such as the degree of coal metamorphism and heating conditions. Under appropriate heating conditions, the sufficient analysis of volatile matter is beneficial for the formation and development of pore structure. Research has shown that the volatile matter content in raw coal is positively correlated with the specific surface area and micropore specific surface area of porous carbon. This means that the higher the volatile matter content, the more developed the pore structure formed may be. The volatile matter content has the greatest impact on the specific surface area and micropore specific surface area of porous carbon, which further confirms the importance of volatile matter in the formation of pore structure.
To study the effect of coal rock composition on fractal characteristics under different coal ranks, SPSS software (2022). was used to study the correlation between coal rock parameters and fractal characteristics [34]. The correlation between fractal characteristics of adsorption pores and coal rock parameters is poor, indicating that the influencing factors of fractal characteristics tend to be complicated with the decrease in pore scale.
Above all, the results show that surface complexity of coal pore structure can be used to characterize the surface morphology of coal pores, and fractal characteristics are clearly divided into two stages with P/P0 = 0.5 as the boundary, namely Dv1 (P/P0 < 0.5, 2~4 nm), Dv2 (0.5 < P/P0 < 1, 4~10 nm) (Figure 13), indicating that there are different gas adsorption mechanisms within the two pore sizes. This result is consistent with the research of Zhu et al. (2016) and others [27].

4. Conclusions

In this paper, LP N2 GA and LTCO2 GA tests were used to study the pore structure of middle and high rank coal reservoirs in the study area. The fractal theory of volume and surface area is used to achieve a full-scale fractal study of adsorption pore (pore diameter is less than 100 nm) in the study area. The results are as follows:
(1)
Adsorption isotherms of the nine coal specimens exhibit a type IV with H3 type hysteresis loop by using the classification method proposed by IUPAC. Type A samples belong to the middle rank coal sample. The adsorption capacity of this type of sample is weak, but the good pore connectivity is conducive to the migration of bulk methane, which is beneficial for higher coalbed methane production capacity. The pore connectivity of this type of sample is stronger than that of types B and C.
(2)
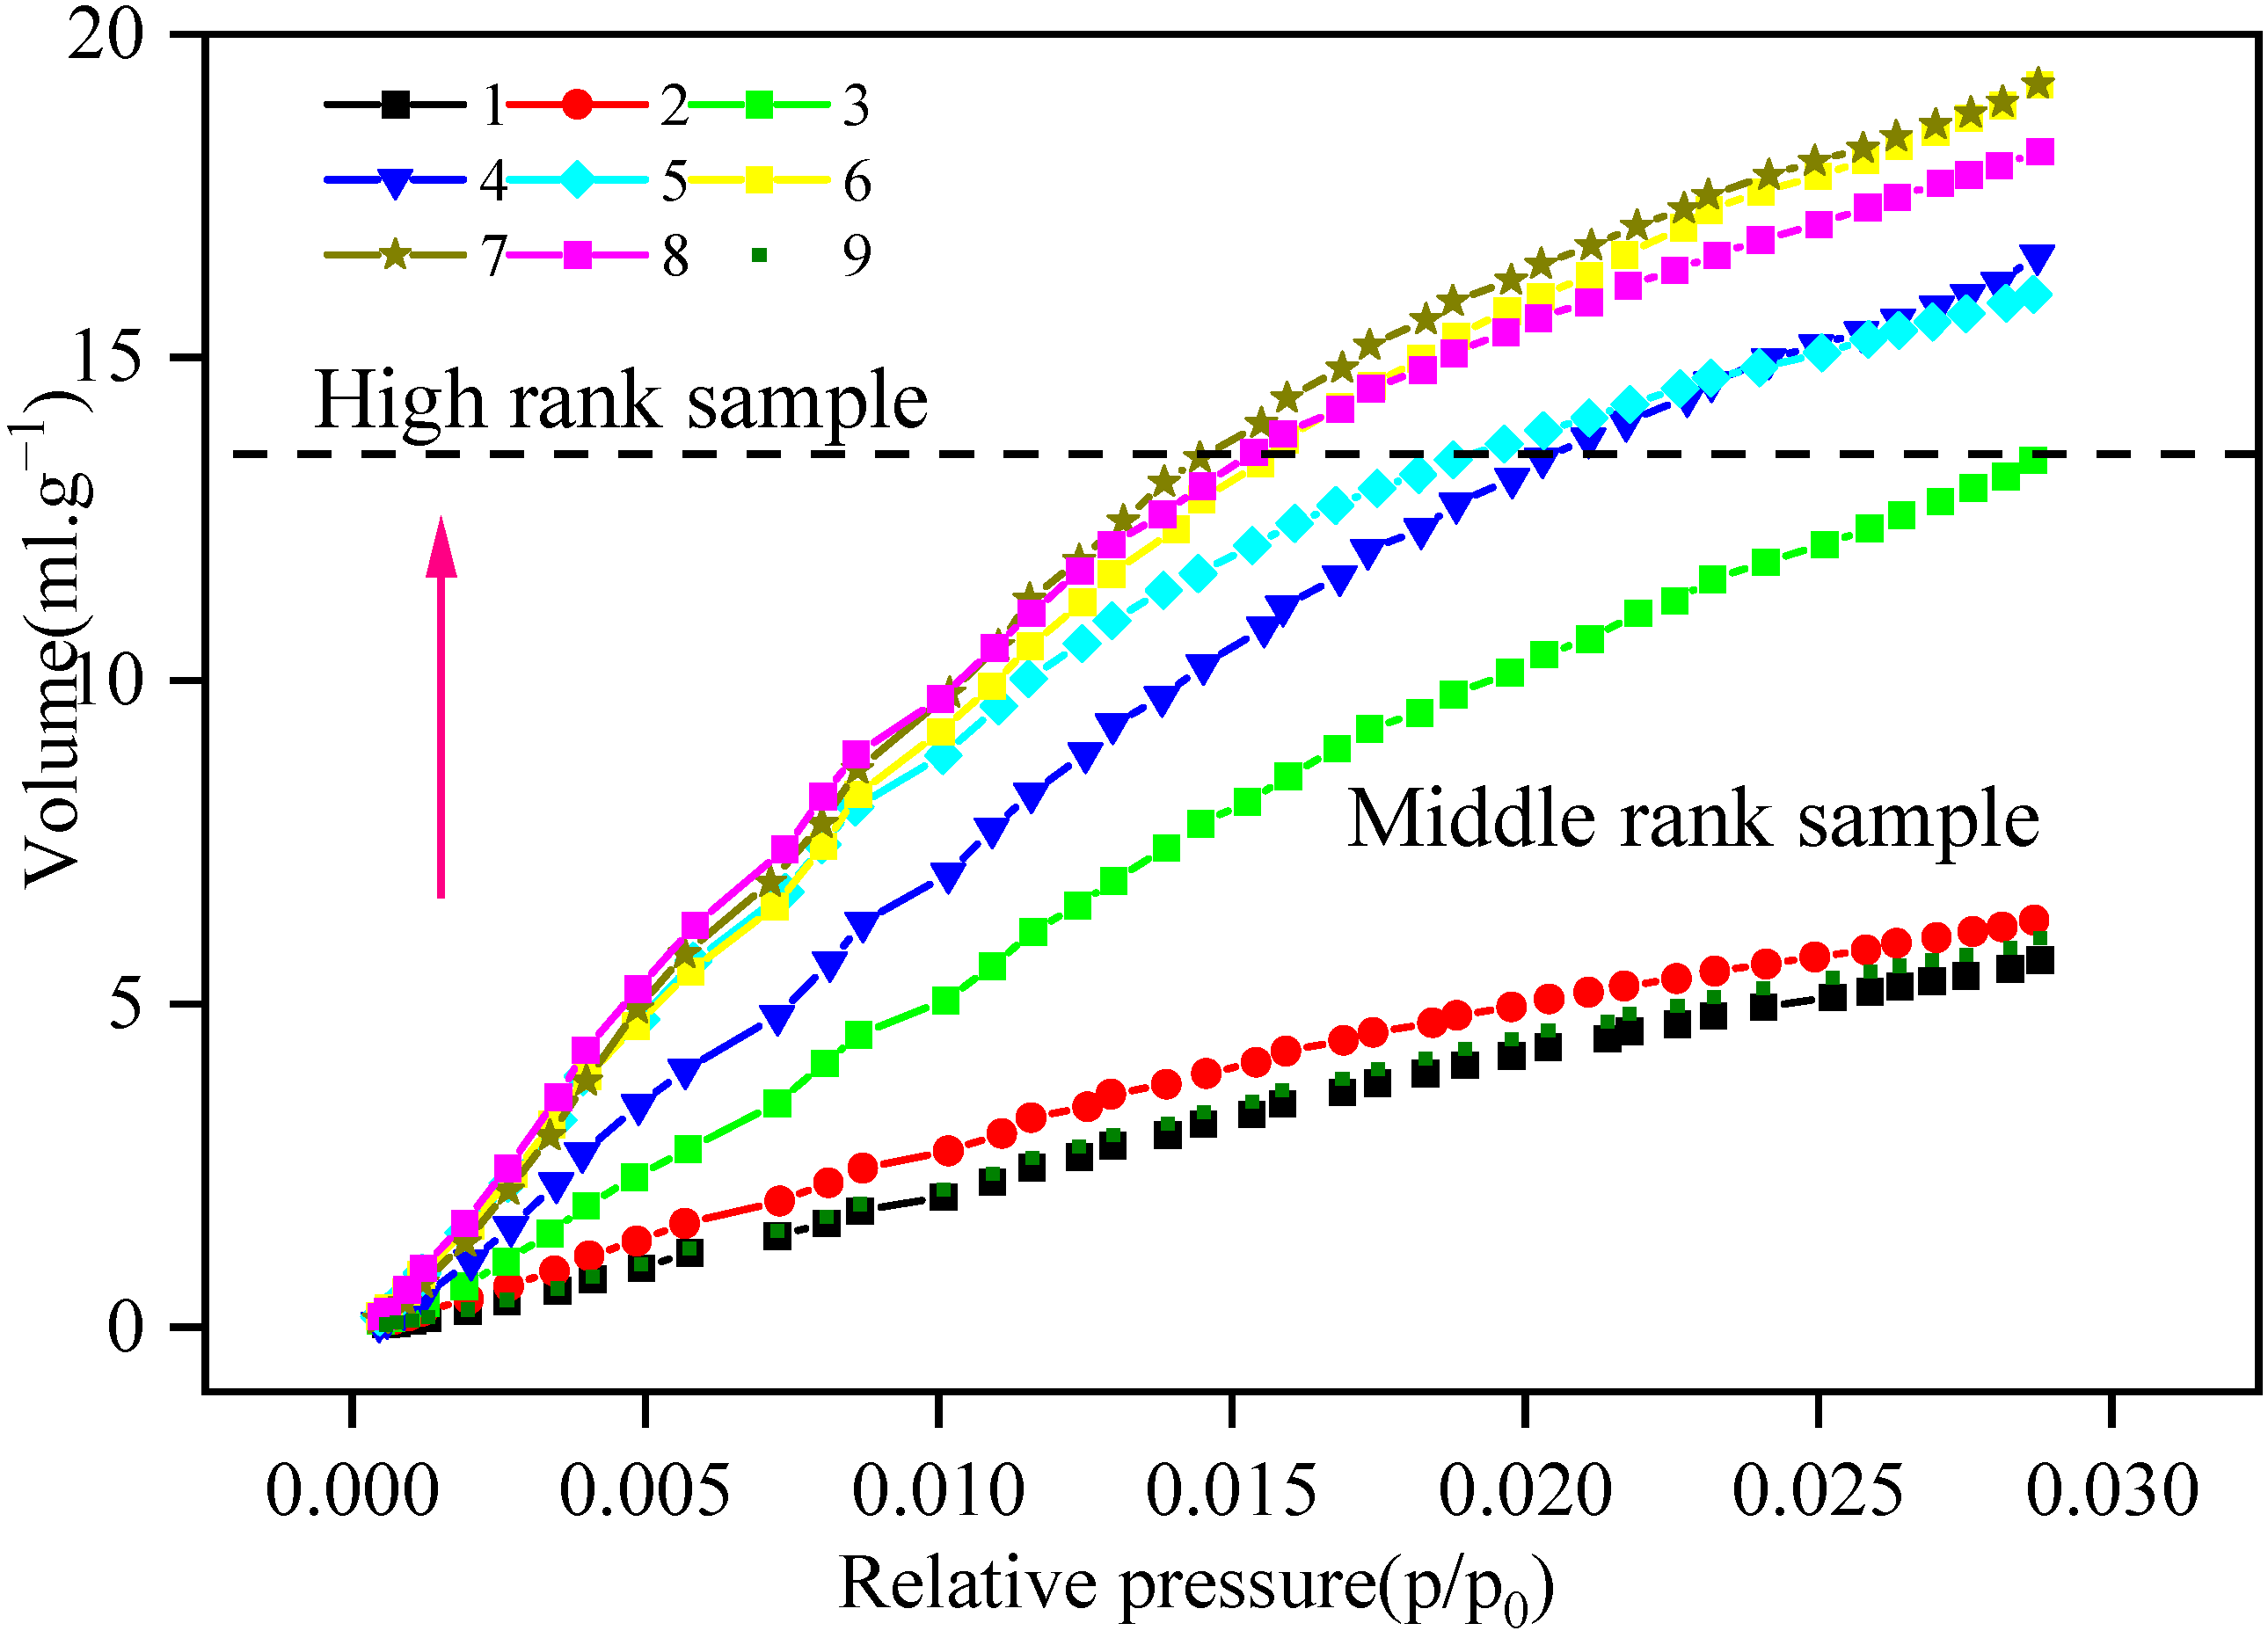
The adsorption capacity of high rank coal samples (13.67~18.75 mL g−1) is much larger than that of medium rank coal samples (5.67~6.29 mL g−1), and the curve shape gradually changes from nearly linear to concave with the increase in coal metamorphic degree.
(3)
The volume complexity of 0.8~2 nm pores is stronger than that of <0.82 nm pores. D a v 1 tends to be stable within the same coal scale range, and the differences in different coal grades are more obvious. Volume homogeneity of the micropores is more sensitive to the degree of coal deterioration than that of the micropores of (r < 0.8 nm).
(4)
There is a significant negative correlation between/and the surface fractal dimension of each micropore stage, and the regularity of 0.8 nm < d < 2 nm pore segment is the best. It shows that the complexity of micropores increases, and the heterogeneity of pore surface area decreases.

Author Contributions

Software, K.W.; Validation, F.Q., S.Z., Y.Z., H.S. and Z.Q.; Formal analysis, T.Y. All authors have read and agreed to the published version of the manuscript.

Funding

This research was funded by the National Natural Science Foundation of China, grant number 42402175 and Scientific Research Foundation for High-level Talents of Anhui University of Science and Technology, grant number 2023yjrc70.

Data Availability Statement

The original contributions presented in the study are included in the article, further inquiries can be directed to the corresponding author.

Conflicts of Interest

Wang Kai, Zhang Shizhao and Shi He were employed by PetroChina Coalbed Methane Company. The remaining author declares that the research was conducted in the absence of any commercial or financial relationships that could be construed as a potential conflict of interest.

References

  1. Quan, F.; Wei, C.; Li, R.; Hao, S.; Zhang, J.; Song, Y.; Yan, G. Reservoir damage in coalbed methane commingled drainage wells and its fatal impact on well recovery. Nat. Resour. Res. 2023, 32, 295–319. [Google Scholar] [CrossRef]
  2. Moosavi, N.; Bagheri, M.; Bidhendi, M. Fuzzy support vector regression for permeability estimation of petroleum reservoir using well logs. Acta Geophys. 2022, 70, 161–172. [Google Scholar] [CrossRef]
  3. Cai, Y.D.; Liu, D.M.; Pan, Z.J.; Yao, Y.B.; Li, J.Q.; Qiu, Y.K. Pore structure and its impact on CH4 adsorption capacity and flow capability of bituminous and subbituminous coals from Northeast China. Fuel 2013, 103, 258–268. [Google Scholar] [CrossRef]
  4. Liu, S.Q.; Sang, S.X.; Wang, G.; Ma, J.S.; Wang, X.; Wang, W.F.; Du, Y.; Wang, T. FIB-SEM and X-ray CT characterization of interconnected pores in high-rank coal formed from regional metamorphism. J. Pet. Sci. Eng. 2017, 148, 21–31. [Google Scholar] [CrossRef]
  5. Mehrabi, A.; Bagheri, M.; Bidhendi, M.N.; Delijani, E.B.; Behnoud, M. Improved porosity estimation in complex carbonate reservoirs using hybrid CRNN deep learning model. Earth Sci. Inform. 2024, 17, 4773–4790. [Google Scholar] [CrossRef]
  6. Zhou, Z.; Bouwman, W.G.; Schut, H.; Desert, S.; Jestin, J.; Hartmann, S.; Pappas, C. From nanopores to macropores: Fractal morphology of graphite. Carbon 2016, 96, 541–547. [Google Scholar] [CrossRef]
  7. Zhou, S.; Liu, D.; Cai, Y.; Yao, Y.; Che, Y.; Liu, Z. Multi-scale fractal characterizations of lignite, subbituminous and high-volatile bituminous coals pores by mercury intrusion porosimetry. J. Nat. Gas. Sci. Eng. 2017, 44, 338–350. [Google Scholar] [CrossRef]
  8. Bagheri, M.; Rezaei, M. Reservoir rock permeability prediction using SVR based on radial basis function kernel. Carbonates Evaporites 2019, 34, 699–707. [Google Scholar] [CrossRef]
  9. Zhang, J.; Xu, A.; Zhao, C.; Wang, W.; Jiang, Y.; Vandeginste, V.; Xue, Z.; Guo, Y.; Miao, H. A new parameter for characterizing pore-fracture structure heterogeneity: Fractal dimension based on the mercury extrusion curve. Front. Earth Sci. 2024. [Google Scholar] [CrossRef]
  10. Yao, Y.; Liu, D.; Tang, D.; Tang, S.; Huang, W. Fractal characterization of adsorption-pores of coals from North China: An investigation on CH4 adsorption capacity of coals. Int. J. Coal Geol. 2008, 73, 27–42. [Google Scholar] [CrossRef]
  11. Liu, W.; Yin, L.; Yang, Y.; Hu, J.; Zhou, S.; Tang, L. Study on the method of determining the lower limit of deep gas porosity in Qibei by porosity distribution trend curve. Logging Technol. 2015, 39, 68–71, 82. [Google Scholar]
  12. Zhao, J.; Xu, H.; Tang, D.; Mathews, J.P.; Li, S.; Tao, S. A comparative evaluation of coal specific surface area by CO2 and N2 adsorption and its influence on CH4 adsorption capacity at different pore sizes. Fuel 2016, 183, 420–431. [Google Scholar] [CrossRef]
  13. Li, Y.; Zhang, C.; Tang, D.; Gan, Q.; Niu, X.; Wang, K.; Shen, R. Coal pore size distributions controlled by the coalification process: An experimental study of coals from the Junggar, Ordos and Qinshui basins in China. Fuel 2017, 206, 352–363. [Google Scholar] [CrossRef]
  14. Song, S. FLAC 3D-based simulation of the influence of faults in Jianyanhe Coal Mine in Songyi Mining Area on surface subsidence in golf. Miner. Explor. 2025, 1–6. [Google Scholar]
  15. Shen, Y.; Qin, Y.; Guo, Y.; Yi, T.; Yuan, X.; Shao, Y. Characteristics and sedimentary control of a coalbed methane-bearing system in lopingian (late permian) coal-bearing strata of western Guizhou Province. J. Nat. Gas Sci. Eng. 2016, 33, 8–17. [Google Scholar] [CrossRef]
  16. GB/T 19222-2003; Method for Taking Coal Rock Samples. Standards Press of China: Beijing, China, 2003.
  17. GB/T 18023-2000; Classification of Macrolithotype for Bituminouscoal. State Bureau of Quality and Technical Supervision: Beijing, China, 2000.
  18. GB/T 6948-1998; Microscopical Determination of the Reflectance of Vitrinite in Coal. AQSIQ: Beijing, China, 1998.
  19. GB/T 212-2001; Proximate Analysis of Coal. Standards Press of China: Beijing, China, 2001.
  20. Zhang, Y.; Sun, L.; Zhang, T.; Cheng, B.; Li, Y.; Ma, H.; Lu, C.; Yang, C.; Guo, J.; Zhou, X. Study on sequence stratigraphy and coal-uranium occurrence regularity of coal-uranium rock series in the northeastern margin of Ordos Basin. Geology 2016, 90, 17. [Google Scholar]
  21. Washburn, E.W. The Dynamics of Capillary Flow. Phys. Rev. J. Arch. 1921, 17, 273–283. [Google Scholar] [CrossRef]
  22. Zhang, S.; Tang, S.; Tang, D.; Huang, W.; Pan, Z. Determining fractal dimensions of coal pores by FHH model: Problems and effects. J. Nat. Gas Sci. Eng. 2014, 21, 929–939. [Google Scholar] [CrossRef]
  23. Xu, H.; Tang, D.Z.; Liu, D.M.; Tang, S.H.; Yang, F.; Chen, X.Z.; He, W.; Deng, C.M. Study on coalbed methane accumulation characteristics and favorable areas in the Binchang area, southwestern Ordos Basin, China. Int. J. Coal Geol. 2012, 95, 1–11. [Google Scholar] [CrossRef]
  24. Zhao, J.L.; Xu, H.; Tang, D.Z.; Mathews, P.J.; Li, S.; Tao, S. Coal seam porosity and fracture heterogeneity of macrolithotypes in the Hancheng Block, eastern margin, Ordos Basin, China. Int. J. Coal Geol. 2016, 159, 18–29. [Google Scholar] [CrossRef]
  25. Gan, H.; Nandi, N.P.; Walker, P., Jr. Nature of the porosity in American coals. Fuel 1972, 51, 272–279. [Google Scholar] [CrossRef]
  26. Qu, T.; Wu, Z.S.; Shang, Q.C.; Li, Z.J.; Bai, L. Electromagnetic scattering by a uniaxial anisotropic sphere located in a stratified medium. J. Quant. Spectrosc. Radiat. Transf. 2015, 162, 103–113. [Google Scholar] [CrossRef]
  27. Zhu, H. Study on the Ultrastructure of Different Metamorphic Deformed Coal Based on AFM. Ph.D. Thesis, Henan Polytechnic University, Jiaozuo, China, 2014. [Google Scholar]
  28. Liu, Q.; Lu, Y.; Zhang, F. Qualitative analysis of micro-dissolution of limestone under temperature and hydrodynamic pressure. Geomechanics 2010, 31, 149–154. [Google Scholar] [CrossRef]
  29. Zhu, J.; Liu, J.-Z.; Yang, Y.-M.; Cheng, J.; Zhou, J.-H.; Cen, K.-F. Fractal characteristics of pore structures in 13 coal specimens: Relationship among fractal dimension, pore structure parameter, and slurry ability of coal. Fuel Process. Technol. 2016, 149, 256–267. [Google Scholar] [CrossRef]
  30. Liu, X.; Kong, X.; Nie, B.; Song, D.; He, X.; Wang, L. Pore fractal dimensions of bituminous coal reservoirs in north China and their impact on gas adsorption capacity. Nat. Resour. Res. 2021, 30, 4585–4596. [Google Scholar] [CrossRef]
  31. Yao, Y.; Liu, D.; Tang, D.; Tang, S.; Huang, W.; Liu, Z.; Che, Y. Fractal characterization of seepage-pores of coals from China: An investigation on permeability of coals. Comput. Geosci. 2009, 35, 1159–1166. [Google Scholar] [CrossRef]
  32. Sun, W.J.; Feng, Y.Y.; Jiang, C.F.; Chu, W. Fractal characterization and methane adsorption features of coal particles taken from shallow and deep coalmine layers. Fuel 2015, 155, 7–13. [Google Scholar] [CrossRef]
  33. Yao, P.; Zhang, J.; Lv, D.; Vandeginste, V.; Chang, X.; Zhang, X.; Wang, D.; Han, S.; Liu, Y. Effect of water occurrence in coal reservoirs on the production capacity of coalbed methane by using NMR simulation technology and production capacity simulation. Geoenergy Sci. Eng. 2024, 243, 213353. [Google Scholar] [CrossRef]
  34. SPSS Version 26.0; IBM Corporation: Armonk, NY, USA, 2019.
Figure 1. Hysteresis loop types and pore connectivity and shapes by using LP N2 GA tests.
Processes 13 00429 g001aProcesses 13 00429 g001b
Figure 2. Pore size distributions: (a,b) Incremented pore volume vs. APD of the different series samples, (c,d) Incremented specific surface area vs. APD of the different series.
Processes 13 00429 g002aProcesses 13 00429 g002b
Figure 3. Adsorption curves of CO2 adsorption for different rank samples.
Processes 13 00429 g003
Figure 4. Incremental pore volume plots of DFT-microporous for the middle and high coals. (a,b) Incremental pore volume plots of DFT-microporous for the middle coals, Incremental pore volume plots of DFT-microporous for the high coals.
Processes 13 00429 g004
Figure 5. Incremental surface areas plots of DFT-microporous for the middle and high coals. (a,b) Incremental surface areas plots of DFT-microporous for the middle coals, Incremental surface areas plots of DFT-microporous for the high coals.
Processes 13 00429 g005
Figure 6. Plots of ln V versus ln(ln(P0/P)) based on gas adsorption isotherms for the 9 coal specimens.
Processes 13 00429 g006
Figure 7. Surface fractal curve of the sample (HG/DHS/HF/SB) based on the LPN2 GA.
Processes 13 00429 g007
Figure 8. Plots of ln(S) versus ln(r) based on gas adsorption isotherms for the typical coal specimens.
Processes 13 00429 g008
Figure 9. Volume fractal curve of the micro-pores through Sierpinski model (a,b), the volume fractal dimension of Dav1 and Dav2 of all the samples (c).
Processes 13 00429 g009
Figure 10. Surface fractal curve of the micro-pores (a,b), the surface fractal dimension of Das1/Das2 and Das3 of all the samples (c).
Processes 13 00429 g010
Figure 11. The relationship between volume fractal and surface fractal of adsorption pores based on LPN2/CO2 GA (a): the relationship between volume fractal and surface fractal; (b): the relationship between volume fractal and surface fractal; (c): the relationship between volume fractal and surface fractal; (d): the relationship between volume fractal and surface fractal.
Processes 13 00429 g011
Figure 12. The relationship between vitrinite reflectance and each fractal dimension (a,b): the relationship between adsorption pore volume/surface area fractal and R0; (c,d): the relationship between micropore volume/surface area fractal and R0.
Processes 13 00429 g012aProcesses 13 00429 g012b
Figure 13. The relationship between volatile matter/fixed carbon and all the fractal dimensions. (a,b) The relationship between the volatile matter of sample Dv1, Dv2 and all fractal dimensions, The relationship between the volatile matter of sample Dav1, Dav2 and all fractal dimensions. (c,d) The relationship between the fixed carbon of sample Dv1, Dv2 and all fractal dimensions, The relationship between the fixed carbon of sample Dav1, Dav2 and all fractal dimensions.
Processes 13 00429 g013
Table 1. Pore structure parameters of all the samples.
TypeSampleBET SSA (m2/g)BJH
TPV
(.10−3 cm3/g)
BJH APD (nm)Percentage of SSA (%)Percentage of TPV (%)
2~4 nm4~10 nm10~100 nm2~4 nm4~10 nm10~100 nm
AHG0.343.84.422638365.39.785
SJS0.241.94.452140394.517.578
FZ0.231.95.3713.450.6362.2814.1283.6
BJZJ0.281.23.4240431714.320.465.3
SJD0.140.93.4143.538.51816.421.861.8
CDHS0.351.23.4242.441.61616.123.260.7
DS0.391.43.4241.746.31219.43050.6
HF0.271.13.4330.950.11910.123.166.8
SB0.081.23.4215.563.5213.7919.1177.1
SSA = specific surface area; TPV = total pore volume; APD = average pore diameter.
Table 2. Micro-pore parameters of primary- and TDCs.
SampleRankPore Volume (cm3/g)SSA (m2/g)Average Pore Width (nm)
DFTD–RD–ADFTD–RDFTD–RD–A
HGMiddle0.0190.0450.043651230.6451.231.32
SJS0.0210.0460.053571370.6271.281.53
FZ0.0240.0440.044661320.6271.201.46
JZJ0.0520.1040.1221403130.6271.2611.50
SJD0.0570.1460.0731644380.4581.281.38
DHSHigh0.0530.1190.0541653550.501.181.32
DS 0.0680.1380.0891974140.601.191.38
HF 0.0560.1670.0751825020.4581.251.36
SB 0.0600.1370.0621864110.5011.1891.32
Table 3. Fractal dimensions of the coal specimens.
GroupRankCoal SampleDv1Dv2
AMiddleHG2.262.44
SJS2.182.48
FZ2.382.43
JZJ2.572.61
BHighDHS2.692.52
HF2.202.63
CSJD2.512.62
DS2.352.51
SB2.502.51
Disclaimer/Publisher’s Note: The statements, opinions and data contained in all publications are solely those of the individual author(s) and contributor(s) and not of MDPI and/or the editor(s). MDPI and/or the editor(s) disclaim responsibility for any injury to people or property resulting from any ideas, methods, instructions or products referred to in the content.

