Article

The Application of Fourier Transform Infrared Spectroscopy and Chemometrics in Identifying Signatures for Sheep’s Milk Authentication

by
Robert Duliński
1,*,
Marek Gancarz
2,3,
Nataliya Shakhovska
4,5 and
Łukasz Byczyński
1
1
Department of Biotechnology and General Food Technology, Faculty of Food Technology, University of Agriculture in Krakow, Balicka Street 122, 30-149 Krakow, Poland
2
Faculty of Production and Power Engineering, University of Agriculture in Kraków, Balicka 116B, 30-149 Kraków, Poland
3
Center for Innovation and Research on Pro-Healthy and Safe Food, University of Agriculture in Kraków, Balicka 104, 30-149 Kraków, Poland
4
Department of Artificial Intelligence Systems, Lviv Polytechnic National University, 5 Kniazia Romana St., 79000 Lviv, Ukraine
5
Department of Applied Mathematics, Faculty of Environmental Engineering and Geodesy, University of Agriculture in Krakow, al. Mickiewicza 21, 31-120 Krakow, Poland
*
Author to whom correspondence should be addressed.
Processes 2025, 13(2), 518; https://doi.org/10.3390/pr13020518
Submission received: 9 January 2025 / Revised: 8 February 2025 / Accepted: 11 February 2025 / Published: 12 February 2025

Abstract

:
This study explores the application of Fourier transform infrared (FTIR) spectroscopy combined with chemometric and machine learning techniques for authenticating sheep’s milk and distinguishing it from cow’s milk. The demand for accurate authentication methods is driven by the high production costs of sheep’s milk and the prevalent issue of adulteration with cow’s milk, which can have economic, health, and ethical implications. Our research utilizes exploratory analysis, regression, and classification tasks on spectral data to identify characteristic spectral signatures and physicochemical parameters for sheep’s milk. Key methods included the application of decision trees, random forests, and k-nearest neighbors (KNN), with the random forest model showing the highest predictive accuracy (R2 of 0.9801). Principal Component Analysis (PCA) and analysis of variance (ANOVA) revealed significant spectral and compositional differences, particularly in fat content and wavelengths responsible for amide I and II bands (1454 nm and 1550 nm) correlated with the conformational characteristics of the proteins, with sheep’s milk exhibiting higher values than cow’s milk. These findings indicate the potential of FTIR spectroscopy as a reliable tool for milk authentication. Currently, digitalization within the milk production chain is limited, particularly in the case of regional dairy products. The introduction of integrated photonics, machine learning, and, in the future, telemetry systems would enable dairy farmers to optimize their operations and ensure the origin and quality of the milk supplied to milk producers.

1. Introduction

Cheese production, like bread baking, is one of the oldest biotechnological processes. The production technology of this segment of food products is constantly evolving due to increasing competition and consumer demand. Ongoing climate change, globalization, and rising consumer expectations have focused scientists’ attention on the issue of protecting the quality and authenticity of regional food products, including dairy [1]. In recent years, interest in products with enhanced health benefits has contributed to the rise in consumption of sheep’s and goat’s cheeses. Moreover, in many countries, including Greece, Portugal, and Turkey, cheeses such as feta, Manchego, and Roquefort are regional brands that are popular with consumers across many European countries [2]. In Poland, sheep’s cheeses also hold a recognized position in the dairy products segment.
However, sheep and goat milk production, which accounts for approximately 3.5% of the global total, is a much more expensive process due to the price and availability of the raw materials, as well as seasonal fluctuations in their acquisition [3]. In many cases, this leads to illegal practices where sheep’s milk is substituted with cow’s milk in the production of sheep’s and goat’s cheeses. These practices are undesirable not only from an economic point of view but also for medical reasons, due to the potential allergenic effects of some milk components, as well as for ethical, religious, and cultural reasons.
In recent years, basic analytical techniques such as spectroscopy, supported by machine learning and remote sensing methods, have gained popularity as tools for enabling precise crop monitoring, as well as for the identification and authentication of food products [3,4].
Spectroscopic techniques, including methods such as infrared (IR) spectroscopy, near-infrared (NIR) spectroscopy, Raman spectroscopy, and mass spectrometry (MS), are used to identify and quantify chemical components in food and plant samples [5,6,7].
Chemometrics is a field of chemistry that analyzes chemical data and extracts information from it (informative, classification, and prognostic) to interpret the so-called raw data from registered spectroscopic spectra [8,9].
More advanced machine learning algorithms, such as neural networks, support vector machines (SVMs), and decision tree-based algorithms, can be used to assist in the analysis and interpretation of spectroscopic data [9]. Initially, machine learning algorithms gained significant popularity in fields such as banking, insurance, and cybersecurity [10]. More recently, their applications have expanded to other areas, including the analysis of food authenticity and origin [9], where they can be used to identify products from specific geographical regions, such as wines, cheeses, or spirits [11,12,13], based on their unique spectroscopic features.
This research is part of a larger project focused on identifying cost-effective tools that could be used to test the authenticity of sheep’s milk and, in the future, dairy products made from this milk as the primary raw material. The authors hope that, even in its initial phase, the research can contribute to the automation of production and logistics processes, leading to increased efficiency, protection, and competitiveness of the local dairy industry and agriculture.

2. Materials and Methods

2.1. Research Material

The research material consisted of samples of cow’s milk—initially from 11,000 subjects, of which 2143 were selected for further processing—and sheep’s milk (from 467 subjects) sourced from local suppliers in the Małopolska region, specifically Podhale (Okręgowa Spółdzielnia Mleczarska (OSM) Nowy Sącz, Nowy Sącz, Poland). These samples were provided for research through collaboration with a local dairy cooperative; milk was collected from individual farms from September 2023 to September 2024 (cow’s milk) and from April 2024 to August 2024 (sheep’s milk). Typical breeds of cows for the collection area: Polish red and Holstein–Friesian breed. Typical breeds of sheep for the collection area: Podhale sheep, white-headed meat, and Polish mountain sheep.

2.2. Apparatus

The measurements were performed using a Spectrum Two FT-IR, a versatile Fourier Transform Infrared (FTIR) spectrometer (PerkinElmer Inc., Shelton, CT, USA), in compliance with the following directives:
  • IDF 148-2/ISO 13366-2:2006 (SomaScope LFC) [14];
  • MicroVal (SomaScope LFC);
  • IDF 141C/ISO 9622:2013 (LactoScope FTIR) [15];
  • ICAR Milk Analysis certificate.
Spectra from all milk samples were collected in the mid-infrared region (4000–450 cm−1) using a spectrometer equipped with a deuterated triglycine sulfate (DTGS) detector. The FTIR instrument, fitted with a horizontal attenuated total reflection (HATR) accessory featuring a ZnSe crystal, was used to obtain FTIR spectra from both cow’s and sheep’s milk samples. For each spectrum, the resolution was set to 4 cm−1, with 64 scans per sample. After each analysis, the ZnSe crystal was cleaned with hexane, ethanol, and deionized water, then dried with a nitrogen stream prior to each subsequent measurement. All measurements were repeated at least once.

2.3. Statistical and Chemometric Methods

The collected spectroscopic data were analyzed using a combination of chemometric techniques and statistical methods. The chemometric analysis was primarily conducted using Statistica software (version 12.0, StatSoft Inc., St. Tulsa, OK, USA), a widely recognized tool for multivariate data analysis. Principal Component Analysis (PCA) was employed as the primary technique to reduce the dimensionality of the spectral data and to uncover patterns or clusters that could differentiate cow’s and sheep’s milk. PCA is particularly useful for this type of study because it helps in identifying the most important variables that contribute to the variation between the samples, such as differences in protein, fat, and lactose content.
The PCA focused on the relationship between wavelength and signal intensity for the different types of milk, revealing key spectral differences. In particular, it highlighted the presence of characteristic wavelengths where cow’s milk showed slightly higher intensity values compared to sheep’s milk, especially at shorter wavelengths (up to 1100 cm−1). Conversely, at longer wavelengths (above 1100 cm−1), sheep’s milk exhibited significantly higher intensity values, likely due to its higher protein and fat content. These differences were consistent with the literature, which indicates that sheep’s milk generally has higher protein and fat concentrations than cow’s milk, while lactose content remains similar between the two.
In addition to PCA, analysis of variance (ANOVA) and correlation analyses were performed to further evaluate the statistical significance of the observed differences between cow’s and sheep’s milk. These analyses were conducted at a significance level of α = 0.05, ensuring that any detected differences were not due to random variation. The results from the ANOVA indicated significant differences between cow’s and sheep’s milk in terms of their fat, protein, and extract content, while no significant differences were observed for lactose content. The physicochemical parameters of the milk were also analyzed, with sheep’s milk showing consistently higher values for fat (6.49% vs. 2.81%) and protein (4.47% vs. 3.30%) compared to cow’s milk. These findings are in agreement with existing studies on the composition of sheep’s and cow’s milk.

2.4. Machine Learning for Milk Authentication

To further analyze the milk samples and develop a robust method for distinguishing between cow’s and sheep’s milk, several machine learning algorithms were applied to the spectroscopic data. Python v.3.12 was used for implementation. In this study, several machine learning algorithms were applied to classify the milk samples based on their spectroscopic data and physicochemical properties. The primary goal was to develop models that could accurately differentiate between cow’s milk and sheep’s milk, relying on the unique spectral characteristics identified in the FTIR analysis. The following machine learning models were employed:
Decision Tree: A decision tree model was implemented to classify the milk samples by recursively splitting the data based on feature values, leading to a tree structure where each leaf represents a classification decision. Decision trees are particularly effective in handling complex, nonlinear datasets, as they can capture intricate patterns without requiring extensive data preprocessing. The decision tree model performed well, achieving high R2 values for both sheep’s and cow’s milk datasets, demonstrating its suitability for this task.
Random Forest: The random forest algorithm, an ensemble method based on decision trees, was used to improve classification accuracy. By creating multiple decision trees on various sub-samples of the dataset and averaging their results, random forests mitigate overfitting and increase generalization capability. In this study, the random forest model outperformed the single decision tree model slightly, with an R2 of 0.9801 for the cow’s milk dataset and 0.9778 for the sheep’s milk dataset, indicating strong predictive power and robustness.
K-Nearest Neighbors (KNN): The KNN algorithm was employed to classify milk samples based on the distance between their spectral features. In KNN, the classification of a sample is determined by the majority class among its k-nearest neighbors, where k represents the number of neighbors considered. The KNN model performed well, especially for smaller values of k, with an R2 of 0.970 for k = 3 neighbors in the cow’s milk dataset and 0.965 for the sheep’s milk dataset. However, as the value of k increased, the model’s performance slightly degraded, likely due to the over-smoothing effect that results from considering too many neighbors.
Support Vector Machine (SVM): SVM models were implemented using both linear and nonlinear kernels. SVM aims to find the optimal hyperplane that separates different classes by maximizing the margin between the classes. In this study, SVM with a radial-basis function (RBF) kernel outperformed the linear and polynomial kernel versions, achieving an R2 of 0.621 for sheep’s milk and 0.603 for cow’s milk. Despite these results, SVM models generally underperformed compared to the tree-based models and KNN, suggesting that the complex nature of the spectral data requires more flexible models.
Linear Regression: As a baseline model, linear regression was applied to test the linearity of the relationships between the spectral features and the milk classification task. However, the model performed poorly, with R2 values of 0.0188 for the sheep’s milk dataset and 0.0415 for the cow’s milk dataset. These results indicate that linear regression could not adequately capture the nonlinear patterns in the data, making it unsuitable for this application.
To assess the performance of the machine learning models, various evaluation metrics were used:
R2 (Coefficient of Determination): The primary evaluation metric used to assess the performance of the models was the R2 value, which measures the proportion of variance in the dependent variable (milk type) that is predictable from the independent variables (spectral and physicochemical data). An R2 value close to 1 indicates a model with strong predictive capabilities, while an R2 close to 0 suggests poor model performance. In this study, the decision tree and random forest models exhibited high R2 values, indicating their strong predictive power for classifying the milk samples.
Cross-Validation Score: Cross-validation was performed to ensure that the models were not overfitting the training data and could generalize well to new, unseen data. The dataset was divided into training and testing subsets, and models were evaluated using k-fold cross-validation. The best cross-validation scores were obtained for the random forest model, which achieved a score of 75.3%, indicating robust performance across different subsets of the data.
Mean Absolute Error (MAE): Mean Absolute Error (MAE) was also used to measure the average magnitude of the errors between the predicted and actual classifications, without considering their direction. MAE provides an intuitive understanding of the model’s performance by showing the average deviation from the actual value. Although the MAE values were not explicitly reported, the high R2 values in tree-based models suggest that the errors were minimal.
Hyperparameter Tuning: For each model, hyperparameters were tuned to optimize performance. For the decision tree and random forest models, parameters such as tree depth and the number of estimators (trees) were optimized. The best random forest model was achieved with 50 estimators and a maximum depth of 20. For SVM, the RBF kernel provided the best results with a regularization parameter (C) of 10. Hyperparameter tuning was essential in maximizing model performance and ensuring the classifiers worked effectively on the spectral data.
In summary, the random forest model emerged as the best-performing model, followed closely by the decision tree and KNN models. These results underline the importance of using nonlinear, flexible models like decision trees and random forests for complex datasets such as those generated from FTIR spectroscopic analysis. The combination of tree-based models and chemometric techniques provided accurate and reliable methods for authenticating cow’s and sheep’s milk, contributing to future advancements in milk product authentication and detection of adulteration.
These results indicate that nonlinear models, particularly tree-based models such as decision trees and random forests, are best suited for this task. The complex and nonlinear relationships in the milk datasets require flexible models that can capture the intricacies of the data, making random forests and decision trees the most effective tools for milk authentication based on FTIR spectroscopy.

3. Results and Discussion

The research pipeline consists of the following four steps:
(1)
Exploratory analysis;
(2)
Principal Component Analysis (PCA);
(3)
Regression task—to predict intensity based on wavelengths;
(4)
Classification task—to find the milk type based on parameters analysis.

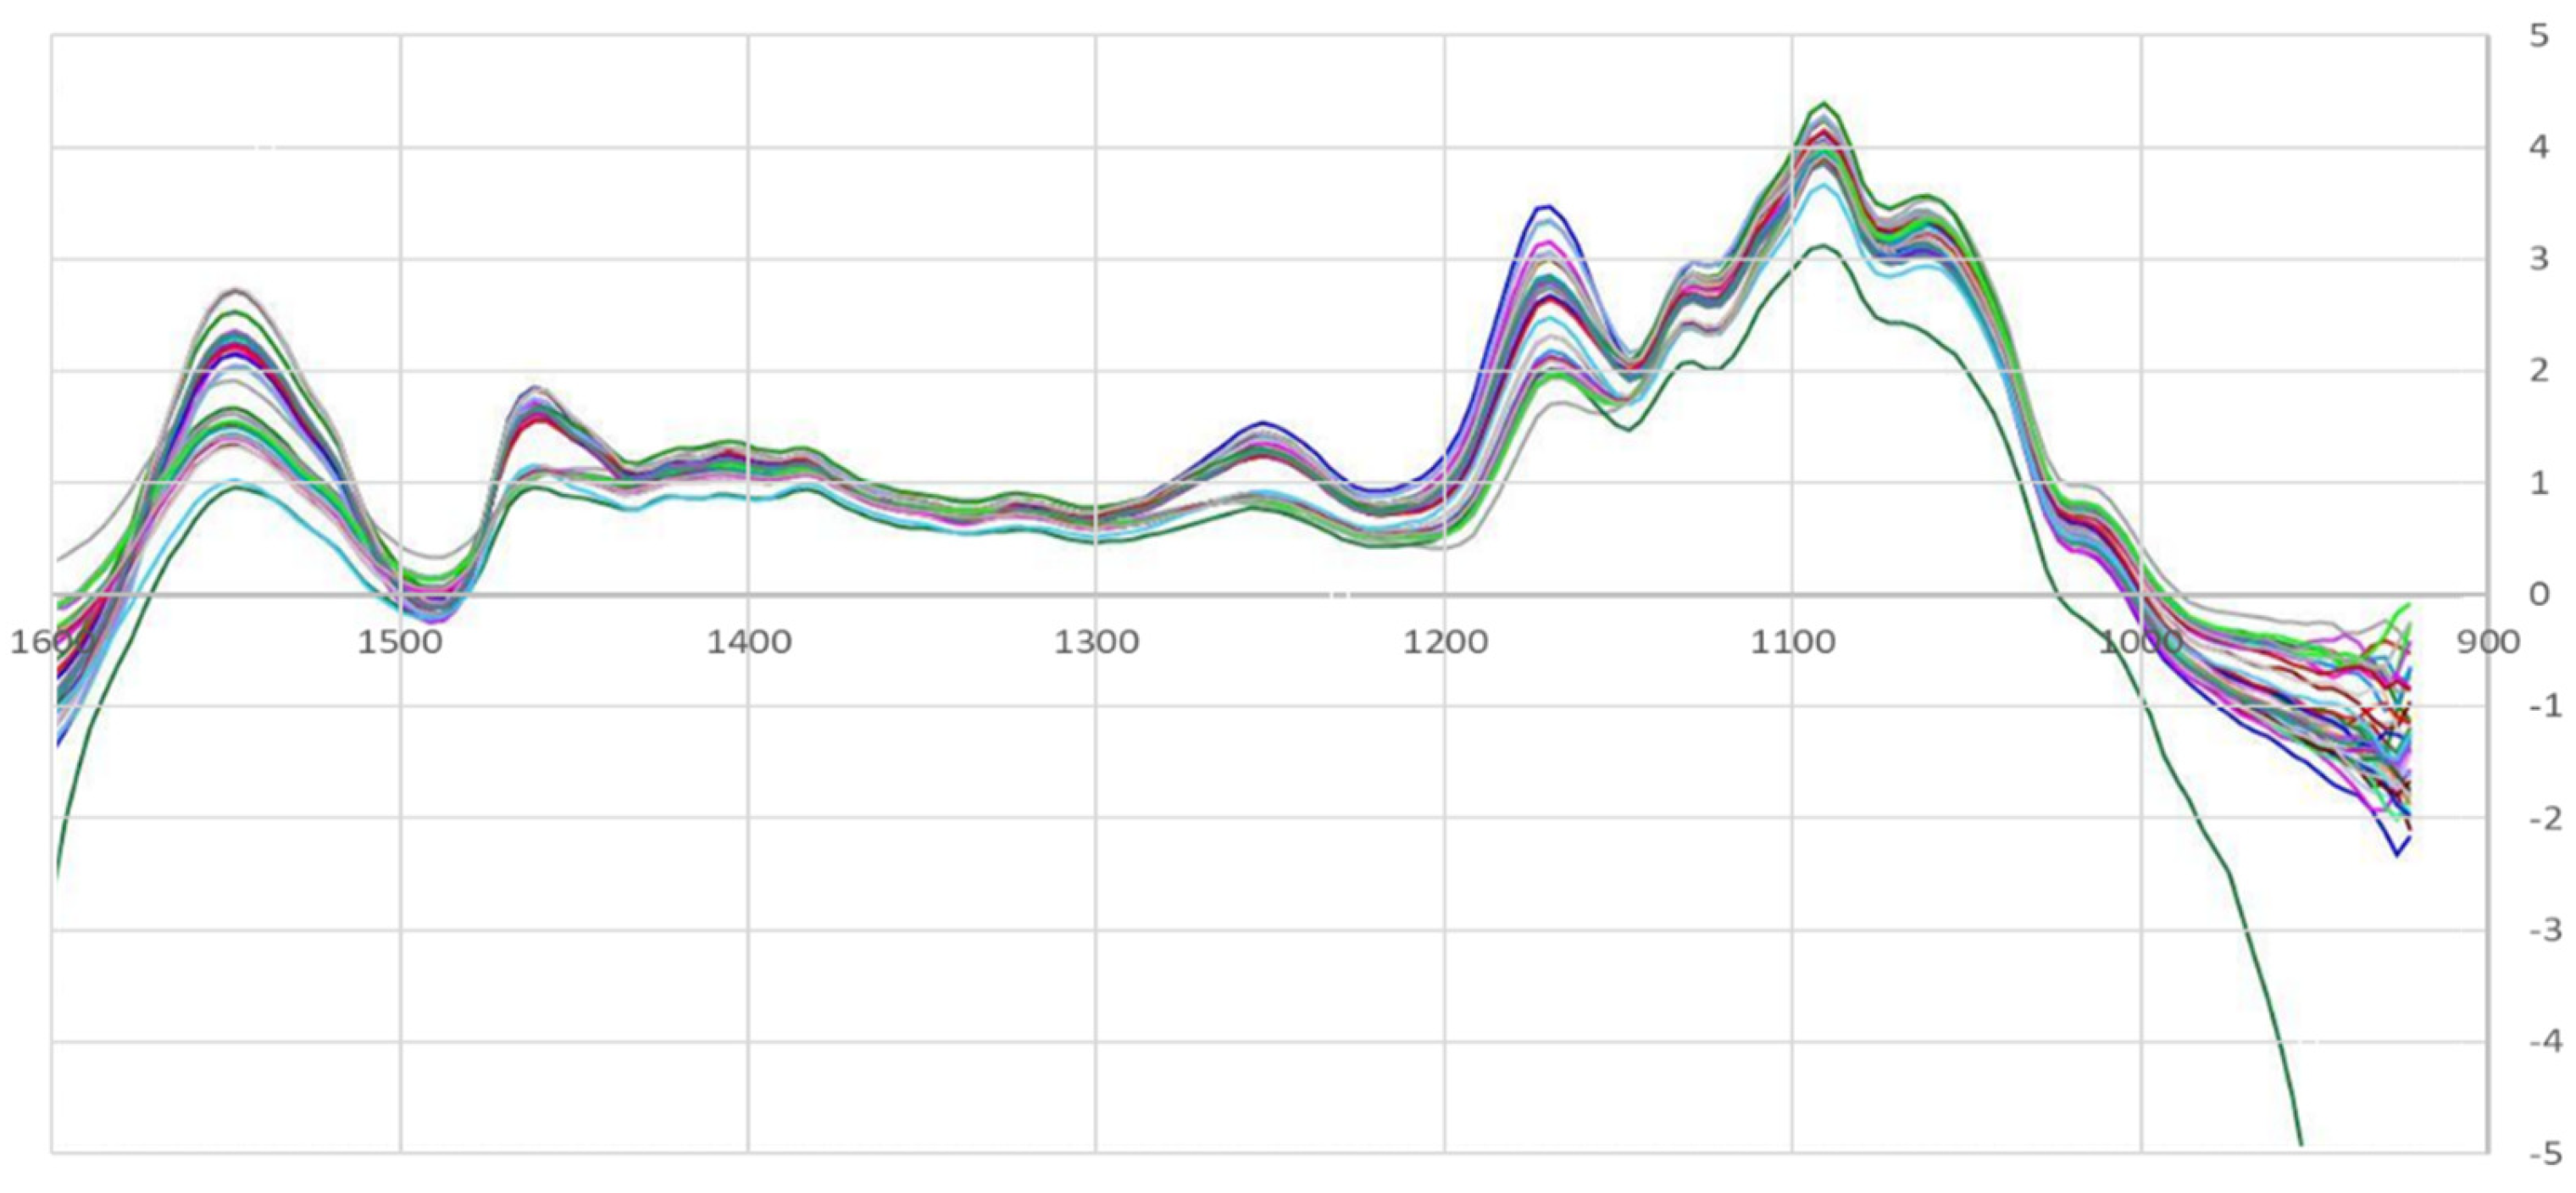
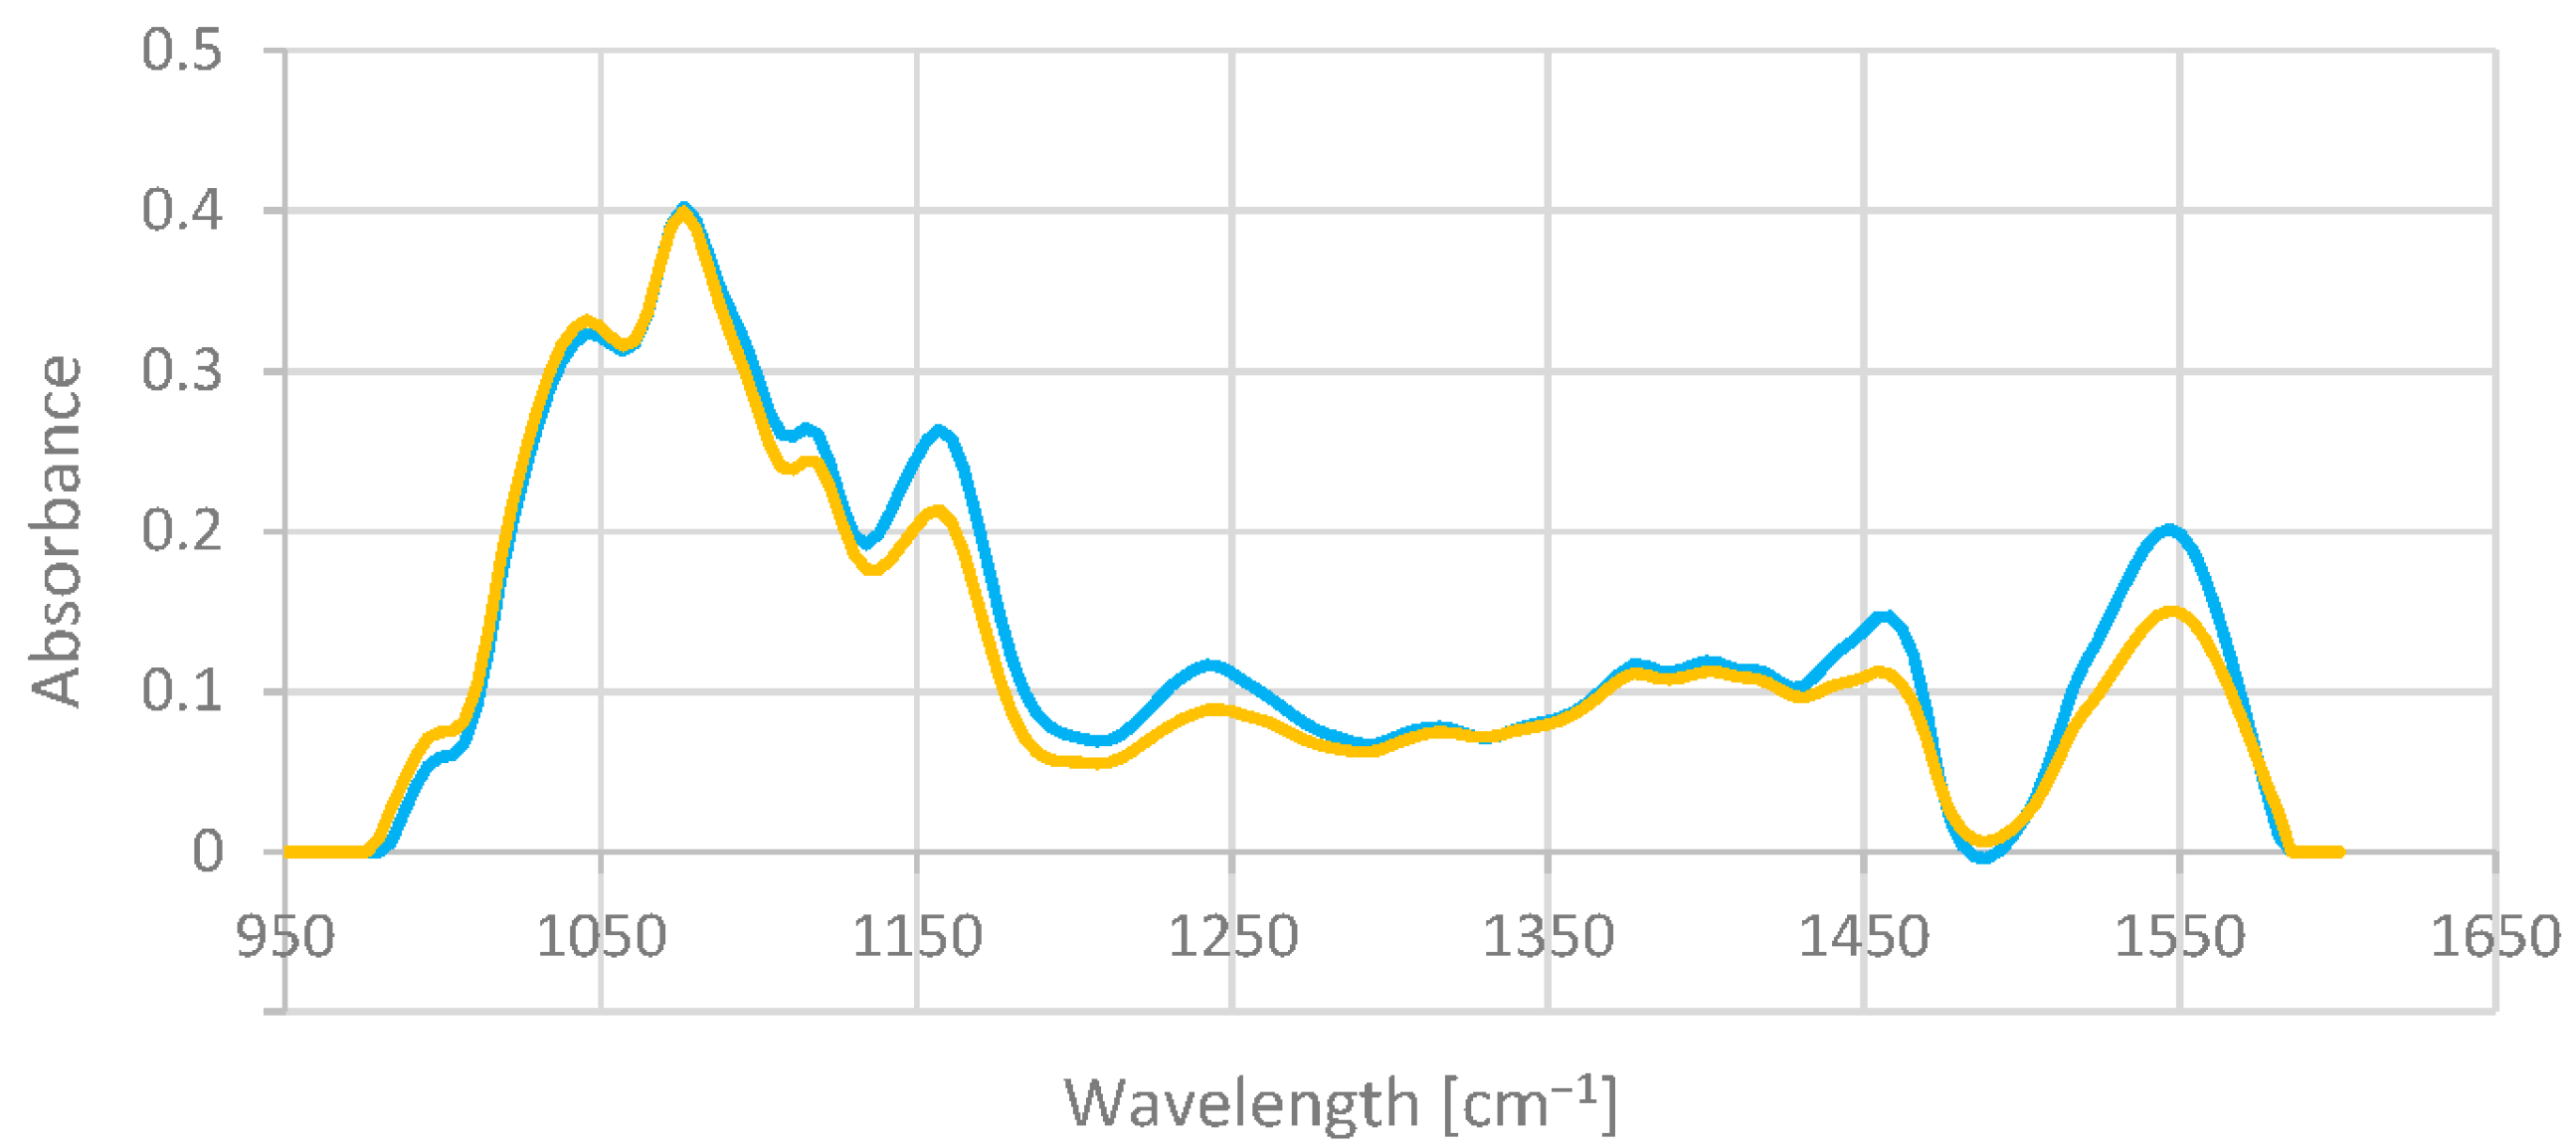
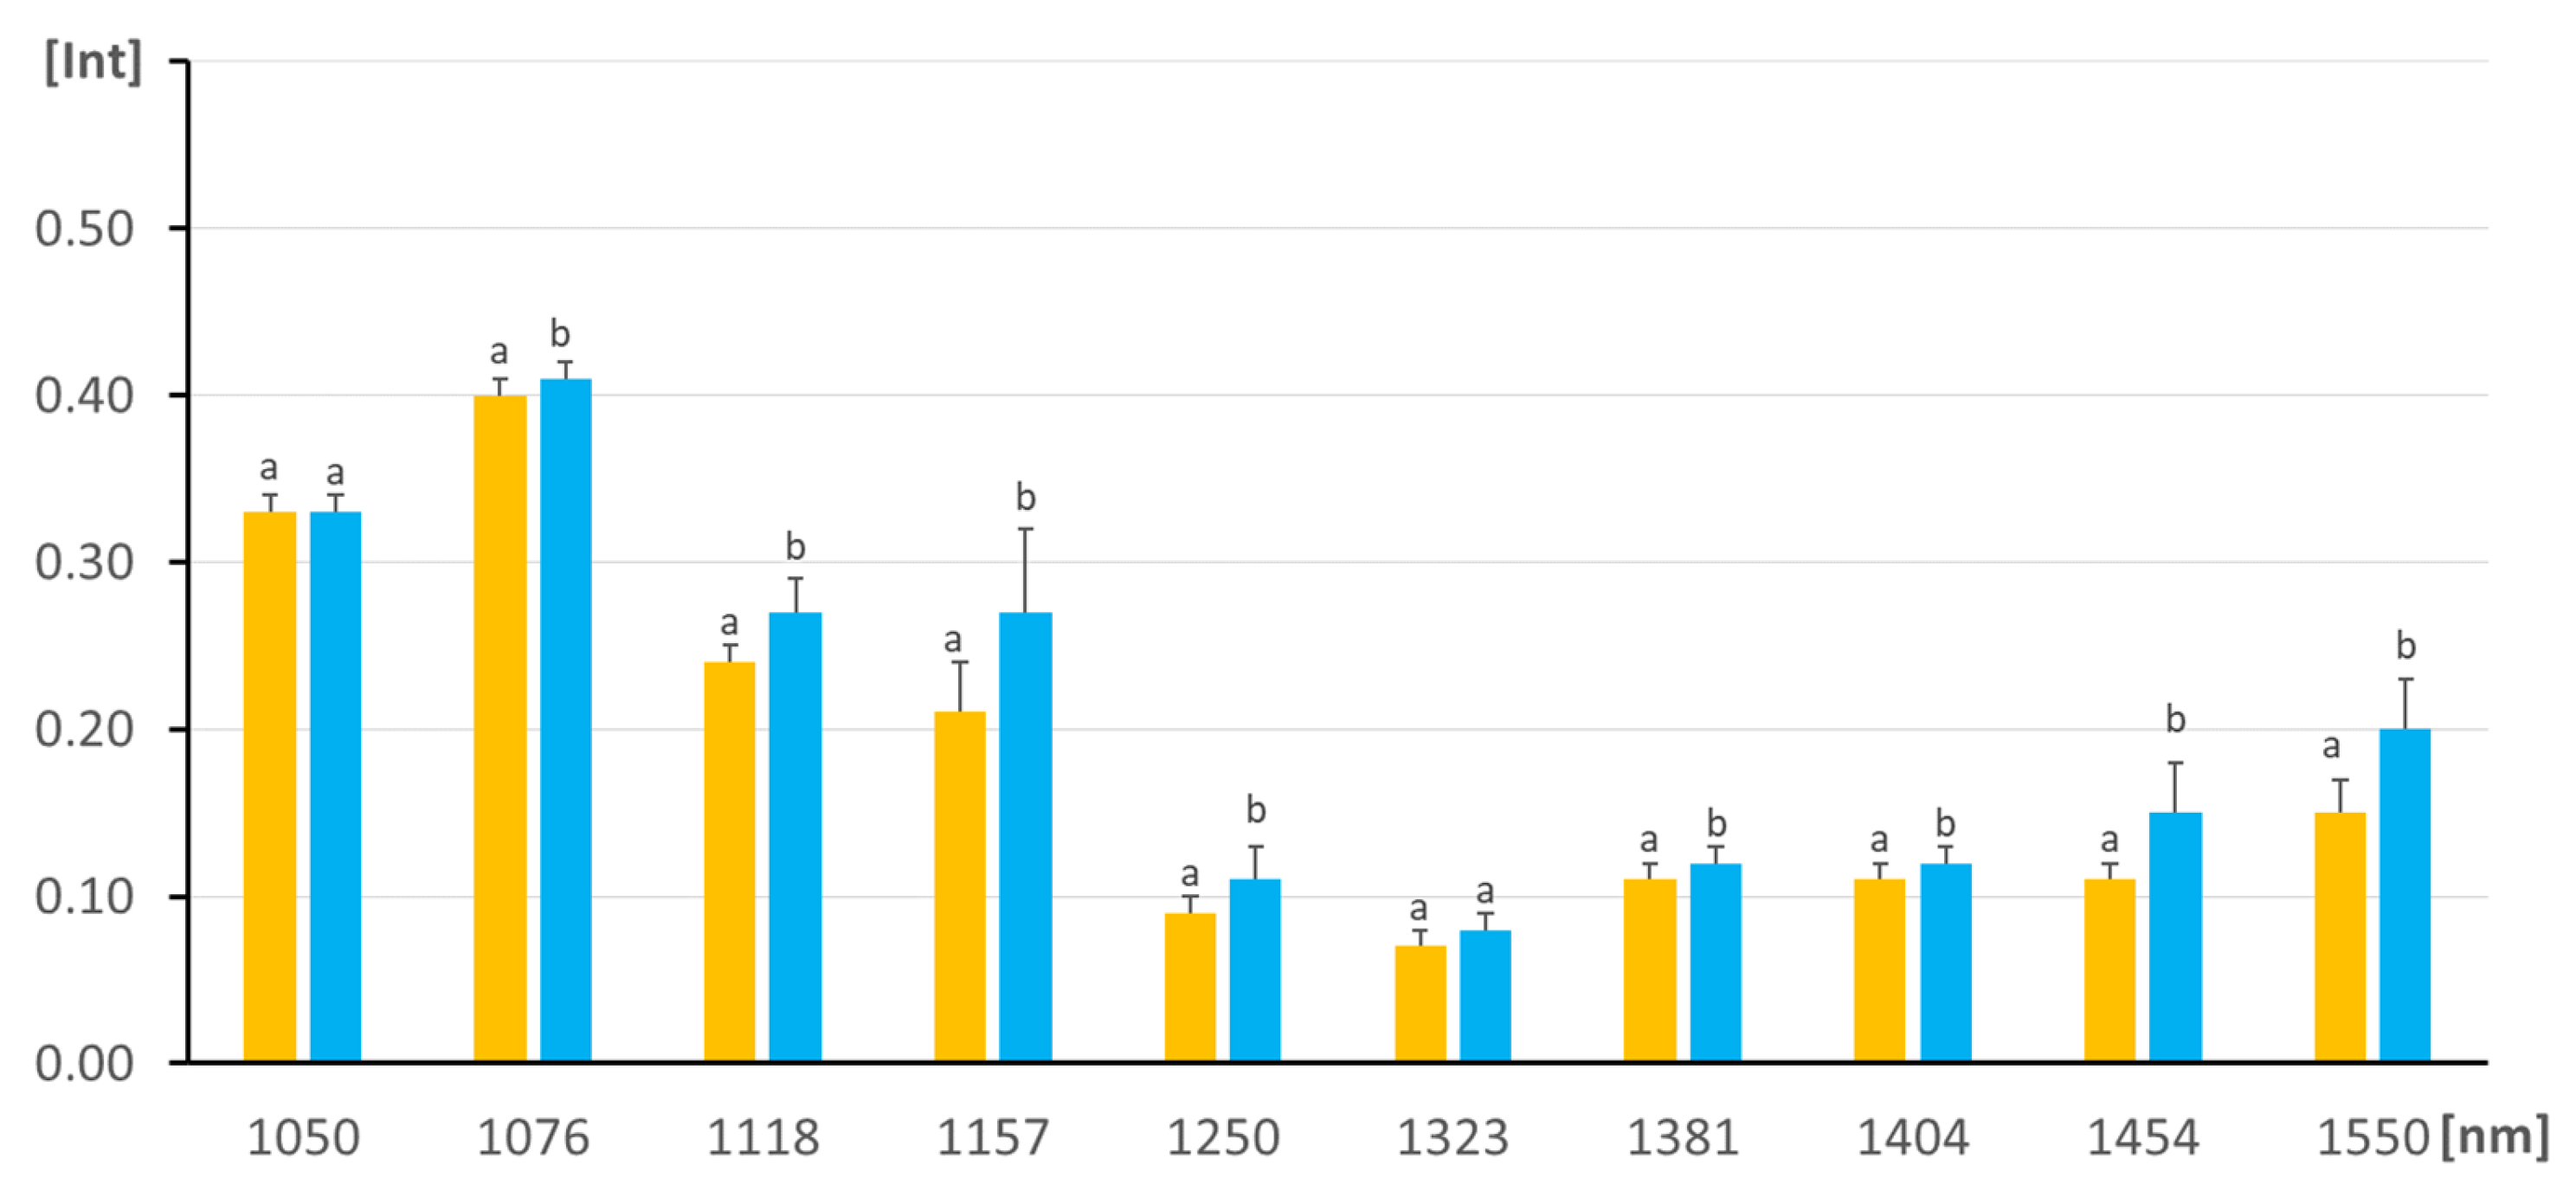
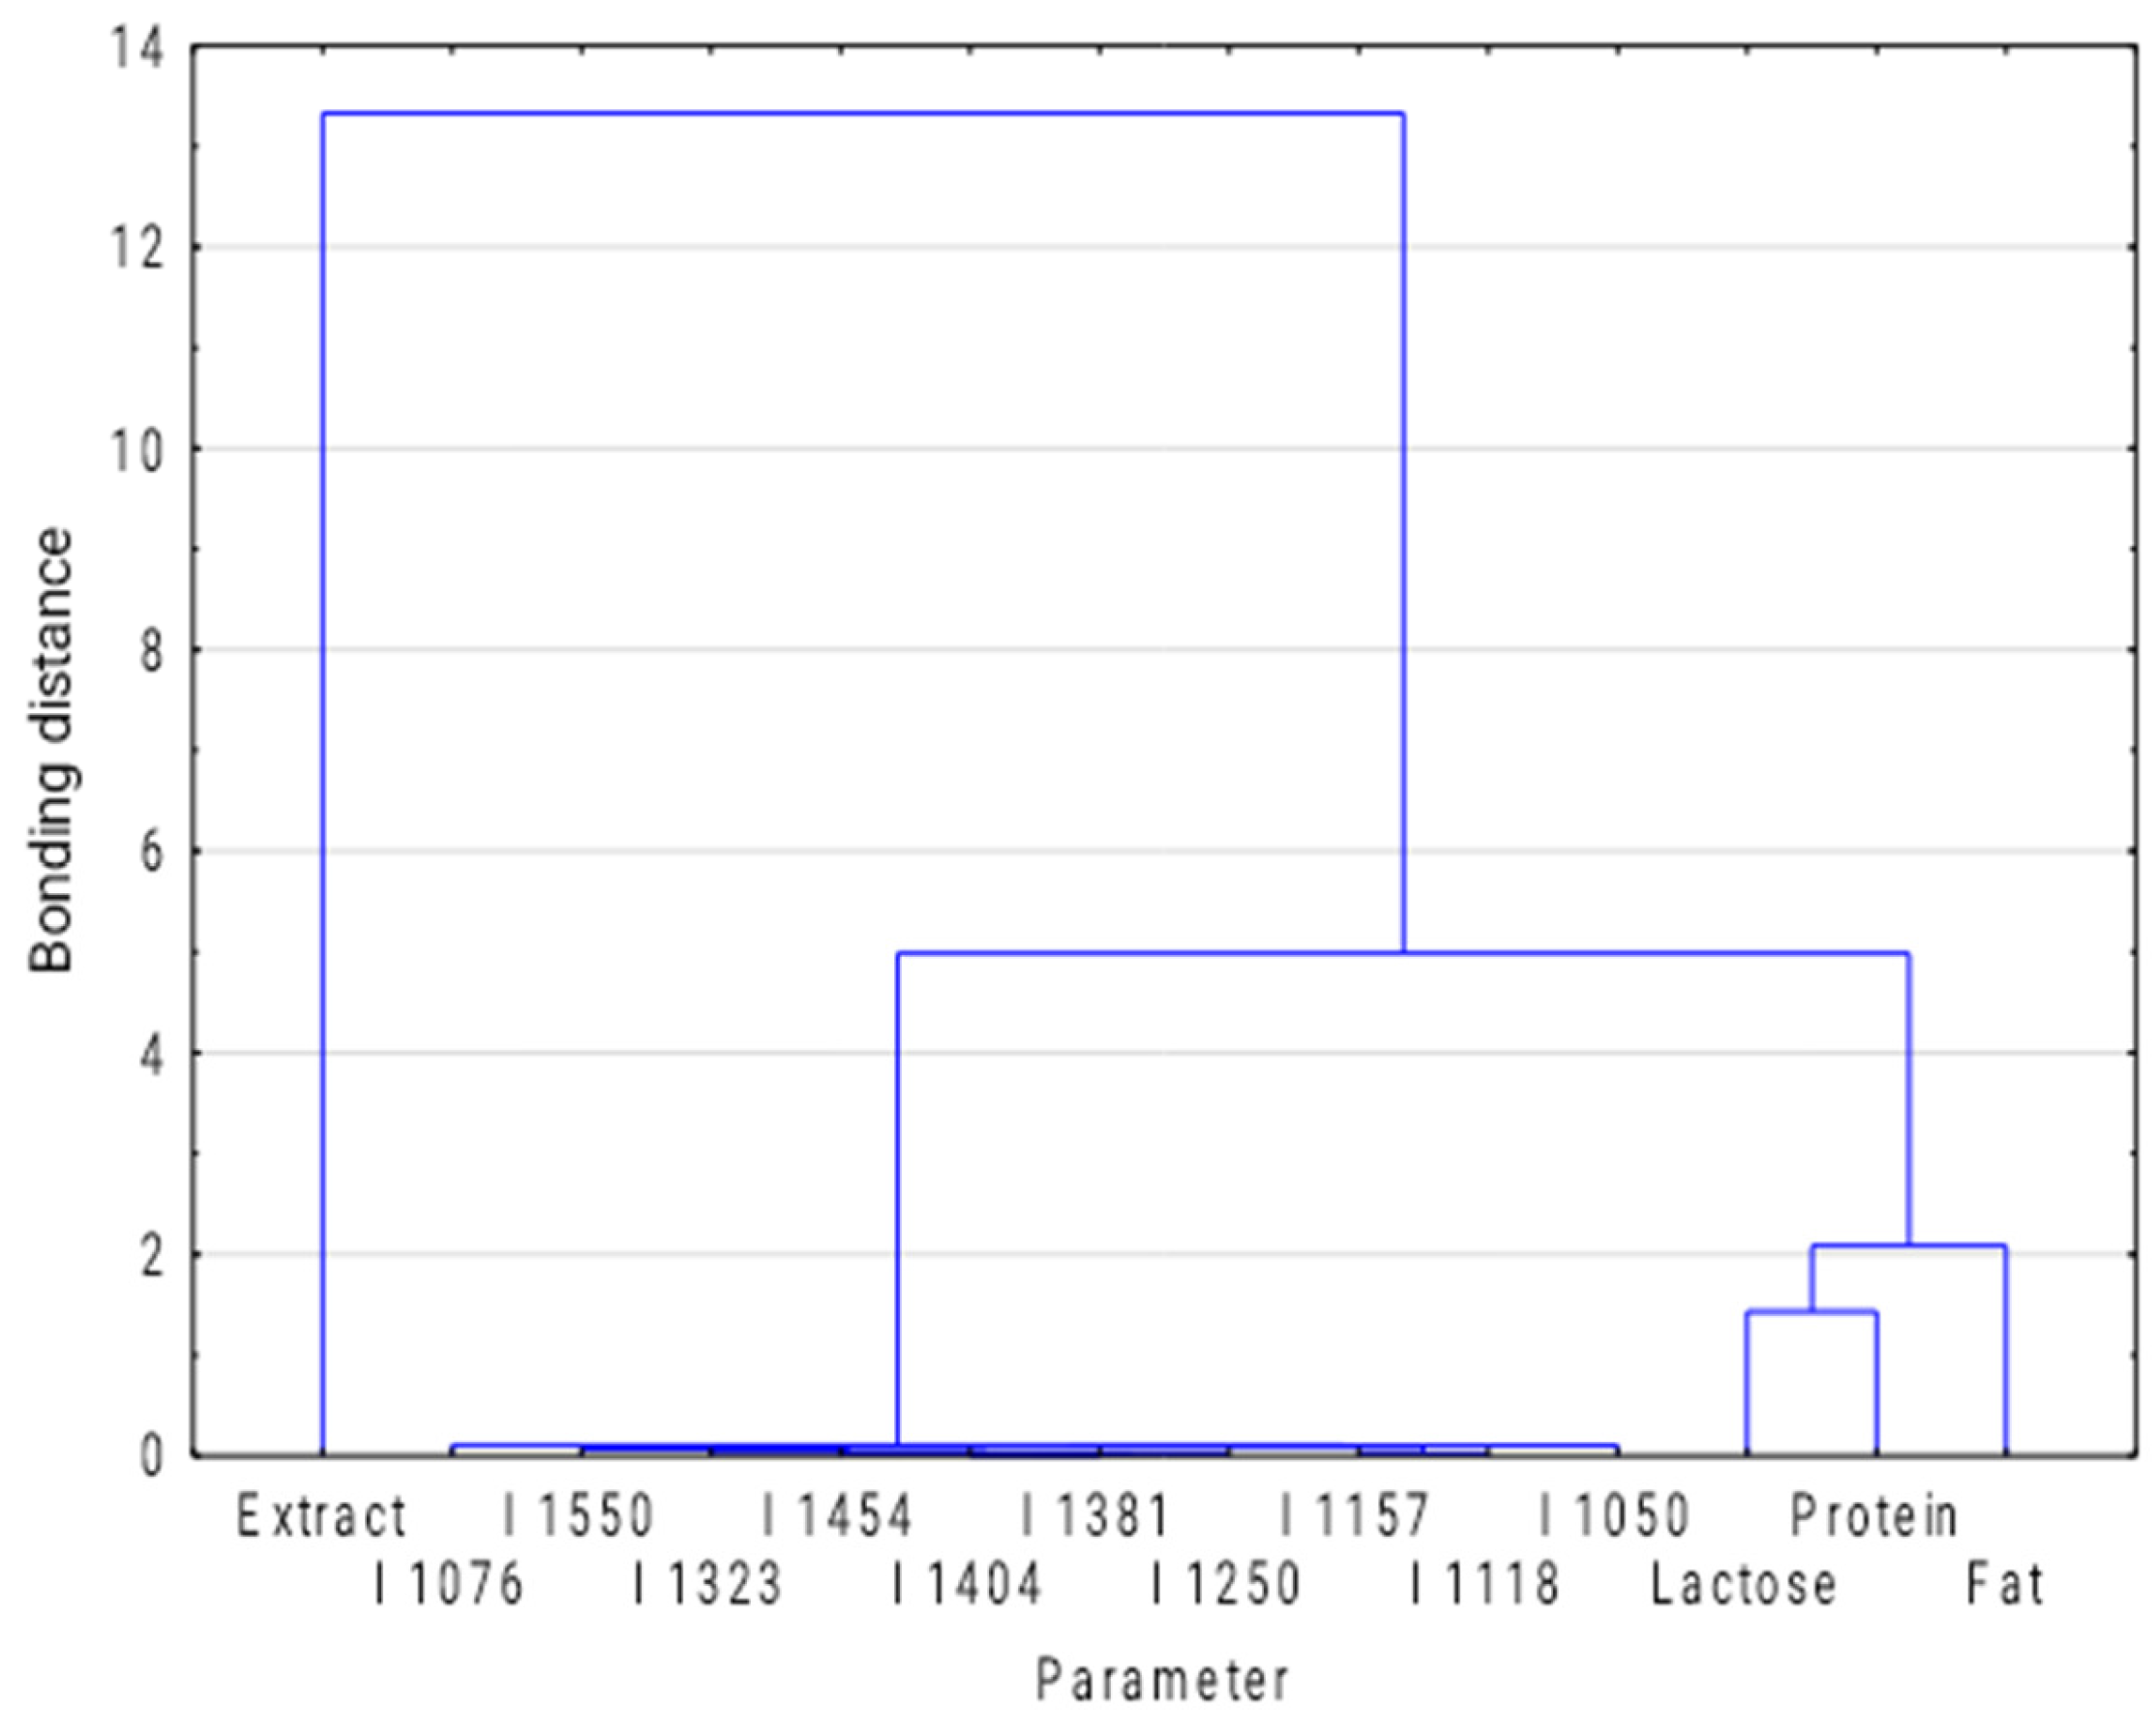
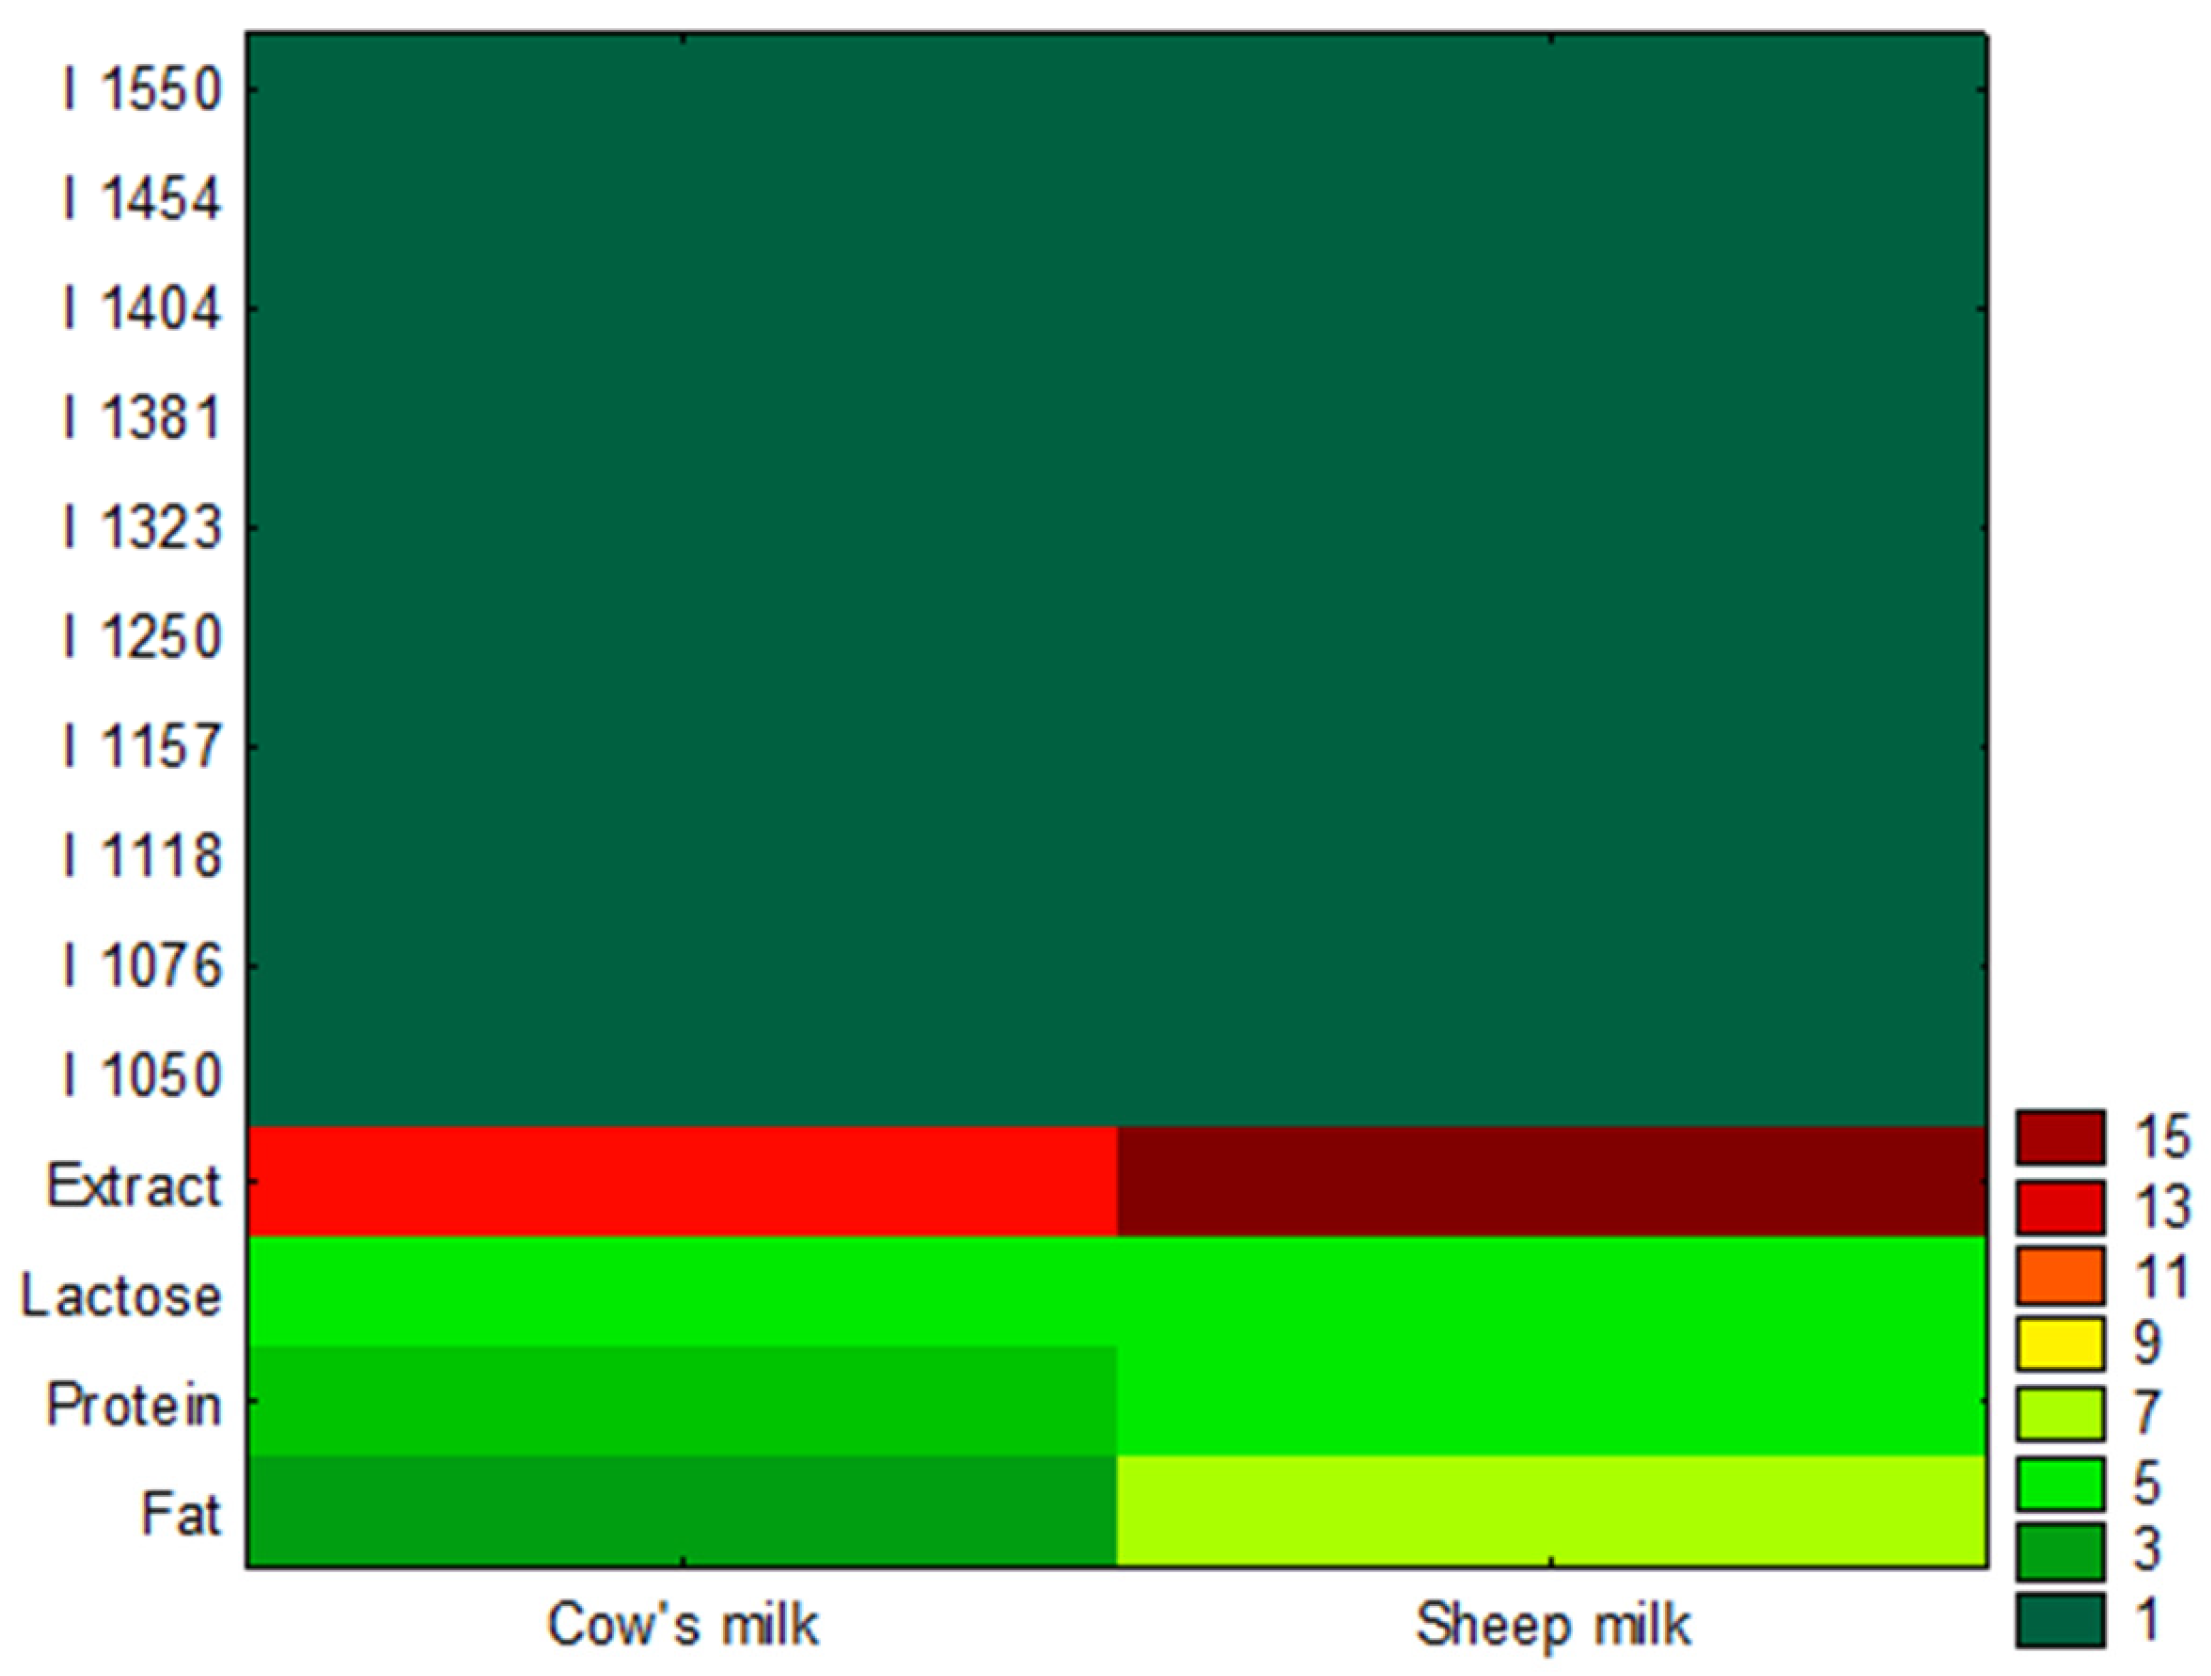
3.1. Exploratory Analysis

The collected dataset contains measurement data for milk samples with columns including product name, analysis date/time, sample ID, and values for various components such as fat, protein, lactose, and extract percentages. Table 1. presents a comparison of the physicochemical parameters measured using the FTIR spectroscopy device, based on internal validation procedures. The significance tests performed indicate significant differences between the parameters tested for cow’s and sheep’s milk.
The average fat content is approximately 2.87%, with a standard deviation of 1.69%. The values range from −0.06% to 32.26%, suggesting the presence of outliers (negative values and values significantly above the mean).
The mean protein content is 3.43%, with a fairly small standard deviation (0.23%), indicating consistent values across samples. The range is from 0.22% to 6.18%, with some low outliers that may need further investigation.
The mean lactose content is 4.70%, with a range between −0.47% and 13.54%. Negative values for lactose are unrealistic and may indicate measurement or data entry errors.
The extract values have a mean of 11.77% with a broad range (0.88% to 39.36%), again suggesting potential outliers.

3.2. Principal Component Analysis (PCA)

The Principal Component Analysis (PCA) resulted in a single new variable that accounts for 100% of the variability in the entire experimental system. All parameters strongly influence the system’s variability, as they are located within two red circles (Table 2) and show strong, positive correlations.
Positive PC1 values describe only the Lactose parameter, while negative PC1 values describe the remaining parameters. A strong negative correlation was observed between Lactose and the other parameters. Meanwhile, the parameters Fat, Protein, Extract, I 1050, I 1076, I 1118, I 1157, I 1250, I 1323, I 1381, I 1404, I 1454, and I 1550 are positively correlated with each other.
Differences were observed between cow’s milk and sheep’s milk (Table 3).
Positive PC1 values describe cow’s milk, while negative values of the first principal component characterize sheep’s milk.
The PCA (Table 2 and Table 3) also shows that the parameters Fat, Protein, Extract, I 1050, I 1076, I 1118, I 1157, I 1250, I 1323, I 1381, I 1404, I 1454, and I 1550 are positively correlated with sheep’s milk, while the Lactose parameter is positively correlated with cow’s milk.

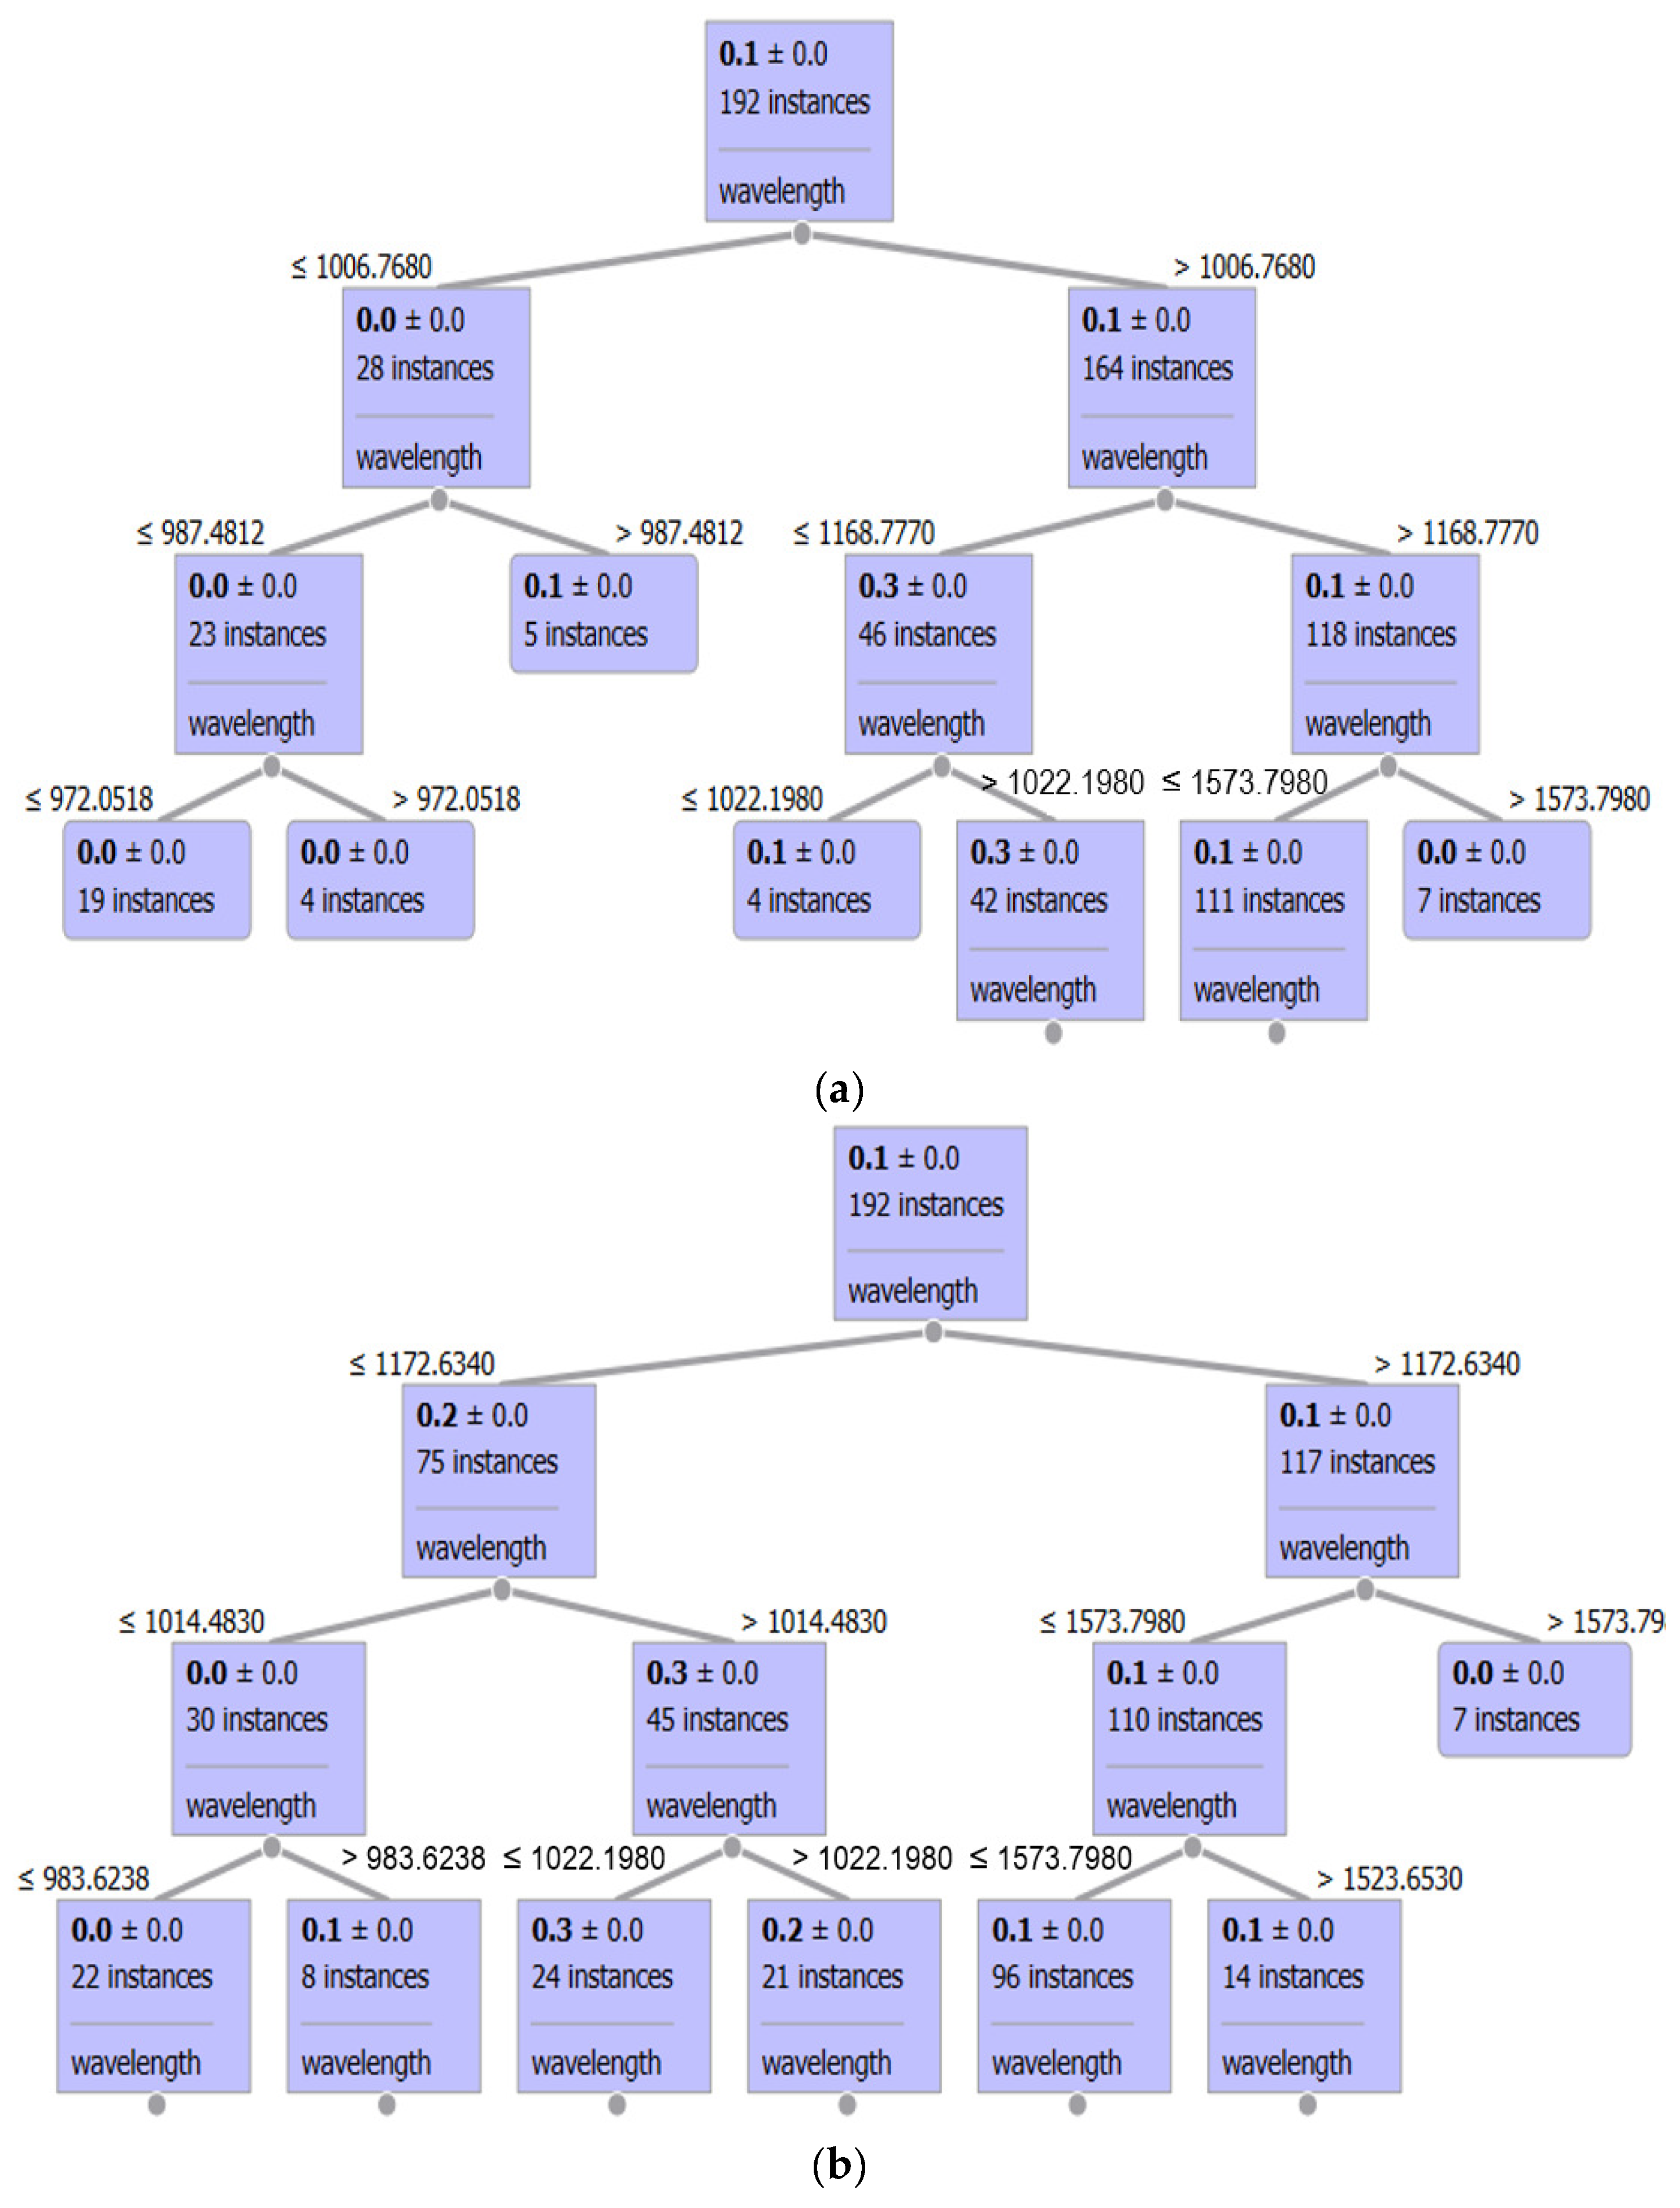
3.3. Regression Task

At this stage of the project evaluation, the focus was on identifying easy-to-manage tools and methods for assessing authenticity, as well as detection techniques that could reliably detect 100% adulteration of sheep’s milk and/or, in the future, bryndza cheese.
The detection methods presented in the literature are based on the following:
  • Detection of cow’s milk in bryndza using the HPLC-DAD-MS method—a relatively expensive approach due to the need for costly, technically advanced equipment and the relatively complex process of sample preparation for analysis and extraction [3].
  • Identification of volatile compounds and fatty acids characteristic of different types of bryndza using GC/MS [13].
  • Non-traditional but highly economical methods for identifying the origin of bryndza and milk or detecting the adulteration of 100% sheep’s milk bryndza with cow’s milk cheeses, such as FTIR analysis, which was the focus of this project. The equipment itself may not be the cheapest, but it allows for quick and easy processing with minimal interference with the matrix, which is a clear advantage of this approach [16].
In line with the principle of ‘Think Big, Start Small, Learn Fast’, the project began with the extraction of a pool of 1000 objects from FTIR analyses of cow’s milk and 70 from sheep’s milk, from a dataset containing nearly 11,000 samples (Figure 1). These data will be gradually supplemented in subsequent stages of the project, primarily with raw results from analyses of sheep’s milk, which were obtained due to the seasonality of this dairy product segment.
The analyses were performed using an FTIR device, a versatile mid-infrared analyzer capable of testing a wide range of dairy products, including milk, cream, whey, concentrates, ice cream, and yogurt mixes.
In collaboration with an industrial partner and using our own data resources, we successfully collected measurement data from nearly 2143 samples of cow’s milk and 467 samples of sheep’s milk.
Due to significant noise and interference in the analytical region of the spectrum, the range of 900–1699 nm was selected.
In addition, other factors were identified and excluded from data export in the original software to facilitate processing and visualization in more advanced statistical tools. Parameters such as fat content, dry mass, and analytical beam length were also deemed important for comparative studies between FTIR spectrometers from different manufacturers.
For the obtained results, mean values and standard deviations were calculated. From the graphs of mean values for the tested milk types, characteristic wavelengths were identified where an increase in intensity was observed (Figure 2).
The statistical and comparative analysis shows that, for shorter wavelengths up to 1100 cm−1, small differences can be observed between the tested samples of cow’s and sheep’s milk. Cow’s milk exhibits a slightly higher signal value in this range; however, at higher wavelengths (above 1100 cm−1), differences in intensity measurement become more pronounced, with sheep’s milk displaying a significantly higher intensity than cow’s milk. This may be due to the different content of, among others, protein and fats; therefore, the data were correlated—in the second phase of the project—with additional tests of the chemical composition of the milk samples. The obtained data on typical physicochemical parameters are consistent with literature reports, which indicate that the recorded average protein content is approximately 2.3 mg higher in sheep’s milk [17]. This finding aligns with data from other publications [18]. A similar trend is observed in lipid analysis, where this parameter is also higher in milk obtained from sheep. However, the content of the primary milk sugar, lactose, cannot serve as a differentiator in these analyses, as the values for this disaccharide are similar regardless of the milk source.
To interpolate the above-given curves (Figure 2), the various machine learning (ML) methods are implemented (Table 4).
For the sheep dataset, the decision tree model based on the CART algorithm performs very well, achieving an R2 of 0.9766, which indicates strong predictive power. The structure of the developed decision tree is given below (Figure 3).
The random forest model slightly outperforms the decision tree, with an R2 of 0.9778. On the other hand, linear regression performs poorly with an R2 of 0.0188, suggesting that this model struggles to capture the underlying patterns. The support vector machine (SVM) with a linear kernel shows very poor performance, with a negative R2 of −0.828, indicating that the model is not suitable for this task. The SVM with a polynomial kernel performs slightly better than the linear kernel but still poorly, with an R2 of 0.027. In contrast, the SVM with a radial-basis function (RBF) performs significantly better, achieving an R2 of 0.621. The K-nearest neighbors (KNN) model also performs quite well, with R2 values decreasing slightly as the number of neighbors increases: 0.965 for k = 3, 0.961 for k = 5, and 0.944 for k = 7.
For the cow dataset, the decision tree model performs slightly better than in the sheep dataset, with an R2 of 0.9798. The random forest model again performs the best, with an R2 of 0.9801, indicating strong predictive capabilities. Linear regression, similar to its performance in the sheep dataset, shows poor results, with an R2 of 0.0415. The SVM with a linear kernel again demonstrates poor performance, with a negative R2 of −0.102. The SVM with a polynomial kernel shows a slight improvement with an R2 of 0.056 but still performs poorly. The SVM with the RBF kernel performs decently with an R2 of 0.603, which is comparable to its performance in the sheep dataset. The KNN model, similar to the sheep dataset, shows good performance, with R2 values of 0.970 for k = 3, 0.966 for k = 5, and 0.951 for k = 7.
In this analysis, it is clear that the random forest model consistently outperforms other models, followed closely by the decision tree. Both models, which are tree-based, are known for their flexibility and ability to handle complex data effectively. The SVM with linear and polynomial kernels performs poorly in both datasets, while the RBF kernel offers better results but still falls short compared to tree-based models and KNN. The KNN model also performs well, though its performance degrades slightly as the number of neighbors increases, which may indicate over-smoothing. Linear regression fails to capture the complexity of the data, as evidenced by its low R2 values. Overall, these findings suggest that nonlinear models, particularly tree-based models like decision trees and random forests, are best suited for this task, likely due to the complex and nonlinear relationships in the milk datasets. The SVM with the RBF kernel and the KNN model also provide decent results, though the SVM with linear or polynomial kernels performs poorly.

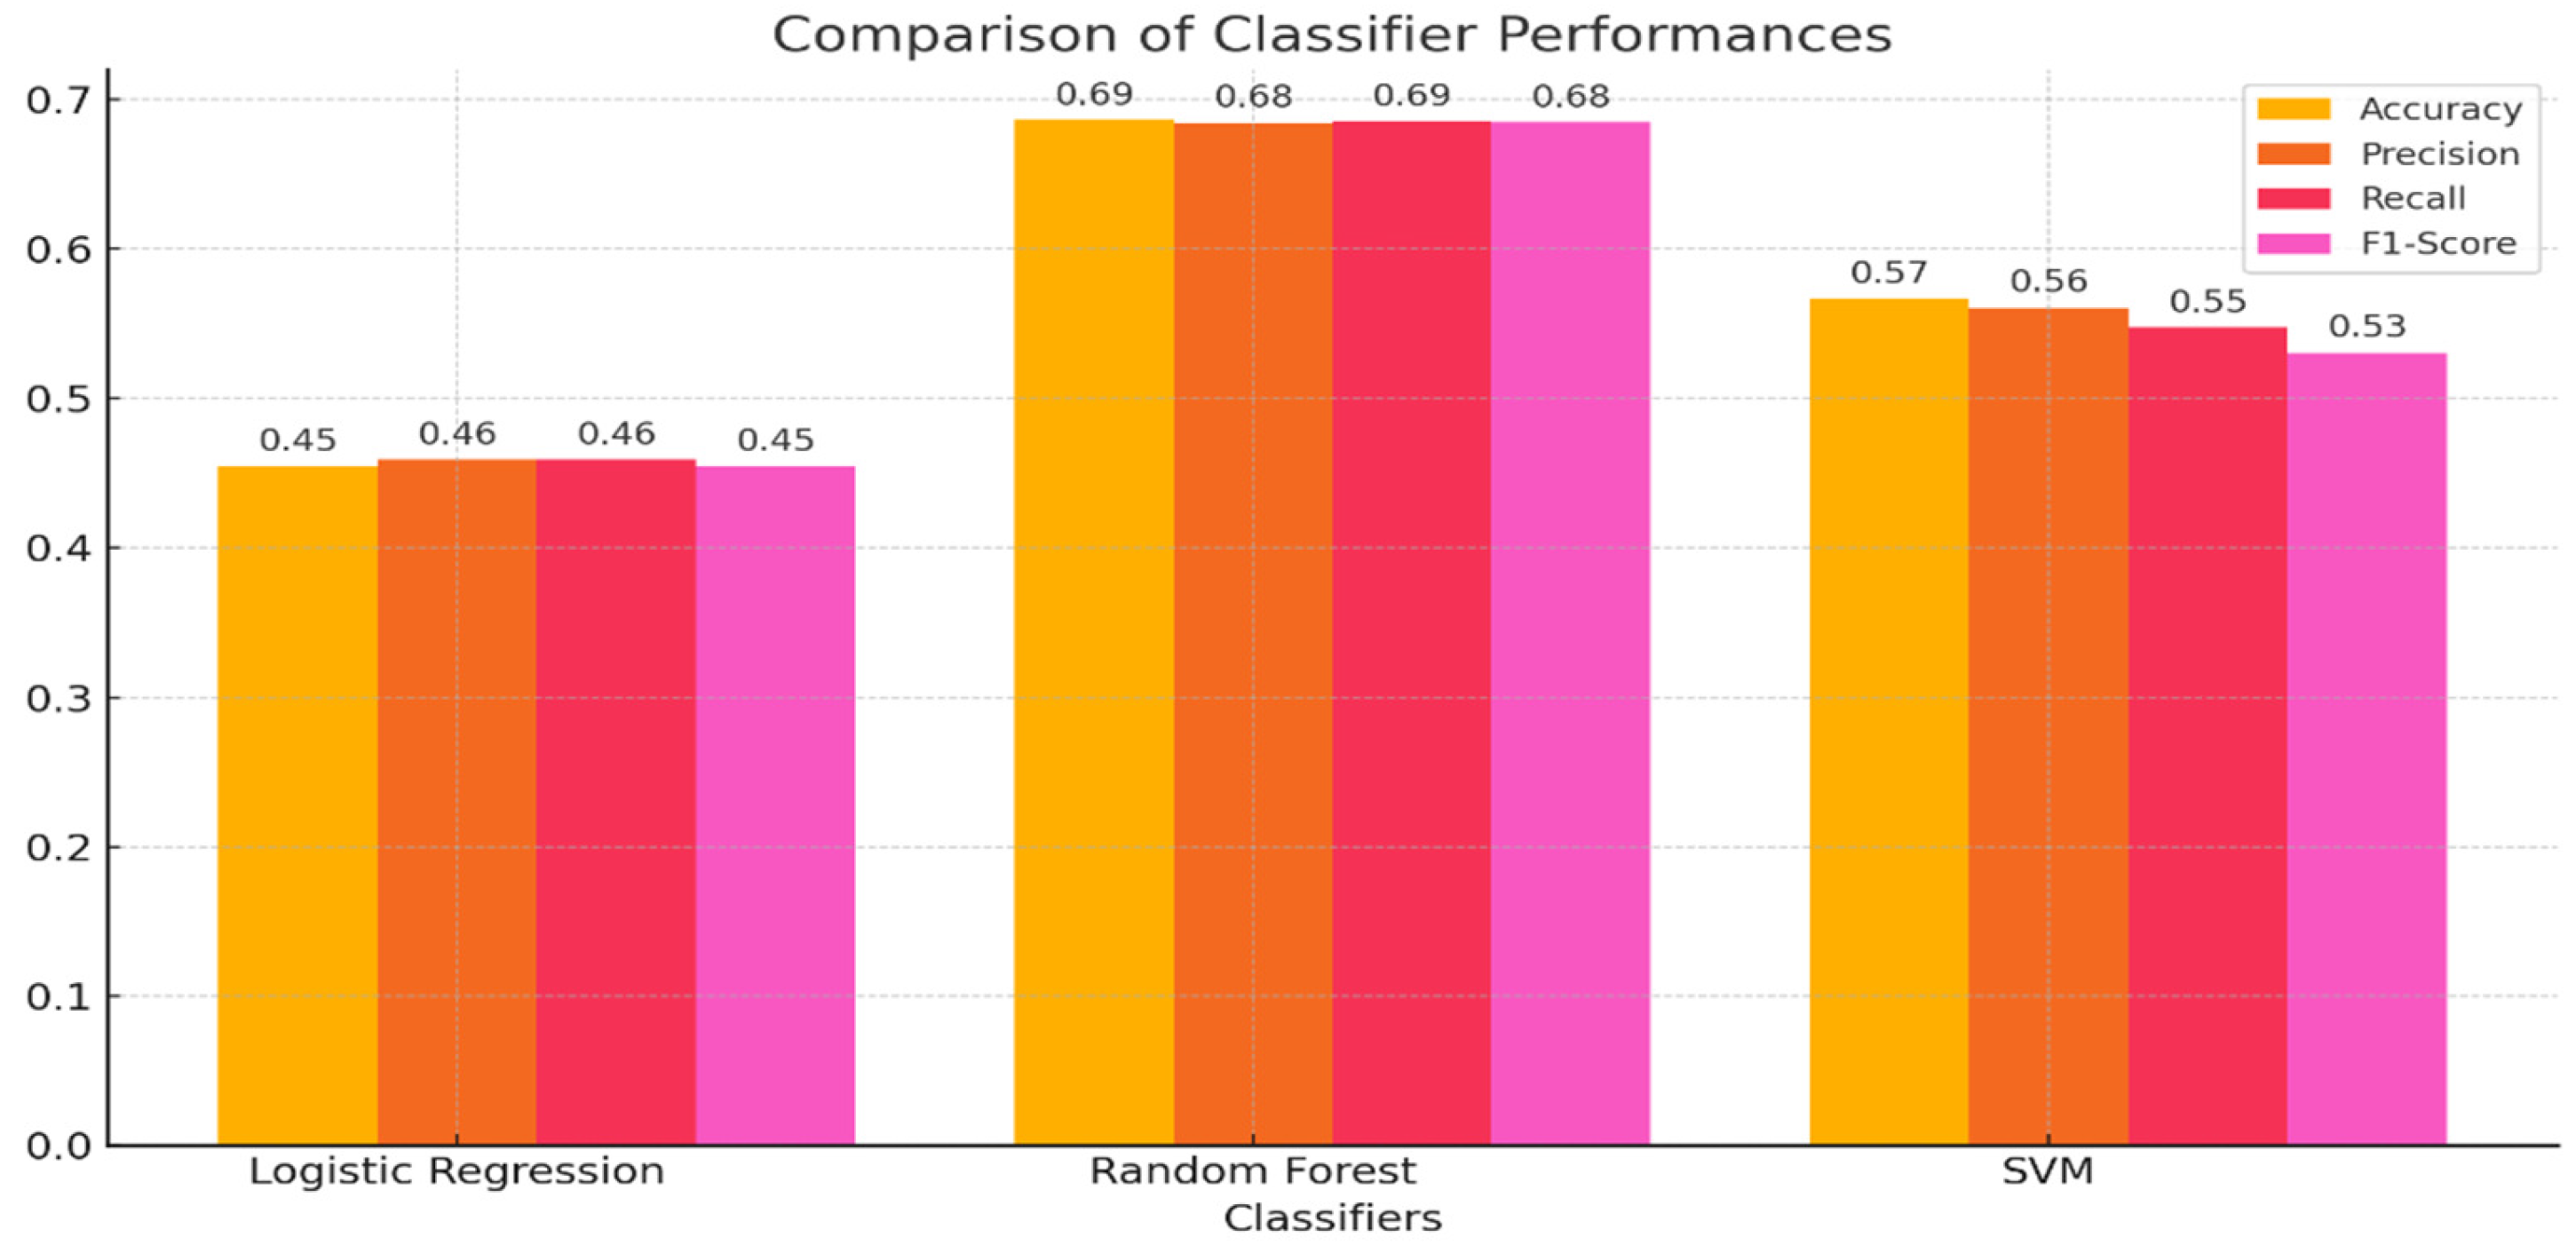
3.4. Classification Task

Next, classification of milk type is performed. Figure 4 represents a comparison of the determined characteristic wavelengths and absorbance values for cow’s milk and sheep’s milk, with the marked standard deviation.
No significant differences were found only for the intensity values at wavelengths 1050 and 1323.
Based on Figure 4, it can be concluded that a key signature for distinguishing sheep’s milk from cow’s milk may be the spectroscopic bands primarily located around the so-called characteristic wavelengths for amide I and II, specifically at 1454 nm and 1550 nm [19].
The graph below presents the result of cluster analysis based on a single link (i.e., the ‘nearest neighbor’ method) and Euclidean distance as a measure of similarity between objects. It confirms earlier observations from the preliminary statistical analysis (Figure 5).
The analysis, presented in a sequential contour plot, highlights differences in parameter values between the types of milk tested—sheep’s and cow’s milk (Figure 6).
The most notable differences were observed in the Fat, Protein, and Extract parameters, with higher values recorded for sheep’s milk. No differences were found for lactose or intensity at characteristic wavelengths.
The FTIR spectrometer used in the research is primarily validated for measuring cow’s milk, meaning the data it monitors, related to protein, fat, and extract content, is calibrated accordingly. However, in the next phase of the project, the development of an algorithm that links protein and extract content with signal intensity for the previously mentioned characteristic amide I and amide II bands, along with the expansion of data for sheep’s milk samples and the creation of test and training sets for unsupervised artificial neural network (ANN) learning, will form the basis for distinguishing cow’s milk from sheep’s milk and provide a model for authentication and the detection of potential adulteration.
The mentioned above dataset is imbalanced, with 2143 instances of “cow” and 461 instances of “sheep”. To balance the data, we applied techniques such as undersampling the majority class or oversampling the minority class.
After that, we applied different classifiers like logistic regression, random forest, and support vector machine (SVM) to classify the data based on the ‘Sample ID’ (Figure 7).
Because the results of classifiers’ applying are not sufficient, hyperparameter tuning was applied for each classifier. The tuned hyperparameters are given as follows:
  • Logistic Regression: Regularization parameter (C);
  • Random Forest: Number of trees (n_estimators) and maximum depth (max_depth);
  • SVM: Kernel type and regularization.
The following are the results of the hyperparameter tuning:
Logistic Regression:
Best Parameter: C = 10
Best Cross-Validation Score: 52.4%
Random Forest:
Best Parameters: max_depth = 20, n_estimators = 50
Best Cross-Validation Score: 75.3%
SVM:
Best Parameters: C = 10, kernel = ‘rbf’
Best Cross-Validation Score: 57.7%

4. Conclusions

This study successfully demonstrated the application of FTIR spectroscopy, combined with chemometric and machine learning techniques, in distinguishing between cow’s and sheep’s milk. The findings indicate that milk samples exhibit unique spectral differences, particularly in amide bands and associated wavelengths. These distinctions can be linked to varying fat and protein content between milk types, as evidenced by spectral intensity differences.
The decision tree and random forest models achieved high R2 values, underscoring their predictive accuracy for milk classification. Notably, nonlinear models, specifically tree-based ones, outperformed linear approaches due to their capacity to capture the complex relationships inherent in milk spectroscopic data. In particular, the random forest model achieved optimal cross-validation scores and predictive stability, confirming it as a robust option for future milk authentication efforts. This approach aligns with recent literature advocating for machine learning in food authentication, thus supporting this method’s validity for such applications.
This study identified limitations associated with balancing the dataset, as cow’s milk samples outnumbered those of sheep’s milk, potentially impacting model accuracy. The next phase will involve expanding the dataset to enhance model performance. Additionally, introducing unsupervised learning methods, such as artificial neural networks (ANNs), could further improve classification capabilities by capturing more nuanced patterns.
Overall, this work contributes valuable insights into milk authentication, supporting dairy producers in maintaining product integrity and addressing adulteration concerns. Future research could focus on refining the proposed methods, enhancing model scalability, and integrating these techniques into industry practice to reinforce the authenticity of dairy products.
In summary, this study utilized FTIR spectroscopy combined with chemometric and machine learning techniques to successfully distinguish between cow’s and sheep’s milk. The spectral differences observed, particularly in the amide I and II bands, along with differences in fat and protein content, provided a solid foundation for the classification models. Tree-based machine learning algorithms, such as decision trees and random forests, proved to be the most effective in accurately classifying the milk samples, making them ideal candidates for future applications in milk authentication and adulteration detection. This research sets the stage for further advancements in dairy product authentication and contributes to ensuring the integrity of regional dairy products in Poland and beyond.

Author Contributions

Conceptualization, R.D.; methodology, M.G., N.S. and R.D.; software, M.G. and N.S.; validation, M.G.; formal analysis, Ł.B.; investigation, R.D., M.G. and N.S.; resources, R.D.; data curation, M.G. and N.S.; writing—original draft preparation, R.D.; writing—review and editing, R.D., M.G., N.S. and Ł.B.; visualization, Ł.B.; supervision, R.D.; project administration, R.D.; funding acquisition, R.D. All authors have read and agreed to the published version of the manuscript.

Funding

This research was funded by SUP-RIM “The Research Network of Life Sciences Universities for the Development of the Polish Dairy Industry—Research Project” funded under the designated subsidy of the Minister of Science and Higher Education of Poland (MEIN/2023/DPI/2872).

Data Availability Statement

The original contributions presented in this study are included in the article.

Acknowledgments

The authors want to thank the whole team from OSM Nowy Sącz, especially Paweł Gruca, food technologist Magdalena Baczyńska, and Gabriel Wozniak (Noack Poland) for their software and technical support.

Conflicts of Interest

The authors declare no conflicts of interest.

References

  1. Grunert, K.G.; Aachmann, K. Consumer reactions to the use of EU quality labels on food products: A review of the literature. Food Control 2016, 59, 178–187. [Google Scholar] [CrossRef]
  2. Dias, C.; Mendes, L. Protected Designation of Origin (PDO), Protected Geographical Indication (PGI) and Traditional Speciality Guaranteed (TSG): A bibliometric analysis. Food Res. Int. 2018, 103, 492–508. [Google Scholar] [CrossRef] [PubMed]
  3. González-Domínguez, R. Food Authentication: Techniques, Trends and Emerging Approaches (Second Issue). Foods 2022, 11, 1926. [Google Scholar] [CrossRef] [PubMed]
  4. Feng, L.; Wu, B.; Zhu, S.; He, Y.; Zhang, C. Application of Visible/Infrared Spectroscopy and Hyperspectral Imaging with Machine Learning Techniques for Identifying Food Varieties and Geographical Origins. Front. Nutr. 2021, 8, 680357. [Google Scholar] [CrossRef] [PubMed]
  5. Huang, F.; Song, H.; Guo, L.; Guang, P.; Yang, X.; Li, L.; Zhao, H.; Yang, M. Detection of adulteration in Chinese honey using NIR and ATR-FTIR spectral data fusion. Spectrochim. Acta. Part A Mol. Biomol. Spectrosc. 2020, 235, 118297. [Google Scholar] [CrossRef] [PubMed]
  6. Taylan, O.; Cebi, N.; Yilmaz, M.T.; Sagdic, O.; Ozdemir, D.; Balubaid, M. Rapid detection of green-pea adulteration in pistachio nuts using Raman spectroscopy and chemometrics. J. Sci. Food Agric. 2021, 101, 1699–1708. [Google Scholar] [CrossRef] [PubMed]
  7. Didham, M.; Truong, V.K.; Chapman, J.; Cozzolino, D. Sensing the Addition of Vegetable Oils to Olive Oil: The Ability of UV–VIS and MIR Spectroscopy Coupled with Chemometric Analysis. Food Anal. Methods 2020, 13, 601–607. [Google Scholar] [CrossRef]
  8. Cubero-Leon, E.; Peñalver, R.; Maquet, A. Review on metabolomics for food authentication. Food Res. Int. 2014, 60, 95–107. [Google Scholar] [CrossRef]
  9. Nallan Chakravartula, S.S.; Moscetti, R.; Bedini, G.; Nardella, M.; Massantini, R. Use of convolutional neural network (CNN) combined with FT-NIR spectroscopy to predict food adulteration: A case study on coffee. Food Control 2022, 135, 108816. [Google Scholar] [CrossRef]
  10. Leo, M.; Sharma, S.; Maddulety, K. Machine learning in banking risk management: A literature review. Risks 2019, 7, 29. [Google Scholar] [CrossRef]
  11. Fuentes, S.; Torrico, D.D.; Tongson, E.; Viejo, C.G. Machine learning modeling of wine sensory profiles and color of vertical vintages of pinot noir based on chemical fingerprinting, weather and management data. Sensors 2020, 20, 3618. [Google Scholar] [CrossRef] [PubMed]
  12. Haque, E.; Taniguchi, H.; Hassan, M.M.; Bhowmik, P.; Karim, M.R.; Śmiech, M.; Zhao, K.; Rahman, M.; Islam, T. Application of CRISPR/Cas9 genome editing technology for the improvement of crops cultivated in tropical climates: Recent progress, prospects, and challenges. Front. Plant Sci. 2018, 9, 1–12. [Google Scholar] [CrossRef] [PubMed]
  13. Tian, H.; Xiong, J.; Chen, S.; Yu, H.; Chen, C.; Huang, J.; Yuan, H.; Lou, H. Rapid identification of adulteration in raw bovine milk with soymilk by electronic nose and headspace-gas chromatography ion-mobility spectrometry. Food Chem. 2023, 18, 100696. [Google Scholar] [CrossRef] [PubMed]
  14. ISO 13366-2:2006; Milk—Enumeration of Somatic Cells. International Organization for Standardization (ISO): Geneva, Switzerland, 2006.
  15. ISO 9622:2013; Milk and Liquid Milk Products—Guidelines for the Application of Mid-Infrared Spectrometry. International Organization for Standardization (ISO): Geneva, Switzerland, 2013.
  16. Sen, S.; Dundar, Z.; Uncu, O.; Ozen, B. Potential of Fourier-transform infrared spectroscopy in adulteration detection and quality assessment in buffalo and goat milks. Microchem. J. 2021, 166, 106207. [Google Scholar] [CrossRef]
  17. Gantner, V.; Mijić, P.; Baban, M.; Škrtić, Z.; Turalija, A. The overall and fat composition of milk of various species. Mljekarstvo 2015, 65, 223–231. [Google Scholar] [CrossRef]
  18. Roy, D.; Ye, A.; Moughan, P.J. Singh Harjinder: Composition, Structure, and Digestive Dynamics of Milk from Different Species—A Review. Front. Nutr. 2020, 7, 577759. [Google Scholar] [CrossRef] [PubMed]
  19. Cirak, O.; Icyer, N.C.; Durak, M.Z. Rapid detection of adulteration of milks from different species using Fourier Transform Infrared Spectroscopy (FTIR). J. Dairy Res. 2018, 85, 222–225. [Google Scholar] [CrossRef] [PubMed]
Figure 1. Overlaid FTIR spectra of sheep’s milk samples (X—cm−1; Y—Absorbance).
Processes 13 00518 g001
Figure 2. Identification of characteristic wavelengths for milk using statistical methods. Sheep’s milk—blue line; cow’s milk—orange line.
Processes 13 00518 g002
Figure 3. Prediction task solving based on the CART algorithm. (a) Sheep dataset; (b) cow dataset.
Processes 13 00518 g003
Figure 4. Comparison of the determined characteristic wavelengths and absorbance values for cow’s milk and sheep’s milk, with the marked standard deviation. Sheep’s milk—blue columns; cow’s milk—orange columns; a, b—the average values on bars marked with different letters are significantly different (p ≤ 0.05), LSD.
Processes 13 00518 g004
Figure 5. Dendrogram of a cluster analysis (Ward’s algorithm) of FT-IR spectra combined with physicochemical parameters from cow’s and sheep’s milk samples.
Processes 13 00518 g005
Figure 6. Sequential plot of data for the type of milk and the parameters studied.
Processes 13 00518 g006
Figure 7. Comparative analysis of the results of applying different ML algorithms.
Processes 13 00518 g007
Table 1. Mean values of the studied parameters with standard deviation (SD) obtained by the FTIR spectroscopy. Values in the same column marked with different letters are significantly different (p < 0.05).
SampleFat
(% m/m)
SDProtein
(% m/m)
SDLactose
(% m/m)
SDExtract
(% m/m)
SD
Cow’s milk2.81 a1.283.30 a0.084.73 a0.1411.52 a1.26
Sheep’s milk6.49 b2.984.47 b1.234.56 b0.3916.59 b3.36
Note: Extract means solids not fats.
Table 2. Data for variables: parameters on the PC1 loadings.
ParameterFatProteinLactoseExtractI 1050I 1076I 1118I 1157I 1250I 1323
PC1−1.0−1.01.0−1.0−1.0−1.0−1.0−1.0−1.0−1.0
Table 3. Data for milk type based on the PC1 scores.
Milk TypePC1
Cow2.64575
Sheep−2.64575
Table 4. Machine learning (ML) method implemented in research.
Dataset TypeModelR2
SheepDecision tree0.9766
Random forest0.9778
Linear regression0.0188
Support vector machine with a linear kernel−0.828
Support vector machine with a polynomial kernel0.027
Support vector machine with a radial-basis function0.621
KNN with k = 30.965
KNN with k = 50.961
KNN with k = 70.944
CowDecision tree0.9798
Random forest0.9801
Linear regression0.0415
Support vector machine with a linear kernel−0.102
Support vector machine with a polynomial kernel0.056
Support vector machine with a radial-basis function0.603
KNN with k = 30.970
KNN with k = 50.966
KNN with k = 70.951
Disclaimer/Publisher’s Note: The statements, opinions and data contained in all publications are solely those of the individual author(s) and contributor(s) and not of MDPI and/or the editor(s). MDPI and/or the editor(s) disclaim responsibility for any injury to people or property resulting from any ideas, methods, instructions or products referred to in the content.

