Article

Effect of Spirulina Microalgae Powder in Gluten-Free Biscuits and Snacks Formulated with Quinoa Flour

1
Department of Food Technology, Food Industries and Nutrition Research Institute, National Research Centre, Cairo 12622, Egypt
2
Home Economics Department, Faculty of Specific Education, Menoufia University, Menoufia 32951, Egypt
3
Core Research Equipment and Instrument Training (CREAIT), Core Science Facility, Memorial University of Newfoundland, 45 Arctic Ave., St. John’s, NL A1C 5S7, Canada
4
Department of Food Engineering and Process Management, Institute of Food Sciences, Warsaw University of Life Sciences—SGGW, 02-787 Warsaw, Poland
*
Authors to whom correspondence should be addressed.
Processes 2025, 13(3), 625; https://doi.org/10.3390/pr13030625
Submission received: 19 January 2025 / Revised: 17 February 2025 / Accepted: 20 February 2025 / Published: 22 February 2025

Abstract

:
This study evaluated the effects of incorporating spirulina algae powder (SAP) at 3%, 6%, and 9% into quinoa flour (QF) blends to produce gluten-free biscuits and snacks, compared to a 100% QF control. The chemical composition, mineral and amino acid content, antioxidant capacity, starch gelatinization, color, baking quality, sensory properties, and texture were analyzed. SAP was found to have high protein (62.50%), fat (5.92%), and ash (12.90%) content. Increasing the SAP concentration in QF blends resulted in a dose-dependent enhancement in the nutritional value of the biscuits and snacks. Farinograph analysis indicated a positive relationship between SAP percentage and water absorption. The inclusion of SAP significantly altered differential scanning calorimetry (DSC) and viscoamylograph parameters. Biscuit weight, volume, and specific volume decreased with increasing SAP levels. Hunter color measurements showed a SAP concentration-dependent darkening effect, which was supported by sensory assessments. The 9% SAP biscuits and snacks exhibited the greatest antioxidant activity, with DPPH values of 50.18 and 43.6 µmol/g, respectively, and reducing power values of 41.49 and 36.58 µmol/g, respectively. Overall, while all samples were deemed acceptable, the 3% and 6% SAP formulations generally demonstrated better sensory characteristics and improved nutritional profiles, suggesting their potential as suitable options for individuals with gluten sensitivities.

1. Introduction

The market for protein and antioxidant-rich foods is expanding as consumers increasingly seek health benefits beyond basic nutrition [1,2]. Manufacturers are incorporating functional ingredients into snack products to meet this demand and enhance the health benefits of their offerings [2].
Quinoa flour (QF) stands out as a superfood due to its higher protein content and more balanced amino acid composition compared to traditional grain flours. QF typically contains around 16.4% protein, 75.82% carbohydrates, 3.38% fiber, and 13.4% fat [3,4]. It is also rich in minerals such as phosphorus, magnesium, iron, and copper, as well as vitamins and antioxidant molecules [5,6]. Since QF is inherently gluten-free, it can be effectively utilized as a healthy substitute component in the creation of functional gluten-free products, catering to consumers with dietary restrictions [7]. However, QF may require supplementation with other ingredients, especially in baked goods, to improve its functional properties.
Spirulina platensis (SP) is a cyanobacteria recognized for its exceptional nutritional profile [8]. It is a rich source of essential fatty acids, vitamins, minerals, and protein, with protein content ranging from 46% to 63% [9,10]. The essential amino acids in SP protein are comparable to those found in animal-derived proteins, making it a valuable addition to food products [11]. SP has been extensively studied for its health benefits as a dietary supplement, including its hypolipidemic effects, which help manage cholesterol levels [12], have potential anti-cancer properties [13], and have protective effects against obesity and diabetes [14,15]. Moreover, SP contains antioxidants such as phycocyanin, which has anti-inflammatory properties and may help protect against cell damage [16,17]. The high nutritional value and potential health benefits of SP make it a desirable ingredient for enriching food items such as pasta [7,18], snacks [19,20], and baked goods [21,22,23], boosting their protein, mineral, and antioxidant content and appealing to health-conscious consumers.
This study evaluates the feasibility of employing SAP as an innovative functional food ingredient in snacks and biscuits, focusing on improving sensory qualities, overall quality, nutritional value, and bioactive components. By incorporating QF and SAP, this work aims to provide more sustainable, nutritious, and inclusive food options for a diverse range of consumers, particularly those with dietary restrictions such as celiac disease. This research contributes to the development of nutrient-dense foods that meet the growing demand for healthier alternatives.

2. Materials and Methods

2.1. Materials

Spirulina algae powder (SAP) was purchased from Nourelhooda Co., Cairo, Egypt, and was stored in a cool, dry, dark environment in a polypropylene bag covered with aluminum. Quinoa seeds were sourced from the Agricultural Research Centre, Giza, Egypt. Other ingredients were purchased from the local market in Cairo, Egypt.

2.2. Methods

2.2.1. Preparation of Quinoa Flour

To produce whole quinoa flour (QF), quinoa seeds were cleaned, washed, dried to 15% moisture content, and ground in a Quadrumat Junior flour mill.

2.2.2. Preparation of Mixture

QF was blended with SAP at 0%, 3%, 6%, and 9% concentrations. Preliminary experiments determined these concentrations to be optimal for biscuit and snack production, balancing quality attributes and economic feasibility for potential industrial applications. All samples were stored at 5–7 °C in sealed containers until use.

2.2.3. Rheological Properties

The amylograph test was used to assess the rheological characteristics of doughs following AACC (2000) [24].

2.2.4. Thermal Properties

Starch gelatinization was analyzed using a 1:3 (w/v) starch–water solution in a differential scanning calorimeter (Mettler Toledo DSC 823-E, Zürich, Switzerland) with a 50 mL/min nitrogen flow.

2.2.5. Preparation and Evaluation of Baking Quality and Sensory Properties of Biscuits

The biscuits were prepared using a base of 100 g QF or QF blended with 3%, 6%, and 9% SAP. The formula included 100 g flour, 35 g sucrose, 28 g shortening, 30 g egg, 0.93 g salt, 1.11 g sodium bicarbonate, and 1 g vanilla. QF and SAP blends were mixed with the other ingredients, and a sucrose solution (5.93%) and water were added based on AACC (2000) [24] guidelines. Biscuits were baked for 15 min at 200 °C. Weight, volume, specific volume, diameter, thickness, and spread ratio were recorded in triplicate. Sensory analysis of each formula was conducted by 15 trained panelists who rated overall acceptability, color, texture, taste, odor, and appearance using a 10-point hedonic scale (0 = dislike extremely; 5 = neutral; 10 = like extremely) for each sensory feature [25].

2.2.6. Preparation and Sensory Evaluation of Snacks

Snacks were prepared using QF as a control and QF blended with SAP at 3%, 6%, and 9%. The dough was sheeted, cut into circles, and baked for one minute at 250 °C. Then, the snacks were deep-fried in sunflower oil for one minute at 160 °C, drained, and cooled before sensory assessment, as described previously.

2.3. Color Determinations

Color measurements were conducted for both raw materials and finished products (snacks and biscuits) using a Hunter color meter (Hunter, Lab Scan XE, Reston, VA, USA). Color intensity was assessed and displayed based on the parameters of a* (redness), b* (yellowness), and L* (brightness).

2.4. Analytical Methods

2.4.1. Proximate Composition

The moisture, ash, fat, and protein contents of all samples were determined according to AACC (2000) [24] methods. Carbohydrate content was calculated by the difference. Mineral content (Ca, P, K, Na, Fe, and Zn) was measured following the procedure of Hussein et al. [7]. The amino acid profile was assessed as reported by Zaky et al. [26] and expressed as g/100 g of dry weight protein.

2.4.2. Texture Analysis

Texture Profile Analysis (TPA) was performed using a texturometer (Brookfield model-CT3–10 kg, New York, NY, USA) with a cylinder probe (TA-AACC36). The assessed parameters included hardness, adhesiveness, resilience, cohesiveness, springiness, gumminess, and chewiness.

2.5. Statistical Analysis

All tests were performed in triplicate. Results are presented as means ± SD. The obtained results were assessed statistically using analysis of variance (ANOVA) and the least significant difference (LSD) test (p < 0.05).

3. Results and Discussions

3.1. Thermal Properties of QF and Their Blends with SAP

The gelatinization characteristics determined by DSC are shown in Table 1. The DSC parameters that were recorded included the enthalpy of gelatinization (ΔH), the gelatinization temperature range (Te-To), the final temperature (Te), the peak temperature (Tp), and the onset temperature (To). The starch samples had different gelatinization temperatures and enthalpy values linked to the gelatinization endotherms. For quinoa flour (QF), the values were as follows: To at 59.55 °C, Tp at 102.56 °C, and Te at 144.60 °C. For QF with 3% SAP, To was 30.21 °C, Tp was 72.70 °C, and Te was 121.65 °C; for QF with 6% SAP, To was 33.69 °C, Tp was 79.14 °C, and Te was 131.76 °C; and for QF with 9% SAP, To was 69.73 °C, Tp was 62.13 °C, and Te was 73.85 °C. The gelatinization temperature ranges (Te-To) were 85.05 °C, 91.44°C, 97.09 °C, and 4.12 °C for QF; with QF having 3% SAP, 6% SAP, and 9% SAP, respectively. These results indicate that the addition of SAP significantly altered the gelatinization characteristics of quinoa flour. DSC is an established technique for the determination of thermal characteristics of starches [27]. The DSC endotherm of starch does not represent complete starch gelatinization. Since amylopectin has a major impact on the crystallinity of starch granules, the gelatinization temperature is considered an indicator of crystallite perfection. Amylose decreases the energy needed to start the gelatinization process and lowers the melting point of the crystalline areas [28]. The absence of amylose-rich amorphous regions increases the energy necessary to begin melting. According to this association, starches with a higher amylose content have lower endothermic enthalpy and gelatinization temperatures because they contain more amorphous regions and fewer crystalline areas. Gelatinization onset and peak temperatures were significantly different for native and blended starches with the same amylose concentration. Variations in homogeneity cause native and blended starches to have different gelatinization characteristics [29]. According to Svoboda et al. [30], a wide temperature range points to a sizable number of crystals with different levels of stability. Furthermore, the molecular structure of the crystalline zone influences DSC values; this relates to the distribution of short amylopectin chains rather than the expansion of the crystalline region linked to amylose [31].

3.2. Viscoamylograph Measurements

The amylograph estimates the viscosity changes in a flour–water suspension as the temperature increases at a constant rate. The starch’s gelatinization properties and α-amylase activity are linked to the height of the amylogram peak, which indicates the starch’s ability to swell and gelatinize during heating [32].
As displayed in Table 2, the temperature of transition, maximum viscosity, breakdown viscosity, and set-back viscosity of the dough were all determined by rheological evaluation using a viscoamylograph. The findings showed that the highest temperatures of transition were recorded for QF, followed by QF with 3% SAP, QF with 6% SAP, and QF with 9% SAP, which were 63 °C, 61.5 °C, 49 °C, and 48 °C, respectively. Furthermore, the maximum viscosity values were 1180 BU, 1140 BU, 1060 BU, and 1580 BU for QF, including QF with 3% SAP, QF with 6% SAP, and QF with 9% SAP, respectively. The highest peak viscosity was observed in QF with 9% SAP, which might be attributed to its decreased amylase activity. Peak viscosity is typically thought of as a measure of the amount of α-amylase activity in the flour; a lower peak viscosity indicates a higher degree of α-amylase activity. However, in this instance, it may be that other factors (e.g., starch granule size distribution, protein content, and the presence of other polysaccharides) influence viscosity more strongly than amylase activity [33]. These findings are consistent with those of Frauenlob et al. [34] and Wang et al. [35], who discovered that long-grain rice flour had the highest peak viscosity and wheat flour had the lowest. Corn flour, on the other hand, displayed a peak viscosity that was intermediate [36]. The same table reveals that the pasting temperature values were 110 °C, 105 °C, 70.5 °C, and 76.5 °C for QF, including QF with 3% SAP, QF with 6% SAP, and QF with 9% SAP, respectively. QF with 9% SAP showed the highest values for breakdown viscosity and set-back viscosity at 1600 BU and 2540 BU, respectively.

3.3. Proximate Composition of Raw Materials, Biscuits and Snacks

Table 3 and Table S1 present the proximate composition of QF, SAP, biscuits, and snacks with varying levels of algae (3%, 6%, and 9%). According to the results of the proximate analysis, the SAP sample had the following composition: 5.16% moisture, 62.50% crude protein, 5.92% fat, 12.90% ash, 4.52% fiber and 14.16% carbohydrates. These results are in line with those of earlier research on the chemical composition of SAP by Soni [37], Şahin et al. [22], Farg et al. [38], and Hussein et al. [7].
QF was analyzed, revealing the following parameters: moisture (8.69%), protein (15.79%), fat (4.09%), ash (2.04%), crude fiber (2.21%), and total carbohydrates (75.87%). The current results align with those of Jancurová et al. [39], Vega-Galvez et al. [40], and El Sohaimy et al. [41], which demonstrated that quinoa has a protein value comparable to that of casein in milk. Consequently, increasing the mixing level of SAP (3–9%) with QF enhanced the nutritional value of the biscuits and snacks. For the biscuits, the nutrient composition ranged from 15.00% to 20.67% for protein, 31.97% to 32.25% for fat, 2.09% to 3.68% for ash, 1.93% to 2.60% for fiber, and 49.01% to 40.80% for carbohydrates. For the snacks, the ranges were 15.74% to 19.46% for protein, 13.01% to 14.01% for fat, 2.21% to 3.75% for ash, 2.02% to 2.04% for fiber, and 67.01% to 60.74% for carbohydrates. It was also noted that the biscuits and snacks made with the mixture of SAP and QF exhibited similarities to those reported by several other authors [42,43,44].

3.4. Mineral Contents of Raw Materials and Their Products

Table 4 and Table S2 present the mineral content analysis of raw materials and their products. The findings show that SAP contains higher levels of the analyzed minerals compared to QF. The mineral content was assessed for the control sample, which is a biscuit made entirely from QF, as well as for QF supplemented with SAP at 3%, 6%, and 9% levels. The results indicate a gradual increase in mineral concentration across all samples. This increase from the control sample (100% QF) to the samples with SAP supplementation (3% to 9%) suggests that SAP has a higher mineral content than QF. A similar trend was seen with the snack control (100% QF) and the QF samples enriched with SAP at the various levels. These results are consistent with those of Culetu et al. [45], Hussein et al. [7], and Masten Rutar et al. [46].

3.5. Amino Acid Composition

The amino acid profile of SAP, shown in Table S3, indicates a significant presence of both essential and nonessential amino acids. Leucine was identified as the predominant essential amino acid, while alanine was the most abundant nonessential amino acid in SAP. Conversely, histidine and cysteine were found to be the least prevalent essential and nonessential amino acids, respectively. According to the FAO and WHO standards for ideal protein composition, SAP ranks among the highest in protein content due to its ample supply of essential amino acids [11]. Enriching QF with varying concentrations of SAP (3%, 6%, and 9%) improves the chemical composition of the resulting biscuits and snacks (Table 5). With each increase in SAP supplementation, the protein content of all samples also rose. As a result, the biscuits and snacks developed in this study can be considered functional foods, being high in protein and minerals, particularly calcium and iron. Previous investigations have demonstrated that adding SAP in the range of 1.5% to 6% enhances the protein and mineral content of food products [47,48].

3.6. Total Phenolic Content (TPC) and Antioxidant Capacity

Table 6 and Table S4 present the phytochemical analyses of QF, SAP, biscuits, and snacks. The results reveal total phenol content values of 13.65 mg for QF, 1.40 mg for SAP, 1.45 mg for biscuits made from 100% QF, and 1.42 mg for snacks made from 100% QF. The phenolic content for both the control and fortified samples is also shown in Table 6. Notably, the data indicate a significant increase in phenolic content in the enhanced biscuits and snacks as the levels of SAP increase, reaching peak values of 3.25 mg/g in biscuits and 2.90 mg/g in snacks at the 9% addition level. Phenolic compounds are receiving considerable attention because of their antioxidant abilities [49,50]. The total antioxidant capacity measured by DPPH was 80.20 µmol/g for QF and 35.69 µmol/g for SAP, while the reducing power was 64.8 µmol/g for QF and 32.25 µmol/g for SAP. The same table indicates that SAP had higher values for TPC, DPPH, and reducing power compared to QF. The phenolic content of the SAP extract was found to be 13.65 mg/g, consistent with findings from previous studies by Finamore et al. [51]. Differences between our results and other studies may be attributed to factors such as the species of algae, environmental circumstances, and the origin and attributes of the samples used. Nevertheless, many studies suggest that SAP is a promising source of phenolic compounds that could be utilized in the food and pharmaceutical sectors. The findings in Table 6 show a substantial increase in the phenolic content in biscuits and snacks enriched with Spirulina, with an approximately fourfold increase at the 9% level compared to the control. At the 3% level, there was about a twofold increase in phenolic content for both biscuits and snacks. These findings align with prior research by De Marco et al. [52] and Fradinho et al. [53], which similarly found that cooked pasta enhanced with Spirulina biomass had a higher total phenolic content. The phenolic content present in the cereal grain might be the cause of its strong antioxidant activity [54]. The enhanced antioxidant activity observed in the enriched biscuit and snack samples may be attributed to the high levels of antioxidants present in SAP, including γ-linolenic acid, carotenoids, and vitamins [55].
The antioxidant activity of the biscuit and snack samples was assessed using DPPH activity and reducing power, as displayed in Table 6. The incorporation of Spirulina into the biscuit and snack formulations significantly increased antioxidant capability compared to the control. Both assays employed in this study, DPPH and reducing power, demonstrated high antioxidant ability at the 9% level, with concentrations of 50.18 and 43.6 µmol/g for biscuits, and 41.49 and 36.58 µmol/g for snacks. These results are consistent with findings by Fradinho et al. [53], who noted that fortifying pasta with Spirulina enhances its antioxidant properties compared to untreated samples.

3.7. Color Attributes of Raw Materials, Biscuits and Snacks

Color is a vital sensory attribute that directly influences consumer preference for any product, particularly in the bakery sector, where it is essential to capture consumer attention. As illustrated in Table 7, the color parameters of the raw materials and the biscuit and snack samples were assessed using a Hunter laboratory colorimeter.
The mixtures of QF and SAP at various levels were found to be darker than the control (100% QF), with lightness (L*) decreasing as the percentage of SAP increased. Conversely, the yellowness (b*) and redness (a*) values increased with the higher levels of SAP. The data in the same table indicate that the Hunter values for whiteness (L*), redness (a*), and yellowness (b*) were measured for the upper surfaces of the biscuits. All fortified samples with SAP exhibited slightly lower L* values for the upper surfaces of the biscuits compared to the control. A similar trend was observed in the snacks: increasing the percentage of SAP added to QF slightly reduced the whiteness (L*) and redness (a*) values, while yellowness (b*) increased in all fortified samples compared to the control.

3.8. Baking Quality of Biscuits

The physical characteristics of the biscuits, such as weight, volume, specific volume, thickness, diameter, and spread ratio, were influenced by the increasing levels of SAP substitution (Table 8). The addition of SAP to QF led to again increase in biscuit weight, while the volume, specific volume, diameter, and thickness decreased. However, the spread ratio of the biscuits after baking increased up to 6% compared to that of the control sample. Overall, understanding how SAP influences the physical characteristics of biscuits is crucial for developing products that are both nutritious and appealing to consumers. By optimizing formulations, manufacturers can leverage the benefits of functional ingredients while delivering high-quality baked goods.

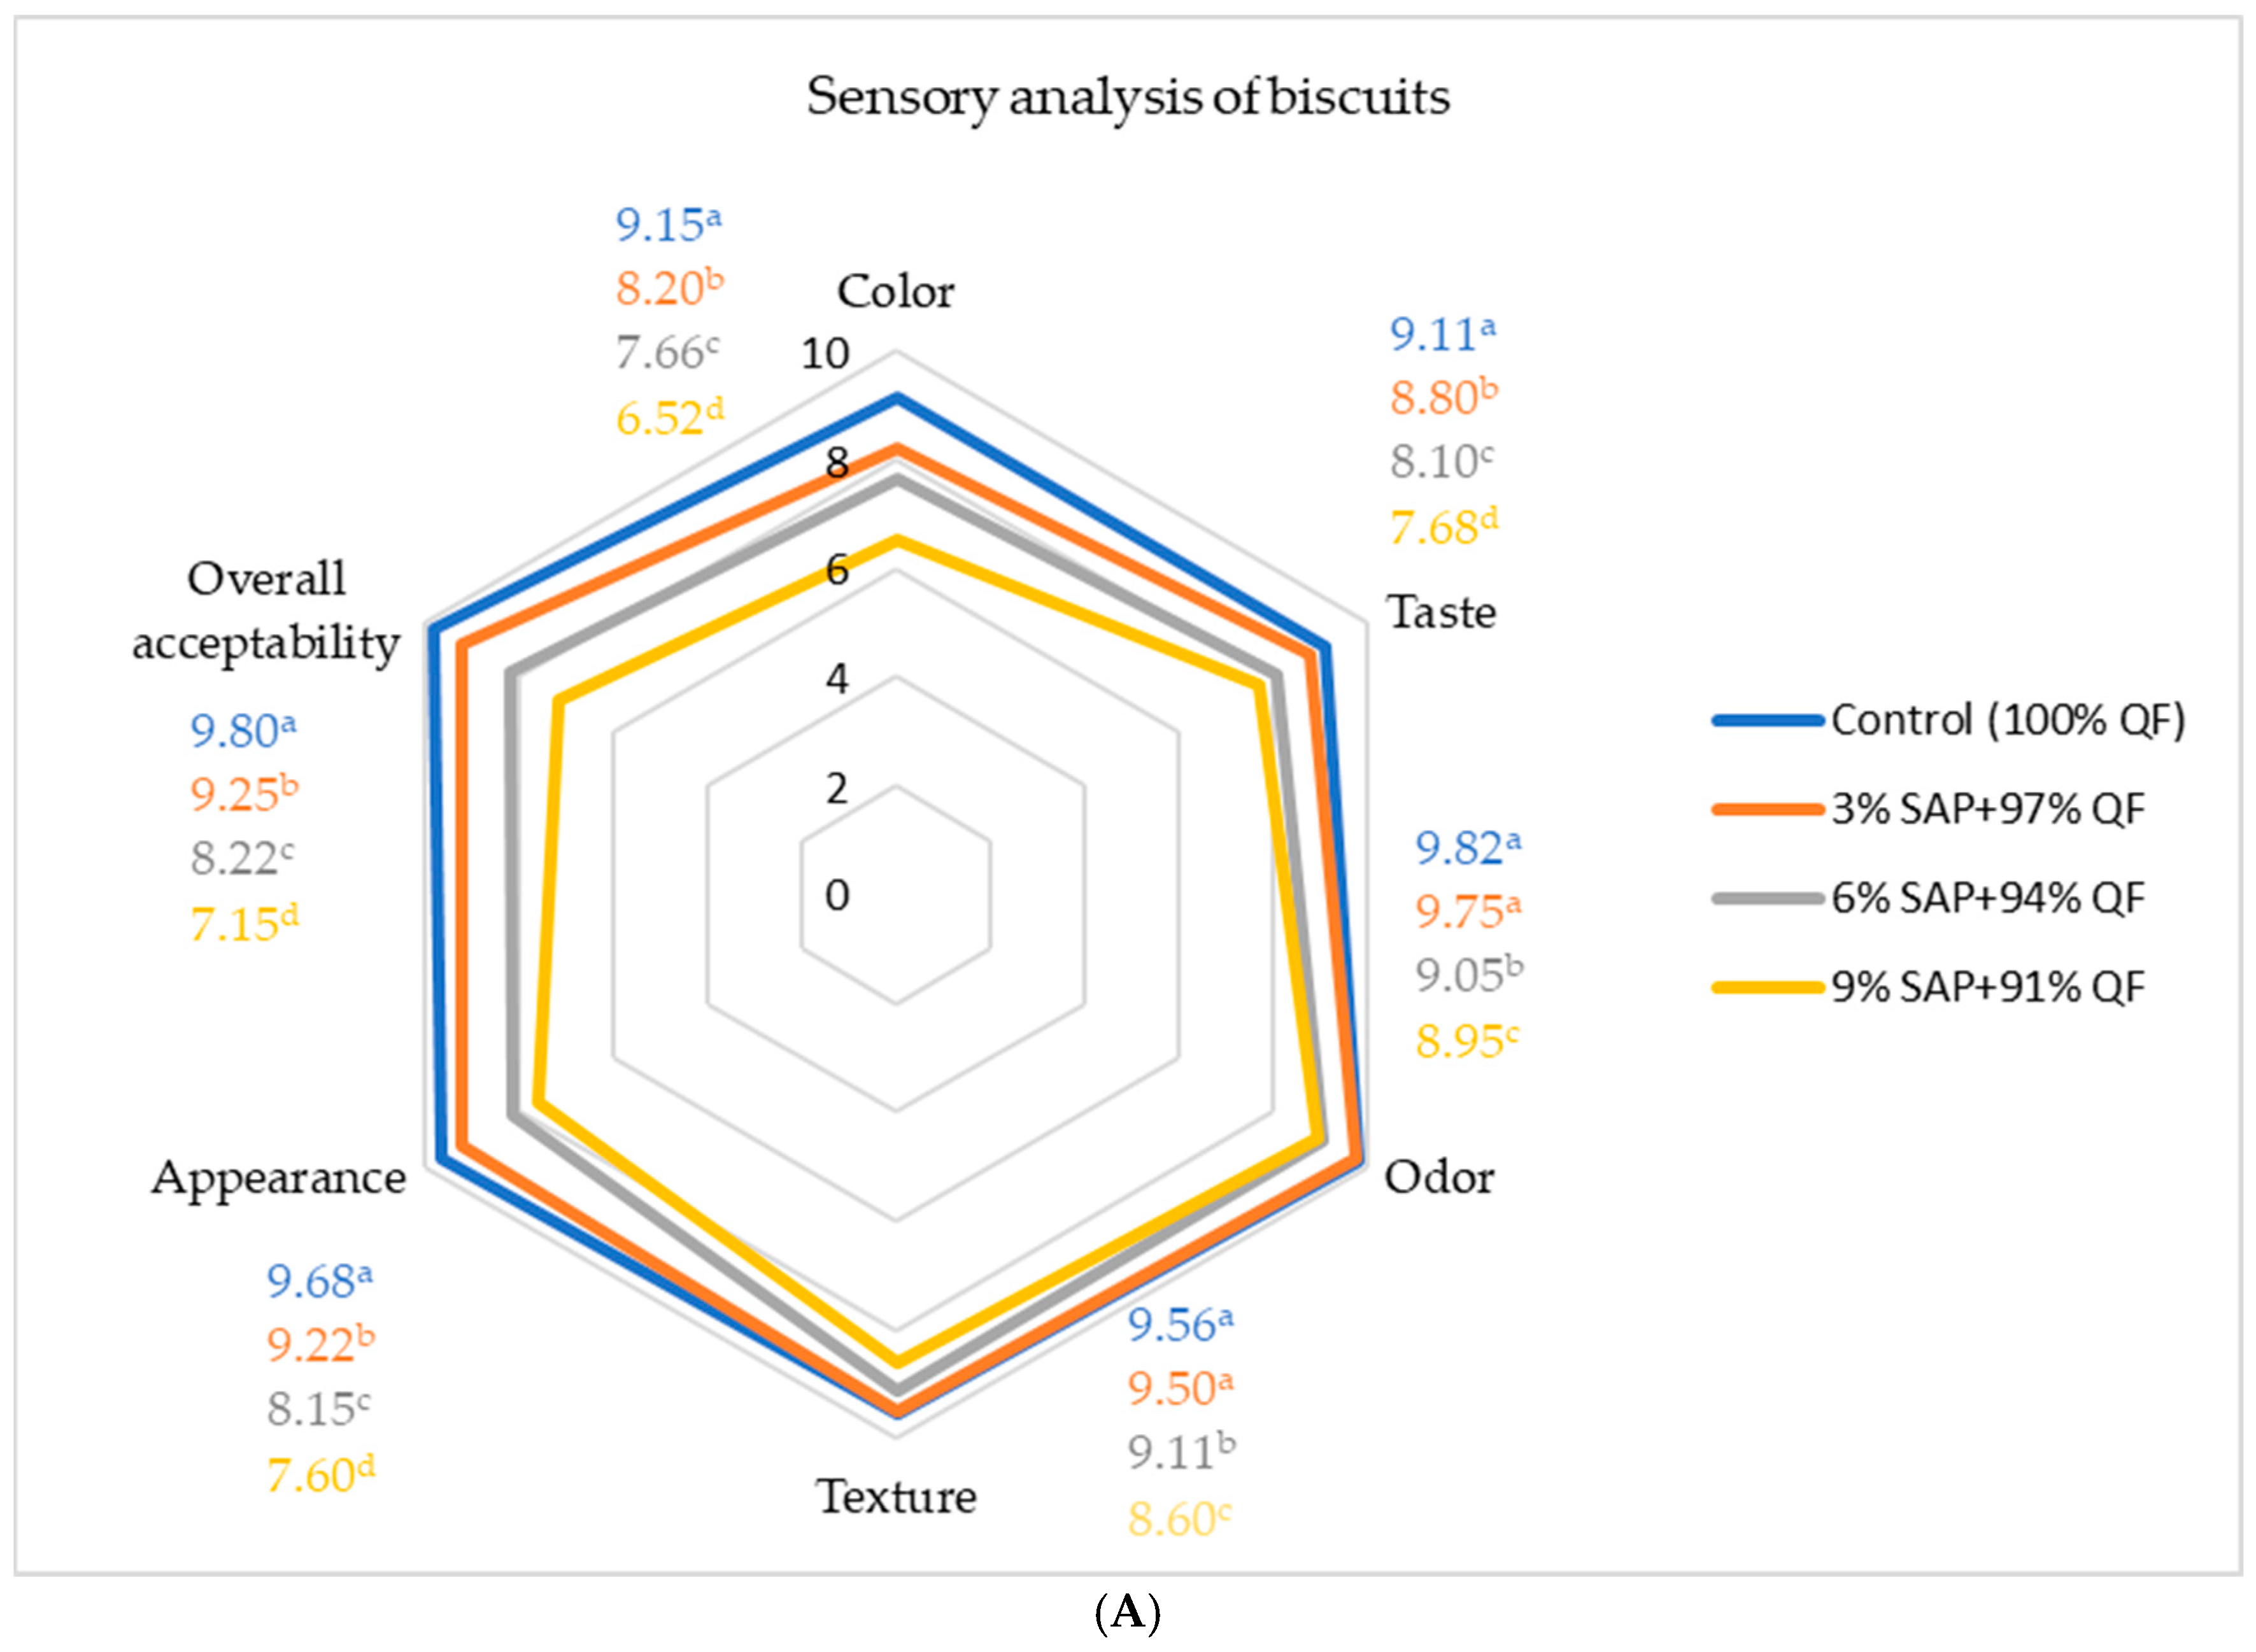
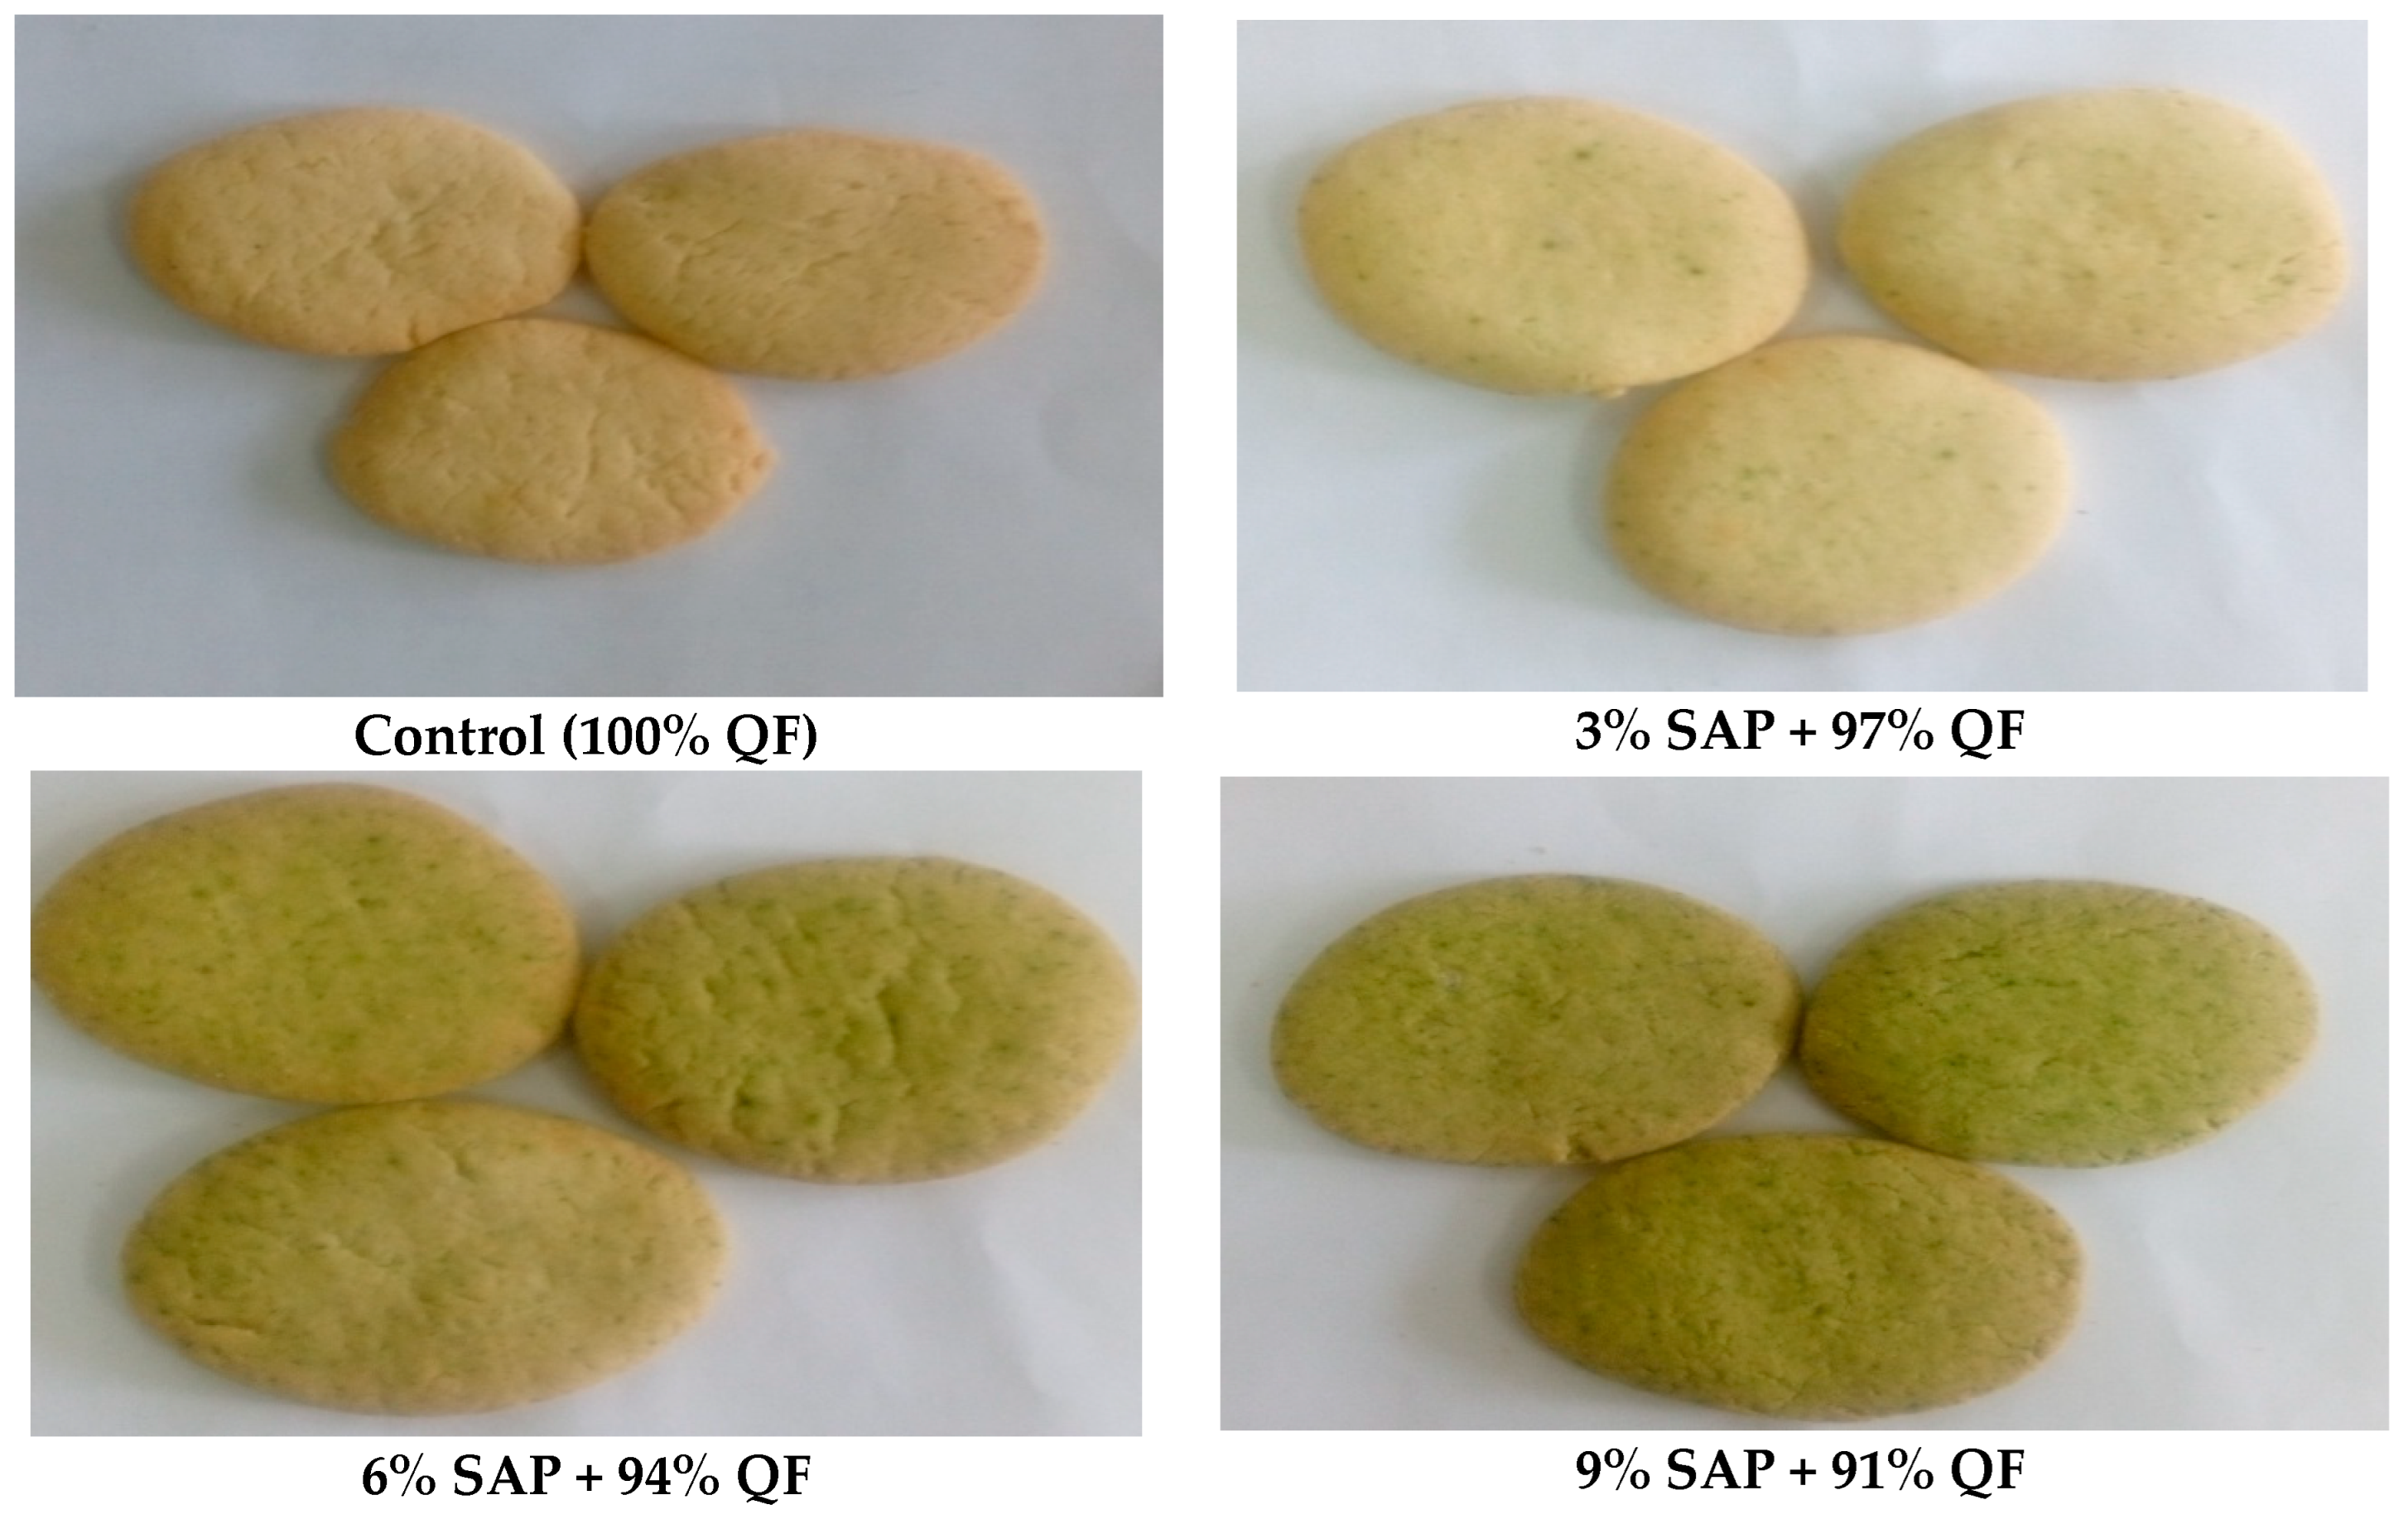
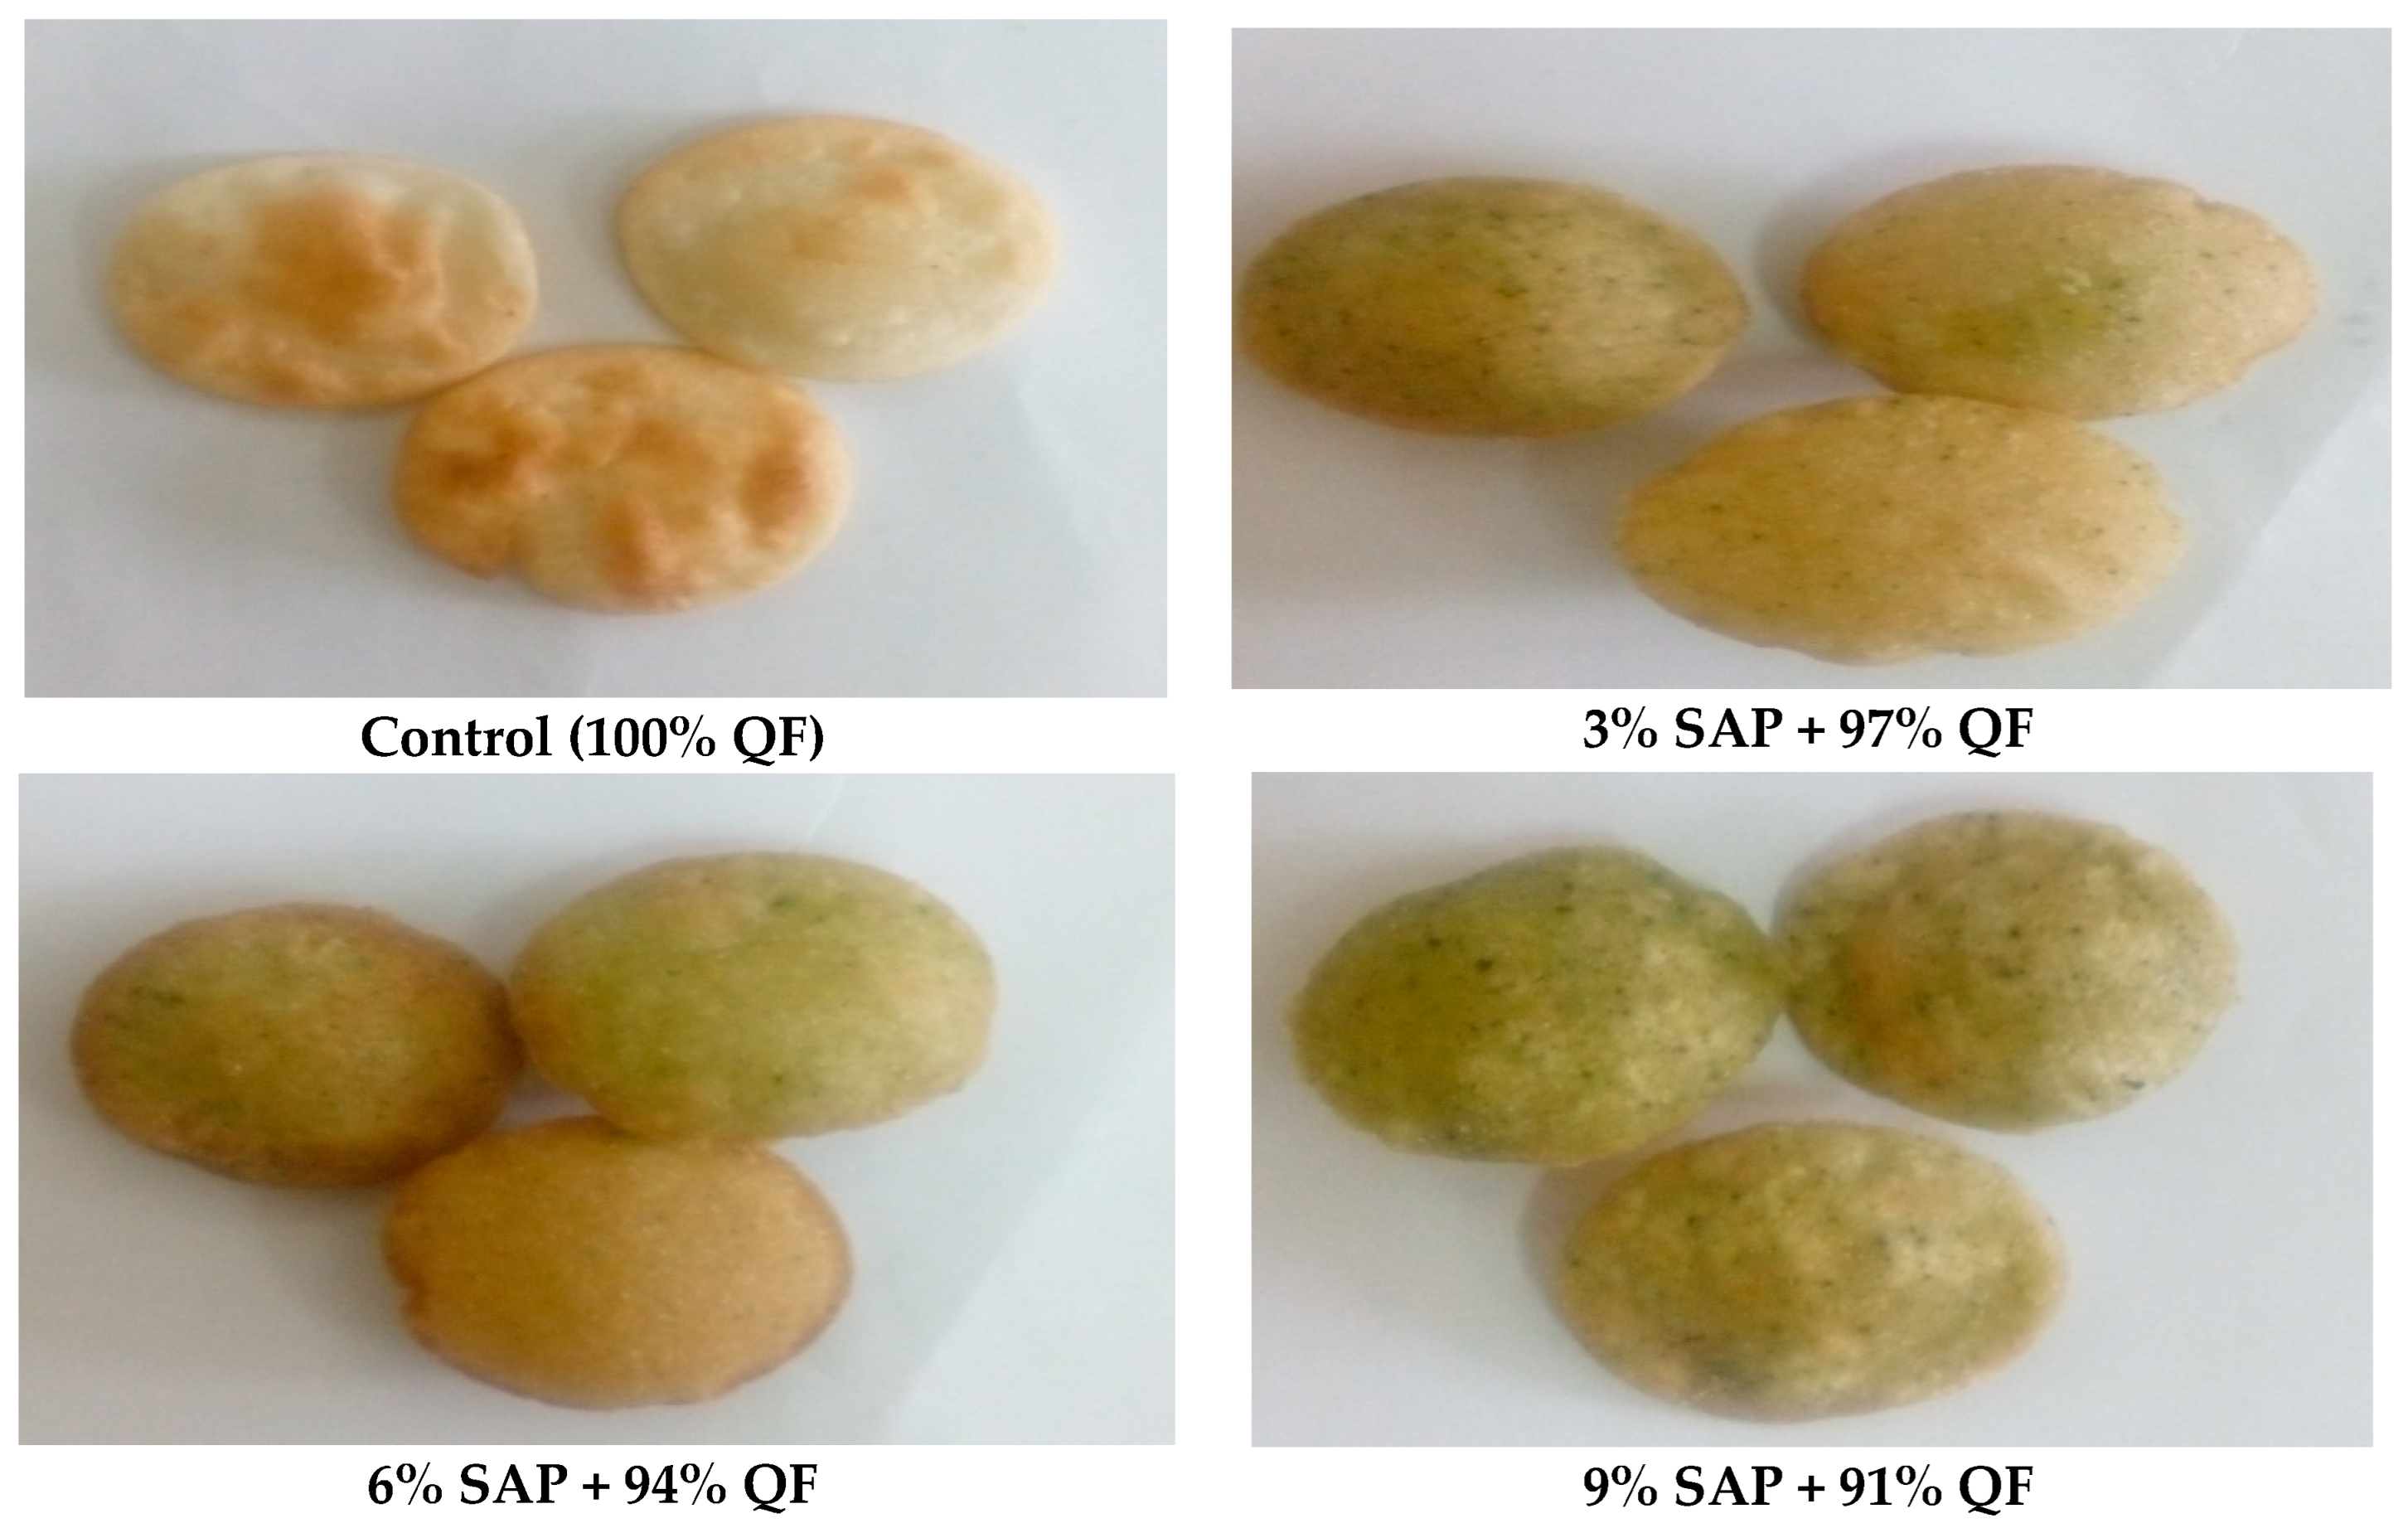
3.9. Organoleptic Properties of Biscuits and Snacks

Sensory assessment is considered one of the limiting aspects of consumer acceptability for organoleptic qualities such as color, taste, odor, texture, appearance, and overall acceptability. The impact of SAP on the sensory qualities of biscuits and snacks is shown in Figure 1A,B and Figure 2. The sensory scores for biscuits and snacks’ color, taste, odor, texture, appearance, and overall acceptability all declined as the concentration of SAP in the formulation increased. The data showed that all attributes for every experimental product had significant (p < 0.05) variations. When compared to the other tested items, the biscuit prepared from the combination containing 9% SAP scored lower on most attributes. In addition, it was revealed that biscuits and snacks had the lowest overall acceptance scores (7.15 and 7.24, respectively). The highest overall acceptability scores of biscuits and snack were registered for the control (100% QF). In contrast, the findings demonstrated that all samples that had 9% SAP were given lower scores in the sensory qualities, particularly color and appearance. The results of the physical characteristics of the snacks also supported these findings. Ultimately, the results indicate that biscuits and snacks can be enriched with SAP at levels of 3% or 6% without negatively impacting their sensory acceptance. Consequently, we were restricted to processing biscuits and snacks utilizing only 9% SAP. The organoleptic property outcomes are consistent with those of Aktas et al. [56], Alam et al. [57], Lucas et al. [58], and Raja et al. [59], who discovered that the sensory qualities of biscuits and snacks were enhanced by the inclusion of protein and fiber sources. Based on the sensory acceptability rating, our results suggest that QF can be combined with SAP in biscuits and snacks without major impacts on sensory quality at lower concentrations. However, higher concentrations of SAP may compromise consumer acceptance. Overall, our study mainly focused on trained panel assessments. Future research should incorporate broader consumer feedback to provide more comprehensive insights into the sensory acceptability of SAP-enriched products. Additionally, the processing limitations encountered with high SAP concentrations highlight the need for optimizing formulations to balance nutritional benefits with sensory appeal.

3.10. Texture Parameters of Biscuits and Snacks

The texture parameters of biscuits and snacks prepared from QF and SAP at different concentrations (3%, 6% and 9%) are given in Table 9. Texture parameters mainly include hardness (n), deformation at hardness (mm), deformation at hardness (%), hardness work (mJ) and fracturability with 1% of load sensitivity (N). These texture parameters of the biscuits and snacks were determined as the maximum force offered by the sample during shearing in a texture-testing machine (Instron). The findings revealed that the hardness (n) of each biscuit sample varied from 100.99 to 21.32 N. Conversely, a biscuit lacking SAP had a higher hardness due to its low moisture content, which also meant that more work was carried out. The hardness of the biscuit is visible to consumers, which may be related to the product’s cell structure and expansion regardless of feed moisture content. These findings are consistent with those of Alam et al. [57], Lucas et al. [58], Onacik-Gür et al. [60], and Su et al. [61]. Based on the texture profile analysis data, it was possible to determine that adding SAP at varying levels (3%, 6%, and 9%) reduced the biscuit’s hardness (N), hardness work (mJ), fracturability, and deformation at hardness (mm, %), with 1% load sensitivity (N). Also, when the SAP level in the biscuit formulations was raised, the hardness value dropped. Conversely, adding QF and SAP raised the snacks’ hardness value.

4. Conclusions

According to the results, the chemical composition of the produced biscuits and snacks was improved by adding SAP to QF at varying concentrations (3%, 6%, and 9%). With an increase in SAP concentration, the protein, fat, ash, and fiber contents of the biscuit and snack samples increased. Additionally, the hardness value decreased as the SAP level in the biscuit formulations increased. On the other hand, the hardness value of the snacks increased when QF was added with SAP. According to the sensory acceptability assessment, SAP can be incorporated into QF in biscuits and snacks without significantly affecting the sensory quality at lower levels (3% or 6%). Nevertheless, higher levels of SAP (9%) may impact consumer acceptance due to decreased scores in sensory attributes such as color, taste, and appearance. These findings imply that the prepared biscuits and snacks have potential as nutritious products, particularly for individuals with dietary restrictions like celiac disease, given their high mineral and protein content. However, to fully establish them as functional foods, further research is needed to comprehensively validate their health benefits. The ability to enhance nutritional content without compromising sensory appeal at lower SAP concentrations offers food manufacturers opportunities to develop healthier, gluten-free products that meet consumer demand for nutritious options. Although our outcomes are promising, additional studies are necessary to fully validate the health benefits of these SAP-Enriched products. This could involve clinical trials or broader consumer studies to assess their impact on nutritional status and consumer acceptance.

Supplementary Materials

The following supporting information can be downloaded at https://www.mdpi.com/article/10.3390/pr13030625/s1, Table S1. Chemical Composition of SAP and QF materials (% on dry weight basis). Table S2. Minerals content of SAP and QF (mg/100 gm). Table S3. Amino acids content of SAP and QF. Table S4. Total phenolic content and antioxidant capacity using DPPH and reducing power of SAP and QF.

Author Contributions

Conceptualization, A.M.S.H. and A.A.Z.; Methodology, S.M., S.M.A. and A.A.Z.; Validation, I.M.A.-R.; Formal analysis, S.M., S.M.A. and A.A.Z.; Investigation, A.M.S.H. and A.A.Z.; Resources, A.M.S.H. and S.M.; Data curation, S.M.A. and I.M.A.-R.; Writing—original draft, A.M.S.H. and A.A.Z.; Writing—review & editing, I.M.A.-R. and A.A.Z.; Supervision, N.A.H. All authors have read and agreed to the published version of the manuscript.

Funding

This research received no external funding.

Data Availability Statement

The original contributions presented in this study are included in the article/supplementary material. Further inquiries can be directed to the corresponding authors.

Conflicts of Interest

The authors declare no conflict of interest.

References

  1. Bodbodak, S.; Nejatian, M.; Ghandehari Yazdi, A.P.; Kamali Rousta, L.; Rafiee, Z.; JalaliJivan, M.; Kharazmi, M.S.; Jafari, S.M. Improving the thermal stability of natural bioactive ingredients via encapsulation technology. Crit. Rev. Food Sci. Nutr. 2024, 64, 2824–2846. [Google Scholar] [CrossRef]
  2. Nejatian, M.; Darabzadeh, N.; Bodbodak, S.; Saberian, H.; Rafiee, Z.; Kharazmi, M.S.; Jafari, S.M. Practical application of nanoencapsulated nutraceuticals in real food products; a systematic review. Adv. Colloid Interface Sci. 2022, 305, 102690. [Google Scholar] [CrossRef] [PubMed]
  3. Jan, K.N.; Panesar, P.S.; Singh, S. Optimization of antioxidant activity, textural and sensory characteristics of gluten-free cookies made from whole indian quinoa flour. LWT 2018, 93, 573–582. [Google Scholar] [CrossRef]
  4. Marak, N.R.; Das, P.; Das Purkayastha, M.; Baruah, L.D. Effect of quinoa (Chenopodium quinoa W.) flour supplementation in breads on the lipid profile and glycemic index: An in vivo study. Front. Nutr. 2024, 11, 1341539. [Google Scholar] [CrossRef]
  5. Conte, P.; Fadda, C.; Drabinska, N.; Krupa-Kozak, U. Technological and nutritional challenges, and novelty in gluten-free breadmaking: A review. Pol. J. Food Nutr. Sci. 2019, 69, 5–21. [Google Scholar] [CrossRef]
  6. El-Hadidy, G.S.; Rizk, E.A.; El-Dreny, E.G. Improvement of Nutritional Value, Physical and Sensory Properties of Biscuits Using Quinoa, Naked Barley and Carrot. Egypt. J. Food. Sci. 2020, 48, 147–157. [Google Scholar]
  7. Hussein, A.S.; Mostafa, S.; Fouad, S.; Hegazy, N.A.; Zaky, A.A. Production and Evaluation of Gluten-Free Pasta and Pan Bread from Spirulina Algae Powder and Quinoa Flour. Processes 2023, 11, 2899. [Google Scholar] [CrossRef]
  8. Braga-Souto, R.N.; Bürck, M.; Nakamoto, M.M.; Braga, A.R.C. Cracking Spirulina flavor: Compounds, sensory evaluations, and solutions. Trends Food Sci. Technol. 2025, 156, 104847. [Google Scholar] [CrossRef]
  9. Lupatini, A.L.; Colla, L.M.; Canan, C.; Colla, E. Potential application of microalga Spirulina platensis as a protein source. J. Sci. Food Agric. 2017, 97, 724–732. [Google Scholar] [CrossRef]
  10. Satpathy, L.; Dash, D.; Sahoo, P.; Anwar, T.; Parida, S. Quantitation of Total Protein Content in Some Common Edible Food Sources by Lowry Protein Assay. Lett. App. Nanobiosci. 2020, 9, 1275–1283. [Google Scholar]
  11. Lafarga, T.; Fernández-Sevilla, J.M.; González-López, C.; Acién-Fernández, F.G. Spirulina for the food and functional food industries. Food Res. Int. 2020, 137, 109356. [Google Scholar] [CrossRef] [PubMed]
  12. Hamouda, R.A.; Hamza, H.A.; Salem, M.L.; Kamal, S.; Alhasani, R.H.; Alsharif, I.; Mahrous, H.; Abdella, A. Synergisticn Hypolipidemic and Immunomodulatory Activity of Lactobacillus and Spirulina platensis. Fermentation 2022, 8, 220. [Google Scholar] [CrossRef]
  13. Subramaiam, H.; Chu, W.L.; Radhakrishnan, A.K.; Chakravarthi, S.; Selvaduray, K.R.; Kok, Y.Y. Evaluating anticancer and immunomodulatory effects of spirulina (Arthrospira) platensis and gamma-tocotrienol supplementation in a syngeneic mouse model of breast cancer. Nutrients 2021, 13, 2320. [Google Scholar] [CrossRef]
  14. Bohórquez-Medina, S.L.; Bohórquez-Medina, A.L.; Zapata, V.A.B.; Cconchoy, F.I.; Huamanchumo, C.J.T.; Quispe, G.B.; Hernandez, A.V. Spirulina Supplementation and Obesity Related Metabolic Disorders: A Systematic Review and Meta-Analysis of Randomized Controlled Clinical Trials. Metab. Clin. Exp. 2021, 116, 154607. [Google Scholar] [CrossRef]
  15. Hatami, E.; Ghalishourani, S.S.; Najafgholizadeh, A.; Pourmasoumi, M.; Hadi, A.; Clark, C.C.; Assaroudi, M.; Salehi-Sahlabadi, A.; Joukar, F.; Mansour-Ghanaei, F. The effect of spirulina on type 2 diabetes: A systematic review and meta-analysis. J. Diabetes Metab. Disord. 2021, 20, 883–892. [Google Scholar] [CrossRef] [PubMed]
  16. Prete, V.; Abate, A.C.; Di Pietro, P.; De Lucia, M.; Vecchione, C.; Carrizzo, A. Beneficial Effects of Spirulina Supplementation in the Management of Cardiovascular Diseases. Nutrients 2024, 16, 642. [Google Scholar] [CrossRef] [PubMed]
  17. Zaky, A.A.; Paterson, S.; Gómez-Cortés, P.; Hernández-Ledesma, B. Bioactive peptides released from microalgae during gastrointestinal digestion. In Protein Digestion-Derived Peptides; Academic Press: Cambridge, MA, USA, 2024; pp. 335–352. [Google Scholar]
  18. Fantechi, T.; Contini, C.; Casini, L. Pasta goes green: Consumer preferences for spirulina-enriched pasta in Italy. Algal Res. 2023, 75, 103275. [Google Scholar] [CrossRef]
  19. Letras, P.; Oliveira, S.; Varela, J.; Nunes, M.C.; Raymundo, A. 3D printed gluten-free cereal snack with incorporation of Spirulina (Arthrospira platensis) and/or Chlorella vulgaris. Algal Res. 2022, 68, 102863. [Google Scholar] [CrossRef]
  20. Rabitti, N.S.; Bayudan, S.; Laureati, M.; Neugart, S.; Schouteten, J.J.; Apelman, L.; Dahlstedt, S.; Sandvik, P. Snacks from the sea: A cross-national comparison of consumer acceptance for crackers added with algae. Eur. Food Res. Technol. 2024, 250, 2193–2209. [Google Scholar] [CrossRef]
  21. Hernández-López, I.; Alamprese, C.; Cappa, C.; Prieto-Santiago, V.; Abadias, M.; Aguiló-Aguayo, I. Effect of Spirulina in bread formulated with wheat flours of different alveograph strength. Foods 2023, 12, 3724. [Google Scholar] [CrossRef] [PubMed]
  22. Şahin, O.I. Functional and sensorial properties of cookies enriched with SPIRULINA and DUNALIELLA biomass. J. Food Sci. Technol. 2020, 57, 3639–3646. [Google Scholar] [CrossRef] [PubMed]
  23. Vieira, M.V.; Oliveira, S.M.; Amado, I.R.; Fasolin, L.H.; Vicente, A.A.; Pastrana, L.M.; Fuciños, P. 3D printed functional cookies fortified with Arthrospira platensis: Evaluation of its antioxidant potential and physical-chemical characterization. Food Hydrocoll. 2020, 107, 105893. [Google Scholar] [CrossRef]
  24. AACC. Approved Methods of Analysis, 10th ed.; American Association of Cereal Chemists: St. Paul, MN, USA, 2000; ISBN 13, 9781891127120. [Google Scholar]
  25. Zaky, A.A.; Hussein, A.S.; Mostafa, S.; Abd El-Aty, A.M. Impact of sunflower meal protein isolate supplementation on pasta quality. Separations 2022, 9, 429. [Google Scholar] [CrossRef]
  26. Zaky, A.A.; Liu, Y.; Han, P.; Ma, A.; Jia, Y. Effect of flavorzyme digestion on the antioxidant capacities of ultra-filtrated rice bran protein hydrolyzates. J. Food Process. Preserv. 2020, 44, e14551. [Google Scholar] [CrossRef]
  27. Bertrand, R.; Holmes, W.; Orgeron, C.; McIntyre, C.; Hernandez, R.; Revellame, E.D. Rapid estimation of parameters for gelatinization of waxy corn starch. Foods 2019, 8, 556. [Google Scholar] [CrossRef] [PubMed]
  28. Mauro, R.R.; Vela, A.J.; Ronda, F. Impact of starch concentration on the pasting and rheological properties of gluten-free gels. Effects of amylose content and thermal and hydration properties. Foods 2023, 12, 2281. [Google Scholar] [CrossRef]
  29. Hedayati, S.; Shahidi, F.; Koocheki, A.; Farahnaky, A.; Majzoobi, M. Functional properties of granular cold-water swelling maize starch: Effect of sucrose and glucose. Int. J. Food Sci. Technol. 2016, 51, 2416–2423. [Google Scholar] [CrossRef]
  30. Svoboda, R.; Pakosta, M.; Doležel, P. How the Presence of Crystalline Phase Affects Structural Relaxation in Molecular Liquids: The Case of Amorphous Indomethacin. Int. J. Mol. Sci. 2023, 24, 16275. [Google Scholar] [CrossRef] [PubMed]
  31. Salem, K.S.; Kasera, N.K.; Rahman, M.A.; Jameel, H.; Habibi, Y.; Eichhorn, S.J.; French, A.D.; Pal, L.; Lucia, L.A. Comparison and assessment of methods for cellulose crystallinity determination. Chem. Soc. Rev. 2023, 52, 6417–6446. [Google Scholar] [CrossRef] [PubMed]
  32. Chemin, M.; Paurd, O.; Villaceque, L.; Riaublanc, A.; Le-Bail, P. The Changes in Starch Gelatinization Behavior under the Influence of Acetic Acid in Vegetable Sponge Cake Batter in Order to Obtain New Snacks. Polymers 2022, 14, 4053. [Google Scholar] [CrossRef] [PubMed]
  33. Kumar, R.; Singh, N.; Khatkar, B.S. Effects of A- and B-type starch granules on composition, structural, thermal, morphological, and pasting properties of starches from diverse wheat varieties. Food Bioeng. 2023, 2, 373–383. [Google Scholar] [CrossRef]
  34. Frauenlob, J.; Hetebrij, E.; D’Amico, S.; Schoenlechner, R. Role of α-Amylase in the pasting behavior of wheat flours upon storage. Starch Stärke 2018, 70, 1700123. [Google Scholar] [CrossRef]
  35. Wang, Y.; Sun, K.; Zheng, K.; Zhu, W.; Ding, W.; Lyv, Q.; Chen, L.; Wang, G.; Zhuang, K.; Chen, X. Pasting Properties of Various Waxy Rice Flours: Effect of α-Amylase Activity, Protein, and Amylopectin. J. Food Qual. 2022, 2022, 1636819. [Google Scholar] [CrossRef]
  36. Al-Attar, H.; Ahmed, J.; Thomas, L. Rheological, pasting and textural properties of corn flour as influenced by the addition of rice and lentil flour. LWT 2022, 160, 113231. [Google Scholar] [CrossRef]
  37. Soni, R.A.; Sudhakar, K.; Rana, R. Spirulina—From growth to nutritional product: A review. Trends Food Sci. Technol. 2017, 69, 157–171. [Google Scholar] [CrossRef]
  38. Farg, H.; El-Makhzangy, A.; El-Shawaf, A.G. Chemical and technological studies on micro algae extracts and its utilization in some food products. Chemical, biochemical characteristics and nutritional value of spirulina algae. J. Product. Dev. 2021, 26, 107–117. [Google Scholar] [CrossRef]
  39. Jancurová, M.; Minarovicová, L.; Dandár, A. Rheological properties of doughs with buckwheat and quinoa additives. Chem. Pap. 2009, 63, 738–741. [Google Scholar] [CrossRef]
  40. Vega-Galvez, A.; Miranda, M.; Vergara, J.; Uribe, E.; Puente, L. Nutrition facts and functional potential of quinoa (Chenopodium quinoa Willd.), an ancient Andean grain: A review. J. Sci. Food Agric. 2010, 90, 2541–2547. [Google Scholar] [CrossRef] [PubMed]
  41. El Sohaimy, S.A.; Refaay, T.M.; Zaytoun, M.A.M. Physicochemical and functional properties of quinoa protein isolate. Ann. Agric. Sci. 2015, 60, 297–305. [Google Scholar] [CrossRef]
  42. Ma, Y.; Wu, D.; Guo, L.; Yao, Y.; Yao, X.; Wang, Z.; Wu, K.; Cao, X.; Gao, X. Effects of Quinoa Flour on Wheat Dough Quality, Baking Quality, and in vitro Starch Digestibility of the Crispy Biscuits. Front. Nutr. 2022, 9, 846808. [Google Scholar] [CrossRef]
  43. Pabon, K.S.M.; Acosta, D.F.R.; Bravo, J.E. Second-generation snacks prepared from quinoa with probiotic. Physicochemical properties, in vitro digestibility, antioxidant activity and consumer acceptability. Heliyon 2024, 10, e36525. [Google Scholar] [CrossRef] [PubMed]
  44. Peñalver, R.; Nieto, G. Developing a functional gluten-free sourdough bread by incorporating quinoa, amaranth, rice and spirulina. LWT 2024, 201, 116162. [Google Scholar] [CrossRef]
  45. Culetu, A.; Susman, I.E.; Duta, D.E.; Belc, N. Nutritional and functional properties of gluten-free flours. Appl. Sci. 2021, 11, 6283. [Google Scholar] [CrossRef]
  46. Masten Rutar, J.; Jagodic Hudobivnik, M.; Nečemer, M.; Mikuš, K.V.; Arčon, I.; Ogrinc, N. Nutritional quality and safety of the spirulina dietary supplements sold on the Slovenian market. Foods 2022, 11, 849. [Google Scholar] [CrossRef]
  47. Batista, A.P.; Niccolai, A.; Fradinho, P.; Fragoso, S.; Bursic, I.; Rodolfi, L.; Biondi, N.; Tredici, M.R.; Sousa, I.; Raymundo, A. Microalgae biomass as an alternative ingredient in cookies: Sensory, physical and chemical properties, antioxidant activity and in vitro digestibility. Algal Res. 2017, 26, 161–171. [Google Scholar] [CrossRef]
  48. Uribe-Wandurraga, Z.N.; Igual, M.; García-Segovia, P.; Martínez-Monzó, J. Effect of microalgae addition on mineral content, colour and mechanical properties of breadsticks. Food Funct. 2019, 10, 4685–4692. [Google Scholar] [CrossRef]
  49. de Marco Castro, E.; Shannon, E.; Abu-Ghannam, N. Effect of Fermentation on Enhancing the Nutraceutical Properties of Arthrospira platensis (Spirulina). Fermentation 2019, 5, 28. [Google Scholar] [CrossRef]
  50. Yahfoufi, N.; Alsadi, N.; Jambi, M.; Matar, C. The Immunomodulatory and Anti-Inflammatory Role of Polyphenols. Nutrients 2018, 10, 1618. [Google Scholar] [CrossRef] [PubMed]
  51. Finamore, A.; Palmery, M.; Bensehaila, S.; Peluso, I. Antioxidant, immunomodulating, and microbial-modulating activities of the sustainable and ecofriendly spirulina. Oxidative Med. Cell. Longev. 2017, 2017, 3247528. [Google Scholar] [CrossRef] [PubMed]
  52. De Marco, R.E.; Steffolani, M.E.; Martínez, C.S.; León, A.E. Effects of spirulina biomass on the technological and nutritional quality of bread wheat pasta. LWT Food Sci. Technol. 2014, 58, 102–108. [Google Scholar] [CrossRef]
  53. Fradinho, P.; Niccolai, A.; Soares, R.; Rodolfi, L.; Biondi, N.; Tredici, M.R.; Sousa, I.; Raymundo, A. Effect of Arthrospira platensis (spirulina) incorporation on the rheological and bioactive properties of gluten-free fresh pasta. Algal Res. 2020, 45, 101743. [Google Scholar] [CrossRef]
  54. Aune, D. Plant foods, antioxidant biomarkers, and the risk of cardiovascular disease, cancer, and mortality: A review of the evidence. Adv. Nutr. 2019, 10, S404–S421. [Google Scholar] [CrossRef]
  55. Seghiri, R.; Kharbach, M.; Essamri, A. Functional Composition, Nutritional Properties, and Biological Activities of Moroccan Spirulina Microalga. J. Food Qual. 2019, 2019, 3707219. [Google Scholar] [CrossRef]
  56. Aktas, A.B. Spirulina: Exploring Its Promising Role in Food Industry and Overcoming Challenges as a Food Analogue. In Food Analogues: Emerging Methods and Challenges; Springer Nature: Cham, Switzerland, 2024; pp. 165–182. [Google Scholar]
  57. Alam, S.; Singh, B.; Khaira, H.; Kaur, J.; Singh, S.K. Optimization of extrusion process variables for development of pulse-carrot pomace incorporated rice based snacks. J. Food Legumes 2013, 26, 103–114. [Google Scholar]
  58. Lucas, B.F.; de Morais, M.G.; Santos, T.D.; Costa, J.A.V. Spirulina for snack enrichment: Nutritional, physical and sensory evaluations. LWT 2018, 90, 270–276. [Google Scholar] [CrossRef]
  59. Raja, W.H.; Kumar, S.; Bhat, Z.F.; Kumar, P. Effect of ambient storage on the quality characteristics of aerobically packaged fish curls incorporated with different flours. SpringerPlus 2014, 3, 106. [Google Scholar] [CrossRef]
  60. Onacik-Gür, S.; Żbikowska, A.; Majewska, B. Effect of Spirulina (Spirulina platensis) addition on textural and quality properties of cookies. Ital. J. Food Sci. 2018, 30, 1–12. [Google Scholar]
  61. Su, K.; Fan, Z.; Usman, M.; Zhao, A.; Dong, H.; Duan, X.; Weng, L.; Shahid, A.; Xu, J. Effect of Spirulina platensis on the structure and aggregation of gluten proteins to improve texture and physiochemical properties of wheat noodles. Food Hydrocoll. 2025, 162, 110959. [Google Scholar] [CrossRef]
Figure 1. Effect of mixing biscuits (A) and snacks (B) with SAP on its sensory properties. SAP = spirulina algae powder; QF = quinoa flour. The values are the mean ± SD of three replicates. Different letters represent statistically significant differences between (p < 0.05).
Processes 13 00625 g001aProcesses 13 00625 g001b
Figure 2. Photo of biscuits and snacks without and with 3, 6 and 9% SAP. SAP = spirulina algae powder; QF = quinoa flour.
Processes 13 00625 g002aProcesses 13 00625 g002b
Table 1. Thermal properties of QF and their blends with SAP.
SamplesTo (°C)Tp (°C)Te (°C)ΔT (°C)ΔH gel J/g
Control (100% QF)59.55102.56144.6085.0582.89
3% SAP + 97% QF30.2172.70121.6591.4491.43
6% SAP + 94% QF33.8679.14131.7697.09114.60
9% SAP + 91% QF69.7362.1373.854.1221.66
Where To = onset temperature; Tp = peak temperature; Te = end set temperature; ΔT = the temperature range (Te-To); ΔH gel = enthalpy of gelatinization; SAP = spirulina algae powder; QF = quinoa flour.
Table 2. Amylograph parameter of QF and their blends with SAP.
SamplesTransmission Temperature
(°C)
Temperature of Peak Viscosity
(°C)
Peak Viscosity
(BU)
Break Down
(BU)
Set Back
(BU)
Control (100 QF)63110118014001360
3% SAP + 97% QF61.5105114012001420
6% SAP + 94% QF4970.5106012001860
9% SAP + 91% QF4876.5158016002540
SAP = spirulina algae powder; QF = quinoa flour.
Table 3. Chemical composition of biscuits and snacks (% on dry weight basis).
SamplesMoisture Protein Fat Ash Fiber Carbohydrates *
Biscuits
100% QF4.25 d ± 0.0615.00 d ± 0.0731.97 c ± 0.072.09 d ± 0.041.93 d ± 0.2049.01
3% SAP + 97% QF4.95 c ± 0.1517.10 c ± 0.0832.04 b ± 0.072.64 c ± 0.012.03 c ± 0.1246.19
6% SAP + 94% QF5.15 b ± 0.0718.45 b ± 0.2332.14 a ± 0.103.16 b ± 0.062.45 b ± 0.0843.80
9% SAP + 91% QF5.65 a ± 0.0220.67 a ± 0.0932.25 a ± 0.083.68 a ± 0.072.60 a ± 0.840.80
LSD at 0.050.4510.3351.0981.6520.102.350
Snacks
100% QF2.63 d ± 0.2115.74 d ± 0.0413.01 c ± 0.062.21 d ± 0.082.03 a ± 0.0567.01
3% SAP + 97% QF2.80 c ± 0.0617.01 c ± 0.0913.54 b ± 0.022.72 c ± 0.012.02 a ± 0.0764.71
6% SAP + 94% QF2.95 b ± 0.0318.21 b ± 0.0113.88 b ± 0.053.24 b ± 0.042.04 a ± 0.0362.63
9% SAP + 91% QF3.15 a ± 0.1219.46 a ± 0.0314.01 a ± 0.043.75 a ± 0.212.04 a ± 0.0260.74
LSD at 0.050.1561.2010.9860.3240.1022.501
The values are the mean ± SD of three replicates. The values in the same column followed by different letters are significantly different (p < 0.05). SAP = spirulina algae powder; QF = quinoa flour. * by difference.
Table 4. Mineral content of biscuits and snacks (mg/100 gm).
SamplesCalciumPhosphorus Potassium SodiumIron Zinc
Biscuits
100% QF85 d ± 0.24517 a ± 2.36683 a ± 0.511430.60 a ± 3.1730.57 d ± 1.126.5 a ± 0.42
3% SAP + 97% QF92 c ± 0.60153 d ± 1.13652 b ± 0.241362 b ± 3.0136.0 c ± 0.746.2 a ± 0.27
6% SAP + 94% QF109 b ± 0.05159 c ± 1.62621 c ± 1.551312 c ± 2.4242.5 b ± 0.465.67 b ± 0.45
9% SAP + 91% QF122 a ± 2.14164 b ± 0.55584 d ± 2.541275 d ± 1.7446.2 a ± 1.425.51 b ± 0.26
LSD at 0.057.6186611.7517215.7818316.114358.227911.43473
Snacks
100% QF85 d ± 1.21517 a ± 0.54683 a ± 0.801430 a ± 2.6130.66 d ± 0.186.31 c ± 0.24
3% SAP + 97% QF93 c ± 2.63134 d ± 2.63668 b ± 1.201373 b ± 2.2837.0 c ± 0.196.23 d ± 0.12
6% SAP + 94% QF109 b ± 0.61140 c ± 0.21642 c ± 2.101316 c ± 2.1142.0 b ± 0.275.78 a ± 0.35
9% SAP + 91% QF120 a ± 0.93143 b ± 0.67615 d ± 1.221283 d ± 2.1347.0 a ± 0.125.44 b ± 0.48
LSD at 0.055.311767.5312116.7452618.893383.388721.31408
The values are the mean ± SD of three replicates. The values in the same column followed by different letters are significantly different (p < 0.05). SAP = spirulina algae powder; QF = quinoa flour.
Table 5. Amino acid content of biscuits and snacks enriched with SAP.
Amino Acids
(g/100 g Protein)
Biscuits Snacks
100% QF3% SAP + 97% QF6% SAP + 94% QF9% SAP + 91% QF100% QF3% SAP + 97% QF6%
SAP + 94% QF
9% SAP + 91% QF
Essential amino acids
Isoleucine0.901.201.702.100.861.151.652.05
Leucine2.802.923.123.472.612.893.023.42
Lysine2.502.902.302.752.422.852.252.70
Methionine0.400.901.351.700.350.851.251.65
Phenylalanine1.651.601.531.501.601.551.501.48
Threonine5.925.605.154.805.805.505.054.75
Valine3.813.954.174.453.753.904.104.40
Nonessential amino acids
Histidine2.282.152.061.962.202.102.021.92
Tyrosine1.282.002.703.251.251.952.603.20
Arginine3.102.952.752.553.052.902.702.50
Alanine2.302.252.102.082.252.202.152.05
Aspartic3.803.653.553.503.753.603.503.45
Cysteine0.190.210.250.290.150.190.230.27
Glutamic acid8.928.658.408.008.808.508.307.95
Glycine3.103.002.852.703.052.952.802.65
Proline1.902.002.092.201.871.952.052.15
Serine1.781.701.601.501.721.651.561.45
SAP = spirulina algae powder; QF = quinoa flour.
Table 6. Total phenolic content and antioxidant capacity using DPPH and reducing power in biscuits and snacks enriched with SAP.
SamplesTPC (mg/g)Antioxidant Capacity
DPPH (µmol/g)Reducing Power (µmol/g)
Biscuits
100% QF1.45 ± 0.19 d36.15 ± 0.13 d33.10 ± 0.38 d
3% SAP + 97% QF2.15 ± 0.25 c38.40 ± 0.21 c35.5 ± 0.22 c
6% SAP + 94% QF2.85 ± 0.16 b44.7 ± 0.18 b38.2 ± 0.45 b
9% SAP + 91% QF3.25 ± 0.42 a50.18 ± 0.20 a43.6 ± 0.14 a
Snacks
100% QF1.42 ± 0.21 d20.29 ± 0.31 d15.45 ± 0.16 d
3% SAP + 97% QF1.50 ± 0.15 c30.35 ± 0.25 c20.27 ± 0.45 c
6% SAP + 94% QF2.10 ± 0.24 b37.12 ± 0.67 b30.65 ± 0.39 b
9% SAP + 91% QF2.90 ± 0.11 a41.49 ± 0.15 a36.58 ± 0.42 a
The values are the mean ± SD of three replicates. The values in the same column followed by different letters are significantly different (p < 0.05). SAP = spirulina algae powder; QF = quinoa flour; TPC = total phenolic content; DPPH = 2,2-diphenyl-1-picrylhydrazyl.
Table 7. Hunter color parameters of biscuits and snacks enriched with SAP.
Parameters Mixtures
Control (100 QF)3% SAP + 97% QF6% SAP + 94% QF9% SAP + 91% QF
L*90.76 a ± 0.2383.83 b ± 0.0879.78 c ± 0.0872.55 d ± 0.53
a*0.19 c ± 0.342.86 b ± 0.523.10 a ± 0.283.35 a ± 0.42
b*9.96 c ± 0.1511.56 b ± 0.0711.98 b ± 0.0212.50 a ± 0.05
Biscuits
L*82.65 a ± 0.0971.23 b ± 0.3570.38 b ± 0.3362.21 c ± 0.13
a*5.65 a ± 0.422.08 c ± 0.031.67 d ± 0.182.21 b ± 0.31
b*33.36 c ± 0.2533.85 b ± 0.1733.98 b ± 0.0335.99 a ± 0.06
Snacks
L*78.31 a ± 0.0244.87 b ± 0.2642.39 b ± 0.2440.69 c ± 0.09
a*0.09 d ± 0.31.58 c ± 0.082.35 b ± 0.163.49 a ± 0.04
b*9.49 c ± 0.1722.62 a ± 0.1122.61 a ± 0.03222.33 b ± 0.28
Where (L*) = whiteness; (a*) = redness; (b*) = yellowness; SAP = spirulina algae powder; QF = quinoa flour. The values are the mean ± SD of three replicates. The values in the same row followed by different letters are significantly different (p < 0.05).
Table 8. Effect of mixing QF with SAP on its baking quality of biscuits.
SamplesWeight (g)Volume (cm3)Specific Volume (v/w)Diameter (cm)Thickness (cm)Spread Ratio
Control (100% QF)12.0015.331.285.110.618.38
3% SAP + 97% QF11.3314.001.245.10.588.79
6% SAP + 94% QF9.3310.001.074.850.568.66
9% SAP + 91% QF9.669.330.974.750.578.33
SAP = spirulina algae powder; QF = quinoa flour.
Table 9. Texture profile properties of biscuits and snacks after mixing QF with SAP.
Texture Profile ParametersBiscuits
Control (100% QF)3% SAP + 97% QF6% SAP + 94% QF9% SAP + 91% QF
Hardness (N)100.99100.9299.6721.32
Deformation at hardness (mm)26.3727.1825.310.77
Deformation at hardness (%)329.60271.80361.6011.00
Hardness work (mJ)76.0069.90129.3012.90
Fracturability with 1% of load sensitivity (N)20.1223.1517.6621.32
Snacks
Hardness (N)98.45110.41117.33107.80
Deformation at hardness (mm)2.6512.0311.5015.98
Deformation at hardness (%)53.00100.3095.8084.10
Hardness work (mJ)138.50178.70122.30250.10
Fracturability with 1% of load sensitivity (N)98.459.5761.0713.97
SAP = spirulina algae powder; QF = quinoa flour.
Disclaimer/Publisher’s Note: The statements, opinions and data contained in all publications are solely those of the individual author(s) and contributor(s) and not of MDPI and/or the editor(s). MDPI and/or the editor(s) disclaim responsibility for any injury to people or property resulting from any ideas, methods, instructions or products referred to in the content.

