Abstract
In recent years, power outages due to typhoon-induced rainstorms, waterlogging, and other extreme weather events have become increasingly common, and accurately assessing the risk of damage to the distribution system during a disaster is critical to enhancing the resilience of the power system. Therefore, a risk assessment method for power distribution systems considering the spatiotemporal characteristics of the typhoon disaster chain is proposed. The mechanism of forming the typhoon disaster chain is first analyzed and its spatiotemporal characteristics are modeled. Secondly, the failure probability of the distribution system equipment during the evolution process of the disaster chain is modeled. Then, the non-sequential Monte Carlo state sampling method combined with the distribution system risk assessment index is proposed to establish the disaster risk assessment system of the distribution system. Finally, based on the IEEE 33-bus power system, the proposed distribution system disaster risk assessment method is verified. Simulation solutions show that the proposed assessment method can effectively assess the disaster risk of the distribution system under the influence of the typhoon disaster chain. The simulation results show that at the time step of typhoon landfall, the load shedding reaches 1315.3 kW with a load shedding rate of 35.4%. The total economic loss at the time step is 2,289,200 CNY. These results demonstrate the effectiveness of the proposed method in assessing disaster risks and improving the resilience of power systems during typhoon events.
1. Introduction
To address environmental and climate challenges, the aggressive development of renewable energy sources such as wind and solar has become a common strategy for countries worldwide in formulating energy policies and promoting a clean energy transition. In March 2021, the ninth meeting of the National Central Leading Group for Finance and Economics explicitly proposed to incorporate “carbon peaking and carbon neutrality” into the overall layout of ecological civilization construction and to build a new type of electric power system with new energy as the main body [1]. According to the Intergovernmental Panel on Climate Change (IPCC) Sixth Assessment Report, global climate change issues are intensifying, resulting in more frequent and severe extreme weather events. The risks of natural disasters, such as heavy rainfall and waterlogging, have increased, posing a significant threat to power systems. As the final link in the power supply chain, distribution systems have experienced a growing number of outage events in recent years. For example, Typhoon “Doksuri” in 2023 caused severe damage to the power system in Fujian Province, with more than half of the distribution feeders out of service [2]. Compared to transmission systems, distribution systems are more susceptible to the impacts of extreme weather events such as typhoons. Therefore, studying the disaster risk of distribution systems is of significant importance [3].
As the decarbonization process of power systems continues to advance, the increasing frequency of extreme weather events significantly diminishes the controllability of system operations. In light of this, scholars both domestically and internationally have conducted a series of studies of the disaster risk assessment for power systems. A report by [4] proposed a method for assessing the transmission line risk that quantified the combined effects of multiple natural disasters using hierarchical analysis and entropy weighting, validated through a case study to enhance disaster recovery and risk prevention. A report by [5] proposed a novel risk assessment and visualization system for power tower damage under typhoons, integrating a multi-source information database, optimizing six machine learning risk prediction models, and visualizing results at a 1 km × 1 km resolution, demonstrating superior performance with their combined model during typhoon “Mujigae”. A report by [6] proposed a Bayesian deep learning-based probabilistic risk assessment and warning model considering meteorological conditions for high-impact, low-probability strong typhoon extreme weather events. A report by [7] validated the effectiveness of the proposed methodology by proposing a spatiotemporal risk analysis methodology based on resilience by utilizing a GIS of the power system and a hurricane wind field model and comparing it with the actual observed damage. A report by [8] proposed a short-term multiple fault risk assessment method for power systems, considering unexpected actions of the protection system during weather disasters. The method establishes a coupled fault probability model for primary and secondary equipment, taking into account the expansion of risk due to false or failure actions of protection systems, and calculates key risk indicators such as power flow overlimit and bus voltage overlimit. A report by [4] proposed a transmission line risk reliability assessment method that considers the combined effects of multiple natural disasters. This method quantifies disaster risk by evaluating the probability of risk occurrence, the degree of impact on the transmission line, and the severity of the disaster.
During the spatiotemporal evolution of disasters, different hazards can mutually reinforce each other, resulting in clusters or chains of natural disasters. The probability of extreme natural disaster chains is very low, often leading to their neglect in risk assessments. However, due to the potentially substantial costs associated with their occurrence, the risk value of such events may be significantly higher than that of typical disaster occurrences, classifying them as typical ‘high-risk, low-probability events’. However, most of the existing literature focuses only on single-hazard. A report by [9] developed a grid-based hydrodynamic model to assess the spatiotemporal impacts of flash floods on power distribution systems, incorporating evolving line faults into a resilience-oriented service restoration model that addressed dynamic load demand and uncertainties in renewable generation. A report by [10] developed a resilience assessment framework for cyber-physical power systems (CPPS) to address typhoon disasters, incorporating disaster metrics and information system interactions, using mixed integer linear programming and bi-level models for optimal power flow and recovery. A report by [11] presented a method to enhance mid-term resilience at transmission substations in flood-prone areas by integrating hardening strategies and assessing flood impacts using hydrological forecasts. A report by [12] developed a quantitative assessment framework to improve the resilience of power systems against extreme weather events, specifically hurricanes. Their framework identifies vulnerable lines using a cascading failure graph and develops a novel resilience assessment index (REAI) to evaluate the power system’s response to extreme events. Similarly, reference [13] reviewed wind hazard impacts on power systems and proposed methods for disaster prevention to reduce vulnerabilities. Their study highlights wind-induced failure models for transmission and distribution systems, discusses the application of machine learning and statistical methods for outage prediction, and emphasizes the need for hybrid models that combine component failure and outage prediction to improve fault analysis and emergency response under wind hazards.
Existing research on assessing the risk of power systems under extreme weather events primarily focuses on individual disasters, neglecting the intrinsic connections between multiple hazards, such as the correlations among typhoons, heavy rainfall, and waterlogging. Additionally, most studies concentrate solely on the failure of a single type of equipment during disasters, overlooking the failures of other devices within the distribution system. Furthermore, there is a lack of research addressing the evolutionary mechanisms of disaster chains triggered by typhoons.
Therefore, this paper first analyzes the formation mechanisms and influencing factors of the typhoon disaster chain, followed by the development of its spatiotemporal correlation model. Subsequently, based on the typhoon disaster chain model, a method for calculating the failure probabilities of the distribution system equipment under the influence of a disaster chain is proposed. Furthermore, risk assessment methodology for distribution systems impacted by typhoon disasters is introduced, utilizing a non-sequential Monte Carlo approach to sample equipment states and simulate operational conditions of various devices under the influence of the typhoon disaster chain. A risk assessment model and framework for the distribution system are established from the perspectives of reliability, safety, and economic viability. Finally, based on the simulation results, a proportional allocation method is employed to analyze the vulnerabilities of the distribution system under typhoon disaster chain conditions. The main contributions of this work are as follows:
- (1)
- Systematic analysis of the formation process of the typhoon disaster chain is conducted, identifying the underlying logic and key factors involved. A spatiotemporal correlation model for the typhoon disaster chain is proposed, which captures the interaction and evolution of different disaster events (such as heavy rainfall, flooding, etc.) triggered by a typhoon.
- (2)
- A method for calculating the failure probability of distribution system equipment under the influence of the typhoon disaster chain is introduced. Compared with existing papers in which independent disasters are considered, the influence of the typhoon disaster chain on the failure probability of different distribution system equipment is taken into account. Furthermore, the failure probability of energy storage devices is investigated.
- (3)
- A disaster risk assessment model for the distribution system is proposed, integrating the reliability, security, and economic index of the distribution system. Compared with existing papers that mainly focus on the reliability index, this work assesses the risk of distribution systems under the influence of typhoon disaster chains by employing the non-sequential Monte Carlo simulation approach.
The remainder of this publication is organized as follows: Section 2 introduces the spatiotemporal correlation model for the typhoon disaster chain; Section 3 presents the modeling of the distribution system equipment failure probability under the typhoon disaster chain. Section 4 outlines the disaster risk assessment methodology for the distribution system. Section 5 provides a case study to validate the proposed approach. Finally, Section 6 concludes the paper.
2. The Spatiotemporal Correlation Model for the Typhoon Disaster Chain
2.1. The Formation Mechanisms of the Typhoon Disaster Chain
Typhoons, heavy rainfall, and waterlogging constitute a chain reaction of disaster events. Typhoons form over tropical or subtropical oceans, where strong winds and rotational movements lead to intense precipitation, particularly concentrated at the typhoon’s center and in the right front quadrant. These heavy rains often evolve into downpours, characterized by high intensity and prolonged duration, resulting in a rapid increase in surface water flow. In urban areas, prolonged heavy rainfall impedes the natural infiltration and drainage of moisture due to hardened surfaces, ultimately leading to waterlogging.
The impact of the typhoon disaster chain on the safe operation of power distribution systems is significant. The high wind speeds associated with typhoons can severely affect overhead power lines, while the accompanying heavy rainfall poses considerable challenges to the safe operation of facilities such as transformers. When flooding reaches a certain level, it can result in water ingress and failure of energy storage battery cabinets.
2.2. Typhoon, Heavy Rainfall, and Waterlogging Disaster Chain Modeling
2.2.1. Typhoon Disaster Model
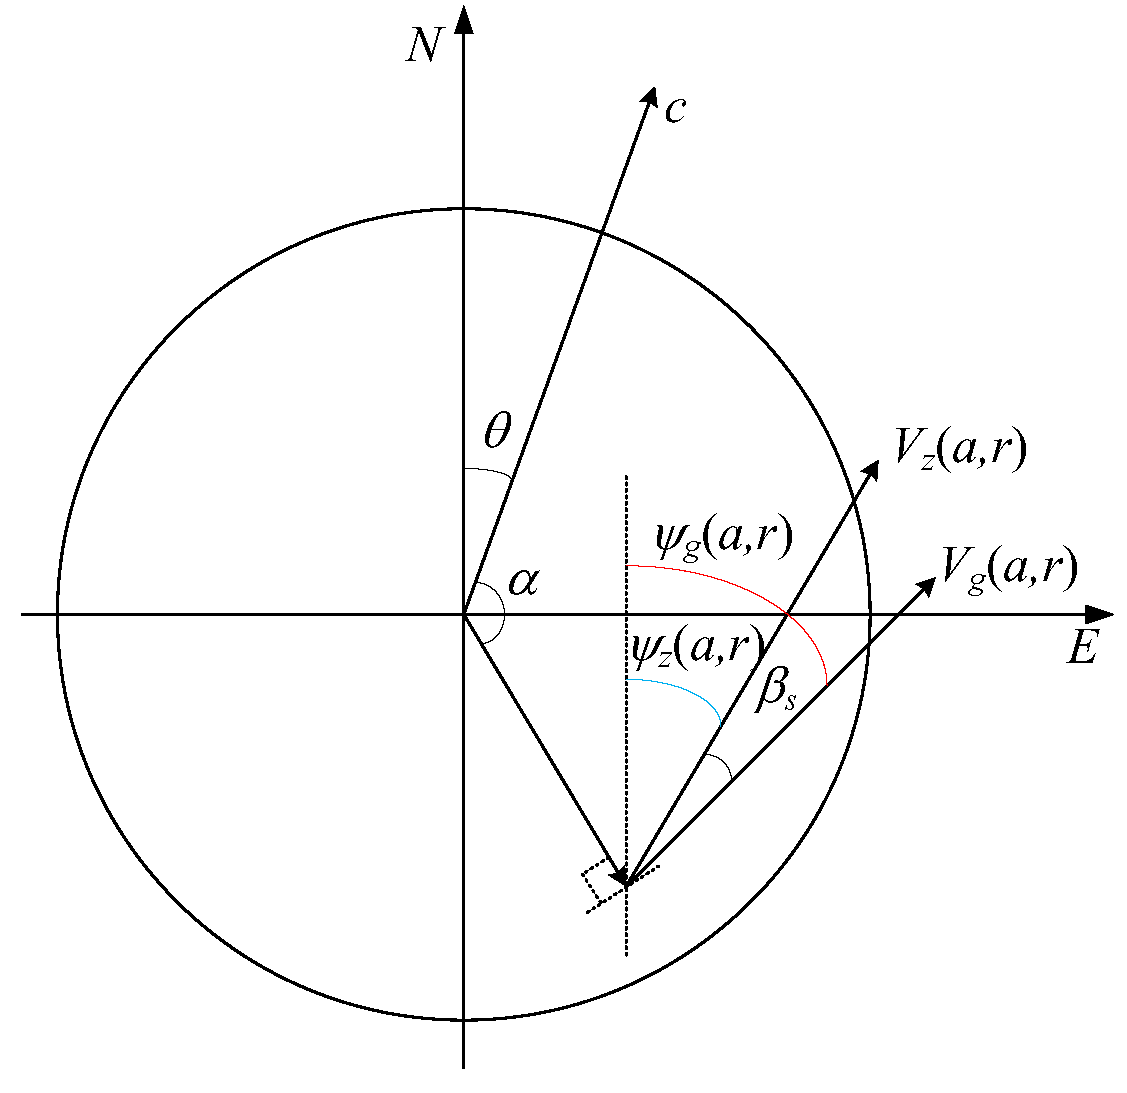
The models of typhoons can be categorized into three main types: empirical statistical models, numerical simulation models, and parametric models. Empirical statistical models utilize historical data and statistical methods to predict typhoon behavior based on known patterns, relying heavily on extensive historical observational data. Numerical simulation models employ computer simulations of atmospheric physical processes, typically grounded in equations of atmospheric dynamics and thermodynamics; these models tend to be complex and require substantial computational resources. Parametric models use simplified mathematical representations to simulate typhoon wind fields, demanding less computational power and being suitable for general engineering applications. Therefore, this study adopts a refined parametric empirical model to derive the near-surface wind field of typhoons [14]. The key parameters include the translation speed (c), approach angle (θ), central pressure difference (∆p), radius of maximum wind speed (Rmax), and Holland parameter (B). Given these parameters and the location of the typhoon center (O), the surface wind speed at a height (z) at any point (P) can be calculated through the following steps:
- Calculate the distance r between O and P, angle α, and Coriolis parameter f using known θ and the location of O and P;
- Substitute r, α, f, c, B, ∆p, and Rmax into Equation (1) to obtain gradient wind speed Vg(α,r). Use Equation (2) to find corresponding wind direction ψg (α);
- 3.
- Determine friction velocity u* and angle βs from Equations (3) and (4), where z0 is surface roughness, decided by terrain conditions;
- 4.
- Obtain surface wind speed Vz(α,r) by substituting u* and z into Equation (5). Use Equation (6) to estimate angle ψz (α,r);
- 5.
- Adjust Vz(α,r) by multiplying it by 1.1 if 0.5Rmax ≤ r ≤ Rmax, and by 1 + 0.1 sin[πr/(2Rmax)] if Rmax < r ≤ 2Rmax.
Figure 1 illustrates the relationship between the gradient wind field and the surface wind field. By utilizing the geographic coordinates of the distribution system nodes and typhoon trajectory data, the aforementioned steps can be implemented to obtain the surface wind speed Vi,t at node i at time t.
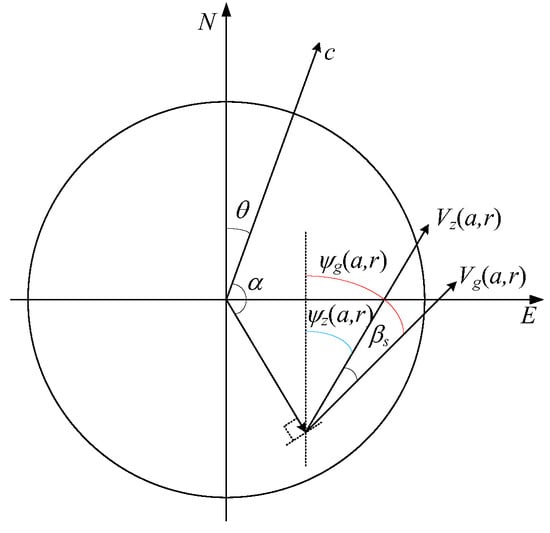
Figure 1.
Relationships among wind fields.
2.2.2. Heavy Rainfall Disaster Model Under Typhoon Conditions
The parametric typhoon rainfall model effectively simulates the intensity and distribution of rainfall induced by typhoons by simplifying and parameterizing complex meteorological processes. This model is applicable in power engineering for straightforward applications, such as assessing the potential flooding risk to electrical facilities during typhoons, optimizing emergency response plans, and pre-planning power dispatch and resource allocation. Consequently, this paper employs the parametric typhoon rainfall model with moisture (PTRaMM) [15] to obtain the time-varying rainfall intensity at the locations of distribution system nodes. Utilizing the typhoon trajectory data and the calculated surface wind speeds from Section 2.2.1, this model can simulate the radial distribution of typhoon-induced rainfall, as detailed in the following formulation:
where represents the total rainfall at node i at time t; , , and denote the symmetric rainfall, the asymmetric rainfall induced by vertical wind shear, and the rainfall caused by terrain effects, respectively; ri,t is the distance from node i to the center of the typhoon at time t; T0 represents the rainfall at the typhoon center, while Tm denotes the maximum rainfall along the radial profile of the typhoon; Rm is the radius of maximum rainfall, and Re is the e-folding radius at which the rainfall decreases to 1/e of its maximum value starting from Rm; indicates the maximum wind speed of the typhoon at time t; and refers to the average total column water within a 500 km radius from the typhoon center at time t. The regression coefficients ak, bk, ck (for k = 1, 2, 3, 4) correspond to the rainfall parameters T0, Tm, Rm, Re; Ak and Bk represent the Fourier coefficients of rainfall in the radial direction for wave numbers k (for k = 1, 2). The angle ϕ denotes the vertical wind shear, defined as the wind speed difference between the 200 hPa and 850 hPa layers, is averaged within an annular region of 200–800 km from the typhoon center. The vertical velocity at node i at time t caused by terrain effects can be computed using . Equation (8) indicates that symmetric rainfall increases linearly with a radius up to Rm and then decreases exponentially. Equation (10) shows that asymmetric rainfall is a function of ri,t and the angle of vertical wind shear ϕ. Equation (11) illustrates that the rainfall induced by downslope effects (where < 0) is five times smaller than that caused by upslope effects (where > 0).
2.2.3. Waterlogging Disaster Model Under Typhoon–Heavy Rainfall Conditions
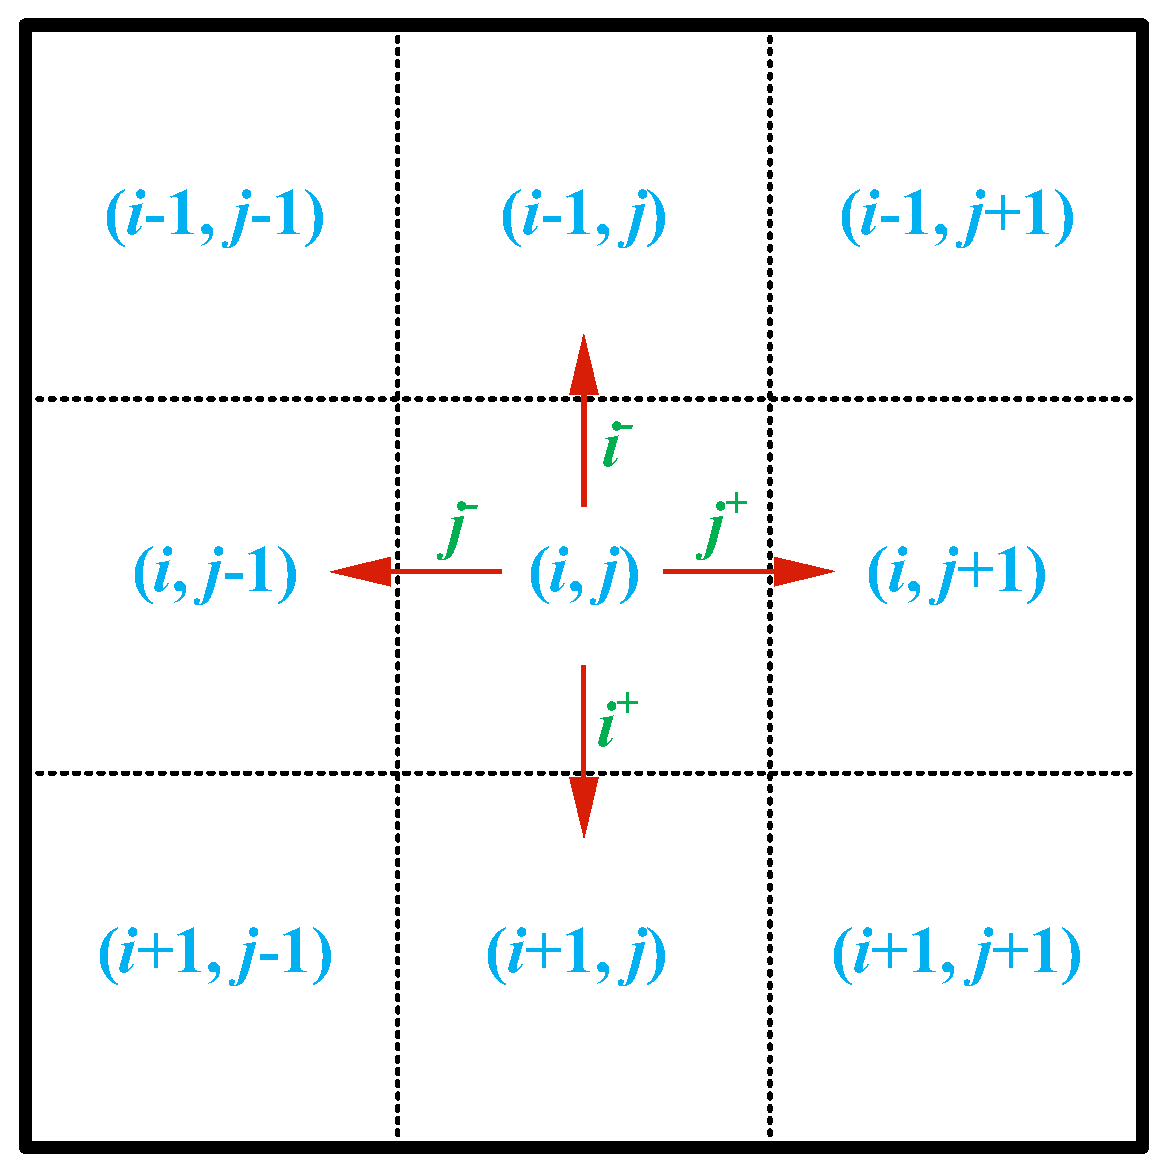
The two-dimensional partial differential equation hydrodynamic model accurately reflects the spatiotemporal variations in water accumulation depth and is widely utilized in simulating urban flooding under extreme rainfall conditions [16]. Consequently, this study employs the model to simulate water accumulation depth under typhoon and heavy rainfall scenarios. The final computational model is presented here; the detailed derivation of the specific two-dimensional partial differential equations can be found in reference [16]. Assuming that the nodes of the distribution system are located within the grid cell (i, j) in Figure 2, the precipitation intensity calculated in Section 2.2.2 can be used to determine the water accumulation depth within the grid, as described by the following model:
where represents the water depth in grid cell (i, j) at time t; , , , and denote the surface runoff from grid cell (i, j) to grid cells (i, j + 1), (i, j − 1), (i + 1, j), and (i − 1, j), respectively; D denotes the drainage capacity of grid cell (i, j); represents the rainfall intensity over grid cell (i, j) at time t, which is equal to the rainfall intensity at node i at time t; Δx and Δy represent the length and width of the grid cell, respectively; Td is the time step length; Ndw and Sdw denote the number and cross-sectional area of the drainage wells, respectively; δ is the drainage coefficient; g is the acceleration due to gravity; λ is the connectivity ratio between adjacent grid cells; hi,j is the water level elevation, satisfying hi,j = zi,j + di,j; ∇hi,j is the gradient of the water level elevation from grid cell (i, j) to grid cell (i, j + 1); n is the Manning coefficient; k is the unit conversion factor. Equations (14) and (15) calculate , and similarly, , and can be calculated.
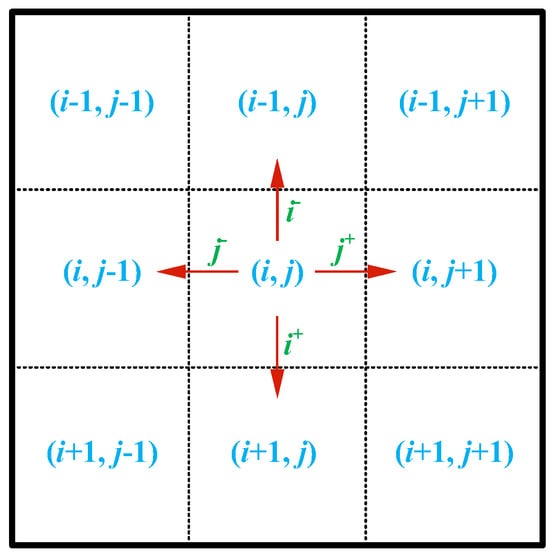
Figure 2.
Schematic of surface runoff.
Based on the provided typhoon trajectory data, the surface wind speed can be calculated using the model outlined in Section 2.2.1. Subsequently, this surface wind speed can be incorporated into the model described in Section 2.2.2 to determine precipitation intensity. Finally, the precipitation intensity can be used in the model presented in Section 2.2.3 to compute the water accumulation depth of waterlogging, and thereby a comprehensive typhoon disaster chain is established.
3. Modeling of the Distribution System Equipment Failure Probability Under Typhoon Disaster Chain
3.1. Modeling of Substation Failure Probability
In the context of the typhoon disaster chain, the primary failure component within the substations is the transformer. Therefore, this section assumes that the failure probability of the transformer within the substation is equivalent to the failure probability of the substation itself. The main cause of distribution network outages due to heavy rainfall is the internal moisture failure of transformers within substations. Influenced by precipitation, the moisture content of the insulation oil and oil-impregnated paper in transformer i at time t is as follows [17]:
where and denote the moisture content of the insulation oil and oil-impregnated paper, respectively; p denotes the atmospheric pressure at the location of the substation, and p0 represents the standard atmospheric pressure; parameters α1, α2, β1, β2, m1, and m2 are constants.
After obtaining the moisture content of the insulation oil and oil-impregnated paper for each time of the transformer, an exponential function fitting method was employed to model the failure probability of the transformer, as follows:
where and represent the probabilities of spark discharge in the insulation oil and breakdown of the oil-impregnated paper, respectively; and denote the moisture content of the insulation oil and oil-impregnated paper under normal operating conditions; and indicate the critical moisture content at which the insulation oil and oil-impregnated paper fail; parameters ζ and γ are the attenuation and damping coefficients, respectively. Finally, the failure probability of substation i can be determined using the probabilities of mutually independent events:
3.2. Modeling of Line Failure Probability
The primary threats to the integrity of power distribution lines are typhoons and heavy rainfall events. Therefore, this study focuses on the probability modeling of line failures under the combined effects of typhoon and heavy rainfall disasters. It is assumed that all lines considered in this analysis are overhead lines.
3.2.1. Modeling of Line Failure Probability Under Typhoon Disaster
The causes of distribution network failures induced by typhoons are typically attributed to excessively high wind speeds, leading to pole failures and line breaks. The vulnerability of distribution poles can be correlated with wind speed; based on the content of Section 2.2.1, the surface wind speed at various components of the distribution network can be calculated. Subsequently, empirical equations can be utilized to assess the probability of line failures. This study employs the structural vulnerability empirical Formulas (21) and (22) for failure assessment [18].
where and represent the failure probabilities of pole p and line l at time t under typhoon disaster, respectively; denotes the surface wind speed at pole p at time t; and NP is the number of poles on line l.
3.2.2. Modeling of Line Failure Probability Under Heavy Rainfall Disaster
The impact of heavy rainfall on distribution networks primarily focuses on their effects on power lines. By considering the droplet diameter and typhoon wind speed, and applying a disaster mechanism formula, one can derive the pressure exerted on the lines during heavy rainfall, thereby calculating the failure probability of the lines. The load exerted by raindrops on the conductors as follows:
where and represent the horizontal and vertical loads on the lines due to heavy rainfall, respectively; D denotes the droplet diameter, with a maximum natural droplet diameter of 7 mm; lH represents the line length; and indicates the outer diameter of the conductor. Gs and Gc are the horizontal pressure and vertical pressure generated by raindrops striking the lines, respectively, which calculation methodology can be detailed in the literature [19].
The tensile strength of the line can be assumed to follow a normal distribution, leading to the derivation of the failure probability of the line as follows:
where represents the failure probability of the overhead line under heavy rainfall disaster, Fy denotes the maximum elastic limit of the overhead line, Yy is the mean of the maximum elastic limit, and δy is the standard deviation of the maximum elastic limit.
Under the combined effects of two types of disasters, the failure probability of line l is as follows:
3.3. Modeling of Failure Probability for Energy Storage Devices
Energy storage stations typically consider reinforcement and the avoidance of areas prone to landslides during site selection and design. Therefore, this subsection focuses on the impact of water accumulation depth on the failure probability of energy storage devices under heavy rainfall conditions. It is assumed that the node failure probability of energy storage devices is equivalent to the failure probability of the internal storage components. Initially, the failure rate of the energy storage devices during extreme rainfall events is comparable to that under normal weather conditions; however, as water accumulation continues, the failure probability escalates rapidly once the water depth in the vicinity of the energy storage devices exceeds the flood protection threshold. Consequently, this study establishes a relationship between the failure rate of energy storage devices and water depth using an exponential fitting method based on grid cell partitioning. The failure probability of energy storage device s at time t is as follows:
where ds,t represents the water accumulation depth at the grid cell where the energy storage device s is located at time t, which can be obtained using the method outlined in Section 2.2.3; Ds denotes the design flood protection height of the energy storage device; and indicates the elevation of the energy storage device above ground level.
4. Distribution System Disaster Risk Assessment Methodology
4.1. Simulation of Power Outage Scenarios in Distribution System Under Typhoon Disaster Chain
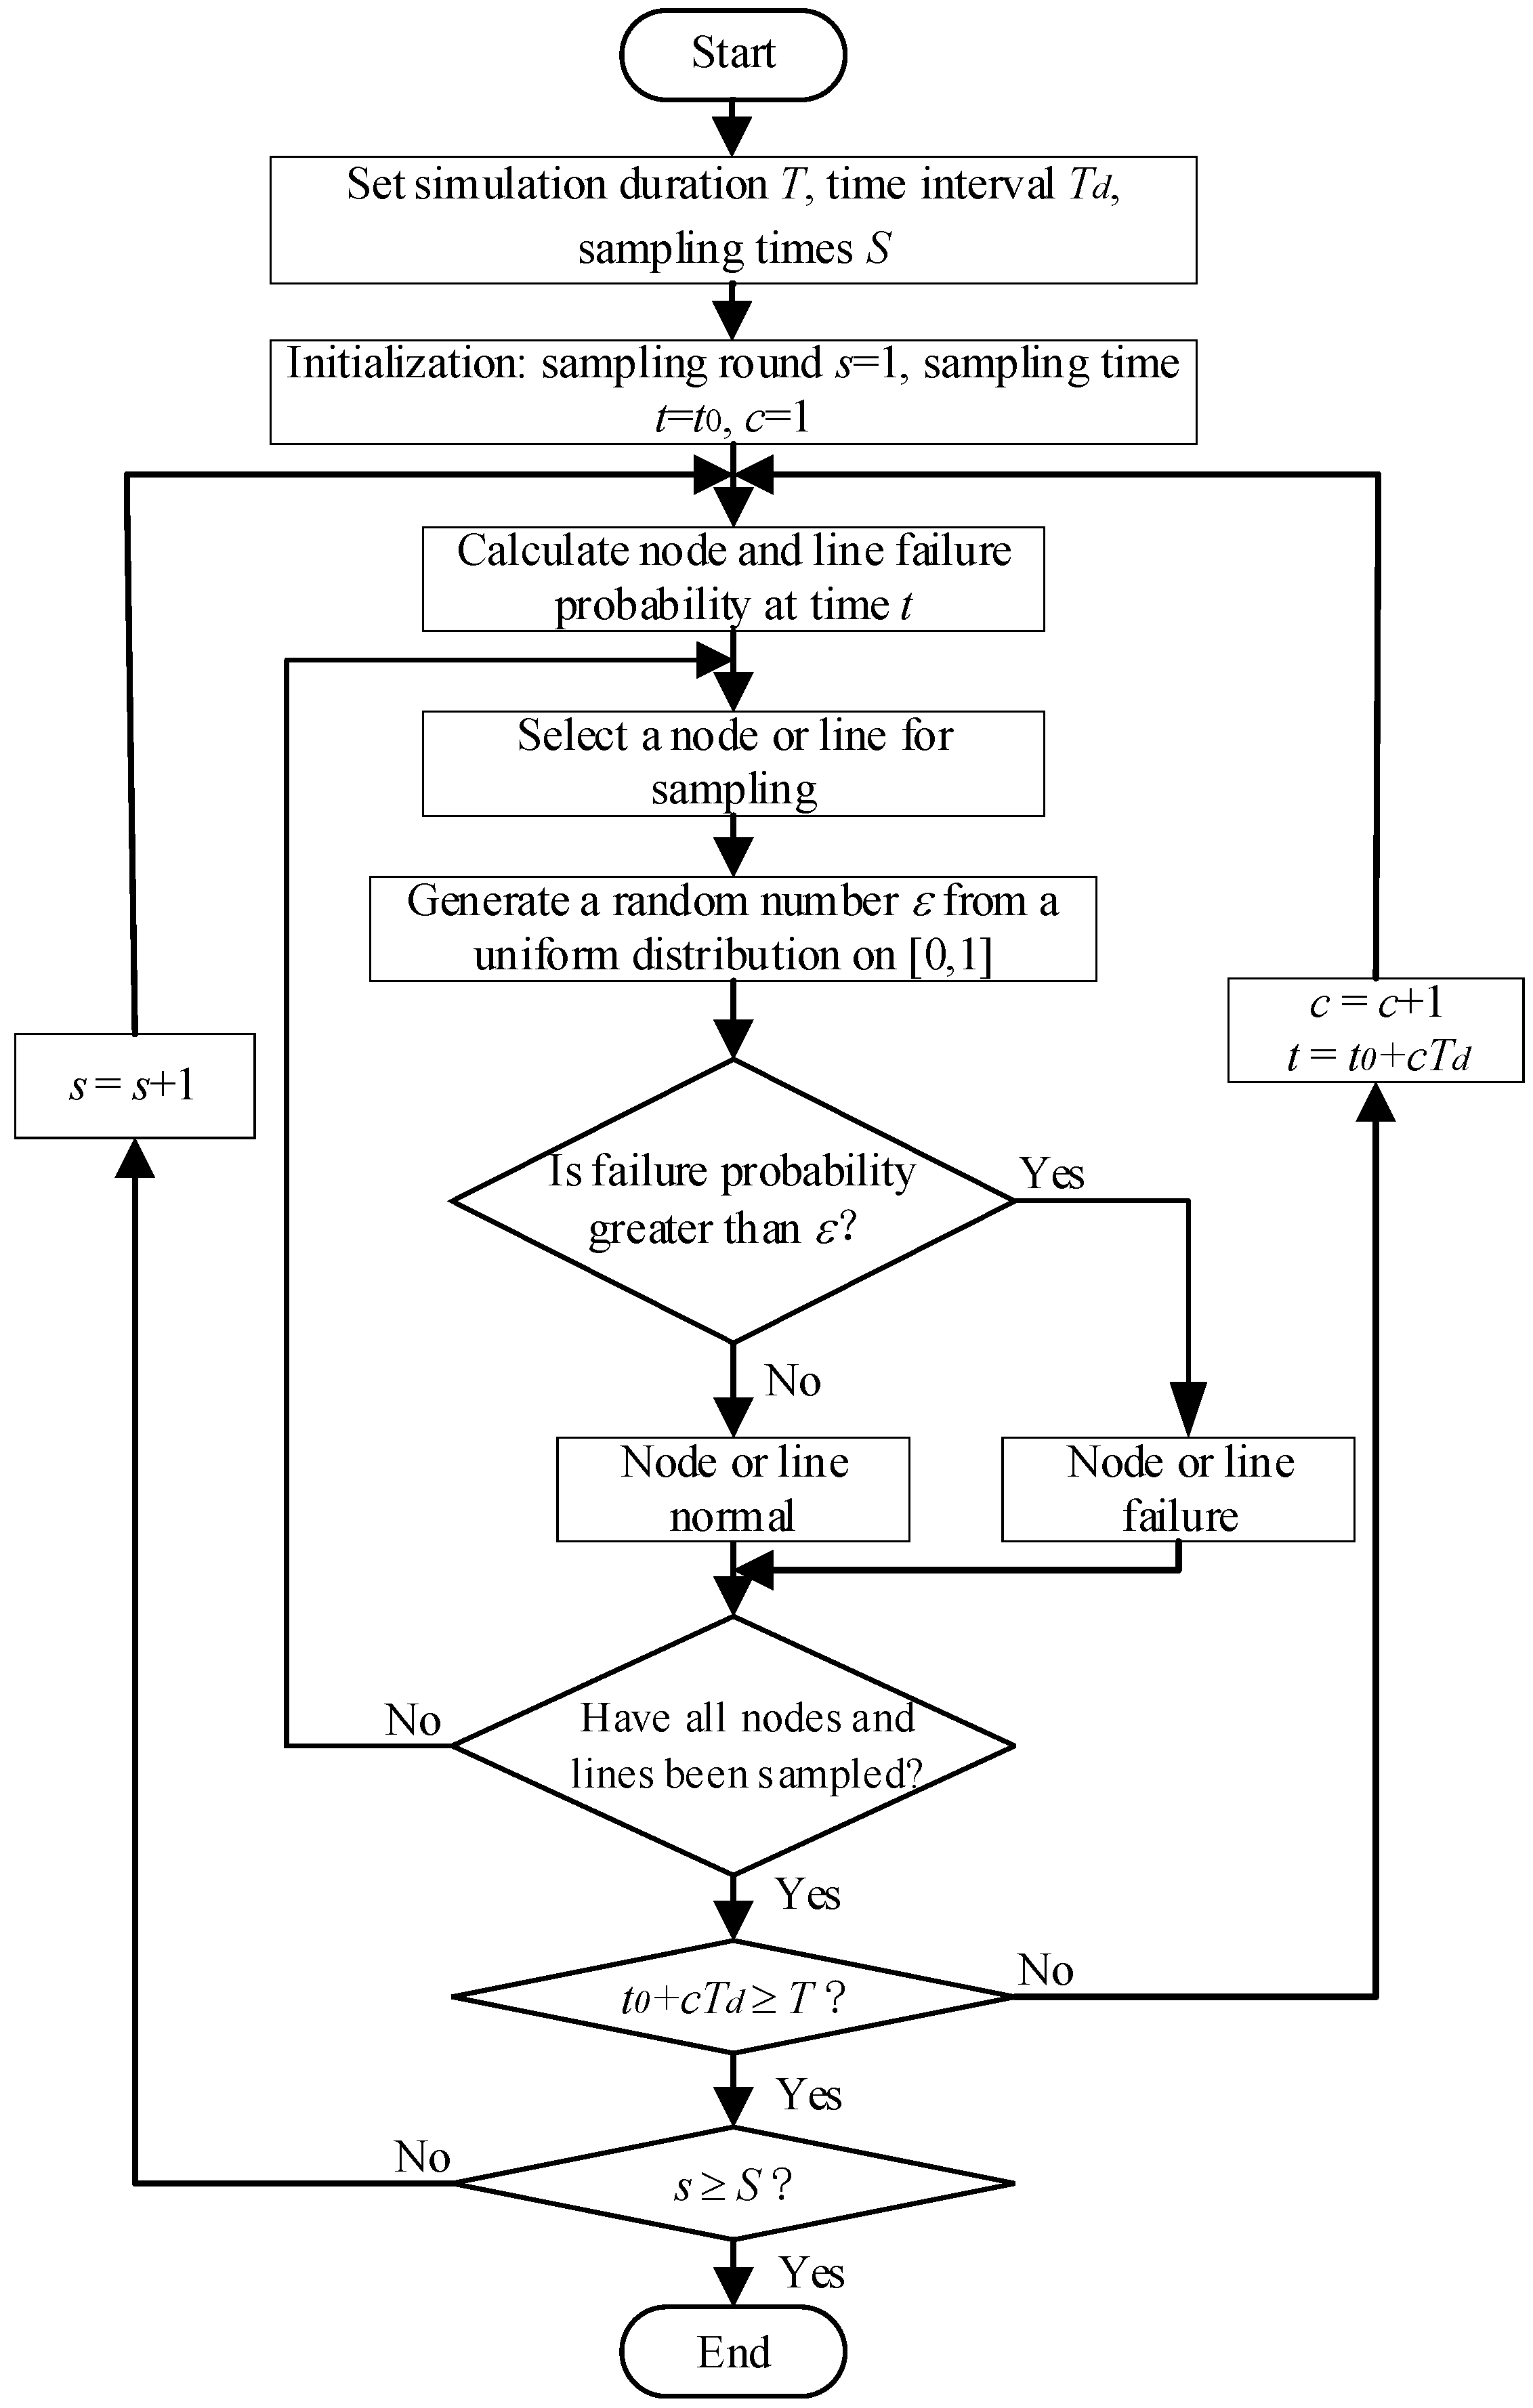
In order to construct a disaster risk assessment system for the distribution system, it is first necessary to simulate the operational state of the distribution system during the evolution of the disaster chain. According to the failure probability of each component in the distribution network in Section 2, the nodes in the distribution system are categorized according to the type of equipment, i.e., the nodes with transformers and energy storage devices as the main equipment, respectively, and then the states of the nodes and the lines are simulated by using the non-temporal Monte Carlo state sampling method, which can be used to simulate the state of the distribution system. According to the steps of the state sampling method, firstly, it is necessary to generate a random number obeying a uniform distribution between (0, 1) and compare it with the calculated failure probability of the node or line, if the failure probability is greater than the random number, the corresponding node or line is considered to be faulty, and vice versa, the corresponding node or line is not faulty. The steps of non-temporal Monte Carlo state sampling are shown below, and the detailed state sampling flow chart is shown in Figure 3.
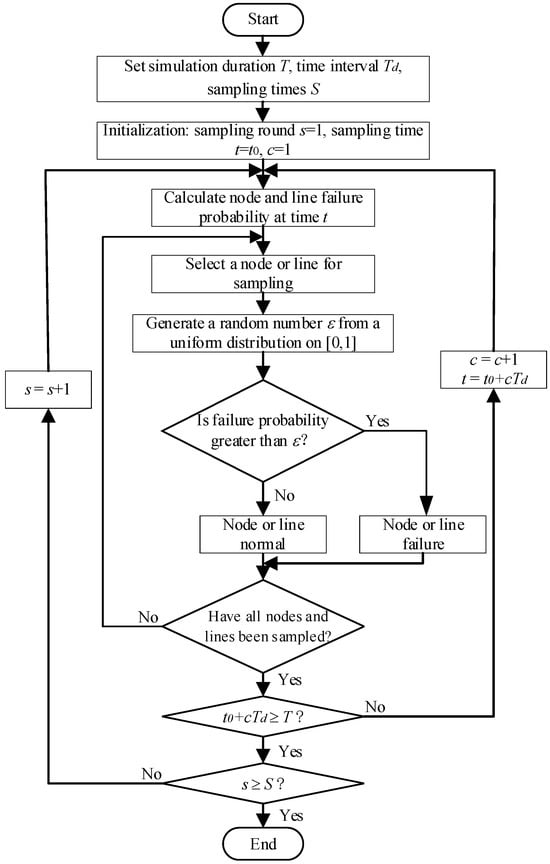
Figure 3.
Non-sequential Monte Carlo sampling flow chart.
- Set parameters: simulation duration, time interval, and sampling times.
- Calculate the failure probability of nodes and lines.
- Judge whether the nodes and lines are faulty or not.
- Until all node and line state sampling is completed at all moments.
4.2. The Disaster Risk Assessment System of the Distribution System Under the Typhoon Disaster Chain
System risk is closely related to the operating status of the distribution system, the distribution system in the case of disaster, the measures of risk loss are mainly the amount of load shedding, reflected in the loss of load power on the economy, voltage quality, power supply reliability and other aspects of the degree of impact. Therefore, in this paper, the risk of load shedding (RLS), risk of voltage overrun (RVV), risk of line overload (RLO), and risk of economic loss (REL) are selected as the risk levels to measure the reliability, security, and economy of the distribution system [20].
4.2.1. Reliability Risk Indicators
The amount of load shedding RLS is selected as a reliability risk indicator of the distribution system under the influence of the typhoon disaster chain, which indicates the expected value of load curtailment due to the failure of the distribution system equipment, reflecting the severity of the disaster as well as the real-time level of loads, as shown in Equation (29). The amount of load shedding includes loads at the failed nodes and load shedding at nodes that are disconnected from the power supply of the distribution system.
where S is the number of non-temporal Monte Carlo state sampling; N is the number of nodes; and is the amount of load shedding of node i at time t at the sth sampling.
4.2.2. Security Risk Indicators
The risk of node voltage overrun RVV is chosen as an index to measure the security of the distribution system, and the degree of node voltage deviation from the normal operation level is calculated, as shown in Equation (30). The larger the degree of deviation, the greater the impact on the distribution system.
where is the degree of voltage overrun at node i at time t at the sth sampling, which is calculated by Equation (31).
where Us,i,t is the voltage at node i at time t of the sth sampling; UN is the rated voltage; and are usually taken as 104% and 96% of the rated voltage. Similarly, the line overload risk RLO is calculated as follows:
where is the degree of overloading of line l at time t of the sth sampling; L is the number of lines; is the rated capacity of the line.
4.2.3. Economy Risk Indicators
The economic loss REL due to extreme disasters is the cost of losses due to load outages and equipment damage, as shown in Equation (34).
where co is the economic loss per unit of power outage; cr represents the unit cost for maintenance of equipment; NFs,t is the number of failed equipment at time t at the sth sampling.
4.3. The Disaster Risk Assessment Process of the Distribution System Under the Typhoon Disaster Chain
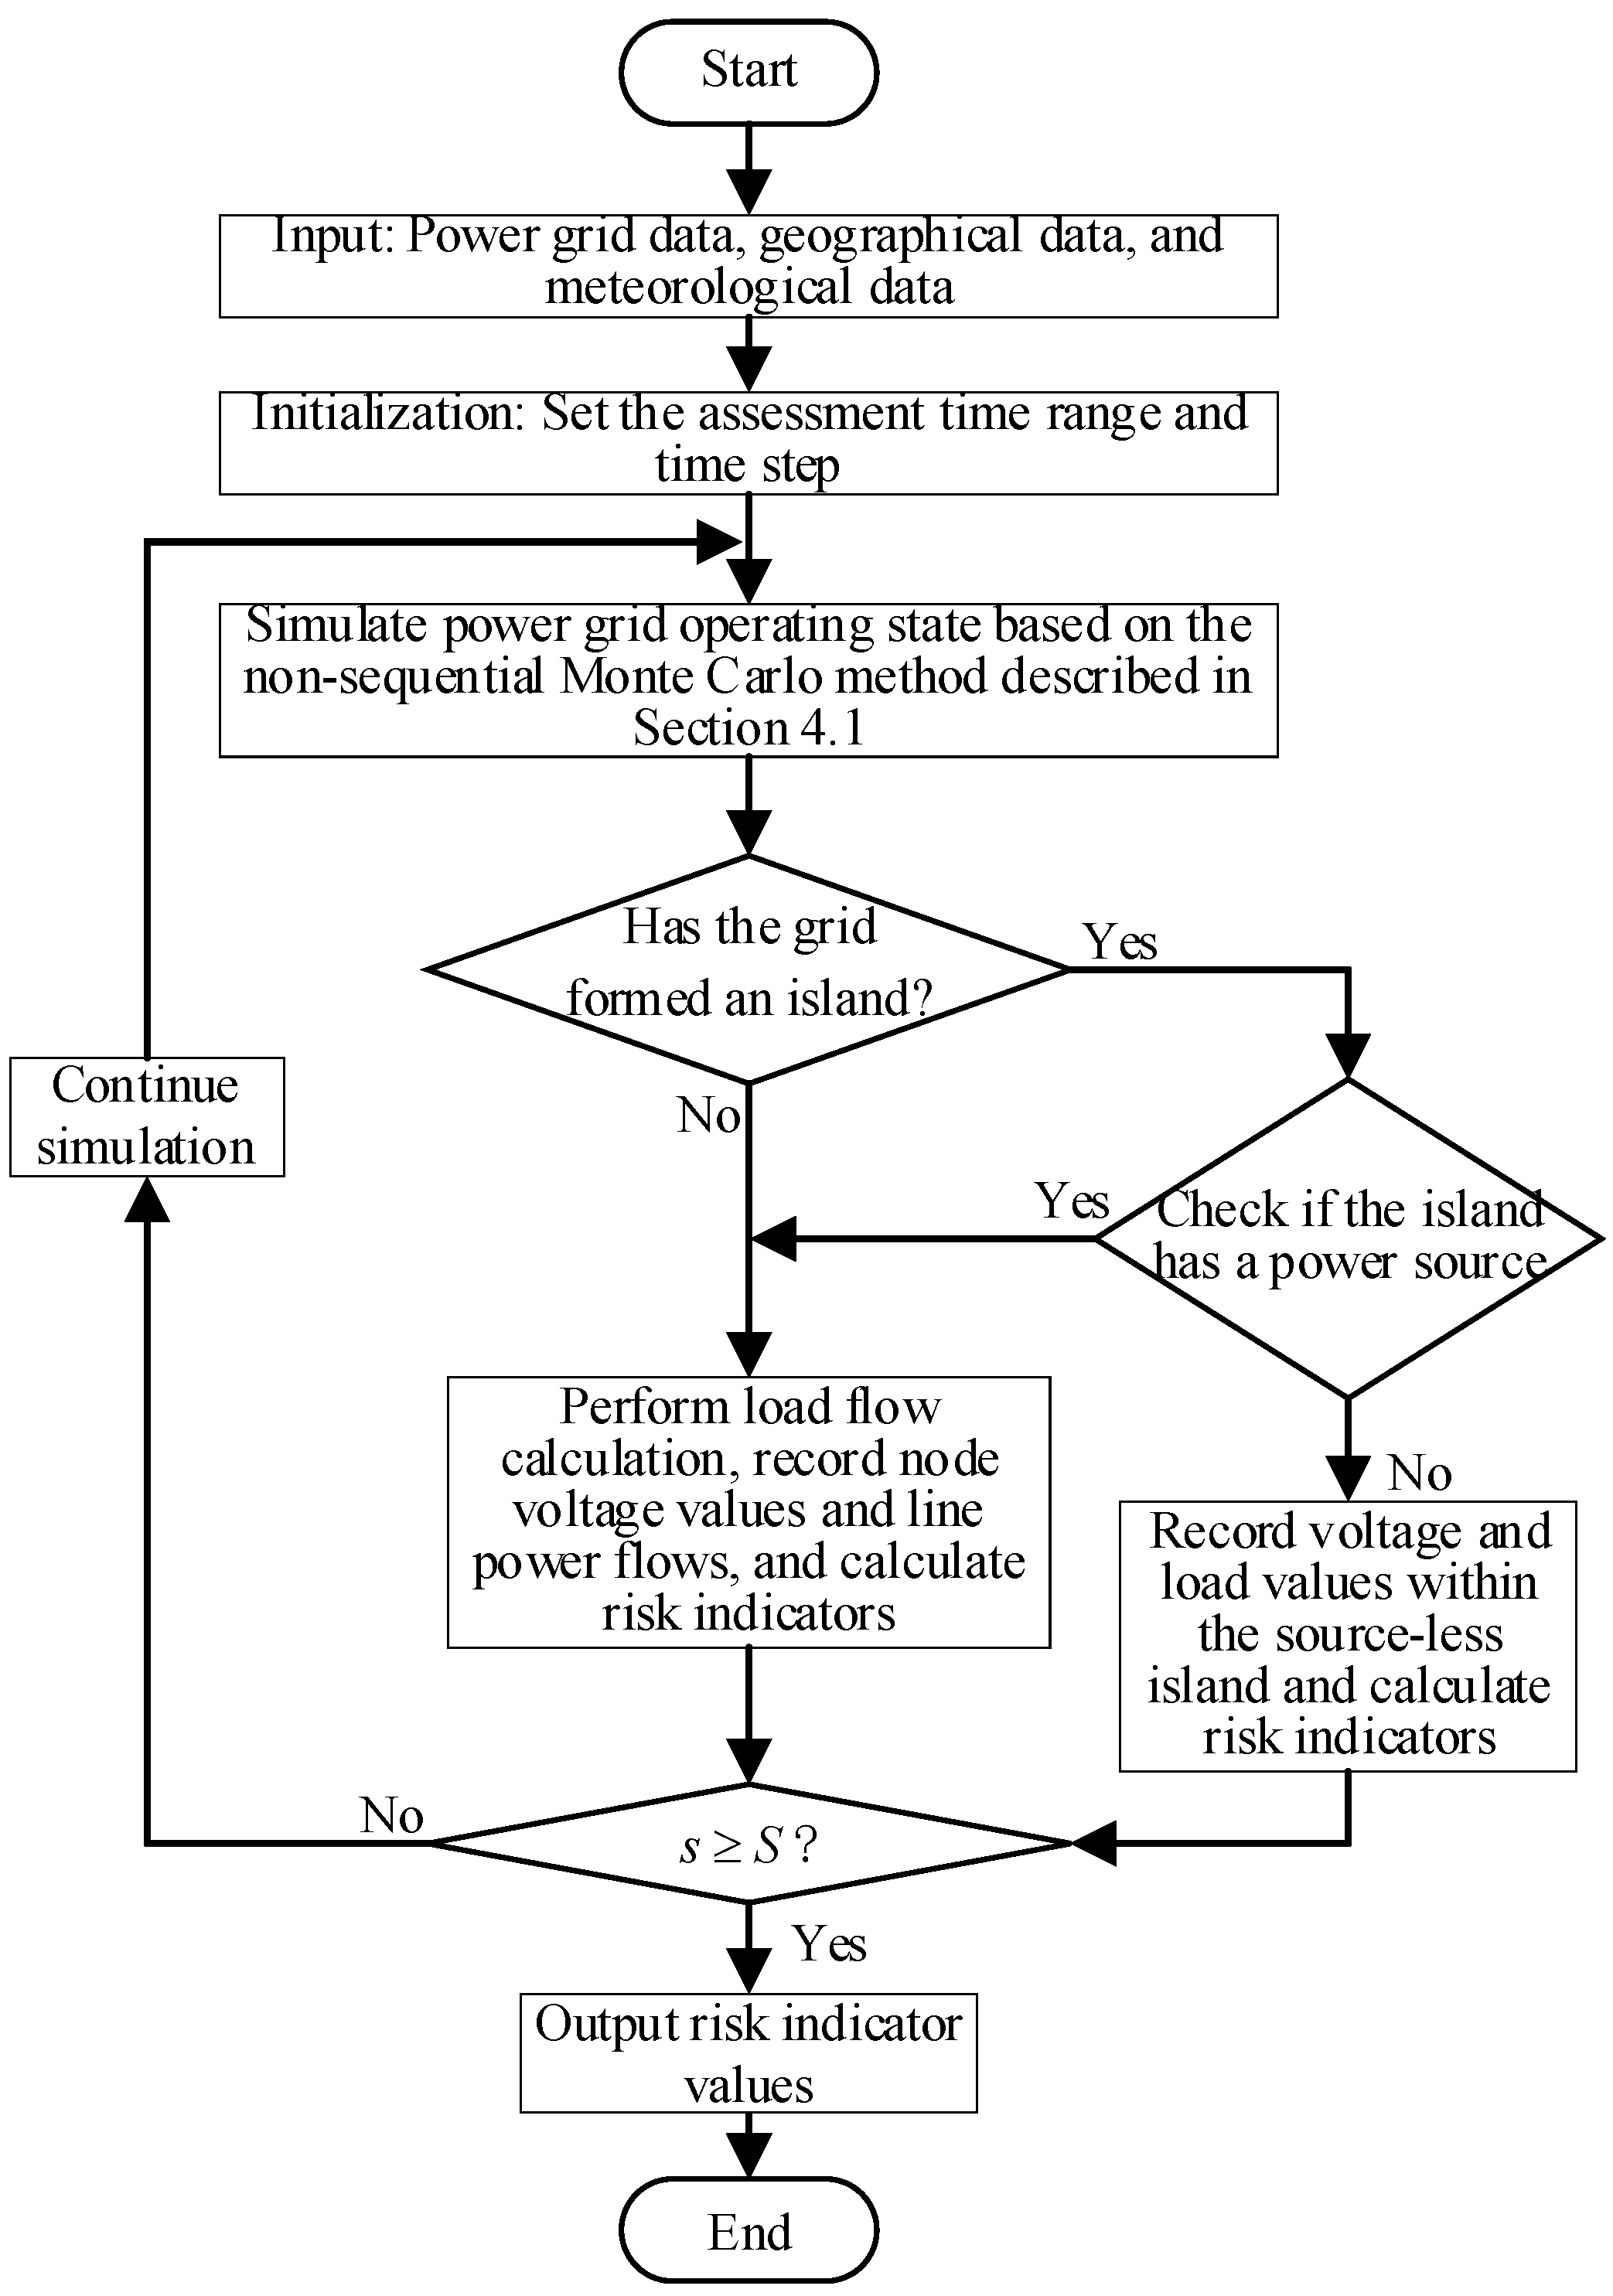
The risk assessment process of the power distribution system based on the spatiotemporal simulation of the typhoon disaster chain proposed in this paper is shown in Figure 4 and includes the following steps:
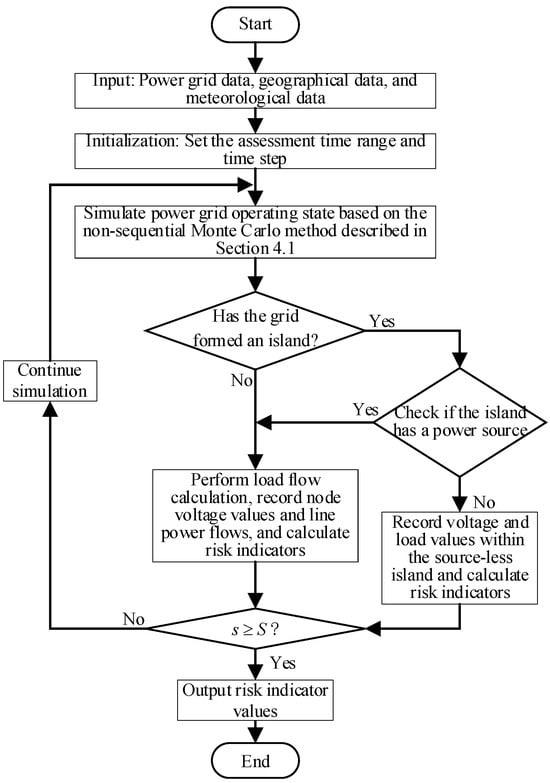
Figure 4.
The distribution system risk assessment process based on spatiotemporal simulation of typhoon disaster chain.
- Obtain power grid data, including topology, node location, and geographic information; obtain geographic data of the simulation area; and obtain meteorological data such as typhoon tracks.
- Calculate the node and line failure probability according to the typhoon disaster chain model.
- Simulate the operation state of the distribution system according to the non-temporal Monte Carlo state sampling method.
- Judge whether there is an islanding in the distribution system. If there is an island, then determine whether the island is active or not, obtain the risk indicator value after the current calculation for active islands, and directly calculate the indicator value for passive islands; if there is no island, then directly carry out the current calculation, and then calculate the risk indicator value.
- Until the end of the simulation is completed.
5. Case Study
5.1. Simulation System Settings
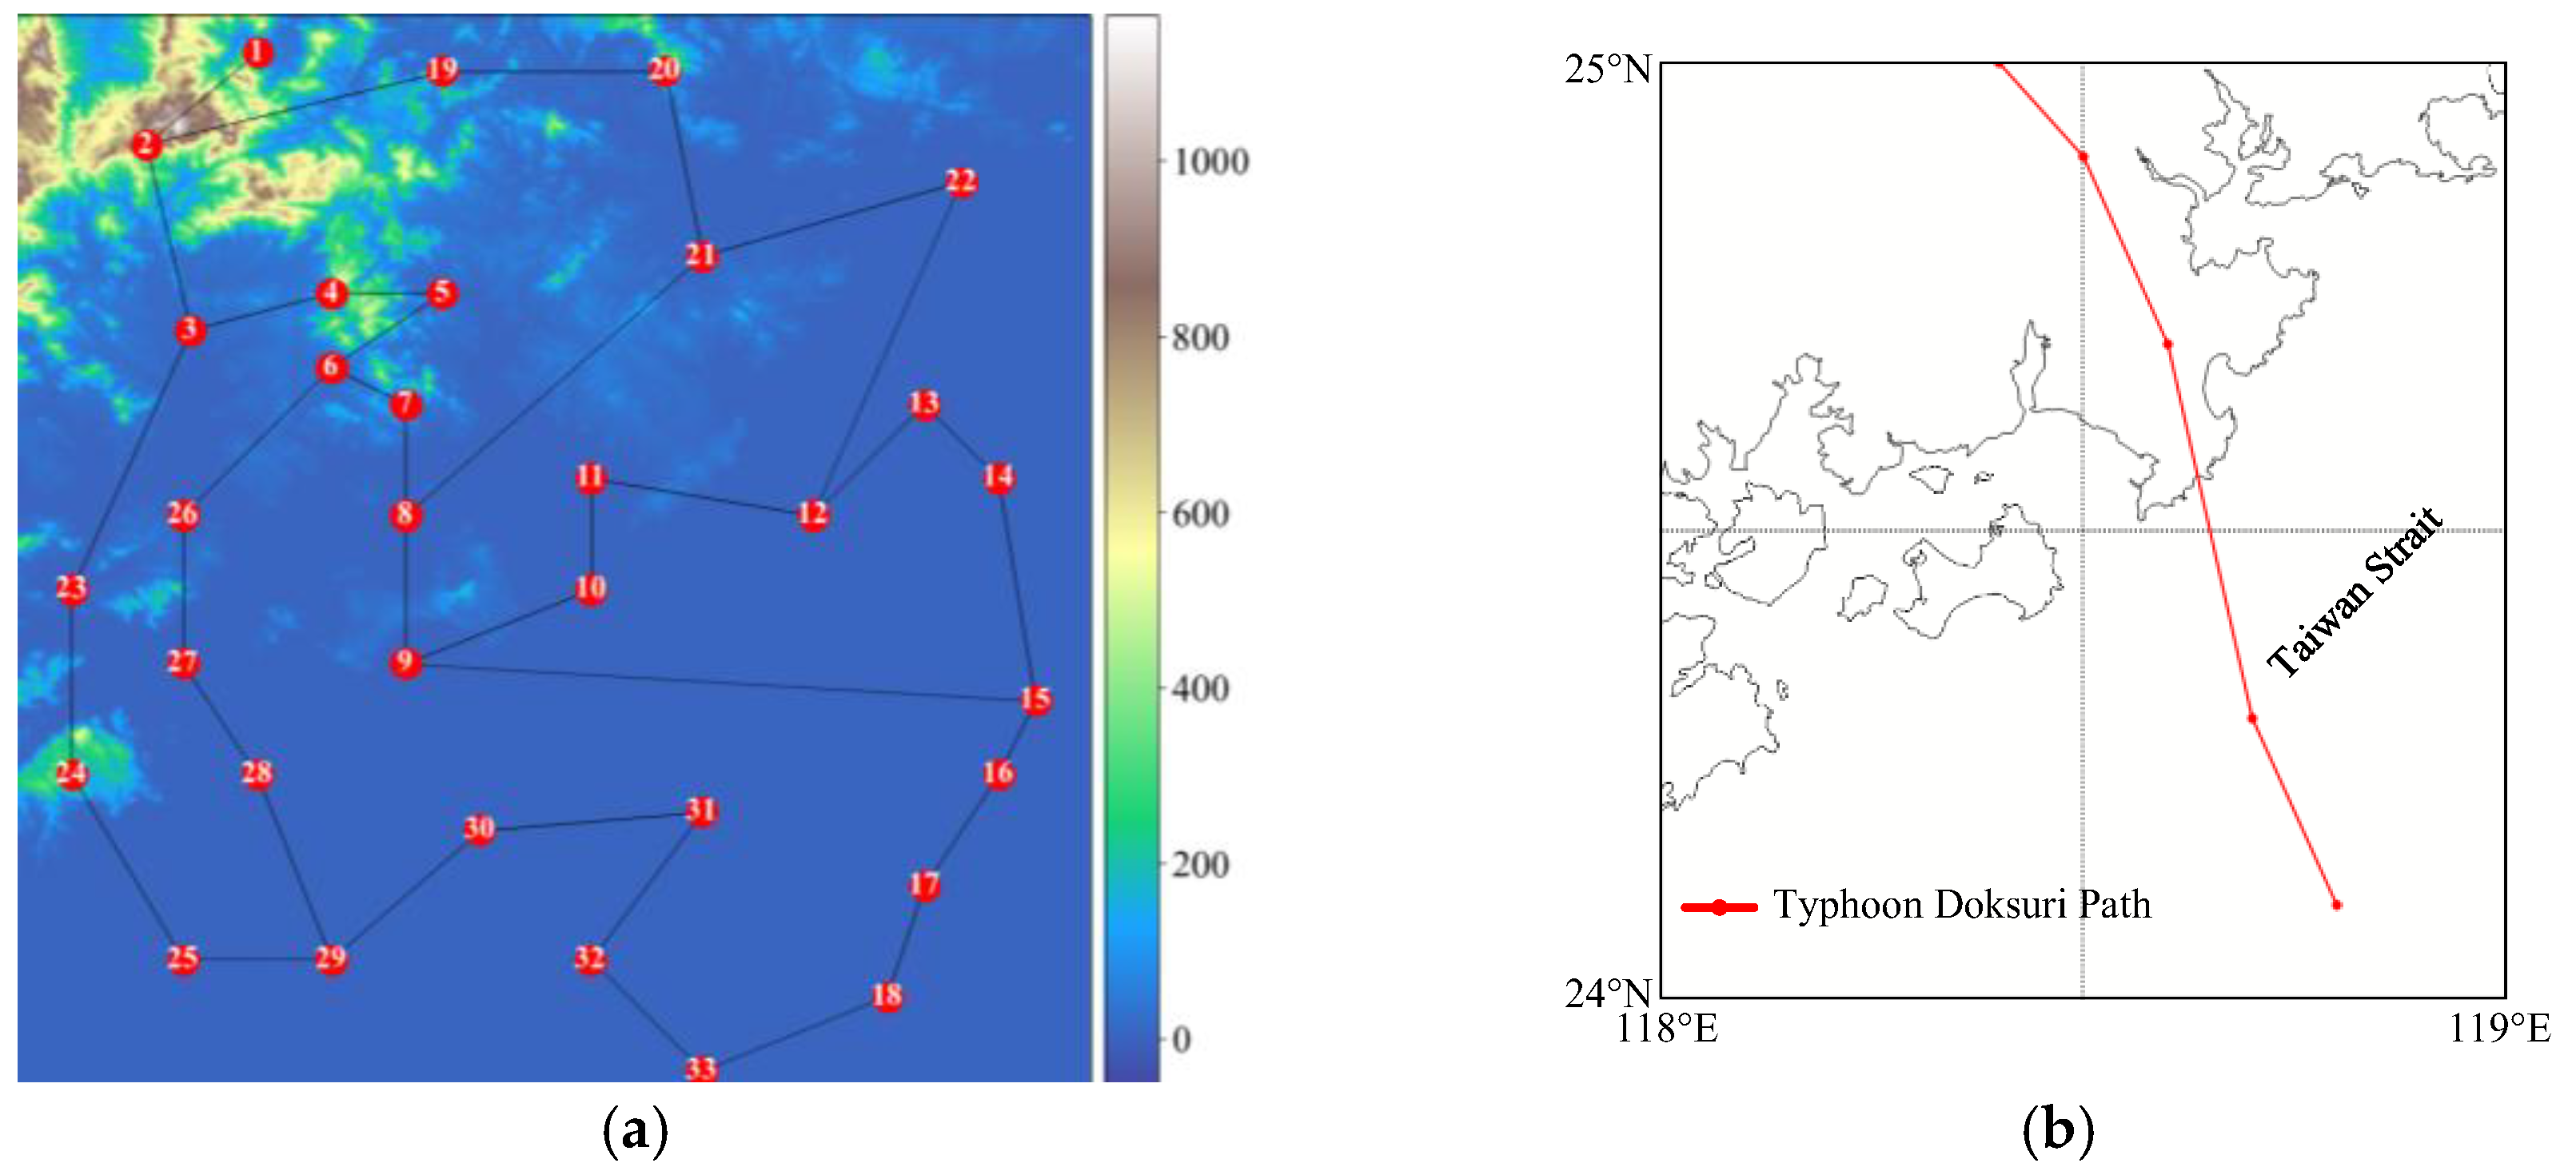
In this section, the IEEE-33 bus system is used as an example to illustrate the effectiveness of the proposed method with the real situation of an area during the landfall of super typhoon “Doksuri” in Fujian Province, China in 2023. The elevation map of the region and the distribution of the IEEE-33 node system are shown in Figure 5a, and the bluer the area in the figure, the lower the elevation. The simulation time is from 8:00 to 13:00 on 28 July 2023, a total of 6 h, during which the best track data and path of Typhoon “Dusuari” are shown in Table 1 and Figure 5b, respectively. It is worth noting that the area shown in Figure 5a lies in the path of the typhoon shown in Figure 5b. The geographic elevation maps are obtained from [21], the best track data are obtained from [22], and the fifth generation of European Centre for Medium-Range Weather Forecasts (ERA5) [23] is used to study the vertical wind shear and the total column water volume.
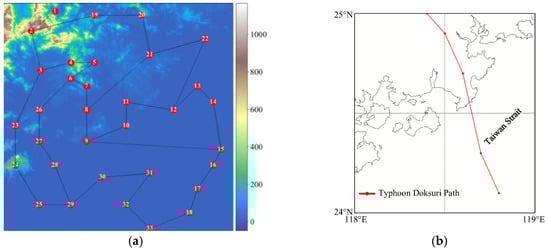
Figure 5.
(a) The elevation map of the region and the distribution of the IEEE-33 node system; (b) The best path of Typhoon “Doksuri”.

Table 1.
Best track data of Typhoon “Doksuri”.
The IEEE-33 node system comprises 33 nodes, 32 branches, and 5 tie lines; detailed data can be found in [24]. In this study, node 1 serves as the power source, while distributed generators (DGs) are installed at nodes 10, 18, 19, 23, and 31. Energy storage devices are located at nodes 6, 13, 21, and 29. Critical load nodes include 2, 4, 6, 8, 12, 14, 20, 25, 28, and 31, with a load weight of 1 and a loss of power outage cost of 122.7 CNY/kWh; other nodes represent ordinary loads with a weight of 0.1 and a loss of power outage cost of 14 CNY/kWh.
Other parameter settings are as follows: the maximum wind speed radius (Rmax) during a typhoon is calculated using the specified formula , and the surface roughness (zo) is set at 0.2 m. Relevant parameters for the rainfall model can be found in [15]. The critical moisture content thresholds for transformer insulation oil spark discharge and oil-impregnated paper breakdown are 0.023% and 18%, respectively. The design flood protection height for the energy storage devices is 400 mm.
Considering that the distribution system impacts various aspects of societal operations, it can achieve a ring network operation through tie lines before a disaster occurs, thereby maximizing the reliability of the power supply.
5.2. Typhoon Disaster Chain Simulation and Component Failure Probability
Based on the disaster chain model presented in Section 2.2, dynamic weather states for each node were calculated, with Figure 6a,b and Figure 7a illustrating the spatiotemporal distributions of wind speed, rainfall intensity, and flooding depth, respectively. According to the typhoon’s trajectory information, the typhoon made landfall on 28 July at approximately 10:00 (t = 3). Figure 6a indicates that wind speeds at various nodes were generally high at landfall, but decreased overall as the typhoon weakened after landfall.
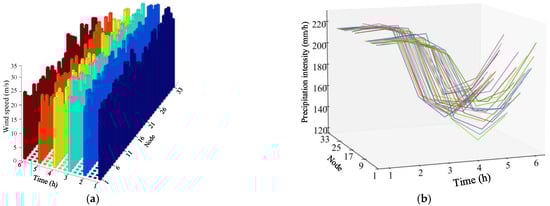
Figure 6.
(a) Wind speed of nodes; (b) Precipitation intensity of nodes.
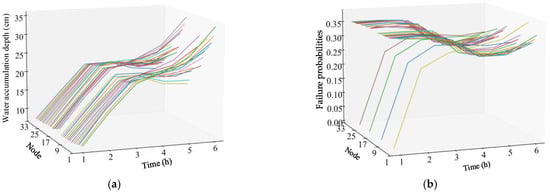
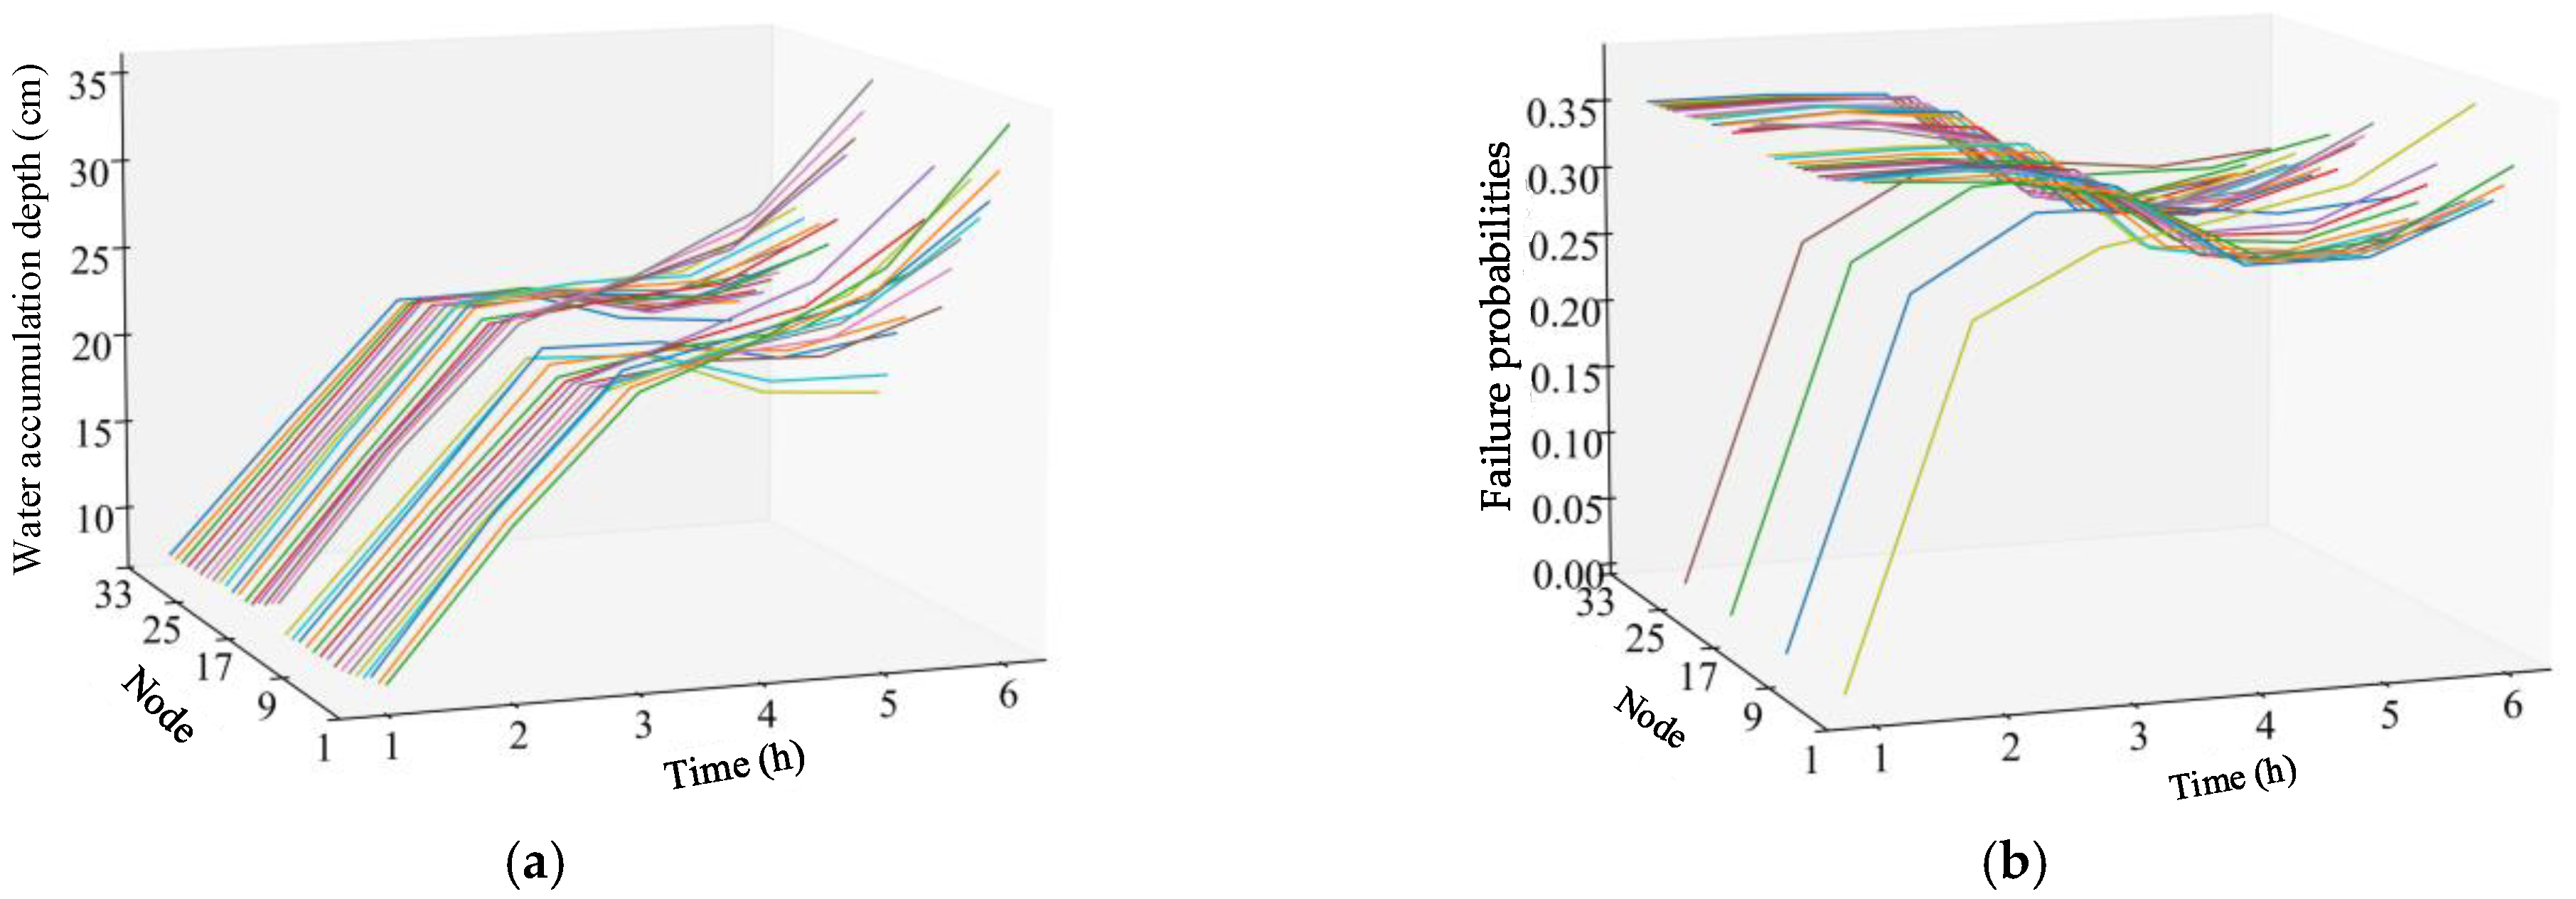
Figure 7.
(a) Water accumulation depth of nodes; (b) Failure probability of nodes.
Figure 6b demonstrates that rainfall exhibited a trend of initially increasing, followed by a decrease, and then a rebound around the time of landfall. As the typhoon approached the coast, its outer rain bands first impacted coastal areas, leading to a gradual increase in rainfall. Upon landfall, the rainfall reached a peak; however, as the typhoon progressed inland and weakened, rainfall rapidly decreased. Nevertheless, the residual rain bands, influenced by topographical uplift effects or other weather systems, may cause a resurgence of rainfall in certain areas.
Figure 7a shows that the water accumulation depth at the nodes gradually increased from zero. Initially, the rainfall intensity did not exceed the drainage capacity, but as the torrential rain continued, the drainage system began to operate under overload conditions, causing rapid rises in water levels in rivers, drainage ditches, and underground pipelines. The selected area, being coastal and at a lower elevation, contributed to the increasing water accumulation depth at some nodes. Notably, node 33 reached a water accumulation depth of 0.354 m at t = 6.
Figure 7b illustrates the changing trends in failure probabilities for each node. The classification of nodes in the distribution system is based on the type of equipment. As discussed in Section 3.1, failure modeling for substations is influenced by transformer moisture levels, while for energy storage devices, it is based on flooding depth. Consequently, the failure rate for energy storage nodes begins at zero and increases, mirroring the trend of flooding depth, whereas the failure probability for substation nodes aligns more closely with rainfall intensity trends. This assumption aims to reduce the computational complexity of failure probability calculations; in practical applications, utility companies can integrate historical disaster loss data with real-time meteorological forecasts for comprehensive failure rate assessments based on big data and situational awareness.
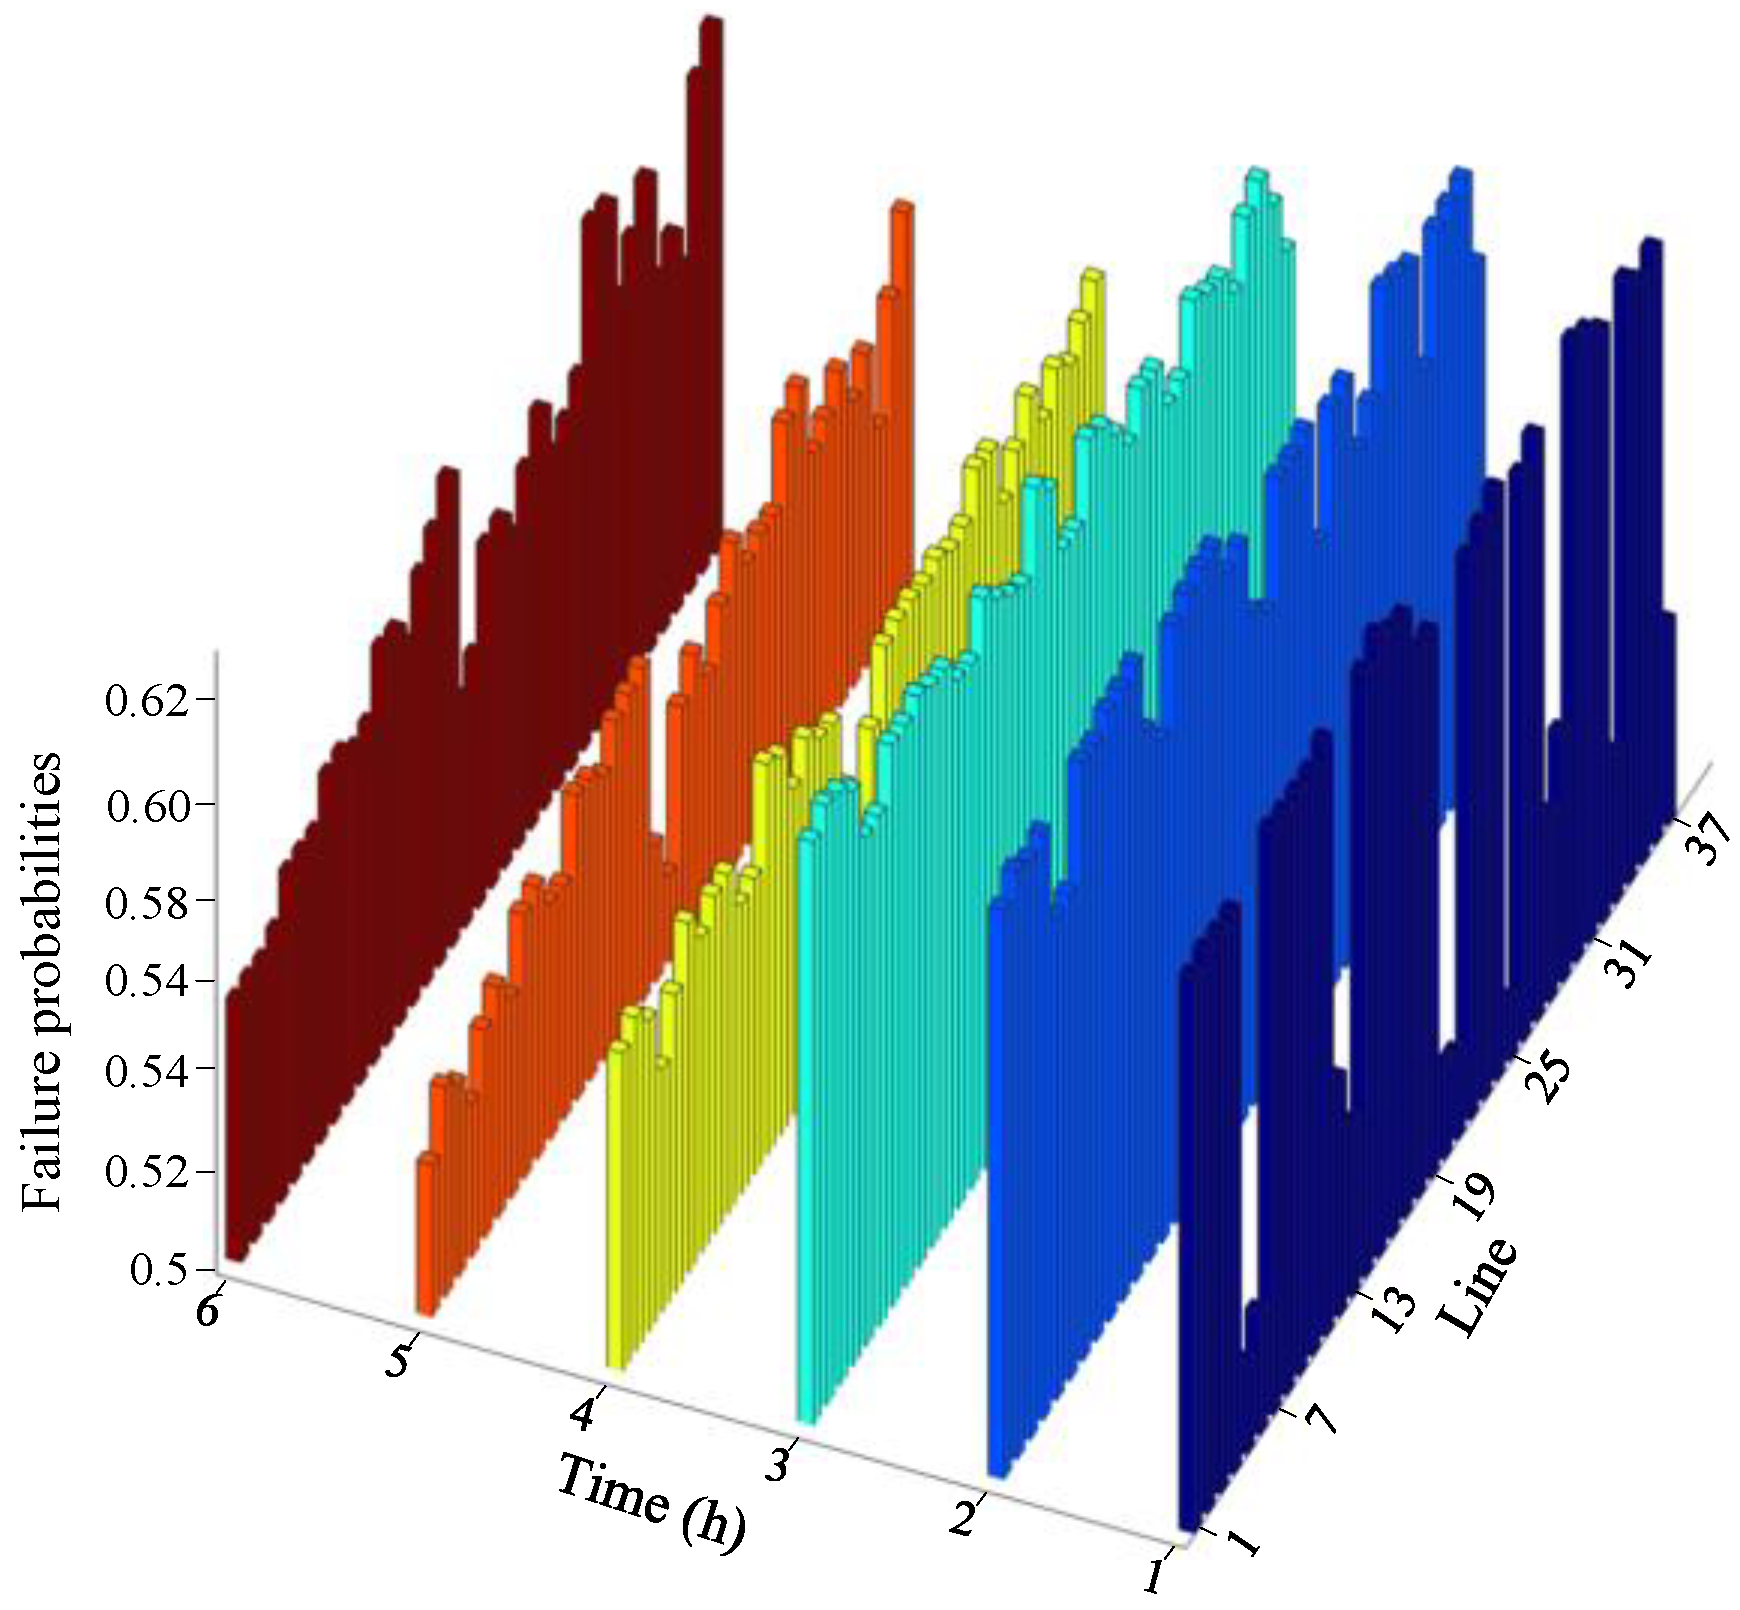
Figure 8 presents the spatiotemporal distribution of line failure probabilities. As noted in Section 3, line failure probabilities are influenced by wind speed and rainfall intensity. In this study, it is assumed that if either end of a line’s nodes fails, the line itself is also considered to have failed. Therefore, the line failure probability is derived from the failure probabilities of the end nodes and the line’s inherent failure probability through the probability of independent events. Consequently, the trend in line failure probability encompasses variations in wind speed, rainfall intensity, and node failure probabilities. The figure shows that line failure probabilities are generally greater than node failure probabilities, indicating that lines are the most vulnerable component of the distribution network under the impact of the typhoon disaster chain. This observation aligns with the damage reports observed during Typhoon “Doksuri”’s landfall in Fujian [2].
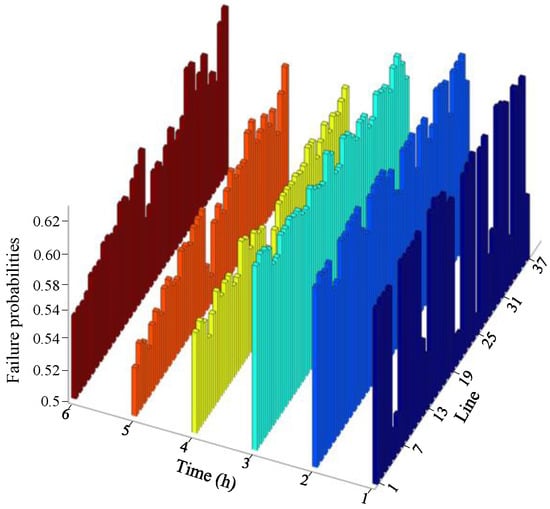
Figure 8.
Failure probability of transmission lines.
5.3. Systemic Risk Indicators
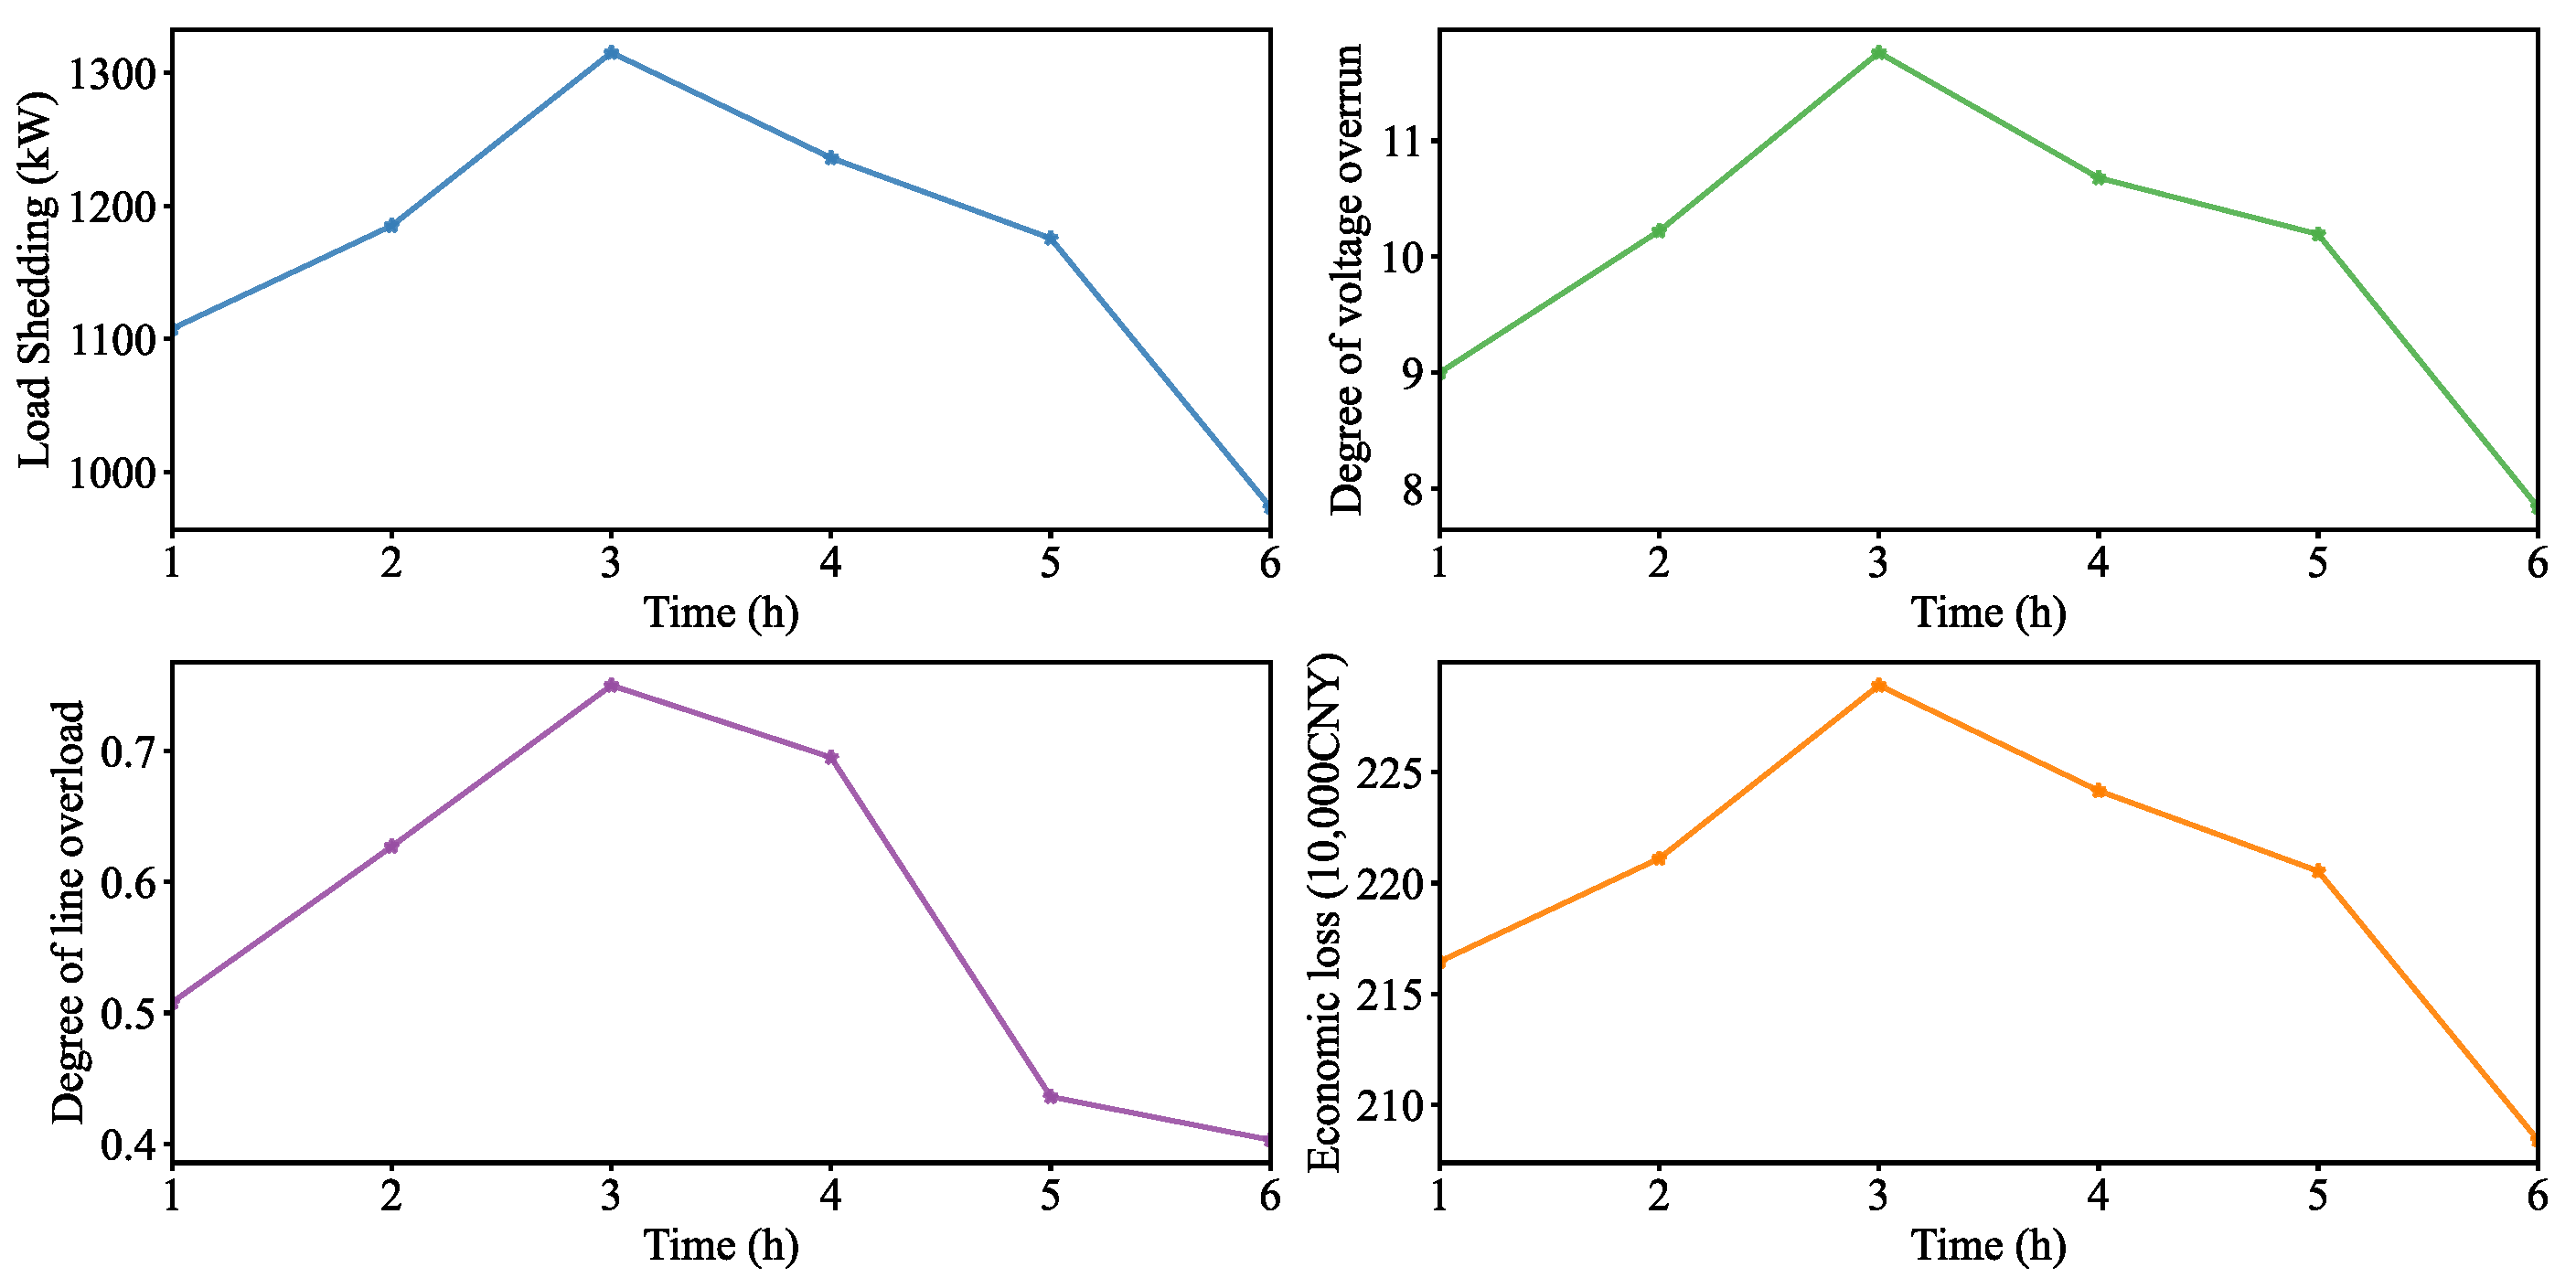
Based on the risk assessment method described in Section 4, 1000 random samples were taken of the operational state of the power distribution system at each time point. The simulation results are presented as follows: Figure 9 illustrates the simulation outcomes for load shedding risk indices, voltage violation risk indices, line overload risk indices, and economic loss risk indices at various time points, with results expressed as expected values. As analyzed in Section 5.2, the system faces the most severe challenges at the time of typhoon landfall (t = 3). As shown in Figure 9, it is evident that at t = 3, the load shedding indicator for the distribution system reaches 1315.3 kW, with a load shedding rate of 35.4%. The voltage violation indicator is 11.76, the line overload indicator is 0.75, and the resulting economic loss amounts to 2,289,200 CNY, highlighting the substantial challenges and severe impacts posed by the typhoon disaster chain on the operation of the distribution system.
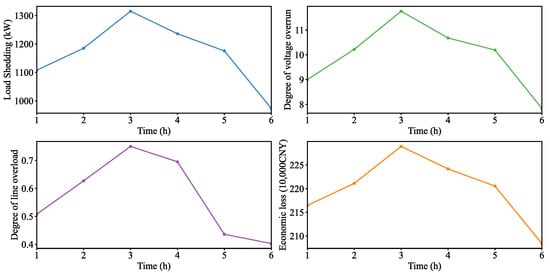
Figure 9.
Risk indicators of load shedding, voltage overrun, line overload and economic loss at different time steps.
In this study, weak points in the distribution system are categorized into weak nodes and weak lines. The total risk value is allocated to individual nodes and components based on the proportional allocation method, followed by ranking. Weak nodes are identified based on the load-shedding rate and the extent of voltage violations. As indicated in Equation (31), when a node experiences a fault, its voltage is considered to be zero, classifying it as a violation. Thus, both the voltage violation extent and the load shedding rate serve as criteria for identifying weak nodes. Table 2 lists the top five nodes ranked by voltage violation extent and load shedding rate at t = 3. It is evident from Table 2 that nodes 6, 26, 12, 27, and 29 share the same ranking in both categories, confirming their status as weak nodes in the distribution system.
Table 2.
Ranking of node voltage violation and shedding load rate at t = 3.
Weak lines are identified based on the frequency of faults occurring during the 1000 simulations. Table 3 presents the top five lines ranked by fault occurrence at t = 3. According to Table 3, lines l30–31, l2–19, l12–22, l25–29, and l10–11 have the highest fault counts, indicating their classification as weak lines within the distribution system. Therefore, it is imperative to implement targeted measures to reinforce weak nodes and lines and deploy emergency resources before the onset of a disaster.
Table 3.
Ranking of the number of line failures at t = 3.
6. Conclusions
This paper proposes a risk assessment methodology for power distribution systems considering the spatiotemporal characteristics of typhoon disaster chains. By analyzing the formation mechanisms of the typhoon disaster chain and modeling the failure probabilities of system components during the typhoon disaster chain, a comprehensive risk evaluation framework is established. A non-sequential Monte Carlo state sampling method, combined with distribution system risk assessment indices, was employed to assess the impact of typhoon events on the power system. The case study, based on the IEEE-33 bus system during the landfall of Typhoon “Doksuri”, demonstrated the effectiveness of the proposed method. Simulation results showed that at the time of typhoon landfall, the load shedding reached 1315.3 kW with a load shedding rate of 35.4%. The economic loss at this point amounted to 2,289,200 CNY. Furthermore, failure probabilities of critical components, such as energy storage devices and transmission lines, increased significantly due to the typhoon’s impact. These results underline the vulnerability of certain nodes and lines in the distribution network and the importance of reinforcement strategies. The proposed methodology provides a systematic approach for assessing the disaster risk of power distribution systems under extreme weather events. Future work could focus on integrating real-time meteorological data and refining the model to further enhance the accuracy of risk predictions and improve disaster response strategies.
Author Contributions
Conceptualization, B.C.; methodology, B.C. and N.S.; software, H.C.; formal analysis, L.Z.; investigation, J.W.; resources, J.W.; writing—original draft, J.S.; writing—review and editing, B.C. All authors have read and agreed to the published version of the manuscript.
Funding
This research was funded by [State Grid Fujian Electric Power Co., Ltd. Science and Technology Project] grant number [52130N23002H].
Data Availability Statement
The original contributions presented in the study are included in the article, further inquiries can be directed to the corresponding author.
Conflicts of Interest
Authors Bin Chen, Nuoling Sun, Hao Chen and Linyao Zhang were employed by Economic and Technological Research Institute of State Grid Fujian Electric Power Co., Ltd. and Distribution Network Planning and Operation Control Technology in Multiple Disaster Superimposed Areas State Grid Corporation Laboratory. Authors Jiawei Wan and Jie Su were employed by State Grid Electric Power Research Institute, Wuhan NARI Limited Liability Company. The State Grid Fujian Electric Power Co., Ltd. had no role in the design of the study; in the collection, analyses, or interpretation of data; in the writing of the manuscript, or in the decision to publish the results.
References
- Xi Stresses Healthy Growth of Platform Economy, Efforts for Carbon Peak and Neutrality. Available online: http://en.qstheory.cn/2021-03/16/c_603674.htm (accessed on 31 October 2024).
- The Latest! “Doksuri” caused 1,304,700 Power Outages in Fujian! Power Has Been Restored to 323,600 Households! Available online: https://m.gmw.cn/2023-07/28/content_1303458416.htm?source=sohu (accessed on 31 October 2024).
- Sun, L.; Wang, H.; Huang, Z.; Wen, F.; Ding, M. Coordinated Islanding Partition and Scheduling Strategy for Service Restoration of Active Distribution Networks Considering Minimum Sustainable Duration. IEEE Trans. Smart Grid 2024, 15, 5539–5554. Available online: https://ieeexplore.ieee.org/document/10609444 (accessed on 19 December 2024). [CrossRef]
- Fan, R.; Zeng, W.; Ming, Z.; Zhang, W.; Huang, R.; Liu, J. Risk Reliability Assessment of Transmission Lines under Multiple Natural Disasters in Modern Power Systems. Energies 2023, 16, 6548. [Google Scholar] [CrossRef]
- Hou, H.; Yu, S.; Wang, H.; Huang, Y.; Wu, H.; Xu, Y.; Li, X.; Geng, H. Risk Assessment and Its Visualization of Power Tower under Typhoon Disaster Based on Machine Learning Algorithms. Energies 2019, 12, 205. [Google Scholar] [CrossRef]
- Liu, X.; Liu, J.; Zhao, Y.; Ding, T.; Liu, X.; Liu, J. A Bayesian Deep Learning-Based Probabilistic Risk Assessment and Early-Warning Model for Power Systems Considering Meteorological Conditions. IEEE Trans. Ind. Inform. 2024, 20, 1516–1527. [Google Scholar] [CrossRef]
- Xu, L.; Lin, N.; Xi, D.; Feng, K.; Poor, H.V. Hazard Resistance-Based Spatiotemporal Risk Analysis for Distribution Network Outages During Hurricanes. arXiv 2024, arXiv:2401.10418. [Google Scholar] [CrossRef]
- Wang, J.; Xiong, Z.; Zhang, T.; Ouyang, J. Short-Term Multiple Fault Risk Assessment for Power Systems Considering Unexpected Actions of Protection System Under Weather Disasters. Int. J. Electr. Power Energy Syst. 2024, 162, 110254. [Google Scholar] [CrossRef]
- Afzal, S.; Mokhlis, H.; Illias, H.A.; Bajwa, A.A.; Mekhilef, S.; Mubin, M.; Muhammad, M.A.; Shareef, H. Modelling Spatiotemporal Impact of Flash Floods on Power Distribution System and Dynamic Service Restoration with Renewable Generators Considering Interdependent Critical Loads. IET Gener. Transm. Distrib. 2024, 18, 368–387. [Google Scholar] [CrossRef]
- Ti, B.; Li, G.; Zhou, M.; Wang, J. Resilience Assessment and Improvement for Cyber-Physical Power Systems Under Typhoon Disasters. IEEE Trans. Smart Grid 2022, 13, 783–794. [Google Scholar] [CrossRef]
- Souto, L.; Yip, J.; Wu, W.-Y.; Austgen, B.; Kutanoglu, E.; Hasenbein, J.; Yang, Z.-L.; King, C.W.; Santoso, S. Power System Resilience to Floods: Modeling, Impact Assessment, and Mid-Term Mitigation Strategies. Int. J. Electr. Power Energy Syst. 2022, 135, 107545. [Google Scholar] [CrossRef]
- Lian, X.; Qian, T.; Li, Z.; Chen, X.; Tang, W. Resilience Assessment for Power System Based on Cascading Failure Graph Under Disturbances Caused by Extreme Weather Events. Int. J. Electr. Power Energy Syst. 2023, 145, 108616. [Google Scholar] [CrossRef]
- Hou, H.; Zhang, Z.; Wei, R.; Huang, Y.; Liang, Y.; Li, X. Review of failure risk and outage prediction in power system under wind hazards. Electr. Power Syst. Res. 2022, 210, 108098. [Google Scholar] [CrossRef]
- Wu, F.; Huang, G. Refined Empirical Model of Typhoon Wind Field and Its Application in China. J. Struct. Eng. 2019, 145, 04019122. [Google Scholar] [CrossRef]
- Kim, D.; Park, D.-S.R.; Nam, C.C.; Bell, M.M. The Parametric Hurricane Rainfall Model with Moisture and Its Application to Climate Change Projections. NPJ Clim. Atmos. Sci. 2022, 5, 86. [Google Scholar] [CrossRef]
- Wang, Y.; Zhou, B.; Zhang, C.; Or, S.W.; Gao, X.; Da, Z. A Hybrid Data and Knowledge Driven Risk Prediction Method for Distributed Photovoltaic Systems Considering Spatio-Temporal Characteristics of Extreme Rainfalls. IEEE Trans. Ind. Applicat. 2024, 1–11. [Google Scholar] [CrossRef]
- He, Y. Study on the Enhancing the Response Capacity of Disaster of Distribution Network with Distributed Generation; Northeastern University: Boston, MA, USA, 2018. (In Chinese) [Google Scholar]
- Gautam, P.; Piya, P.; Karki, R. Resilience Assessment of Distribution Systems Integrated with Distributed Energy Resources. IEEE Trans. Sustain. Energy 2021, 12, 338–348. [Google Scholar] [CrossRef]
- Fu, X.; Li, H.-N.; Li, G. Fragility Analysis and Estimation of Collapse Status for Transmission Tower Subjected to Wind and Rain Loads. Struct. Saf. 2016, 58, 1–10. [Google Scholar] [CrossRef]
- Hu, B.; Xie, K.; Shao, C.; Pan, C.; Lin, C.; Zhao, Y. Commentary on risk of new power system under goals of carbon emission peak and carbon neutrality: Characteristics, indices and assessment methods. Autom. Electr. Power Syst. 2023, 47, 1–15. (In Chinese) [Google Scholar]
- U.S. Geological Survey. Earth Explorer. Available online: https://earthexplorer.usgs.gov (accessed on 31 October 2024).
- A Dataset of Typhoon Tracks in Offshore China (1945–2023). Available online: http://msdc.qdio.ac.cn (accessed on 31 October 2024).
- Hersbach, H.; Bell, B.; Berrisford, P.; Hirahara, S.; Horányi, A.; Muñoz-Sabater, J.; Nicolas, J.; Peubey, C.; Radu, R.; Schepers, D.; et al. Complete ERA5 from 1940: Fifth generation of ECMWF atmospheric reanalysis of the global climate. Copernic. Clim. Chang. Serv. (C3S) Data Store (CDS) 2017, 10. [Google Scholar] [CrossRef]
- Baran, M.E.; Wu, F.F. Network Reconfiguration in Distribution Systems for Loss Reduction and Load Balancing. IEEE Trans. Power Deliv. 1989, 4, 1401–1407. [Google Scholar] [CrossRef]

Disclaimer/Publisher’s Note: The statements, opinions and data contained in all publications are solely those of the individual author(s) and contributor(s) and not of MDPI and/or the editor(s). MDPI and/or the editor(s) disclaim responsibility for any injury to people or property resulting from any ideas, methods, instructions or products referred to in the content. |
© 2025 by the authors. Licensee MDPI, Basel, Switzerland. This article is an open access article distributed under the terms and conditions of the Creative Commons Attribution (CC BY) license (https://creativecommons.org/licenses/by/4.0/).