Article

Research on the Location and Capacity Determination Strategy of Off-Grid Wind–Solar Storage Charging Stations Based on Path Demand

1
Engineering Research Center of Education Ministry for Renewable Energy Power Generation and Grid Connection, Xinjiang University, Urumqi 830046, China
2
School of Electrical Engineering, Xinjiang University, Urumqi 830046, China
*
Author to whom correspondence should be addressed.
Processes 2025, 13(3), 786; https://doi.org/10.3390/pr13030786
Submission received: 7 January 2025 / Revised: 1 March 2025 / Accepted: 6 March 2025 / Published: 8 March 2025
(This article belongs to the Section Energy Systems)

Abstract

:
To address the challenges of cross-city travel for different types of electric vehicles (EV) and to tackle the issue of rapid charging in regions with weak power grids, this paper presents a strategic approach for locating and sizing highway charging stations tailored to such grid limitations. Initially, considering the initial EV state of charge, a path-demand-based model for EV charging station location–allocation is proposed to optimize station numbers and enhance vehicle flow, which indicates the passing rate of vehicles. Subsequently, a capacity configuration model is formulated, integrating wind, photovoltaic, storage, and diesel generators to manage the stations’ load. This model introduces a new objective function, the annual comprehensive cost, encompassing installation, operation, maintenance, wind and solar curtailment, and diesel generation costs. Simulation examples on north-western cross-city highways validate the efficacy of this approach, showing that the proposed wind–solar storage fast-charging station site selection and capacity optimization model can effectively cater to diverse electric vehicle charging demands. Moreover, it achieves a 90% self-consistency rate during operation across various typical daily scenarios, ensuring a secure and economically viable operational performance.

1. Introduction

The “dual-carbon” goal proposal has made the widespread adoption of electric vehicles a crucial strategy for achieving decarbonization in transportation [1]. However, EVs still lag behind traditional fuel vehicles in terms of long-distance travel and rapid charging capabilities. This discrepancy is particularly evident in the western regions of China, where sparse road networks and weak power grids impede the proliferation of electric vehicles. Given the abundant wind and solar power resources in these areas, establishing wind–solar storage charging stations emerges as a pivotal solution. This initiative not only effectively caters to the energy demands of charging stations in areas with weak power grids but also aligns with the objectives outlined in the national “14th Five-Year Plan for Renewable Energy Development”, actively responding to the strategic imperative for renewable energy advancement [2].
The current global scholarly attention on the site selection and capacity planning of EV charging stations has been significant. Scholars have proposed various strategies considering factors like road conditions, load demands, grid impacts, and costs. For example, Dong Xiaohong et al. developed a model using the SNN clustering algorithm to select sites and determine fast charging stations’ capacities on circular highways [3]. Jia Long et al. utilized a two-stage planning approach, starting with identifying potential site locations based on EV charging demands on high-speed road networks and then optimizing station locations and capacities with cost considerations [4]. Zhao Feng et al. addressed the uncertainty of photovoltaic and load at grid-connected highway solar energy storage charging stations through a distributed robust optimization method, conducting site selection and capacity determination in two stages [5]. Gregorio et al. introduced a stochastic planning model for charging stations to minimize total costs by considering the uncertainties of renewable energy and load demands [6]. Conversely, Ding Zhaohao et al. focused on maximizing profits and created a capacity optimization model for charging stations [7]. The existing research predominantly focuses on grid-connected charging stations reliant on the main power grid, with a relatively low adoption rate of new energy sources.
In regions lacking the support of a large power grid, new energy sources play a crucial role in supplying electricity to charging stations. Mostata F. Shaaban et al. focused on minimizing operational costs and carbon emissions by employing a mixed-integer two-level planning model to select sites and determine capacities for off-grid charging stations [8]. Chen Zheng et al. specifically addressed charging stations equipped with photovoltaic generation, optimizing their configurations to reduce investment and operational costs while maximizing the utilization of renewable energy [9,10]. Although these studies addressed off-grid operations with new energy sources, they primarily focused on individual charging stations with point demands for capacity planning, neglecting the comprehensive capacity planning for multiple stations based on route demands. The placement of varying numbers and locations of charging stations along the same road can lead to fluctuations in daily load demands at each station, thereby influencing the capacity planning process. This impact is particularly significant for off-grid charging stations with stringent requirements for source load matching.
In summary, the establishment of wind–solar storage charging stations encounters several challenges. Firstly, EV charging is influenced by various influences, such as EV characteristics and driver decisions, leading to significant unpredictability. Due to significant differences in battery capacities among electric vehicle types, modeling must consider both vehicle types and battery sizes. Using a single-vehicle type model may lead to inaccurate site selection results. Neglecting high-capacity vehicles could result in overestimating site needs. Additionally, travel times affect station load demands, influencing site capacity decisions. Therefore, traffic flow models for electric vehicles should consider daily traffic flow variations on target routes. Secondly, regions with weak power grids face issues of high energy costs and poor reliability, compounded by the relatively high costs of enhancing power supply reliability through source storage configurations, which creates a dilemma.
To address these issues, this paper delves into the site selection and capacity planning of EV charging stations in areas without robust grid support. The main innovations include improving the flow-refueling location model to cater to diverse EV charging needs along routes with varying city-to-city distances and battery capacities. Furthermore, based on the result of location–allocation, a wind–solar storage charging station model is proposed to maintain power balance without relying on the main power grid, ensuring self-consistent operation across different scenarios.

2. EV Charging Station Site Planning

The planning of the charging station site is primarily divided into three steps. The first step involves establishing different models of electric vehicle travel. The second step entails creating a charging station site selection model based on route demands using electric vehicle travel data. The third step involves utilizing NSGA-II optimization algorithms to solve the site selection objectives, ultimately providing site selection results suitable for the long-distance intercity travel of different types of electric vehicles.

2.1. Electric Vehicle Model

Considering the various real-world traffic demands, the Monte Carlo method was employed to enhance the diversity of different EV samples. Following a thorough investigation of the global automotive battery markets, four distinct types of EVs were identified in the EV database: light four-wheel vehicles (L), passenger vehicles (M), light-duty trucks (N1), and heavy-duty trucks (N2) [11]. Based on varying battery range capabilities, the probability density function formula for the maximum capacity Ecap was established.
f ( E cap , μ 1 , δ 1 ) = 1 δ 1 2 π e E c a p μ 1 2 δ 1 2
g ( E cap , μ 2 , δ 2 ) = 1 δ 2 Γ ( μ 2 ) E cap μ 2 1 e E cap δ 2
where f(Ecap, μ1, δ1) is the probability density function of the maximum capacity of batteries for L and M, which follows a gamma distribution; g(Ecap, μ2, δ2) is the probability density function of the maximum capacity of batteries for N1 and N2 EVs, which follows a normal distribution; μ1 and δ1 are the shape and scale parameters of the gamma distribution; and μ2 and δ2 are the mean and standard deviation of the normal distribution.
The maximum driving range of an EV Smax and the battery’s maximum capacity Ecap are determined through polynomial fitting [12]. According to the literature, the battery’s state of charge (SOC) changes linearly with the driving distance [13]. Formulas (3) and (4) illustrate the distance Sac an EV can travel after normal charging and the remaining distance it can travel Sc when there is a charging demand.
S ac = η ( S O C i S O C c ) S max
S c = η S O C c S max
where η is the efficiency coefficient, SOCi is the state of charge of the battery when the EV completes charging, SOCc is the state of charge of the battery when there is a charging demand, and Smax is the maximum driving range of the EV under full battery state.
The charging duration Tc of the EV can be represented as:
T c = S ac W 1 0.9 P c
where W1 is the energy consumption per unit distance of the EV (kWh/km) and Pc is the charging power (kW).

2.2. Traffic Flow Model

Using the historical traffic flow data of the planned road area as a basis, a probability distribution model was established, and Monte Carlo simulation was employed to estimate the traffic flow in different time periods of the road area throughout the year, calculating the daily average traffic flow index [14]. The starting driving time of electric vehicles (EVs) follows a pattern similar to daily travel habits, with its probability distribution depicted in Figure 1.

2.3. Site Selection Planning Model

This study employed the Flow Refueling Location Model (FRLM) for the selection of charging station sites. The model identifies the optimal combination of charging stations along a specified route to facilitate electric vehicles (EVs) in charging and completing their journey within their driving range, effectively capturing the traffic flow along the route [15].
The model assumptions are as follows:
(1)
The electric vehicles considered in this model are based on the four types proposed in Section 2.1, where the electric vehicle battery capacity follows the corresponding probability distribution, and there is a correlation between the maximum range and battery capacity.
(2)
The driving distance of electric vehicles is linearly related to the battery level. Vehicles always travel via the shortest path without considering detours or traffic congestion.
(3)
Regarding the charging station selection strategy, in alignment with real-world driver decisions, when a vehicle’s remaining battery level falls below 30% and it can reach the next charging station i, it will inevitably choose to charge at station i. When the vehicle passes through charging station j with a battery level above 30% but insufficient to reach the next station k, it will opt to charge at station j.
(4)
Cars use DC fast charging on highways. According to the relevant literature, charging times are faster between 20% and 80% battery levels, with charging time after 80% accounting for over 50% of the total time. Considering charging duration and driver range anxiety, cars are assumed to have a battery level between 80% and 90% after charging at the station. Type L vehicles with smaller battery capacities depart from the charging station with a full battery after charging.
Initially, calculations were made for the normal driving distance and remaining distance when charging is required based on the initial state of charge of electric vehicles. The minimum remaining distance determines the service range of a single charging station, leading to the identification of predetermined charging station locations. Different combinations of charging stations are generated based on the predetermined charging points.
Subsequently, a flow capture model that accommodates various types of vehicles was established. Utilizing the spatiotemporal vehicle model mentioned earlier, the number of vehicles capable of completing the entire charging process and completing cross-city travel under different combinations of charging stations was calculated. To minimize the number of charging station combinations and maximize the intercepted traffic, target functions were established as outlined below:
Objective function:
Z max = i = 1 E y i
X min = j = 1 J X j
where Zmax is the maximum traffic flow intercepted on the target route, E is the daily traffic flow count on the target route, and Xmin is the minimum number of charging stations.
Constraint conditions:
j = 1 J X j J
y i { 0 , 1 }
X j { 0 , 1 }
where J is the number of predetermined charging station points, yi being 1 indicates that the i-th EV can been captured by the current charging station combination, and Xj being 1 indicates establishing a charging station at the predetermined point j.
Finally, utilizing the NSGA-II algorithm to solve the model and obtain the Pareto frontier, the optimal combination of charging stations was selected based on the site selection index. The formula is as follows:
O = ( 1 Z max / E ) + X min / J
Equation (11) shows that a smaller O value corresponds to a higher vehicle passing rate, requiring the minimum number of charging stations and lower costs for constructing the charging station combination.

2.4. Solution Process

The charging station siting model was solved using NSGA-II, and the specific siting process and solution method are illustrated in Figure 2.
During the population initialization phase, it is necessary to encode the charging station combinations using binary representation. Each charging station combination represents a chromosome, where the chromosome’s length corresponds to the number of predetermined charging station locations. In this context, each gene on the chromosome signifies a specific charging station location, with a gene value of 1 indicating the presence of a charging station at that location and 0 indicating its absence. Following the mathematical model outlined in Section 2.3, consider an example charging station combination X = {0, 1, 1, 1, …, 0, 1}. N random individuals are then generated to establish the initial population.

3. EV Charging Station Capacity Planning

The paper focuses on the self-consistent system of wind–solar storage charging stations for remote road sections. Building upon the aforementioned site selection results, a strategy is proposed for off-grid source storage configuration based on wind–solar natural resource assessment and considerations of adverse weather conditions. This strategy aims to optimize the operation of wind–solar storage charging stations. The specific process is outlined as follows:
Firstly, to address the issue of missing meteorological data for certain planned road sections, a model was established to calculate solar irradiance and wind speed based on wind–solar natural resource assessment, subsequently deriving the power characteristics of the energy sources.
Secondly, utilizing these power characteristics, annual wind–solar power output data were obtained, and the K-means clustering algorithm was enhanced to identify typical wind–solar power output scenarios.
Finally, a configuration model was developed based on the charging station power characteristics and typical wind–solar power output scenarios to ensure self-consistency and economic feasibility. The optimal configuration results are obtained using the CPLEX solver.

3.1. System Structure

The system structure of the wind–solar storage charging station studied in this paper was designed for highways that operate independently of the main power grid, as depicted in Figure 3.
To meet the requirements for independent system operation, wind power and solar power were utilized as the primary energy sources for the system. Considering the variability of wind–solar power generation and the possibility of insufficient generation under extreme conditions, energy storage systems and diesel generators were integrated to mitigate the fluctuations and enhance power supply reliability. The primary load of this system was the charging load for highway EVs. In contrast to the AC slow charging mode commonly used in urban areas, a DC fast charging mode was employed to reduce the charging time. Considering all factors, we adopted a hybrid microgrid structure with the DC bus at its core, incorporating both AC/DC power generation systems and DC power consumption systems to minimize intermediate losses in energy conversion processes as much as possible [16].

3.2. Construction of Source Load Storage Temporal Scenarios

3.2.1. Wind Power Generation Model

Wind power generation PW, t is affected by real-time wind speed v, which is approximately distributed according to a Weibull two-parameter distribution [17].
f ( v ) = ( v ε τ ) v τ 1 exp ( ( v ε ) τ )
P W , t ( v ) = { 0 v v in , v > v out P W rate * v v in v rate v in v in < v v rate P W rate v rate < v v out  
where τ is the shape parameter, ε is the scale parameter, PW, t is the rated wind power generation, vrate is the rated wind speed, vin is the cut-in wind speed, and vout is the cut-out wind speed. The parameters for wind speed distribution were obtained from the National Meteorological Science Data.

3.2.2. Solar Power Generation Model

Solar power generation is affected by light intensity and is characterized by uncertainty. To address the incomplete historical data on light intensity in remote road sections, a specialized model was developed to calculate the daily light intensity. By utilizing the latitude of the planned road section and typical daily solar position data, the 24-h light intensity profile for the road section was determined [18].
Initially, the relative position information between the sun and the Earth was calculated based on the latitude of the planned road.
{ δ = 23.45 sin [ 360 365 ( n 81 ) ] H = 15 h t tn β = arcsin ( cos L cos δ cos H + sin L sin δ )
where δ is the solar declination angle, n is the day of the year, H is the solar hour angle at a specific moment, ttn is the hour difference from the current time to noon, β is the solar altitude angle, and L is the latitude of the planned road section.
Subsequently, the light intensity was calculated based on the solar altitude angle β.
I B = 1370 [ 1 + 0.034 ( 360 n 365 ) ] exp ( k sin β )
where IB is the solar irradiance on the Earth’s surface and k is the optical depth.
Finally, the calculated light intensity for the planned road section was converted into solar power output using Equation (16).
P P V , t = P PVT max I B , t I BT [ 1 + k T ( T B , t T BT ) ]
where  P P V T max  is the maximum power output under standard photovoltaic conditions, IBT is the irradiance under standard conditions, TB, t is the ambient temperature, and TBT is the reference temperature. kT, representing the power temperature coefficient, indicates the percentage by which the output power of photovoltaic modules decreases as the temperature rises. The specific value is determined by the specifications provided by the photovoltaic component manufacturer and, in this case, it was set to −0.3%/°C.

3.2.3. Energy Storage Model

In wind–solar storage charging stations, the energy storage system is vital in mitigating fluctuations in wind–solar power generation and offsetting imbalances between power supply and demand. The state of charge (SOC) of the energy storage system is used to indicate its operational status [19].
{ Q t + 1 = Q t ( 1 ε ) + P C , t Δ t τ c E s Q t + 1 = Q t ( 1 ε ) P D , t Δ t τ d E s
where Qt is the state of charge of the energy storage at time t; ε is the self-discharge rate; PC, t and PD, t are the charging and discharging powers of the energy storage system, respectively; τc and τd are their charging and discharging efficiencies; and Es is the rated capacity of the energy storage.

3.2.4. Diesel Generator Model

The diesel generator system serves as a backup power source for wind–solar storage charging stations, stepping in to cover power shortages during extreme situations when the wind, solar, and energy storage systems are inadequate [20]. The output power of the diesel generator is determined by fuel consumption as outlined below:
F = F 0 Y gen + F 1 P gen
where F is the fuel consumption of the diesel generator; Ygen and Pgen are the rated power and output power of the diesel generator, respectively; and F0 and F1 are the fuel curve slope and intercept coefficients of the diesel generator.

3.3. Partitioning of Typical Wind–Solar Power Output Scenarios Using Enhanced K-Means Clustering

In order to ensure the reliable operation of the system under various conditions, this paper presents an enhanced approach to K-means clustering for generating wind and solar power output scenarios. This method refines the selection of cluster centers by utilizing the density clustering principle and incorporates a comprehensive evaluation function [21]. By taking into account the daily meteorological characteristics and specific conditions of low wind and light in the designated area, the method determines the optimal number of scenarios and their associated probabilities.
Initially, the Euclidean distance d and local density ρi between the wind–solar power generation scenarios were calculated, and the scenario with the highest density was chosen as the initial cluster center.
{ d ( x i , x j ) = [ k = 1 m ( x i k x j k ) 2 ] 1 2 ρ i = i j , 1 j n exp { [ d ( x i , x j ) d t ] 2 }
Subsequently, by iteratively selecting the data farthest from the existing initial cluster center based on the Euclidean distance, a series of k initial cluster scenarios was obtained. The wind–solar output dataset X was then partitioned into k clusters.
A mixed evaluation function was developed by considering both intra-cluster and inter-cluster differences comprehensively.
{ D in = i = 1 k j = 1 n ( x j m i ) 2 / n D out = min d ( m i , m j ) M ( k ) = D out D in D out + D in
where Din and Dout represent the intra-cluster and inter-cluster difference indicators, respectively; xj is the j-th wind–solar output scenario; mi is the i-th initial cluster center; n is the total number of wind–solar output scenarios; and M(k) is the mixed evaluation index, where k corresponds to the optimal number of clusters when M(k) approaches 1.

3.4. Wind–Solar Storage Charging Station Model

After clustering the wind–solar power output scenarios in the target region, to address the need for self-consistent operation of charging stations across multiple scenarios in off-grid settings, the optimization process includes the operating costs of diesel generators and the costs associated with curtailed wind and solar power as objective functions. The specific objective functions and constraints are outlined below:

3.4.1. Objective Function

Considering the economic feasibility and self-consistent operation feasibility of charging station construction, the weighted sum of economic indicators and self-consistent indicators was used to form a new equal annual comprehensive cost as the objective function.
min C total = ω 1 ( C 1 + C 2 + C 5 ) + ω 2 ( C 3 + C 4 )
where Ctotal is the total annualized cost, C1 is the annualized investment cost, and C2 is the annual operation and maintenance cost. C3 is the fuel consumption cost of diesel generators; C4 is the cost of curtailed wind and solar power; C5 is the cost of controlling harmful gas emissions from diesel generators; and ω1 and ω2 are the weighting coefficients for economic and self-consistency indicators, respectively, with their sum being 1. Given the emphasis of this study’s capacity configuration model on ensuring stable operation in off-grid settings, the weight assigned to self-consistency outweighs that of economic considerations, with ω1 and ω2 values set at 0.3 and 0.7, respectively.
The annualized investment cost of each distributed power source and charging equipment can be calculated using the following formula [22]:
C 1 = λ PV c PV E PV + λ WT c WT E WT + λ ES c ES E ES + λ G c G E G + C 0 + c s i = 1 n S t o t a l , i
λ DG = r DG ( 1 + r DG ) y DG ( 1 + r DG ) y DG 1
where λ is the annualized conversion coefficient for the full life cycle cost; c is the unit capacity configuration cost; E is the allocated capacity; C0 is the annualized investment cost of charging equipment; γ is the discount rate; y is the operational lifespan of the equipment; cs stands for the unit price of land; and Stotal,i represents the construction area of the charging station i, which can be calculated using Formula (31).
The operational and maintenance costs for each system in the station can be determined using the following formula:
C 2 = k PV E PV + k WT E WT + k ES E ES + k G E G + C 0
where k is the annual average operation and maintenance cost and  C 0  is the annual average operation and maintenance cost of the charging facilities.
In extreme circumstances, diesel generators are utilized to compensate for power shortages when the load demand of the wind–solar storage charging station exceeds the combined output of wind, solar, and storage [23]. As a result, the annual fuel cost of the diesel generators is considered a key self-consistent operational indicator for the microgrid.
C 3 = 365 s = 1 N s P s t = 1 T c fuel F
where cfuel is the diesel price, F indicates the fuel consumption for power generation, Ns is the total number of scenarios, and Ps is the probability of scenario occurrence.
Wind–solar storage charging stations are primarily designed to meet the EV charging demand. In situations where the production of wind and solar energy exceeds the demand, it can impact the microgrid’s stability [24]. Therefore, the cost associated with curtailed wind and solar power was utilized as an indicator for ensuring the self-consistent operation of the microgrid, with the specific formula provided below:
C 4 = 365 s = 1 N s P s t = 1 T c l o s s P l o s s , t
where closs is the penalty cost coefficient for curtailed wind and solar power, and Ploss,t is the curtailed wind and solar power at time t.
During operation, diesel generators release pollutants like nitrogen oxides, carbon monoxide, sulfur dioxide, and particulate matter into the ambient air. Hence, it is essential to incorporate pollution control costs into the analysis. The specific calculation formula is provided below:
{ E 1 = 10 , C t r e a t , 1 = 0.14 E 2 = 3 , C t r e a t , 2 = 0.056 E 3 = 0.3 , C t r e a t , 3 = 0.28 C 5 = 365 s = 1 N s P s t = 1 T ( P l o s s , t t i = 1 n E i * C t r e a t , i )
where Ei represents the emission of pollutant i, measured in g/kWh; E1, E2, and E3, respectively, represent nitrogen oxides, carbon monoxide, and particulate matter; and Ctreat,i denotes the unit control cost of pollutant i, measured in USD/g.

3.4.2. Constraints

To maintain the stable operation of the system, the output of distributed energy sources must be in balance with the charging load [25,26]. This power balance constraint can be expressed by the following formula:
P P V , t + P W T , t + P G , t = P E S , t + P E V , t
where P is the power at time t.
The output constraints for wind, photovoltaic, and generators are as follows:
{ 0 P P V , t P P V M , t 0 P W T , t P W T M , t 0 P G , t P G M
where PM, t is the maximum power at time t.
The energy storage charging and discharging constraints are as follows:
{ α c h , t + α d i s , t 1 , α c h , t { 0 , 1 } , α d i s , t { 0 , 1 } 0 P E S , t c h α c h , t P E S , c h max 0 P E S , t d i s α d i s , t P E S , d i s max Q 0 = Q s t a Q min Q t Q max
where αch, t and αdis, t are state variables indicating the charging and discharging status of the energy storage, where a value of 1 signifies the corresponding state;  P ES , ch max  and  P ES , dis max  are the maximum charging and discharging power of the energy storage; Qsta is the initial state of charge of the energy storage; and Qmin and Qmax are the minimum and maximum values of the state of charge of the energy storage, respectively.
The constraint on the capacity of distributed energy sources is outlined as follows:
{ E P V , j E P V , max , j E W T , j E W T , max , j E G , j 0.4 ( E P V , j + E W T , j )
where EDG,j is the actual installed capacity of each distributed energy source at site j; and EDG,max,j is the maximum allowable installation capacity at site j.
The land area allocated for establishing wind–solar storage charging stations at selected sites imposes a constraint on the total number of wind turbines, photovoltaic panels, energy storage systems, and diesel generators that can be installed.
{ S W T , i = ceil ( E W T , i E W T 0 ) S W T 0 S P V , i = ceil ( E P V , i E P V 0 ) S P V 0 S E S , i = ceil ( E E S , i E E S 0 ) S E S 0 S G , i = ceil ( E G , i E G 0 ) S G 0 S W T , i + S P V , i + S E S , i + S G , i S i
where SWT, i, SPV, i, SES, i, and SG, i denote the land area allocated for installing wind turbines, photovoltaic panels, energy storage systems, and diesel generators at charging station site i, respectively; EWT0, EPV0, EES0, and EG0 denote the capacity of a single wind turbine, photovoltaic panel, energy storage system, and diesel generator, respectively. The term “ceil” signifies rounding up to the nearest whole number; SWT0, SPV0, SES0, and SG0 indicate the land area taken up by a single wind turbine, photovoltaic panel, energy storage system, and diesel generator, respectively; and Si denotes the maximum permissible construction area for charging station site i.

4. Arithmetic Simulation

The study validated the proposed wind–solar storage charging station siting and sizing model on the 500 km route from Yumen, Gansu, to Hami, Xinjiang, encompassing the 312 National Road, 215 National Road, and G30 Expressway.

4.1. Basic Parameters

Table 1 shows the probability density functions (PDFs) of the maximum battery capacities for different types of electric vehicles.
The simulation parameters for EVs, including driving speed, charging power, energy conversion efficiency, charging demand, and state of charge upon completing charging, are presented in Table 2.
Using the NSGA-II algorithm for optimization, the settings include 1000 iterations, a population size of 50, a crossover probability of 0.7, and a mutation probability of 0.4 [27].
Table 3 details the parameters for wind power (WT), photovoltaics (PVs), diesel generator (G), and energy storage (ES) [28].
The wind turbine was from the Vestas V27 series (Vestas, Aarhus, Denmark), with a capacity of 225 kW and occupying an area of 400 m2. The photovoltaic panel was from the SunPower SPR-X22 series (SunPower, San Jose, CA, USA), with a capacity of 360 W and dimensions of 1.046 m × 1.616 m. Considering a 0.5 m row spacing between panels and a noon solar altitude angle of 26°, the adjusted photovoltaic unit area power density was 130W/m2. The energy storage system used the LG Chem RESU10H (LG Corp., Seoul, Republic of Korea), with a capacity of 9.8 kWh and occupying 0.3 m2. The diesel generator was from the Cummins C55D5 series (Cummins, Columbus, IN, USA), with a capacity of 55 kW and occupying 4 m2. The charging station included a 20% buffer area about the total footprint of the wind–solar storage charging equipment.

4.2. Site Planning Results

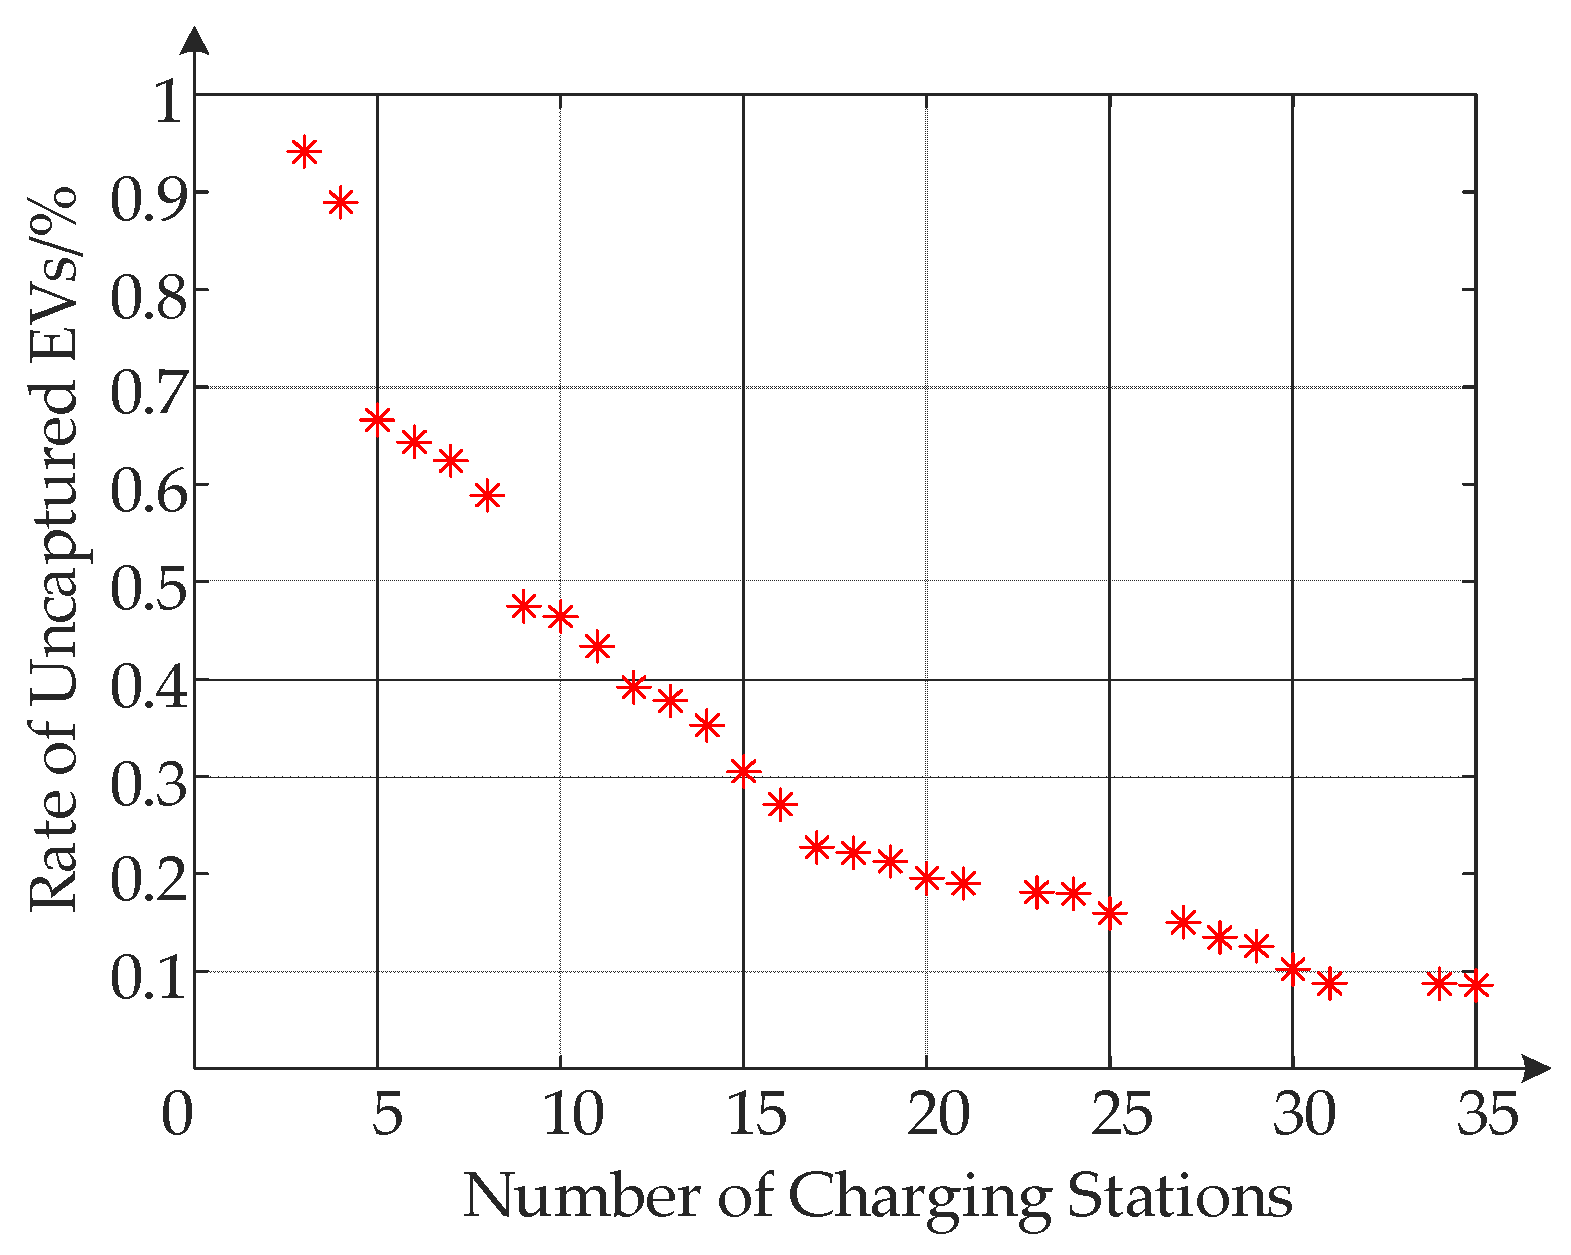
A total of 48 predetermined points for charging stations were established, each covering a service range equivalent to the distance typically traveled by an L-type electric vehicle with a 5 kWh battery capacity under normal conditions. The site selection model defined the ratio of captured vehicles to the total number of vehicles as the vehicle capture rate. By utilizing the NSGA-II algorithm, the Pareto frontier between different numbers of charging stations and the rate of uncaptured vehicles was obtained, as depicted in Figure 4.
Figure 4 illustrates that, with an increase in the number of charging stations, the rate of uncaptured vehicles decreases gradually, leading to a higher number of vehicles successfully charged and passing through without issues. However, the overall cost of establishing these stations also rises, which contradicts the economic goal. The relationship between the vehicle capture rate and the construction cost of stations presents a dilemma. Hence, the introduction of site selection indicators helps assess the merits and drawbacks of site selection outcomes for varying numbers of charging stations. The relationship between the site selection index and the number of charging stations is depicted in Figure 5.
According to Figure 5, the site selection index demonstrates an initial decrease followed by an increase as the number of charging stations increases. This fluctuation is a result of the initial scarcity of charging stations leading to a high rate of uncaptured vehicles, thereby elevating the index. As more stations are added, the uncaptured rate decreases, but the ratio of constructed stations to predetermined points rises, causing the index to increase. Therefore, the installation of 17 charging stations along the designated route effectively strikes a balance between station numbers and vehicle passage rates, effectively meeting the cross-city travel requirements of the majority of vehicles.
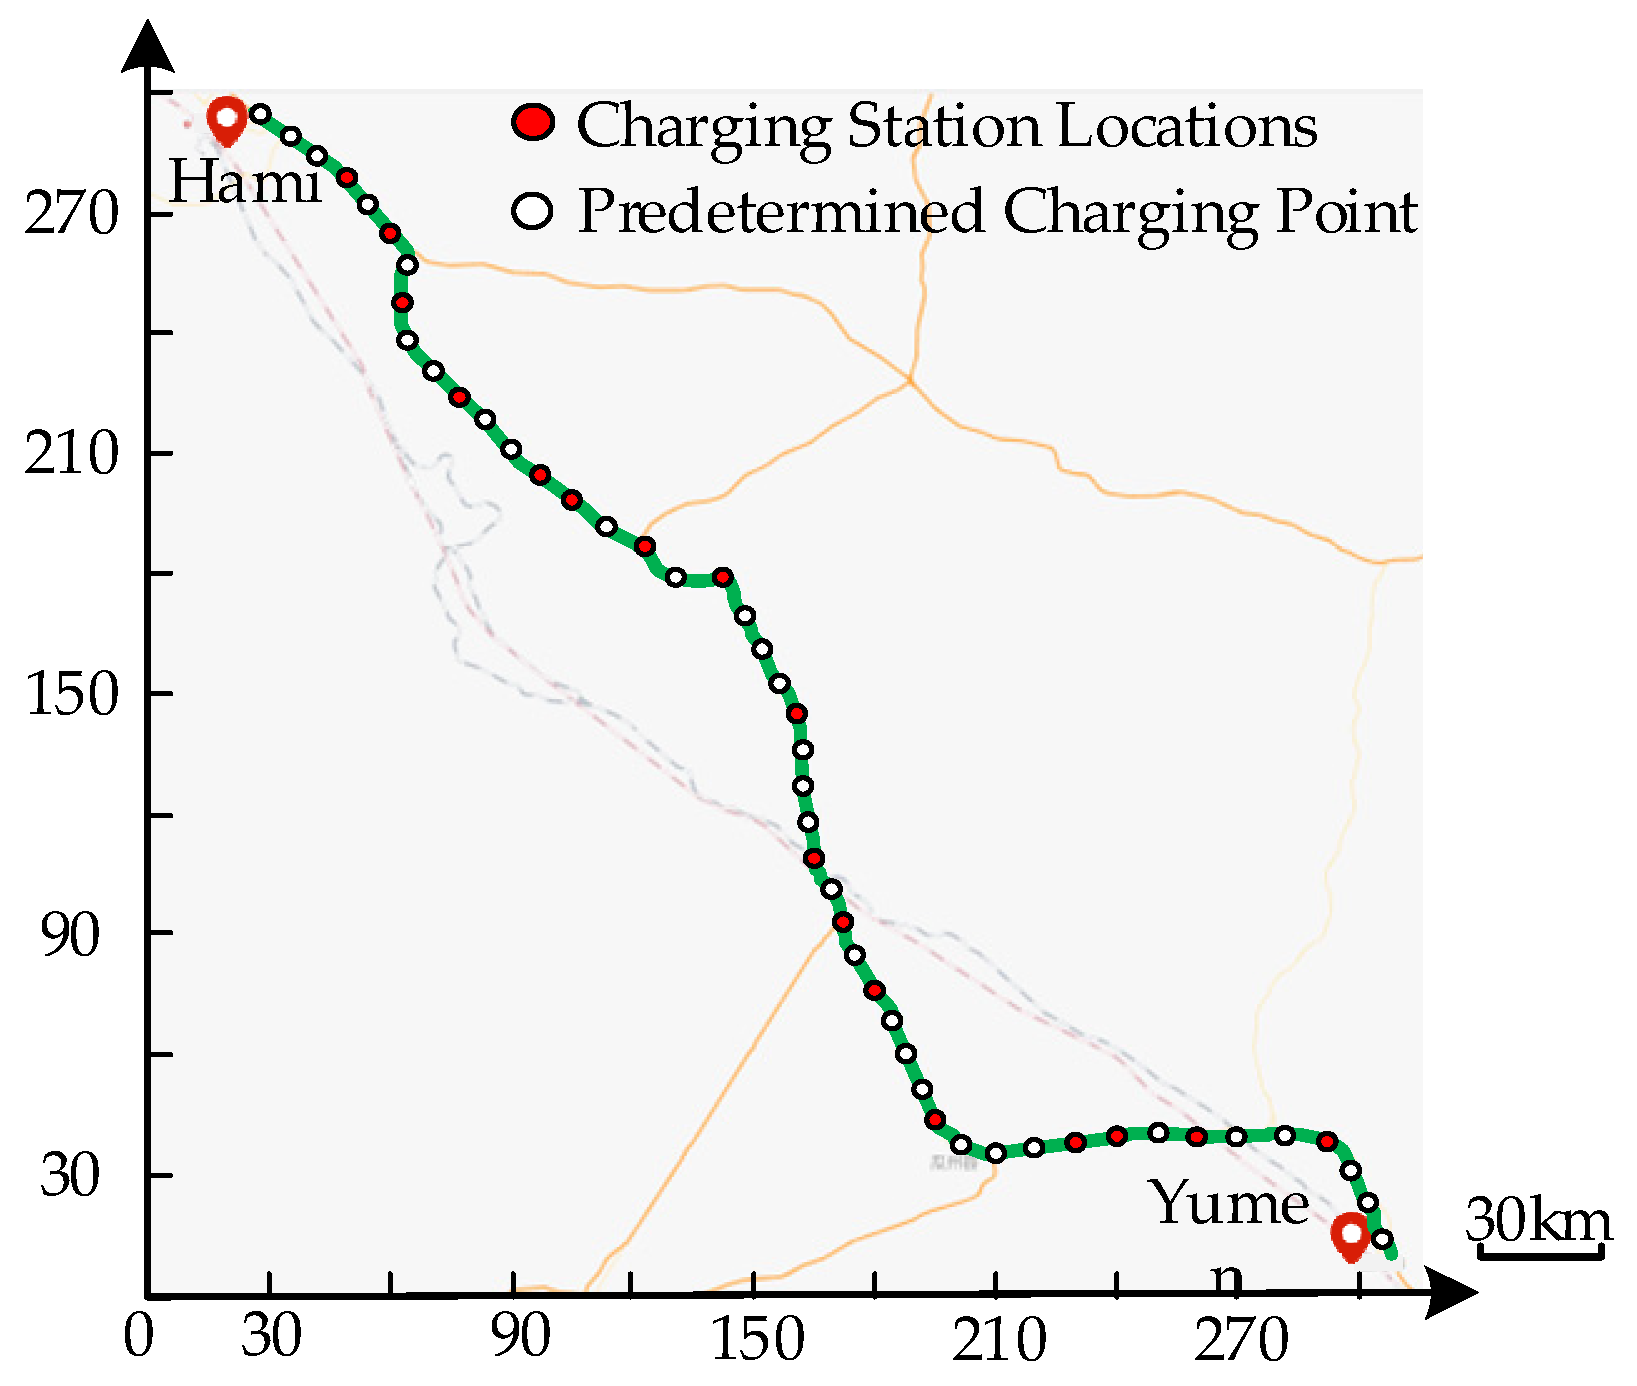
Table 4 and Figure 6 detail the charging stations’ specific locations and daily load requirements starting from Yumen.
Using the distance data from Table 4, the corresponding charging station sites were identified in the ArcGIS 10.8 software, and by adjusting the map scale, the appropriate coordinate system was established to generate the charging station site selection map.

4.3. Capacity Planning Results

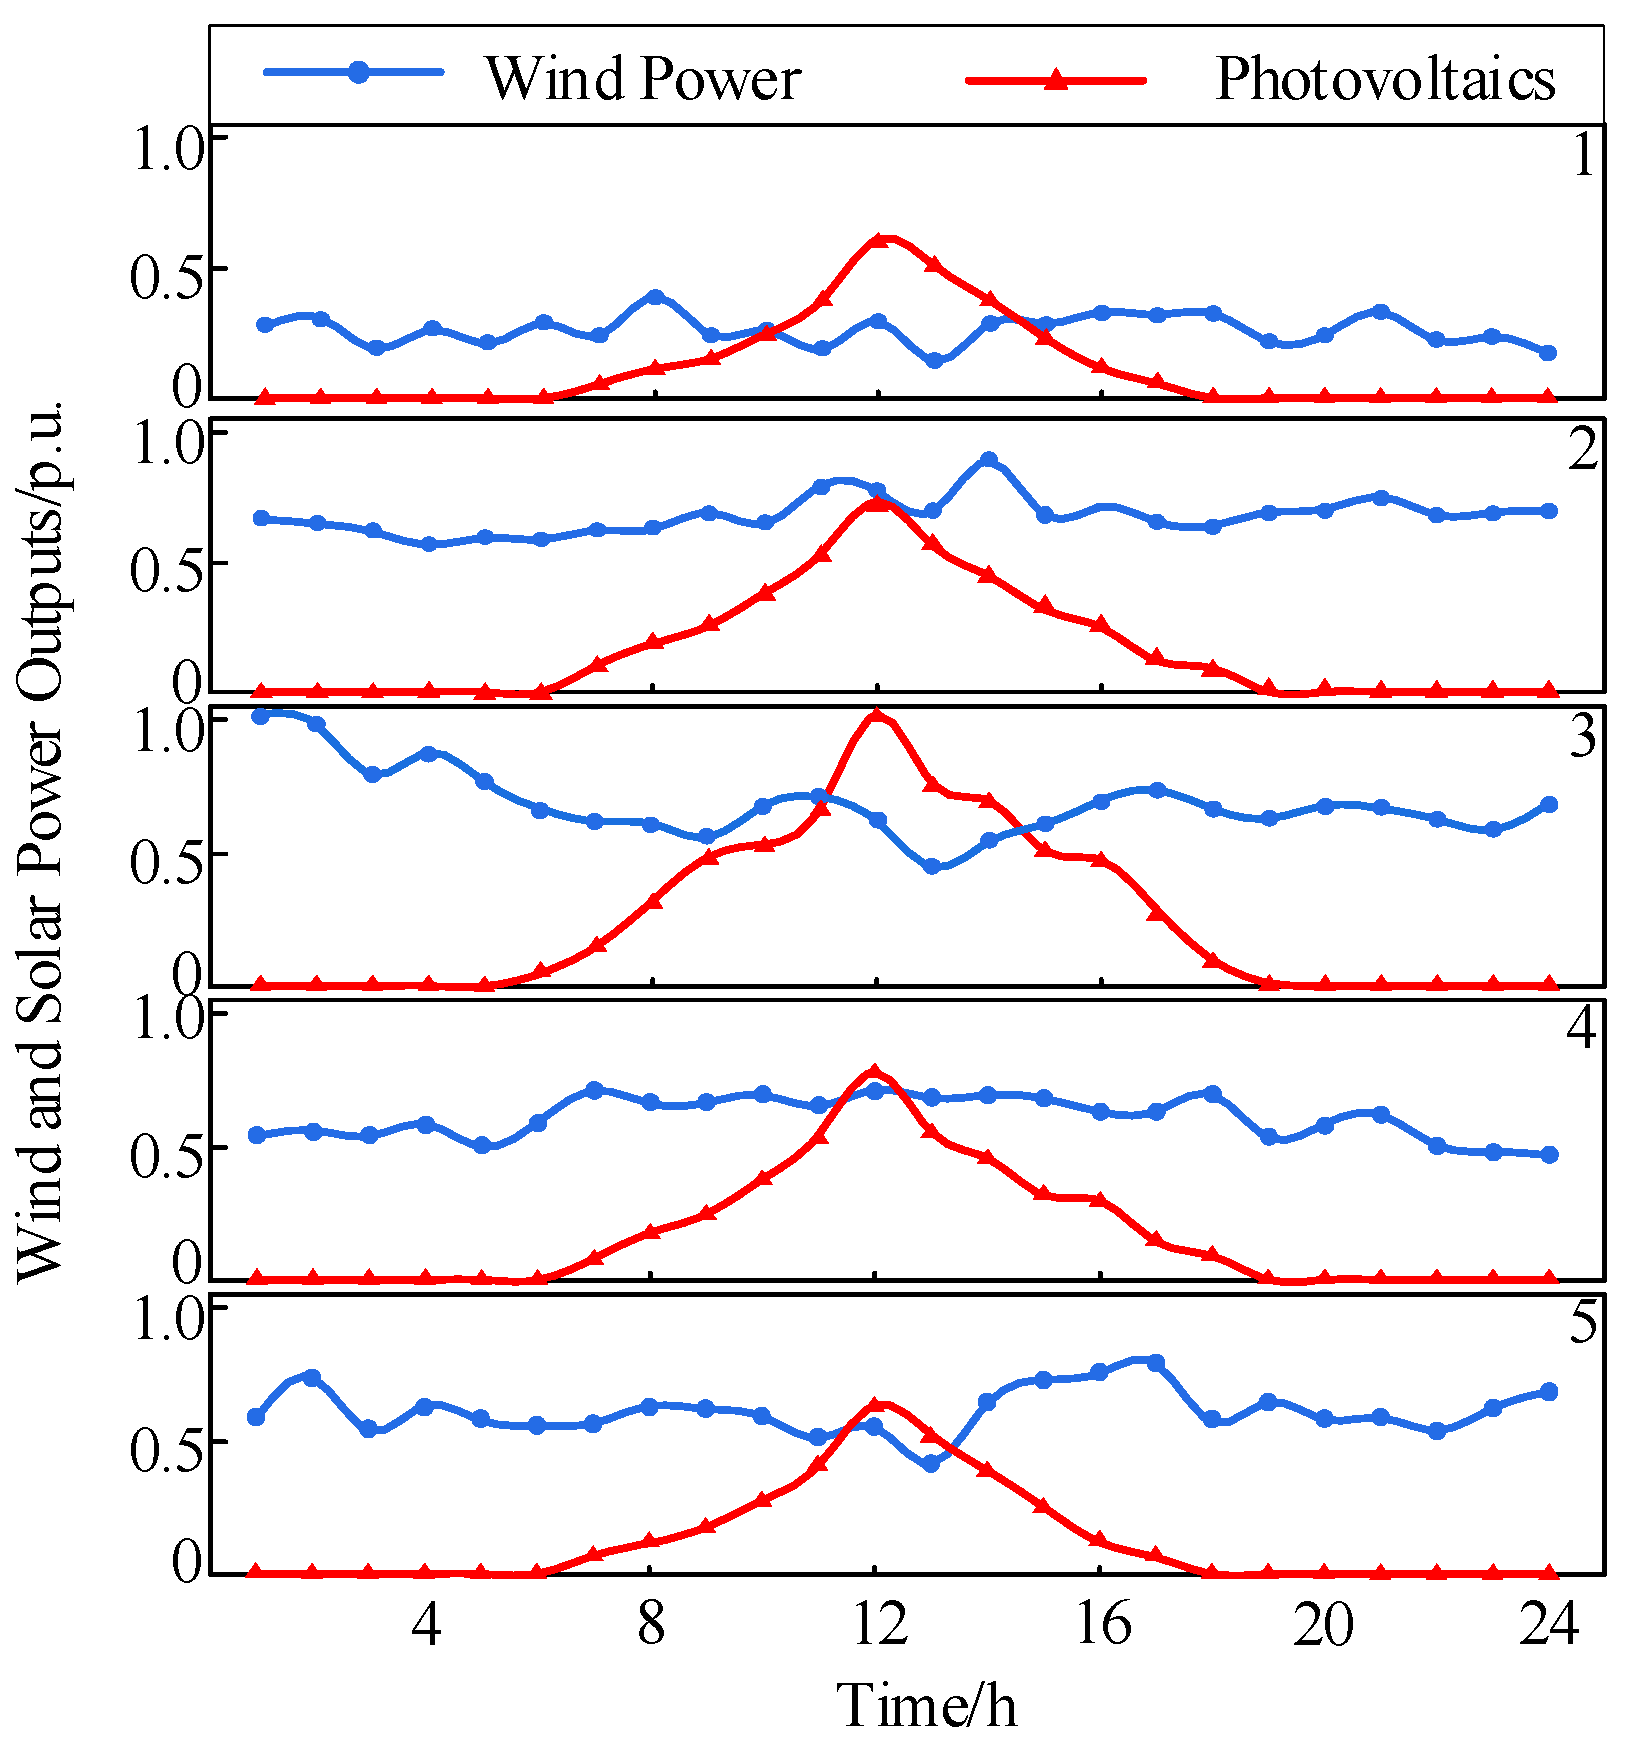
The annual wind speed and solar irradiance data for the planned route used refined K-means clustering to establish five wind–solar temporal operation scenarios for simulation. The probabilities of occurrence for each scenario are provided in Table 5, and the wind–solar power outputs for each scenario are illustrated in Figure 7.
As shown in Figure 7, scenarios 3 and 5 demonstrate notable variations in wind power output, indicating the need for larger energy storage capacities. Scenario 1 exhibits the lowest wind and solar power output among all scenarios, with the least likelihood of occurrence as detailed in Table 5. Notably, scenario 3 showcases the highest photovoltaic power output, implying a relatively efficient photovoltaic generation within this scenario.
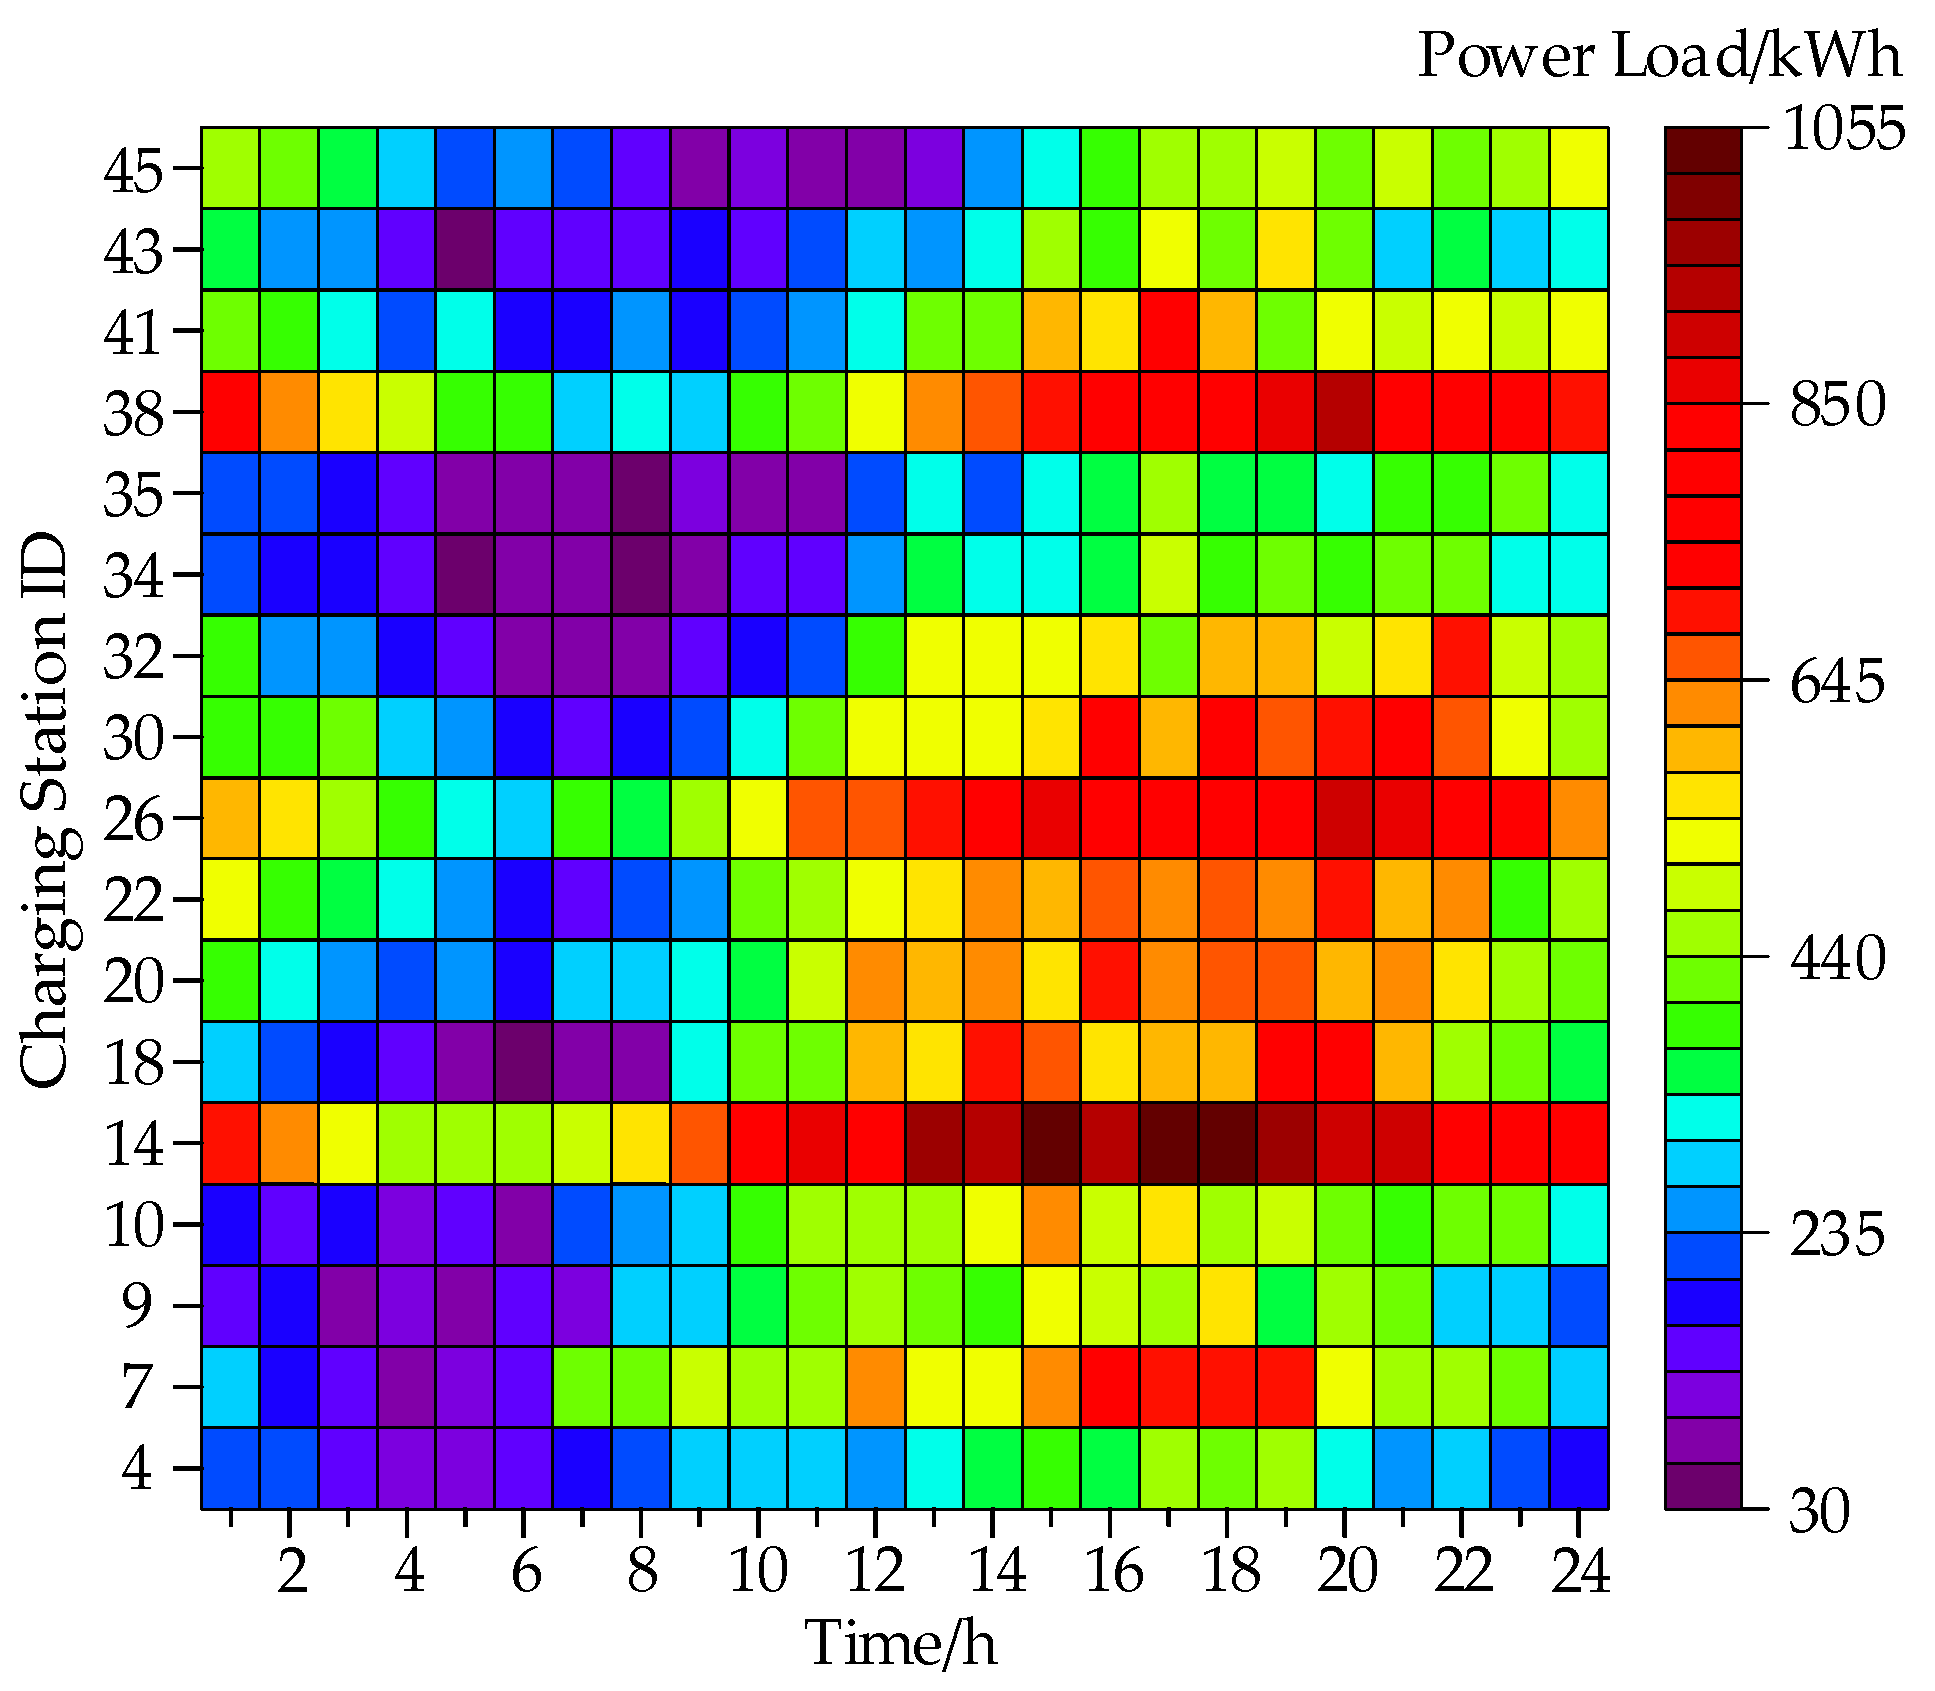
Through the utilization of the Monte Carlo method, simulations were carried out to predict the battery capacities and travel durations of different electric vehicle models. These outcomes, combined with the FRLM site selection results, determine the charging stations and stop durations for mid-journey stops of each vehicle, ultimately defining the daily load for each charging station, as shown in Figure 8.
The transition of load intensity from low to high is visually depicted through a color spectrum shift from cool to warm tones. Due to travel patterns, the peak loads at charging stations are notably concentrated around midday and in the afternoon, with lighter loads typically seen in the morning.
Different locations exhibit distinct daily load characteristics, with Charging Stations 4, 9, 43, and 45 near entrances showing lower overall daily loads due to high-capacity EVs traveling longer distances before needing charging. Conversely, Charging Stations 14, 20, 22, 26, 30, 38, and 41, located farther away from entrances, experience higher daily loads because of the presence of high-capacity EVs.
Considering each station’s daily load and the unit capacity of wind and solar power under different scenarios, integrated wind–solar storage charging stations were designed to meet requirements. Table 6 outlines the capacities, comprehensive costs, and configurations of wind power, photovoltaics, energy storage, and diesel generators.
Upon examining the capacity allocations in the table above, it is apparent that the energy storage capacity designated for each charging station significantly exceeds that of wind power, photovoltaics, and diesel generators. This disparity is mainly attributed to the crucial role of energy storage in managing power supply and demand fluctuations during isolated grid scenarios, while also acting as a power reservoir for the charging stations. Wind power capacities at each station surpass photovoltaic capacities because wind power provides more stability compared to photovoltaics. For a detailed depiction of the output from each system on a typical day at one of the charging stations, refer to the following figure.
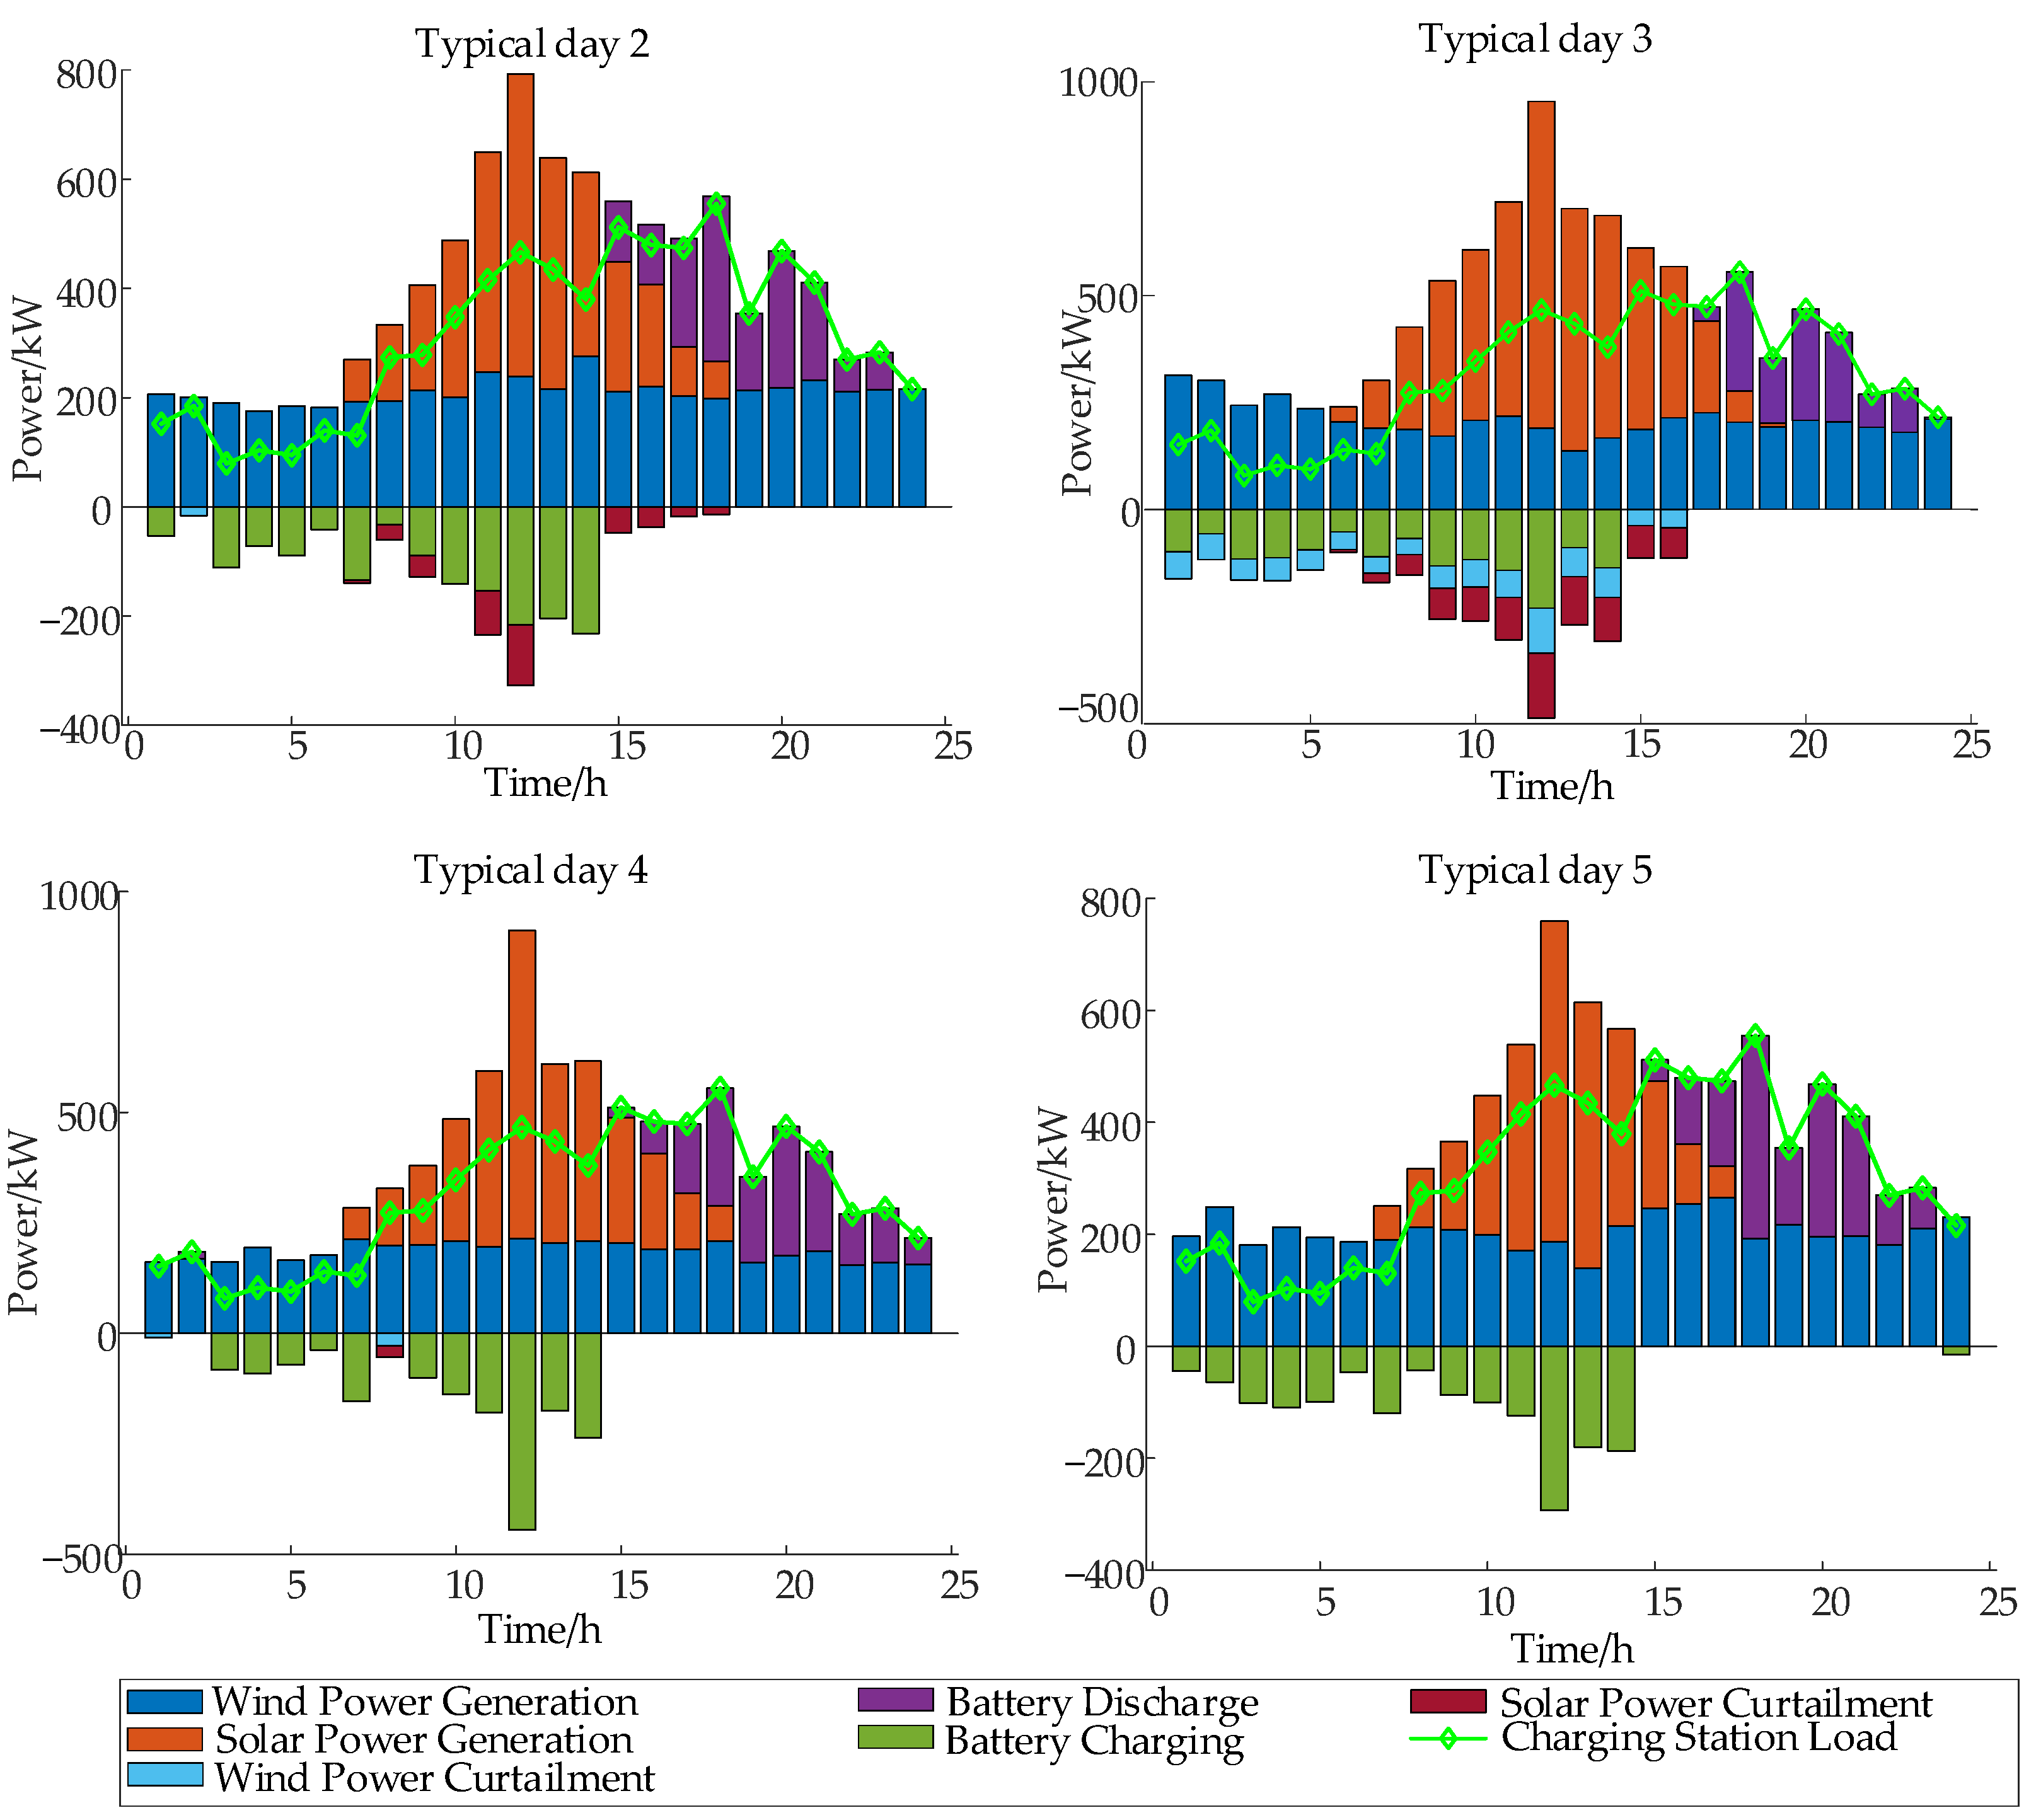
Figure 9 illustrates the output of various components of Charging Station 9 on four different typical days. It can be observed that a power balance can be achieved without relying on diesel generators across these four typical days. In Typical Day 3, there is sufficient wind and solar power generation, resulting in a significant curtailment of excess wind and solar power. However, the energy storage output is relatively low in this scenario, indicating a lower dependency on energy storage. In Typical Day 5, there is no curtailment of wind and solar power, indicating a fully self-sustained operation on this day.
Across the four typical days, during the low load period from 0 to 5 h, wind power not only meets the charging station’s load requirements but also provides surplus electricity for charging the energy storage system. From 6 to 18 h, when the charging station’s load demand increases, wind and solar power work together to meet the load requirements. Due to the large capacity allocation of wind and solar power, curtailment of excess wind and solar power also increases during this period. From 19 to 24 h, as the charging station’s load demand decreases, wind power and energy storage work together to meet the load requirements.
Table 7 displays the self-sufficiency rates of each charging station on various typical days. On Typical Day 1, where there is weak wind and solar conditions, wind and solar power are insufficient to meet the system’s operational needs, requiring additional power from the diesel generator. Consequently, the system’s self-sufficiency rate is lower on this day. In contrast, Typical Days 2, 3, 4, and 5 experience more wind and solar power, leading to relatively higher self-sufficiency rates.
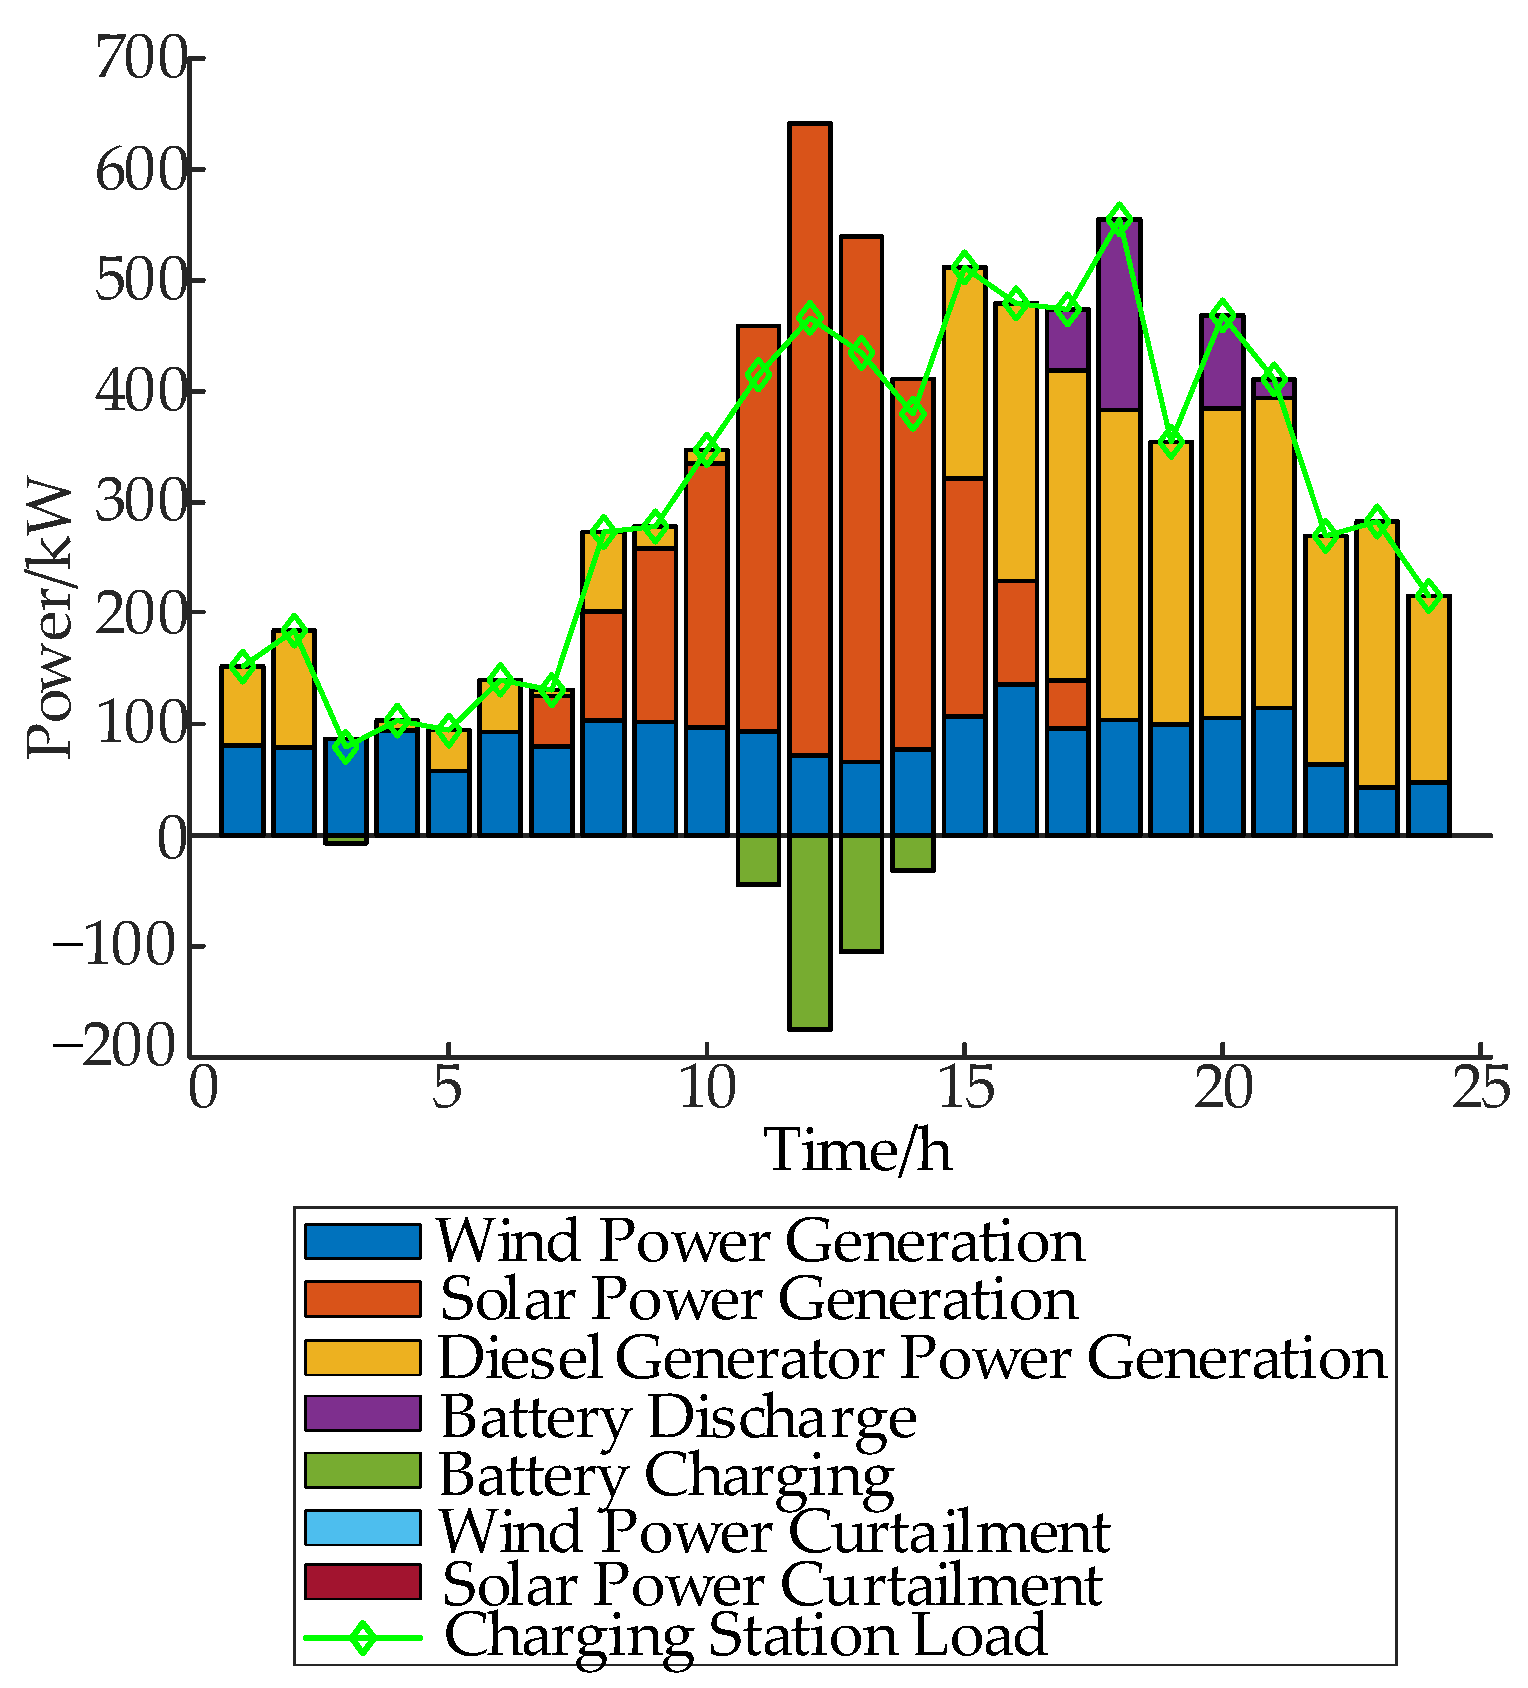
Figure 10 illustrates the daily power scheduling for Charging Station 7 under Typical Day scenario 1. It is noticeable that, on this particular day, the diesel generator operates at a higher output. This becomes essential during periods of low sunlight and wind when the combined wind and solar power generation is insufficient to meet the load demand, necessitating the diesel generator to bridge the power gap for smooth system operation. To reduce reliance on diesel generators during low wind and sunlight conditions, higher capacities are assigned to wind, solar, and energy storage. Consequently, under the same capacity allocation, scenarios 2, 3, 4, and 5 experience increased curtailment of wind and solar power.

4.4. Comparative Analysis of Various Configuration Plans

To validate the effectiveness and reasonableness of the proposed charging station model, various configuration schemes were established for comparative analysis:
Scheme 1: The capacity allocation proposed in this study.
Scheme 2: Allocating only wind, photovoltaic, and energy storage capacities.
Scheme 3: Allocating wind power, energy storage, and diesel generator capacities only.
Scheme 4: Allocating photovoltaic, energy storage, and diesel generator capacities only.
To further assess the advantages of the proposed solutions, the criteria of power shortage rate and self-consistency were introduced for evaluating the effectiveness of the solutions. The power shortage rate was determined by the ratio of diesel generator output (or load shortage) to the total load demand. Self-consistency was calculated as the ratio of the remaining energy after subtracting curtailed wind–solar energy and diesel generation from the total system load demand to the total system load demand.
As shown in Table 8, Scheme 2 focuses on integrating wind power, photovoltaics, and energy storage for charging stations. Compared to Scheme 1, Scheme 2 reduces annualized comprehensive costs by 16% and decreases discarded wind and solar energy by 31.5%. However, Scheme 2 is only suitable for stable operation in Scenarios 2, 3, 4, and 5. In Scenario 1, with low wind and light conditions, the lack of diesel generators to supplement power deficits leads to instability, resulting in higher power shortage rates and lower self-sufficiency rates than other configurations, making it unsuitable for energy demands in remote areas.
Scheme 3, conversely, incorporates wind power, energy storage, and diesel generators for charging stations. It exhibits a 6.8% increase in annualized comprehensive costs and a 39.4% rise in discarded wind compared to Scheme 1. This is attributed to the lack of photovoltaic power to support peak loads, necessitating a 25.3% higher wind power capacity than Scheme 1, ultimately contributing to increased wind energy wastage.
Scheme 4 integrates photovoltaic power, energy storage, and diesel generators for charging stations. It demonstrates a 7.3% increase in annualized comprehensive costs compared to Scheme 1. Due to the absence of a consistent power source, there is a heightened reliance on diesel generators, resulting in a 2.5-fold increase in diesel power output compared to Scheme 1, thereby posing significant environmental implications.
To further ensure the model’s effectiveness, we incorporated the circular road network model of Hainan Island for a more comprehensive validation [3].
The circular road in Hainan spans a total length of 612 km, with an average daily electric vehicle trip count of 17,297. The vehicle types align with those discussed in this paper. Given the absence of discussion on the capacity configuration of wind power, photovoltaics, energy storage, and diesel generators in the paper, the focus was primarily on comparing the outcomes of the charging station siting for both scenarios. The specific results are outlined in Table 9.
As illustrated in the table above, A denotes the site selection and capacity determination approach proposed in this paper, while B represents the approach suggested in the comparative literature. In the case study, the proposed method in this paper involves a higher number of selected charging stations, leading to a superior car capture rate compared to the B approach, indicating the superiority of the site selection strategy. However, due to the additional cost of wind–solar–diesel storage in this paper compared to B, the overall cost is significantly higher than that of B.

4.5. Comparative Analysis of Configuration Schemes Based on Different Site Selection Results

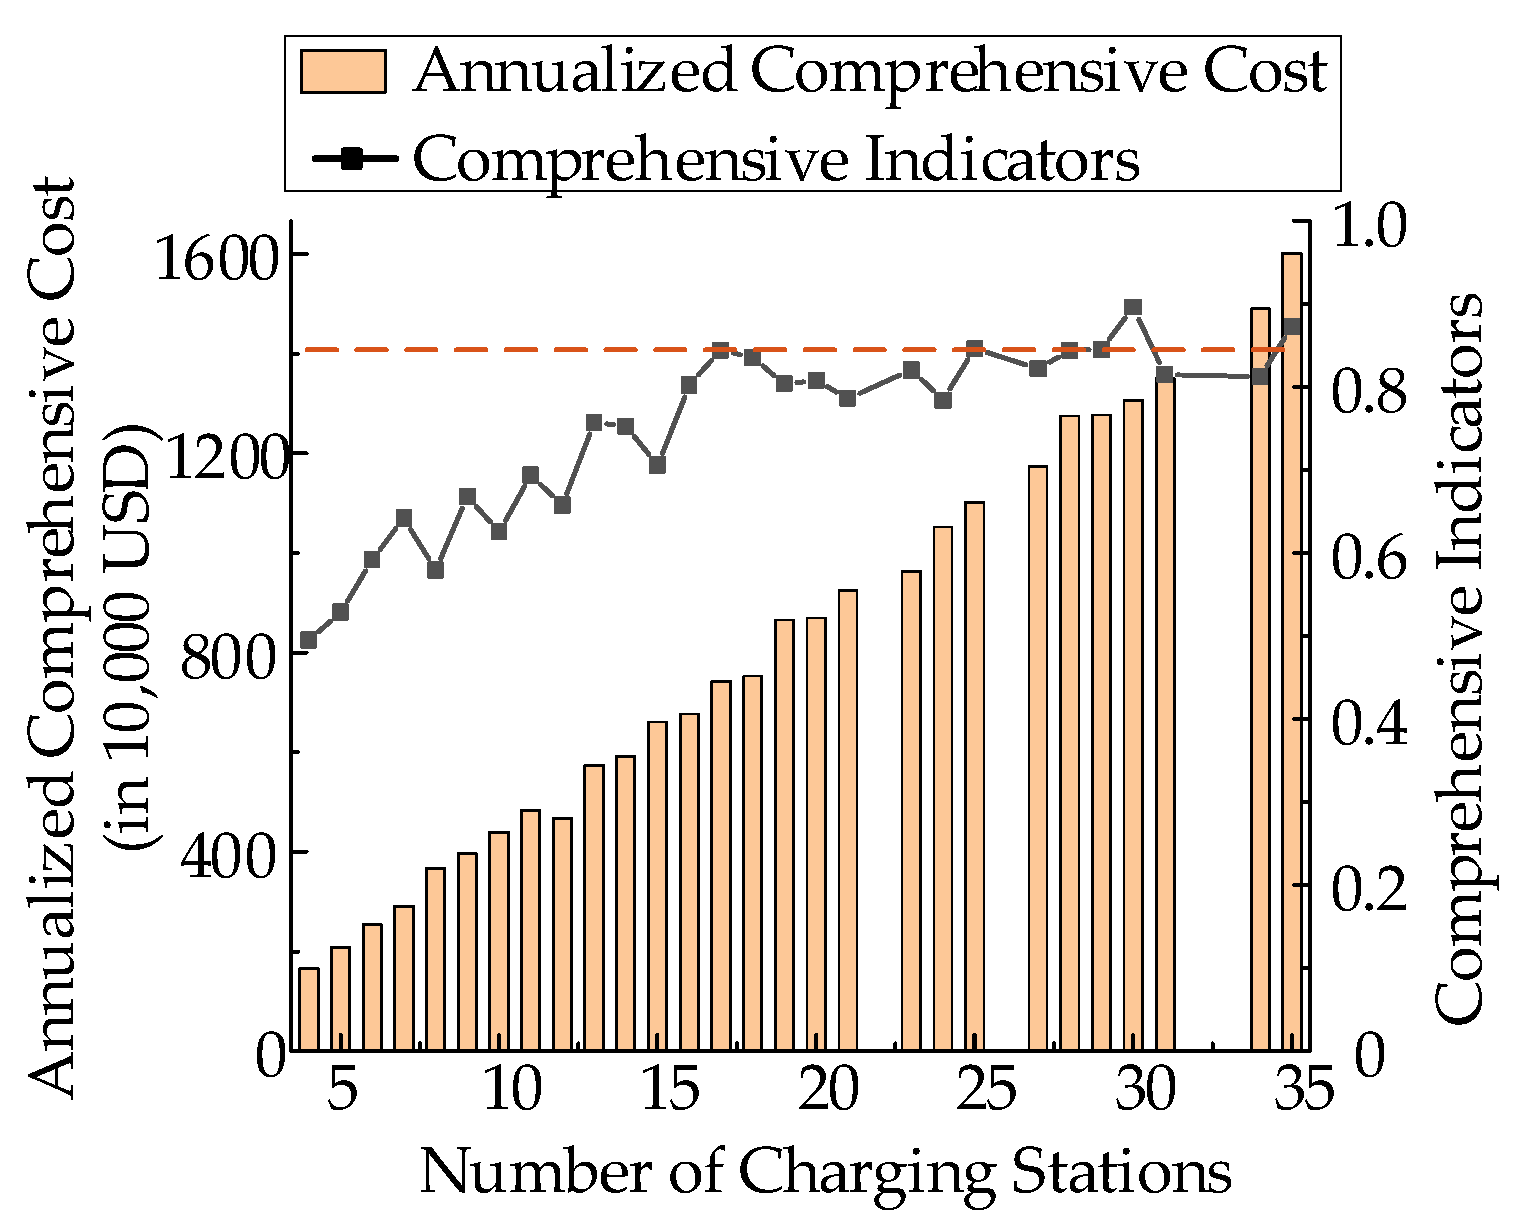
To further elucidate the impact of different site selection schemes on capacity configuration in off-grid scenarios, we conducted wind, solar, diesel, and storage capacity configurations for each site selection scheme. Due to variations in vehicle capture rates resulting from different site selection outcomes, the previously used capture rates and self-sufficiency rates for site selection were normalized to create a new comprehensive evaluation metric. This metric represents the advantages and disadvantages of the location and capacity determination results of charging stations. The results of capacity configurations under different site selections were evaluated and analyzed based on the annualized comprehensive cost and comprehensive indicators. The evaluation of capacity configurations under different site selections is presented in Figure 11.
Figure 11 indicates that, as the number of charging stations increases, the annualized comprehensive cost also rises gradually. The comprehensive evaluation metric related to the system self-sufficiency rate and electric vehicle capture rate fluctuates and shows an upward trend, eventually stabilizing between 0.8 and 0.9. This trend is attributed to the initial increase in the number of charging stations, leading to a significant rise in the vehicle capture rate, thereby boosting the comprehensive metric. Subsequently, as more charging stations are added, but with a slower growth in the vehicle capture rate, the self-sufficiency rate linked to charging station configuration significantly impacts the comprehensive metric. At this stage, the increase in the number of charging stations results in higher overall costs, with marginal improvements in the system’s self-sufficiency rate. Thus, the capacity configuration of wind–solar storage charging stations is notably influenced by site selection outcomes, particularly when the number of charging stations is below the optimal level.

4.6. Comparative Analysis of Site Selection and Capacity Planning Strategies for Different Numbers of Vehicles

To validate the proposed site selection and sizing model for future scalability with an increasing number of EVs, the trend of annual EV ownership growth was determined by referencing the relevant literature. This trend was then integrated into the site selection and sizing planning results to assess the model’s capture rate, self-consistency, and power shortage rate, as illustrated in the figure below.
Figure 12 illustrates that, as the number of vehicles increases, the capture rate and self-consistency gradually rise, but they start to decline once the number of vehicles reaches 2500. Meanwhile, the power shortage rate initially increases slowly and then sharply rises after the number of vehicles exceeds 2500. This indicates that the site selection and sizing model designed for 2000 vehicles can handle a daily traffic volume between 2000 and 2500. Within this range, the system’s wind and solar curtailment rate decreases further with the increase in the number of vehicles, enhancing the system’s self-consistency. However, beyond 2500 vehicles, due to system limitations, the power deficit is compensated for by diesel generators, leading to a significant decrease in self-consistency. Some vehicles are impacted by the power shortage rate, resulting in unstable charging, and a notable decrease in the model’s vehicle capture rate occurs.
The current capacity allocation scheme can maintain a system self-consistency of ≥85% when vehicle growth is ≤20%. This demonstrates that the site selection and capacity determination strategy proposed in this paper were designed with forward-looking flexibility to accommodate future vehicle scale expansions.

4.7. Sensitivity Analysis

4.7.1. The Influence of Varying Proportions of Vehicle Types on the Experimental Outcomes

To assess the influence of varying vehicle proportions on the experimental outcomes, each electric vehicle proportion was individually raised to 100% to evaluate the model’s vehicle capture rate and self-sufficiency rate. The results are shown in Table 10.
According to the table above, the model demonstrates good performance across different types of electric vehicles. Specifically, when all vehicles are of the L-type, the vehicle capture rate is lower due to the smaller battery capacity of L-type vehicles, resulting in shorter driving ranges and a higher demand for charging stations, leading to significantly higher comprehensive costs compared to other scenarios. In the case of all vehicles being of the M-type, the system’s self-sufficiency rate is higher because of the moderate battery capacity and allowing for a balanced distribution of charging loads among the stations, aligning the load demand with wind and solar power generation. For the case of all vehicles being of the N2-type, the vehicle capture rate is higher due to the larger battery capacity and longer driving range, which relaxes the requirements for charging station locations.

4.7.2. Impact of Diesel Generator Pollution Control Costs on Capacity Allocation Results

Based on Formula 27, the pollution control cost of diesel generators was estimated at around 1.7 USD/kWh. Consequently, a sensitivity analysis was performed to assess the influence of pollution control cost changes on the capacity allocation outcomes. The analysis varied the cost of nitrogen oxide control from 1 to 3 USD/kWh in increments of 0.4. The findings are presented in Table 11.
From the table, it is evident that, as pollution control costs increase, the capacities of energy storage, wind power, and photovoltaics all increase, while the capacity of diesel generators decreases. The comprehensive system cost rises, but the self-sufficiency rate of the system initially increases and then decreases. This is because, with the rise in pollution control costs, more wind, solar, and storage capacities need to be allocated. Initially, as the capacity of diesel generators decreases and their output diminishes, the self-sufficiency rate of the system increases. However, later on, due to limitations in the area of the charging station, when the capacity of the diesel generators decreases to a certain extent, the system’s electricity generation falls below the demand, leading to a decrease in the self-sufficiency rate. This analysis demonstrates that the model has adaptability to environmental policies and awareness of resource constraints, surpassing traditional static optimization models and providing valuable insights for the planning of charging stations in off-grid areas.

4.7.3. Influence of Factor Weights on Capacity Configuration Outcomes

Equation (21) indicates that the capacity configuration results tend to favor either economic efficiency or self-consistency, depending on the weight factors ω1 and ω2, where their sum is 1. To better understand the impact of these weight factors on the experimental outcomes, we introduced a step size of 0.1 to adjust the weight factors and analyze how the experimental results change. According to Figure 13, as ω1 increases, the system’s comprehensive cost gradually decreases, indicating a stronger focus on economic efficiency in the capacity configuration. Consequently, the higher proportion of diesel generators at this point leads to a decrease in the system’s self-consistency rate.

4.8. Contrasting Model Solution Strategies

We compared the Polar Fox Optimization Algorithm with the NSGA-II algorithm employed in this study for site selection planning [29]. The solution results and solution times are provided in Table 12.
The table indicates that the Polar Fox Optimization Algorithm is more efficient in solving problems compared to the NSGA-II algorithm, although the NSGA-II algorithm achieves a slightly higher car capture rate.

4.9. Charging Tariffs and Positive Revenue of Charging Stations

We utilized the lifespan of the energy storage system within the system as the lifecycle of the charging station. By considering information such as the daily load of the charging station and the equivalent annual cost, we established dynamic payback periods under different charging prices. The results are presented in Table 13.
Table 13 illustrates that a higher charging price leads to a faster payback period. For instance, using the peak electricity price of USD 0.25 in Beijing, the charging station can achieve full cost recovery in 6.5 years.

5. Conclusions

The paper commences by analyzing the electric vehicle battery capacity and traffic flow characteristics at different times to determine the maximum battery capacity and travel time for each vehicle using probability density functions and travel time distributions. Recognizing the insufficiency of a single charging station in vast western urban areas for cross-city electric vehicle travel, a model for flow capture sites was developed to ensure full charging for EVs with varying battery capacities. By utilizing the NSGA-II algorithm, the Pareto boundary relationship between the number of charging stations and vehicle capture rate was established, providing crucial insights for EV charging infrastructure planning.
To address incomplete historical data on solar irradiance intensity along certain road segments, a model was devised to calculate full-day solar irradiance for remote segments based on dimensional information. This innovative approach fills data gaps and incorporates an enhanced K-means clustering algorithm to consider rare severe weather events, determining optimal numbers and types of scenarios for target road segments. This contributes to improved economic and operational consistency in capacity allocation. Furthermore, considering wind and solar resources alongside daily load demands, a wind–solar storage off-grid microgrid model was proposed to optimize capacity configurations for electric vehicle charging on typical days.
By selecting the Yumen to Hami section as an example to verify the effectiveness of the proposed capacity configuration scheme, evaluations were conducted on the system’s self-consistency rate, annual load shortage, and annual wind and wind power curtailment. A comparative analysis of the advantages and disadvantages of capacity configuration results under different schemes was performed, verifying system stability from the perspective of increasing the number of electric vehicles. The proposed scheme demonstrated the advantage of minimum equivalent annual comprehensive cost and high system self-consistency rate, offering decision support for off-grid charging station construction.
Future considerations involve the cluster control of nearby charging stations, leveraging microgrid power mutual assistance to develop operational strategies tailored for off-grid highway fast charging station clusters. This strategic approach aims to lower diesel generator operating costs and enhance the integrated fast charging station operations’ self-consistency.

Author Contributions

Conceptualization, W.Z.; Investigation, G.Z.; Writing—original draft, G.Z.; Writing—review and editing, W.W. All authors have read and agreed to the published version of the manuscript.

Funding

This research was funded by Research on Flexible Operation Strategy of Wind Solar Energy Storage Combined Power Generation System with Large scale New Energy, grant number 52067020. This research was funded by Research on Key Technologies for Grid Connection Control of New Energy Stations with Energy Storage Configuration, grant number 52267005.

Data Availability Statement

The original contributions presented in the study are included in the article; further inquiries can be directed to the corresponding author.

Conflicts of Interest

The authors declare no conflict of interest.

References

  1. Lu, Q.; Duan, H.; Shi, H.; Peng, B.; Liu, Y.; Wu, T.; Du, H.; Wang, S. Decarbonization Scenarios and Carbon Reduction Potential for China’s Road Transportation by 2060. NPJ Urban Sustain. 2022, 2, 1–9. [Google Scholar] [CrossRef]
  2. Relevant Responsible Comrades of the National Development and Reform Commission and the National Energy Administration Answered Reporters’ Questions on the “14th Five-Year Plan for Renewable energy Development”. Available online: https://www.nea.gov.cn/2022-06/01/c_1310611147.htm (accessed on 1 June 2024).
  3. Dong, X.; Mu, Y.; Jia, H.; Wu, J.; Yu, X. Planning of Fast EV Charging Stations on a Round Freeway. IEEE Trans. Sustain. Energy 2016, 7, 1452–1461. [Google Scholar] [CrossRef]
  4. Jia, L.; Hu, Z.; Song, Y.; Zhan, K.; Ding, H. Planning of Electric Vehicle Charging Stations in Highway Network. Autom. Electr. Power Syst. 2015, 39, 82–89, 102. [Google Scholar]
  5. Zhao, F.; Li, J.; Gao, F. Siting and sizing of photovoltaic-storage charging stations on highway considering uncertainties. Electr. Power Autom. Equip. 2021, 41, 111–117. [Google Scholar]
  6. de Quevedo, P.M.; Muñoz-Delgado, G.; Contreras, J. Impact of Electric Vehicles on the Expansion Planning of Distribution Systems Considering Renewable Energy, Storage, and Charging Stations. IEEE Trans. Smart Grid 2019, 10, 794–804. [Google Scholar] [CrossRef]
  7. Ding, Z.; Lu, Y.; Zhang, L.; Lee, W.-J.; Chen, D. A Stochastic Resource-Planning Scheme for PHEV Charging Station Considering Energy Portfolio Optimization and Price-Responsive Demand. IEEE Trans. Ind. Appl. 2018, 54, 5590–5598. [Google Scholar] [CrossRef]
  8. Shaaban, M.F.; Mohamed, S.; Ismail, M.; Qaraqe, K.A.; Serpedin, E. Joint Planning of Smart EV Charging Stations and DGs in Eco-Friendly Remote Hybrid Microgrids. IEEE Trans. Smart Grid 2019, 10, 5819–5830. [Google Scholar] [CrossRef]
  9. Chen, Z.; Xiao, X.; Lu, X.; Liu, N.; Zhang, J. Multi-Objective Optimization for Capacity Configuration of PV-Based Electric Vehicle Charging Stations. Trans. China Electrotech. Soc. 2013, 28, 238–248. [Google Scholar]
  10. Chaudhari, K.; Ukil, A.; Kumar, K.N.; Manandhar, U.; Kollimalla, S.K. Hybrid Optimization for Economic Deployment of ESS in PV-Integrated EV Charging Stations. IEEE Trans. Ind. Inform. 2018, 14, 106–116. [Google Scholar] [CrossRef]
  11. Qian, K.; Zhou, C.; Allan, M.; Yuan, Y. Modeling of Load Demand Due to EV Battery Charging in Distribution Systems. IEEE Trans. Power Syst. 2011, 26, 802–810. [Google Scholar] [CrossRef]
  12. Mu, Y.; Wu, J.; Jenkins, N.; Jia, H.; Wang, C. A Spatial–Temporal Model for Grid Impact Analysis of Plug-in Electric Vehicles. Appl. Energy 2014, 114, 456–465. [Google Scholar] [CrossRef]
  13. Hu, S.-R.; Wang, C.-M. Vehicle Detector Deployment Strategies for the Estimation of Network Origin–Destination Demands Using Partial Link Traffic Counts. IEEE Trans. Intell. Transp. Syst. 2008, 9, 288–300. [Google Scholar]
  14. Liu, D.; Li, Z.; Jiang, J.; Cheng, X.; Wu, G. Electric Vehicle Load Forecast Based on Monte Carlo Algorithm. In Proceedings of the 2020 IEEE 9th Joint International Information Technology and Artificial Intelligence Conference (ITAIC), Chongqing, China, 11–13 December 2020; Volume 9, pp. 1760–1763. [Google Scholar]
  15. Kuby, M.; Lim, S. The Flow-Refueling Location Problem for Alternative-Fuel Vehicles. Socio-Econ. Plan. Sci. 2005, 39, 125–145. [Google Scholar] [CrossRef]
  16. Xie, R.; Wei, W.; Khodayar, M.E.; Wang, J.; Mei, S. Planning Fully Renewable Powered Charging Stations on Highways: A Data-Driven Robust Optimization Approach. IEEE Trans. Transp. Electrif. 2018, 4, 817–830. [Google Scholar] [CrossRef]
  17. Wu, J.; Liu, J.; Wu, Y. Coordinated Capacity Configuration Method of Source and Storage for Energy Self-sufficient System in Remote Areas. Power Syst. Technol. 2024, 48, 2031–2042. [Google Scholar]
  18. Masters, G.M. Renewable and Efficient Electric Power Systems; John Wiley & Sons Inc.: Hoboken, NJ, USA, 2004; pp. 385–443. [Google Scholar]
  19. Yan, Q.; Liu, Y.; Dong, X.; Ma, Y. Hybrid energy storage capacity optimization configuration for smoothing PV output based on CEEMDAN-HT. Power Syst. Prot. Control 2022, 50, 43–53. [Google Scholar]
  20. Zhou, Z.; Wang, C.; Jiao, B.; Guo, L.; Xu, W. Optimal Control of Wind/ Biomass/ Diesel/ Battery Stand-alone Microgrid System. Proc. CSEE 2015, 35, 3605–3615. [Google Scholar]
  21. Song, X.; Liu, Y. Wind and Photovoltaic Generation Scene Division Based on Improved K-means Clustering. Power Gener. Technol. 2020, 41, 625–630. [Google Scholar]
  22. Li, J. Research on Sizing and Siting of PV Storage Charging Integrated Stations on Expressways. Master’s Thesis, Lanzhou Jiaotong University, Lanzhou, China, 2022. [Google Scholar]
  23. Wang, X.; Tang, Z.; Fu, R. Optimal Confuguration for Stand-along Microgrid Capacity Based on Improved Operation Control Strategy. Water Resour. Power 2019, 37, 192–196. [Google Scholar]
  24. Li, Y.; Yang, Z.; Li, G.; Mu, Y.; Zhao, D.; Chen, C.; Shen, B. Optimal Scheduling of Isolated Microgrid with an Electric Vehicle Battery Swapping Station in Multi-Stakeholder Scenarios: A Bi-Level Programming Approach via Real-Time Pricing. Appl. Energy 2018, 232, 54–68. [Google Scholar] [CrossRef]
  25. Chen, H.; Guan, L.; Lu, C.; Li, Z.; Zhuo, Y. Multi-objective Optimal Dispatch Model and Its Algorithm in Isolated Microgrid with Renewable Energy Generation as Main Power Supply. Power Syst. Technol. 2020, 44, 664–674. [Google Scholar]
  26. Zhang, Y.; Jin, Y.; Ke, J.; Ru, F.; Zhang, C. Capacity configuration of microgrid in off-grid accessible service area considering variable load. J. Chang. Univ. (Nat. Sci. Ed.) 2024, 5, 126–140. [Google Scholar]
  27. Zhen, X.; Yao, Y. Multi-objective capacity allocation optimization method of photovoltaic EV charging station considering V2G. J. Cent. South Univ. 2021, 28, 481–493. [Google Scholar] [CrossRef]
  28. Wang, Y.; Yang, Y.; Zhang, N.; Huang, M. An Integrated Optimization Model of Charging Station/Battery-Swap Station/Energy Storage System Considering Uncertainty. In Proceedings of the 2017 IEEE International Conference on Energy Internet (ICEI), Beijing, China, 17–21 April 2017; pp. 77–82. [Google Scholar]
  29. Ghiaskar, A.; Amiri, A.; Mirjalili, S. Polar fox optimization algorithm: A novel meta-heuristic algorithm. Neural Comput. Appl. 2024, 36, 20983–21022. [Google Scholar] [CrossRef]
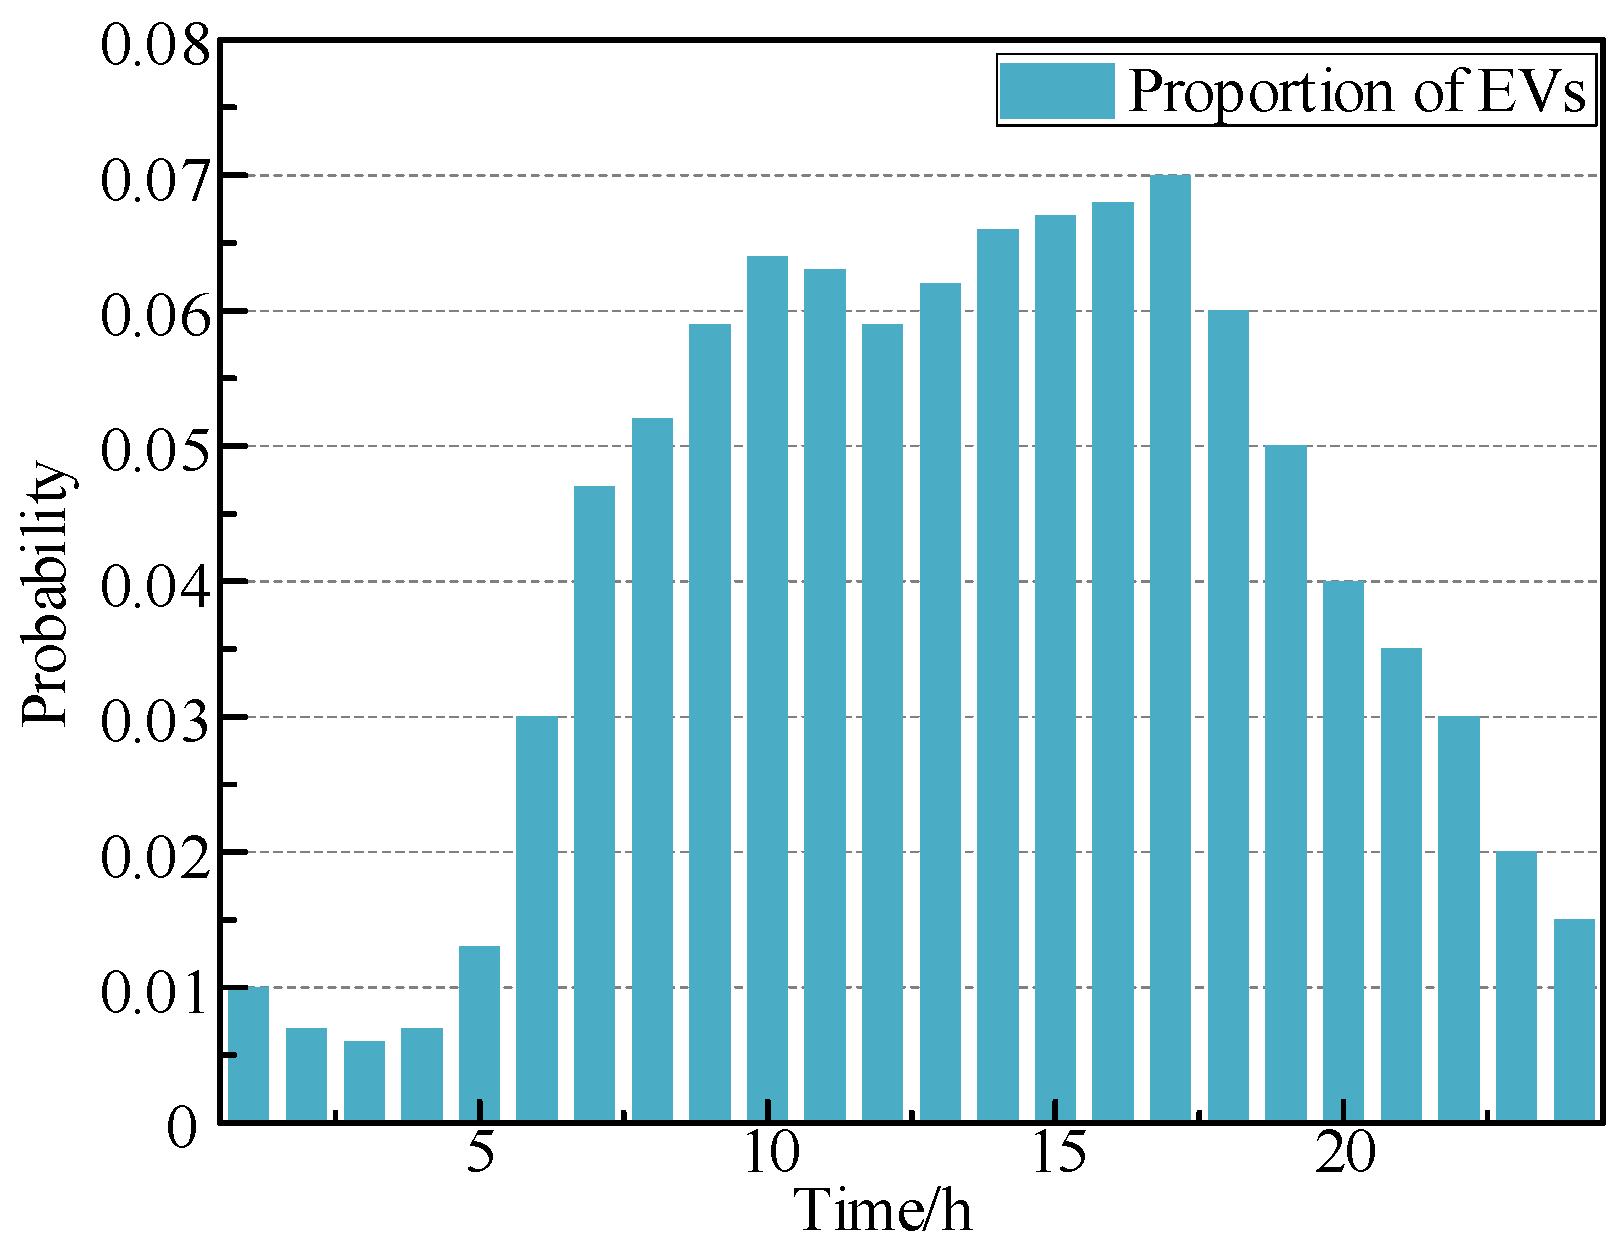
Figure 1. Daily travel probability of EVs.
Processes 13 00786 g001
Figure 2. Site selection process diagram.
Processes 13 00786 g002
Figure 3. Wind–solar storage charging station system structure.
Processes 13 00786 g003
Figure 4. Pareto frontier between the number of charging stations and vehicle uncaptured rate.
Processes 13 00786 g004
Figure 5. The relationship between the number of charging stations and site selection indicators.
Processes 13 00786 g005
Figure 6. Location selection results of charging.
Processes 13 00786 g006
Figure 7. Schematic diagram of the daily output per unit capacity of wind and solar power in various scenarios.
Processes 13 00786 g007
Figure 8. Typical daily load heat map of car charging station.
Processes 13 00786 g008
Figure 9. Different typical daily electricity dispatch of charging station no. 9.
Processes 13 00786 g009
Figure 10. Typical day 1 electricity dispatch of charging station no. 7.
Processes 13 00786 g010
Figure 11. Evaluation results of capacity allocation for different site selection schemes.
Processes 13 00786 g011
Figure 12. Assessment results of the model for different numbers of vehicles.
Processes 13 00786 g012
Figure 13. Sensitivity analysis of weight factor changes.
Processes 13 00786 g013
Table 1. Probability density function of the maximum battery capacity.
EV TypeLMN1N2
Distribution typeGammaGammaNormalNormal
Parameterμ1 = 10.8; δ1 = 0.8μ1 = 4.5; δ1 = 6.3μ2 = 23.0; δ2 = 9.5μ2 = 85.3; δ2 = 28.1
Maximum (kW·h)15.072.040.0120.0
Minimum (kW·h)5.010.09.651.2
Proportion10%84%3%3%
Table 2. Simulation parameters.
ParametersValuesUnit
v90km·h−1
SOCiU(0.8, 0.9)-
SOCCU(0.15, 0.3)-
W10.2kW·h/km
Pc50kW·h
η0.8-
Table 3. DG and ES parameters.
ParametersWTPVESG
Investment Cost (USD/kW)840672504280
Operation and Maintenance Cost (USD/kW)0.00980.00280.0350.0084
Service Life (year)15201015
Discount Rate0.080.080.080.08
It is important to note that the units for energy storage differ from those used for wind power, photovoltaics, and diesel generators. Specifically, investment costs are expressed in USD/kWh, while operation and maintenance costs are denoted in USD/kWh.
Table 4. Planning scheme for wind–solar energy storage integrated fast charging station.
Charging
Station ID
Location (x,y)Distance from Starting Point (km)Daily Power Load (kWh)
4(292.0, 38.1)41.505637.3
7(259.7, 39.1)72.6211,408.3
9(239.9, 39.4)93.377603.1
10(229.7, 37.8)103.758348.7
14(195.0, 43.2)145.2519,748.3
18(180.3, 75.5)186.759886.4
20(172.3, 92.4)207.5011,585.3
22(165.4, 108.3)228.2510,303.6
26(161.0, 144.4)269.7419,342.5
30(142.7, 178.4)311.2412,504.9
32(123.6, 186.2)331.998986.1
34(105.2, 197.8)352.746426.6
35(97.4, 203.8)363.125295.9
38(77.5, 223.3)394.2415,916.3
41(63.6, 246.8)425.378191.6
43(60.6, 264.1)446.128411.1
45(49.8, 277.9)466.878241.0
Table 5. Typical scenario probability.
Scenario12345
Probability0.10560.24220.21810.22690.2072
Table 6. Integrated charging station configuration for wind–solar energy storage.
Charging
Station ID
Storage
Capacity (kWh)
Wind Power
Capacity (kW)
Photovoltaic
Capacity (kW)
Generator
Capacity (kW)
Comprehensive Cost (USD)Planned Area (m2)
43033288195220377,089.792891
74479567752464480,391.268590
94007330849279457,214.638973
104306412780322462,426.848347
1447061230411528524,681.736896
184730535478441456,517.296069
204611662589450478,185.297090
224535660615416478,677.017322
2647621024286462493,604.175258
304685752234397460,992.714291
324675563181349437,144.163317
344388334503238432,965.505789
354234278522196427,381.235954
384586107142423480,275.372996
414464592453397460,228.135825
433957325691217444,277.737504
454148384516255439,390.965901
Table 7. Self-sufficiency rates of each charging station on different typical days.
Charging
Station ID
Typical Day 1Typical Day 2Typical Day 3Typical Day 4Typical Day 5
474.11%92.79%90.41%98.88%98.82%
765.78%93.28%87.19%97.88%98.87%
972.63%95.00%89.00%98.00%100.00%
1066.36%95.86%84.01%98.87%99.95%
1466.96%92.94%84.11%98.42%99.36%
1864.99%97.59%86.96%97.53%98.98%
2071.26%97.15%92.78%98.32%98.22%
2272.11%95.86%87.66%97.48%98.82%
2664.50%97.73%86.94%98.07%98.72%
3065.49%97.36%87.48%97.54%98.30%
3266.96%92.74%93.70%97.78%99.57%
3474.62%97.79%91.56%98.43%99.26%
3564.53%96.01%84.26%97.72%98.15%
3875.63%94.59%84.89%97.39%98.05%
4164.07%97.25%89.17%98.23%98.48%
4370.44%94.35%91.40%98.30%98.62%
4567.85%95.35%92.83%98.73%98.09%
Table 8. Capacity configuration and comprehensive cost results of each model.
Scheme1234
Storage (kWh)80,06768,54477,30880,937
Wind Power (kWh)10,00812,68612,542/
Photovoltaic (kWh)81002699/30,225
Diesel Generator (kW)6054/70436622
Annualized Comprehensive Costs (USD)7,791,4486,542,1728,321,2648,367,342
Annual Wind and Solar Power Curtailment (kWh)1,736,003.381,189,268.602,420,300.40962,393.31
Annual Diesel Generator Power Generation (kWh)3,595,438.57/4,131,670.0612,489,766.37
Power Shortage Rate (%)6.46%29.48%7.42%22.44%
Self-Consistency Rate (%)90.42%97.86%88.23%75.83%
Table 9. Comparison results.
The Charging Station NumberRate of Captured EVsTotal Cost
(Million RMB/Year)
A2096.3%175.63
B1894.4%47.16
Table 10. The influence of different vehicle proportions: vehicle capture rate, self-sufficiency rate, and comprehensive cost of the model.
Vehicle ProportionsVehicle Capture RateSelf-Sufficiency RateComprehensive Cost (USD)
100% L75.8%88.60%13,775,396
100% M88.5%93.08%7,062,568
100% N180.6%85.55%8,045,853
100%N295.6%83.36%6,659,785
10% L, 84% M, 3% N1, 3% N277.3%90.42%7,791,448
Table 11. Impact of diesel generator pollution control costs on capacity allocation results.
Pollution Control Costs (USD/kWh)Storage
Capacity (kWh)
Wind Power
Capacity (kW)
Photovoltaic
Capacity (kW)
Generator
Capacity (kW)
Comprehensive Cost (USD)Self-Sufficiency Rate
1.065,0468532720680667,256,39785.1%
1.472,6509204766072007,528,36088.3%
1.882,09310,169821359857,900,54690.8%
2.288,01011,083853648338,150,06090.5%
2.693,25011,260876630608,290,65083.6%
3.0102,00012,033893025908,530,98080.3%
Table 12. Contrasting results of the various algorithms.
NameVehicle Capture Rate (%)Time (s)
Polar Fox Optimization Algorithm75.8%1566
NSGA-II77.3%2168
Table 13. Electric pricing and dynamic recovery periods.
Pricing (USD/kWh)Annual Cash Flow (USD)Dynamic Payback Period (year)
0.151,456,484Cost Recovery Not Achieved (NPV < 0)
0.204,539,12811.2
0.257,621,7726.5
0.3010,704,4164.3
Disclaimer/Publisher’s Note: The statements, opinions and data contained in all publications are solely those of the individual author(s) and contributor(s) and not of MDPI and/or the editor(s). MDPI and/or the editor(s) disclaim responsibility for any injury to people or property resulting from any ideas, methods, instructions or products referred to in the content.