Abstract
The current high cost of producing green hydrogen, for use as an energy vector, has motivated the search for the development of non-conventional technologies for its production, joining forces on the path towards energy transition. Hydrogen production by aluminum corrosion in aqueous acid solutions seems to be a promising alternative. In order to evaluate its technical feasibility, a kinetic study was carried out, analyzing the impact of HCl concentration (1.125 to 1.75 M) on the aluminum corrosion capacity under the presence of a saline environment and using a promoter, fitting the proposed models to the data obtained through experimental runs. Although other studies use the shrinking core model to describe the kinetics of this type of reaction, in most cases, it does not fit well with the experimental data and needs to be modified. Finally, by considering the corrosion dynamics (variations in diffusion coefficients and shell thickness) in the kinetic model equations, it was possible to describe its behavior. For low HCl concentrations, a single resistance controls the reaction of the particle throughout; however, for high HCl concentrations, a combination of related equations must be used. The results of this study enable viable continuous reactor designs for a given amount of green hydrogen production.
1. Introduction
Hydrogen is more plentiful than any other chemical element in the universe. It is an energy vector. It can be used to obtain electrical, mechanical or thermal energy with high efficiency, without CO2 emissions and with pure water as the main residue. As it is not found freely in the environment, it needs to be extracted to be used for electrical energy production, contributing greatly to the energy transition.
A color code has been created to classify hydrogen depending on the process used for its extraction, the energy source, and the raw material used. Grey hydrogen represents hydrogen produced from fossil fuels by steam methane reforming without carbon capture, utilization and storage (CCUS) [1,2,3]. Over 95% of the world’s hydrogen consumption is grey hydrogen [4]. On the other hand, green hydrogen is hydrogen produced by water electrolysis using renewable energy for electricity generation. No CO2 emissions are generated during the production process. Currently, it costs significantly more than grey hydrogen. In the literature, green hydrogen is also referred to as “clean hydrogen” (low carbon emissions) or “renewable hydrogen”. This type of hydrogen plays a key role in the transition to sustainable energy; however, it constitutes less than 0.1% of the world’s hydrogen production [2,4,5]. This scenario highlights the need to focus research efforts on the search for innovation and improvements in the production of green hydrogen.
Recent work has shown that aluminum corrosion in aqueous solutions is a promising alternative route to produce “clean hydrogen” [6,7,8,9]. Aluminum is one of the most suitable options for energetic purposes due to its low price, high electron density, high abundance, oxidation potential and safe by-products [10]. Aluminum is covered with a continuous and uniform natural oxide film (Al2O3), which is formed spontaneously in oxidizing media and protects it from corrosion.
According to Deng et al. [11] and Bunker et al. [12], the continuous corrosion mechanism of Al with water starts when aluminum is submerged in water, and hydration of the native oxide occurs. The ions move through the hydrated oxide film; there is still no film growth (induction stage). Continuous hydration produces permeable hydroxide phases (1). Once the native oxide film is completely hydrated, the ions reach the Al surface and carry out an electrochemical reaction, releasing H2 at the Al:Al2O3 interface (2). Trapped hydrogen bubbles build up to pressures high enough to separate the interfaces and produce blisters and/or cracks, allowing water to come into contact with the Al core and restart the reaction process (3). During the reaction the AlOOH film, the layer formed thickens and the pores are filled; hence, the water penetration rate through the shell reduces [13,14]; these phenomena significantly reduce the H2 production rate.
For the reasons above, the research on the subject is focused on dissolving or removing the AlOOH film. It has been demonstrated that chloride ions move through the oxide film or are chemisorbed on its surface, increasing the dissolution of aluminum attributable to oxide–chloride complexes’ formation (4) to (6) [15,16]:
Additionally, in the presence of a more noble metal and an electrolyte, the aluminum becomes the anode of the galvanic pair and begins to corrode. Asseveration was demonstrated by Li et al. [17] and Shams El Din et al. [18], who, in an effort to study sodium molybdate as a corrosion inhibitor for metals, observed that the presence of a low MoO4−2 concentration in an aqueous solution resulted in excessive corrosion, denoting oxide film destruction. The corrosion effect increased under acidic conditions. Furthermore, Coronel-Garcia et al. [8] determined the influence of sodium molybdate particles on aluminum corrosion in aqueous hydrochloric acid solutions for hydrogen production. The hydrogen volume produced was affected by the Na2MoO4 concentration, which was higher the lower than the proposed MoO4−2 ions’ concentration.
On the other hand, several kinetic models have been developed to explain hydroxide layer dissolution by the “shrinking core” model described by Levenspiel [19,20,21]. This model considers that the acid or alkaline agent’s concentration in the aqueous solution remains constant during the hydrogen production process, the diffusion coefficient of the fluid through the shell is constant, the physical characteristics of shell formed during the reaction are constant and the chemical reaction on the unreacted core surface is of the first order [22]. However, researchers frequently employ the model proposed by Levenspiel in their studies without ruling out the appropriate assumptions according to the system’s studied nature, obtaining models lacking sufficient agreement with the experimental data.
S. S. Razavi-Tousi et al. [23] developed a modified shrinking core model to describe the aluminum–water reaction in which two of the main assumptions considered by Levenspiel were modified. The first considers that the shell formed (hydroxide layer) presents changes in its physical characteristics during the reaction; thus, the thickness of the shell is not the same as that of the consumed core. The second difference was that the nonlinear diffusion coefficient was considered. The results obtained were satisfactory since the modified model fits with an R-square of 0.994 with the experimental data.
Martínez-Salazar et al. [10] modified the shrinking core model to describe hydrogen production behavior by flat plate aluminum corrosion in seawater solutions at low HCl concentrations (0.5 to 1 M) in the presence of Na2MoO4. The results show the diffusion of ion species/water molecules through the hydroxide layer to substrate aluminum controls kinetics. The nonlinear diffusion coefficient and the effect of size and composition on AlOOH layer growth were taken into account. Growth and densification of the hydroxide layer occurred during the reaction, increasing as the HCl concentration decreased.
Therefore, in this study, the impact of a higher HCl concentration (1.125 to 1.75 M) on the aluminum corrosion capacity in seawater solutions, using Na2MoO4 as a promoter, was determined by pilot–plant experiments in order to analyze kinetic behaviors, adjusting the shrinking core model in response to the increase in hydrogen production. This kinetic study will allow us to expand the understanding of the reaction mechanism for hydrogen production through the aluminum–water reaction, allowing researchers to predict the hydrogen production rates for high HCl concentrations, which could provide important reactor design criteria for continuous hydrogen production.
2. Materials and Methods
2.1. Material Preparations
Aluminum alloy 3104 beverage cans’ bodies were collected as residue. Their chemical composition is 95.85% Al, 1.25% Mg, 1.20% Mn, 0.60% Fe, 0.30% Si, 0.25% Cu, 0.20% Zn, 0.10% Ti and 0.05% Cr. Each sheet of aluminum alloy was 0.15 mm thick, sanded and cut in uniform flat plates as a pretreatment.
Hydrochloric acid (HCl, 37%) was supplied by Fermont Company, manufactured in Monterrey, NL, Mexico. To obtain Na2MoO4 nanoparticles, ammonium heptamolybdate tetrahydrate ((NH4)6Mo7O24 4H2O, 99.98%), sodium formaldehyde sulfoxylate (CH3NaO3S) and sodium citrate dihydrate (HOC(COONa)(CH2COONa)2·2H2O) were purchased from Sigma-Aldrich, manufactured in St. Louis, MO, USA. All the materials were of reagent grade and were used as received.
Finally, Miramar beach seawater, Gulf of Mexico, which contained a typical superficial salinity of 2.72% NaCl, 0.38% MgCl2, 0.166% MgSO4, 0.126% CaSO4, 0.086% K2SO4, 0.012% CaCO3 and 0.0076% MgBr2, was used [24,25].
2.2. Promoter Synthesis by Chemical Reduction Method
The nanoparticles of Na2MoO4 (used as a promoters) were synthetized using ammonium heptamolybdate as a precursor, sodium formaldehyde sulfoxylate (SFS) as a reducing agent, and sodium citrate to stabilize the particles, capping them.
To obtain Na2MoO4 nanoparticles, the stabilizing agent was dissolved in a minimum amount of deionized water needed to keep it in the solution and added drop-wise to a solution (100 mL) of deionized water and precursor in a Mo/sodium citrate molar ratio of 5. The resulting solution was sonicated using an ultrasonic bath for 15 min. The reducing agent was added to the molybdenum solution maintaining a Mo/SFS molar ratio of 5 and was kept under constant stirring for 30 min. Finally, the solid metals were obtained, drying the solution at 373 K for 12 h [26].
2.3. Characterization of the Promoter
The synthesized promoter was characterized by X-ray diffraction (XRD), Ultraviolet–Visible (UV–Vis) spectrophotometry and Dynamic Light Scattering (DLS).
XRD was performed in a Bruker D8 Advance diffractometer using Cu Kα radiation (35 kV, 25 mA) at 2.4°/min.
UV–Vis absorption measurement was carried out on UV-Visible Spectrometer Cintra 303, from GBC Scientific Equipment, Ltd., Mexico City, Mexico, in the wavelength range of 200–800 nm.
Particle sizes measurements were carried out on a LitesizerTM 500 from Anton Paar, Graz, Austria, in a methanol solution to avoid Na2MoO4 dissolution.
2.4. Experimental Procedure
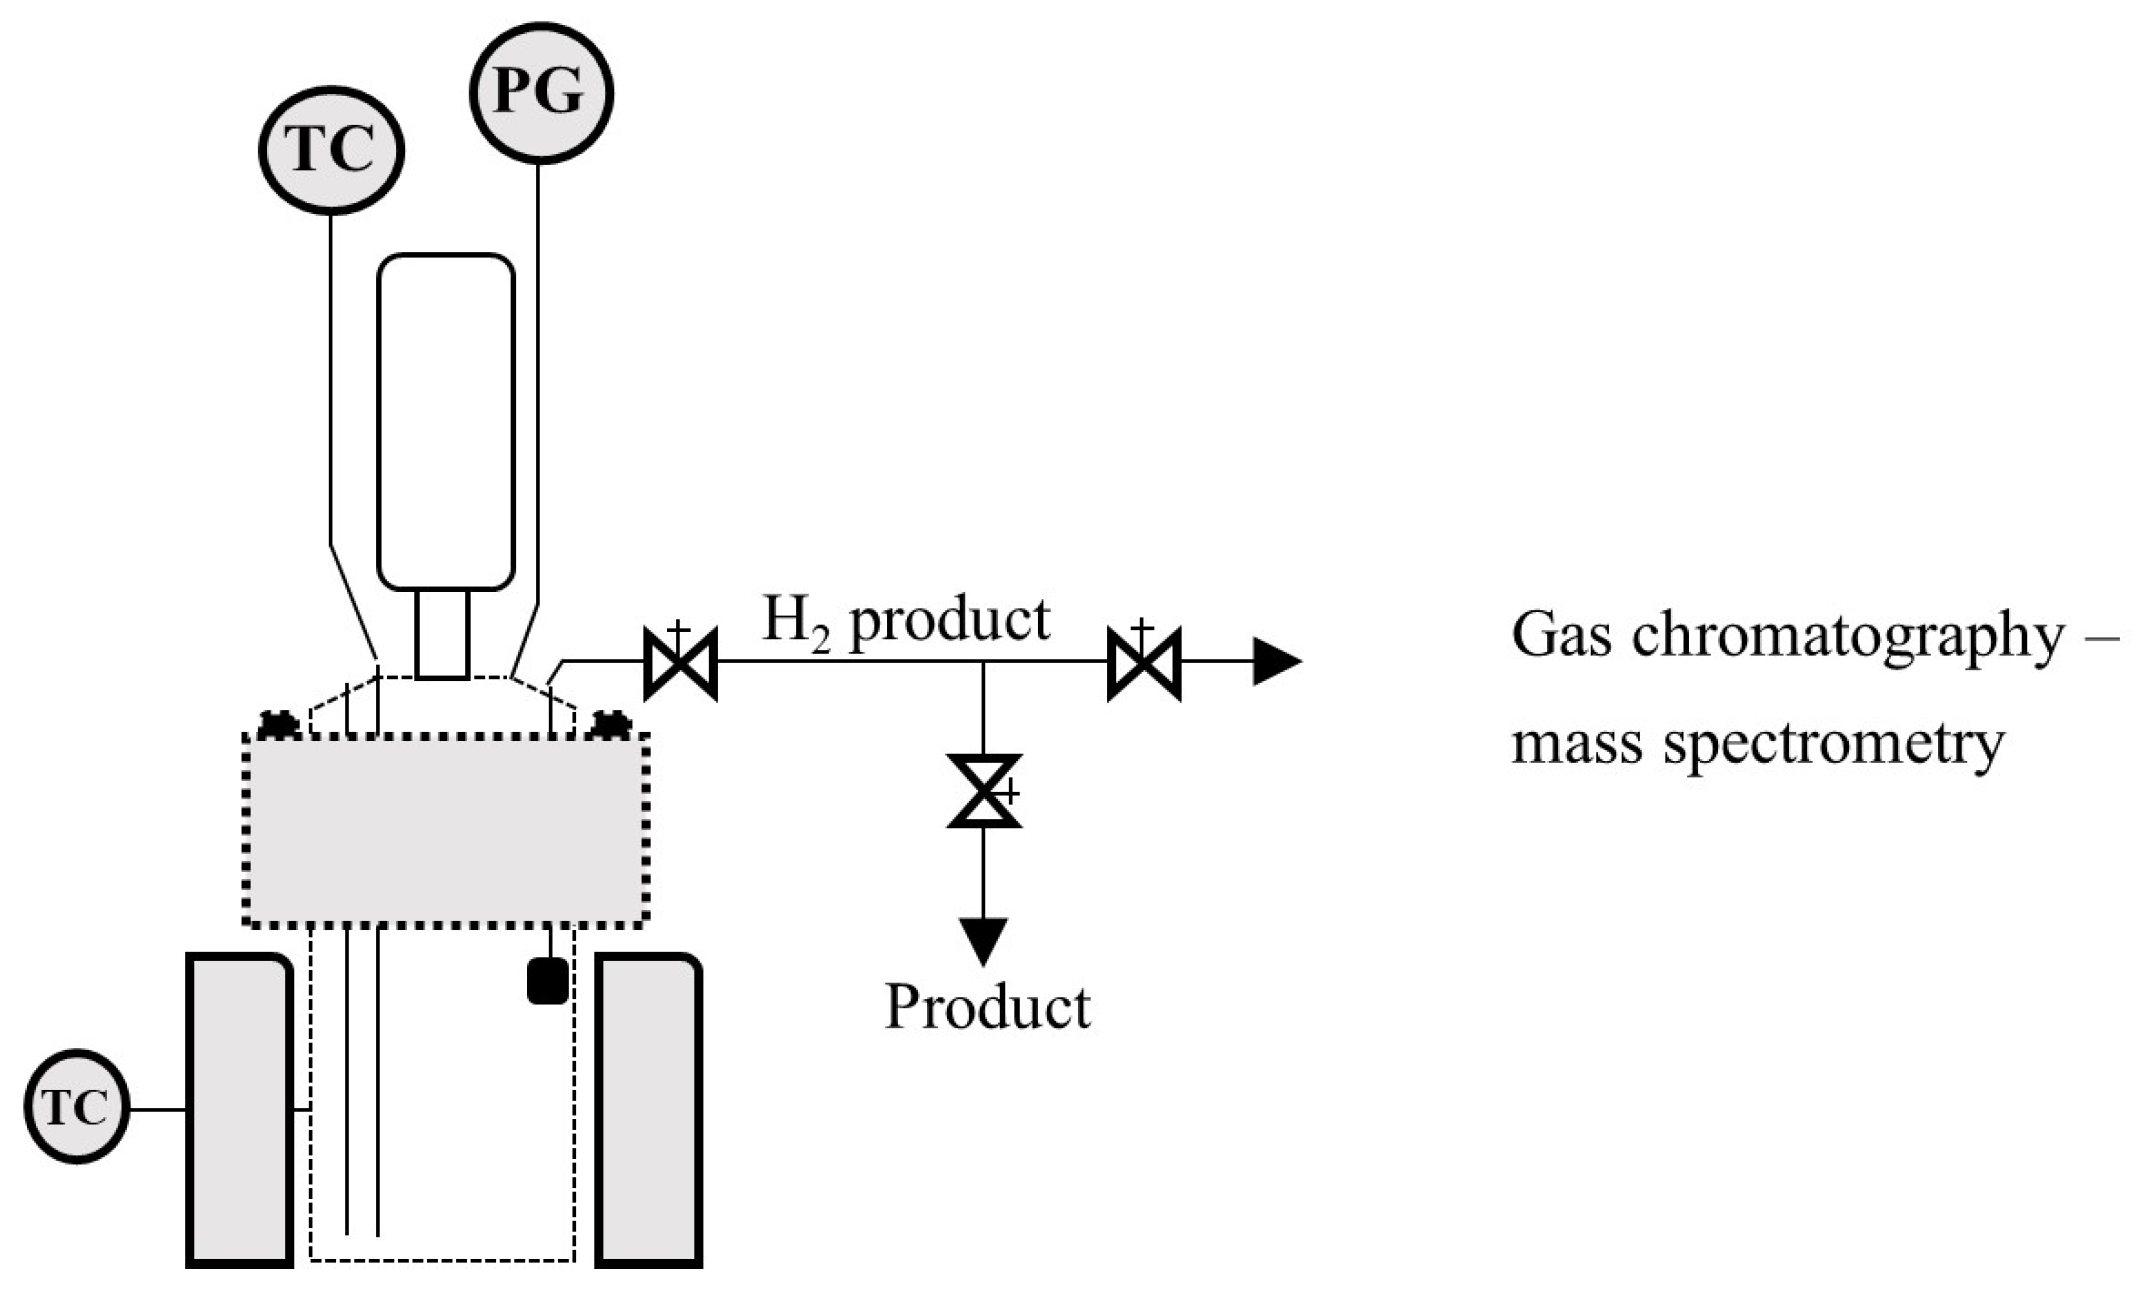
This study of aluminum corrosion reaction kinetics involved a series of pilot-scale experiments using a 2 L Parr pressure reactor, equipped with a model 4848 temperature controller, a pressure gauge and an automated internal cooling system. The reactor was loaded with 1.35 L of seawater acid solution with 0.17 M of the promoter agent, Na2MoO4. The amount of HCl varied for each experiment, being 1.125 M, 1.25 M, 1.5 M and 1.75 M. The reactor was heated to 305 K as an initial set point temperature. The zero-reaction time was taken when 40.67 g of aluminum was added and the reactor was sealed tightly. Pressure and temperature variations were monitored during the course of the reaction to quantify the hydrogen production rates. Under these conditions of temperature and pressure, H2 gas is well described by the Soave–Redlich–Kwong equation of state [27]. The hydrogen produced was analyzed by gas chromatography coupled to mass spectroscopy. Each experiment evaluation was repeated three times and replaced with average values.
Figure 1 shows the schematic of the reaction system that was used in the experimental tests.
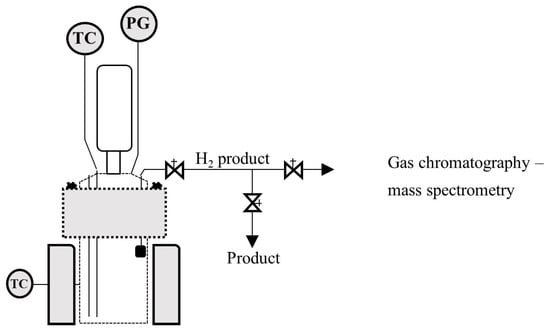
Figure 1.
Schematic of the hydrogen production reactive system.
2.5. Development of the Model
In the liquid–solid heterogeneous system of hydrogen production by aluminum alloy corrosion in aqueous acid solutions (7), the reaction rate may be controlled as certain individual steps such as the diffusion of ion species/water molecules through the fluid film to the surface of the solid, the diffusion of ion species/water molecules through AlOOH layer to aluminum surface, and the chemical reaction on the Al surface. If none of the steps above is the rate-controlling mechanism, a combination of all related equations should be used for hydrogen production kinetics of studied cases [22].
A (acid-liquid) + bB (solid) → fluid and solid products
Figure 2 shows the flat plate shape schematic diagram of the model.
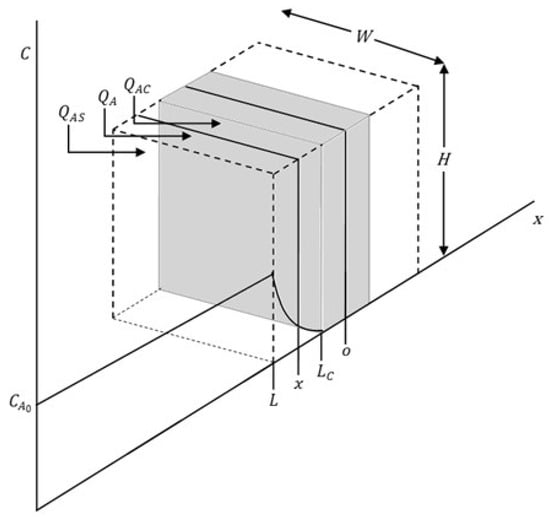
Figure 2.
Schematic of particle behavior during reaction.
The diffusion of ion species/water molecules through the fluid film to the surface of the solid was discarded as the controlling step assuming that an abundant amount of ion species/water molecules is available in the solution [23].
If the diffusion of ion species/water molecules through the AlOOH layer to the aluminum surface is the controlling step, the material balance is as follows:
where N, Q, and W∙H are the number of moles, flux and surface area, respectively.
- QAS = flux at particle surface;
- QAC = flux at the core boundary (aluminum).
The material flux of fluid can be written by Fick’s law:
where CA is the concentration of A atoms and DA is the effective diffusion coefficient of A in the hydroxide layer.
Associating Equations (8) and (9) and integrating across hydroxide layer thickness and A atoms concentration from particle surface to the core gives:
where CAo is the concentration of A at particle surface.
In this step, the first modification to the “shrinking core” model described by Levenspiel will be applied. The shell formed (hydroxide layer) has different physical characteristics during the reaction and its thickness is not proportional to that of the consumed core [23]; therefore, this needs to be considered and calculated. The complete calculation procedure can be found in the work of Martínez-Salazar et al. [10]. Equation (10) is modified as follows:
“n” is introduced as the ratio of produced shell volume to consumed core volume and is an initial length (original thickness: 2).
According to (7), A moles consumption rate can be written as follows:
where ρB is the density of B atoms.
Replacing Equation (12) in Equation (11) gives:
In this step, the next modification to the “shrinking core” model described by Levenspiel is applied. A nonlinear diffusion coefficient was considered. The complete calculation procedure can be found in the work of Martínez-Salazar et al. [10]. Equation (13) is modified as follows:
- Do = diffusion coefficient at the time equal to zero;
- k = constant that determines the time effect on diffusion coefficient.
In agreement with Levenspiel, xB is defined as fractional conversion:
Equation (14) can be re-written as follows:
Equation (16) infers the conversion degree for a flat plate aluminum particle with respect to time with a change in shell thickness and in diffusion coefficient during the corrosion reactions’ development in aqueous acid solutions when diffusion through AlOOH layer controls the reaction.
If the chemical reaction on Al surface is the controlling step, according to (7) the rate of disappearance of aluminum, B (), can be described as follows:
If → according to the chemical reaction and their stoichiometric coefficient in R7, it is possible to obtain the reaction rate:
where is the rate constant of the first-order reaction controlled by the interaction between the A (ion species/water molecules) and the surface of B (aluminum), and is the concentration of A existing on the B surface. The amount of aluminum disappearing can be expressed using its density and its volume, (), as follows:
Replacing Equation (19) in Equation (18) and integrating across the core (aluminum) with respect of time, t, gives:
If , the time for complete dissolution reaction, , can be expressed as follows:
Combining Equations (20) and (21) in the form of length size relation of aluminum before and after dissolution time gives the expression for and apparent rate constant, :
Since is difficult to measure the length sizes of the aluminum flat plate before and after dissolution time,
where and represent the initial and residual amount of aluminum vs. dissolution time t, respectively.
On the other hand, represents the dissolved fraction of B vs. dissolution time t, which can be represented by:
Combining Equation (22) with Equation (25), the rate equation of the surface chemical-reaction-controlled process for aluminum flat plates particles is established as follows:
It can be seen that and time t are in a linear relationship and the slope of these lines is .
Equation (26) infers the conversion degree for a flat plate aluminum particle with respect to time during the corrosion reactions’ development in aqueous acid solutions when the chemical reaction controls.
3. Results and Discussion
3.1. Na2MoO4 Characterization
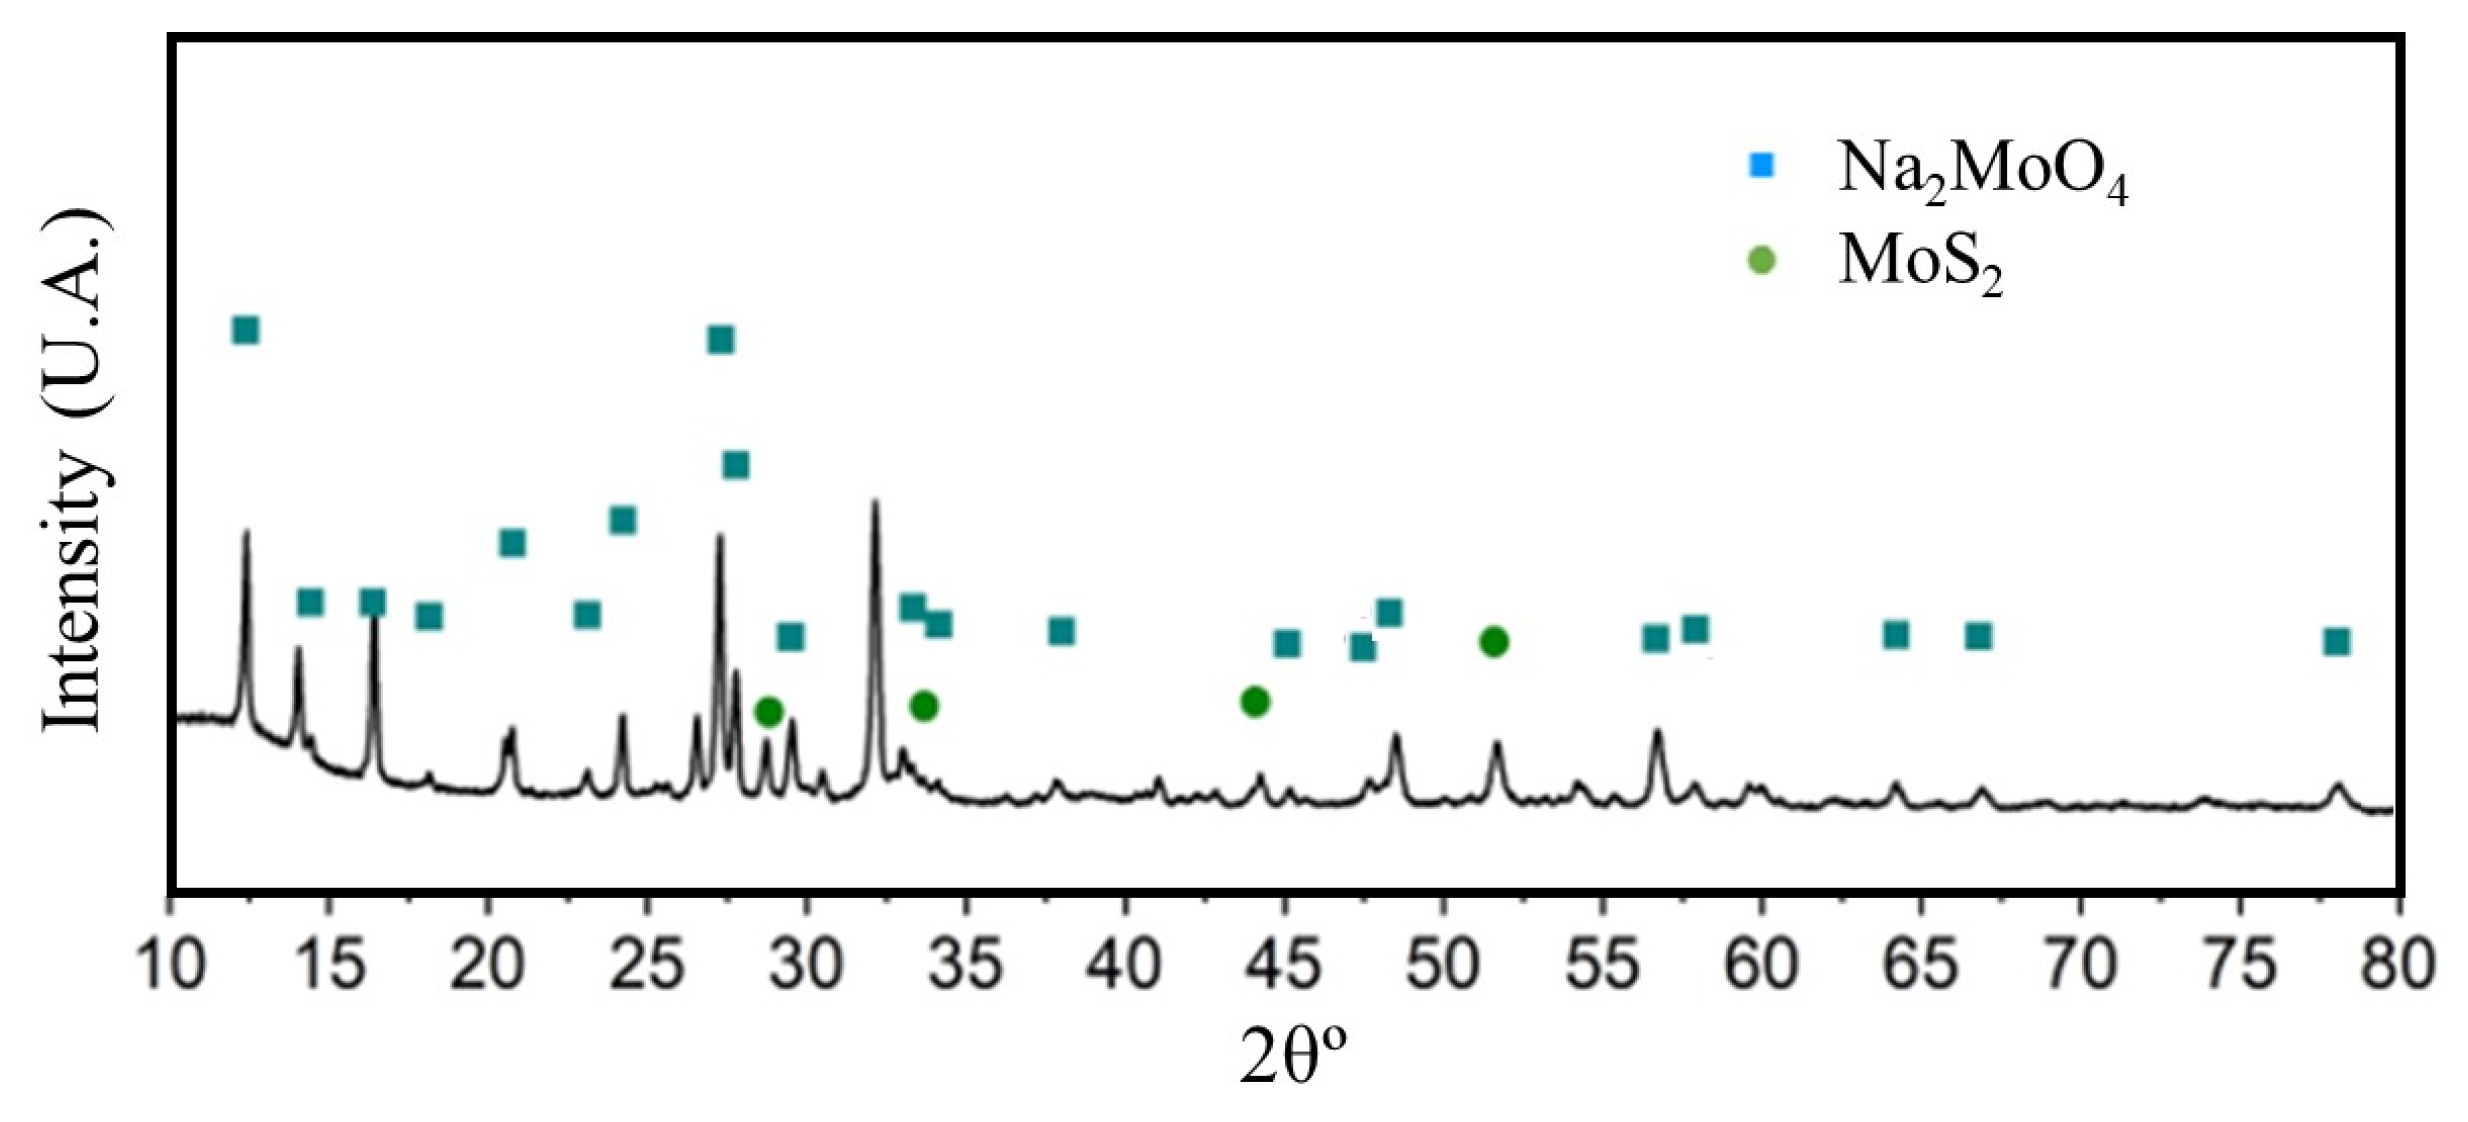
Figure 3 shows the anhydrous Na2MoO4 characteristic diffraction peaks at 16.8°, 27.7°, 32.6°, 48.9° and 56.3° of 2θ, attributed to the (001), (101), (002), (011) and (102) diffraction plans, respectively [28]. Hence, the presence of a functional material as a promoter in the corrosion reaction of aluminum alloys is confirmed.

Figure 3.
X-ray diffraction profile corresponding to the Na2MoO4 synthesized.
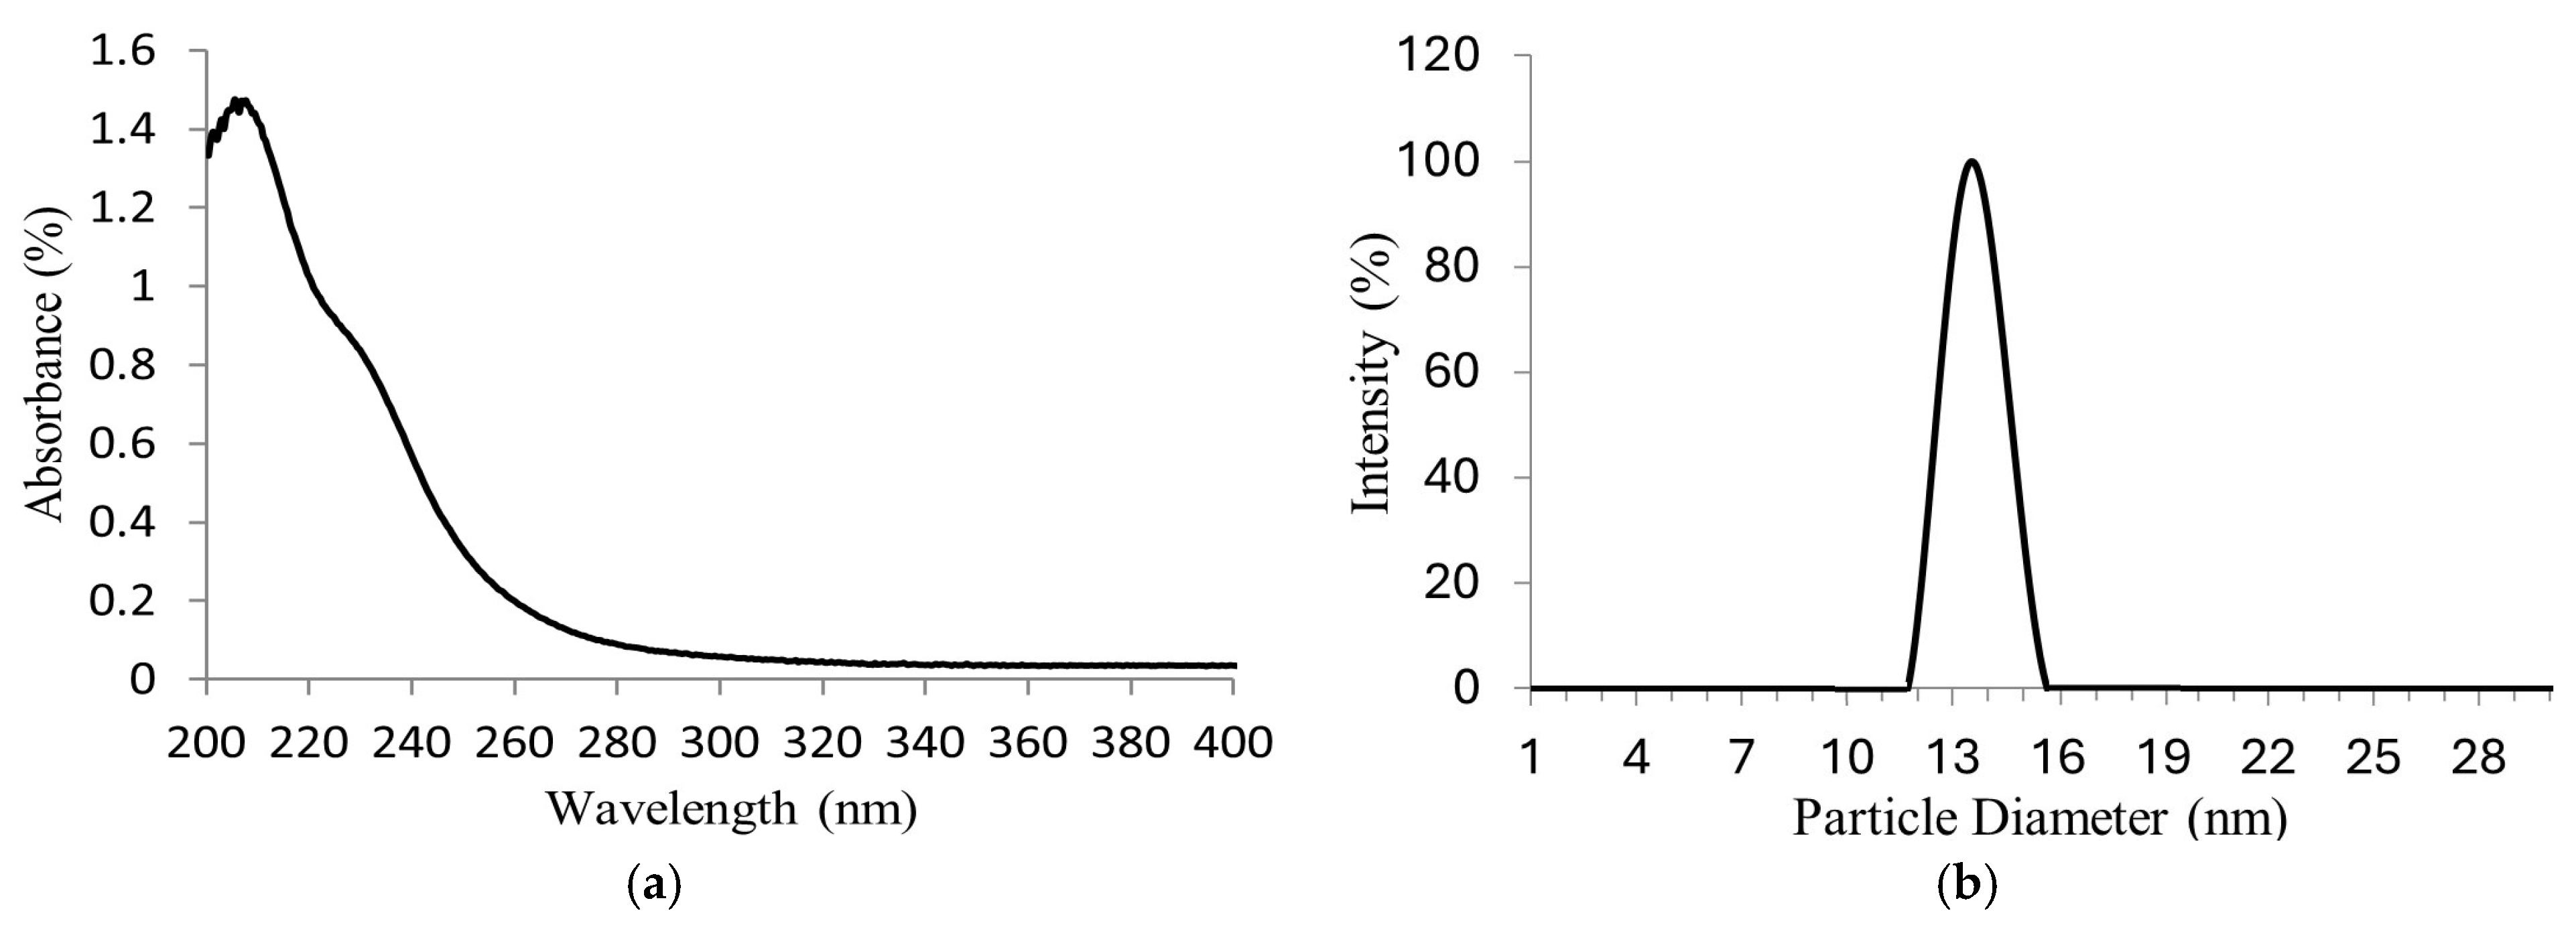
The Na2MoO4 nanoparticles synthetized were dissolved in water for the UV–Vis analysis in order to identify the molybdenum species in the solution. Ultraviolet–visible (UV–Vis) spectroscopic data in Figure 4a show a maximum absorption peak in the wavelength range of 207–208 nm and a shoulder near 232 nm, characteristic of molybdate ions (MoO4−2). According to P.C.H. Mitchell [29], in aqueous solutions, at 1–10 mgMo/L of Na2MoO4 and pH 7, only MoO4−2 species are present. Therefore, the presence of Na2MoO4 is confirmed.
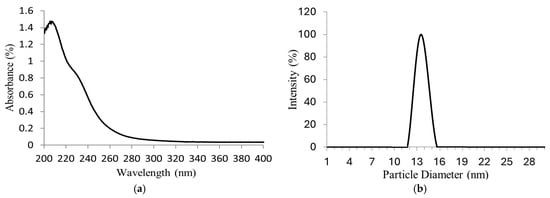
Figure 4.
(a) UV–Vis absorption spectrum of molybdate ions (MoO4−2); (b) particle sizes of Na2MoO4 synthetized.
The nanoparticle size distribution of Na2MoO4 synthetized can be observed in Figure 4b. A narrow bell-shaped distribution was obtained, referring to the achievement of good diameter uniformity (≈14 nm) as a result of the ultrasonic vibration. This nanoparticle size obtained increases the hydrogen production yield, improving its contact area to exert galvanic corrosion.
3.2. HCl Contents Effect on Hydrogen Generation
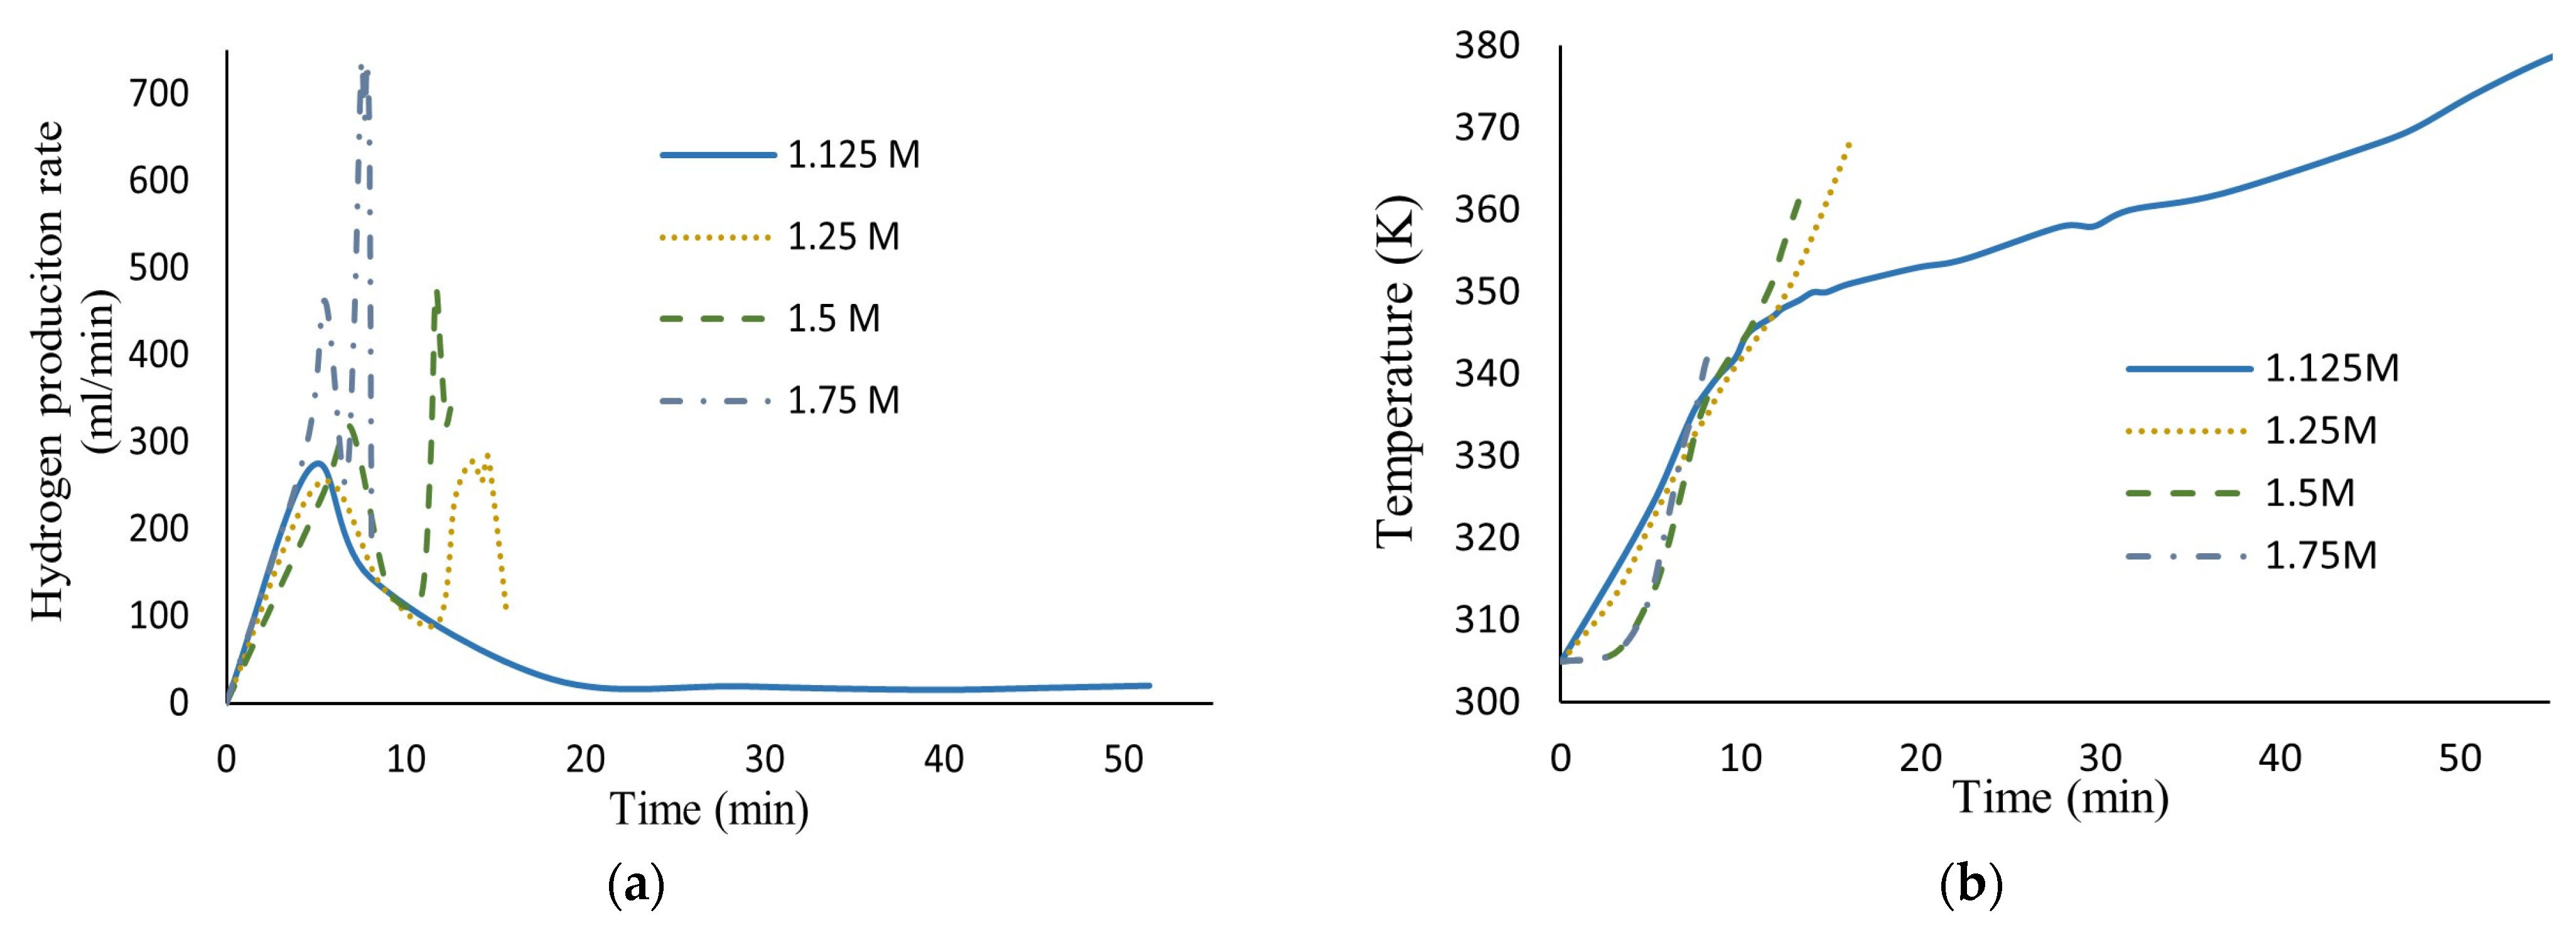
Figure 5 shows the effect of HCl molar concentration variation in the hydrogen production rate and the temperature behavior during reaction. As can be seen, the presence of aggressive anions like chloride prevents the AlOOH film’s formation and accelerates the aluminum dissolution process. The greater the chloride ion concentration, the more the hydrogen production rate increases.
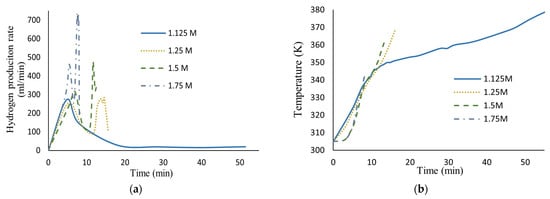
Figure 5.
(a) Hydrogen production rate vs. time; (b) temperature history, for different HCl molar concentrations in seawater (40.67 g aluminum, 0.17 M Na2MoO4).
Also shown, in the lowest HCl molar concentration (1.125 M), is a similar curve to that obtained in previous work (Martínez-Salazar et al. [10]) where, once the reaction started, the highest hydrogen production rate was achieved in a short period of time due to hydroxide layer densification during the reaction. This assertion was confirmed by the kinetic analysis where diffusion through the hydroxide layer was obtained as the controlling stage of the hydrogen production rate.
However, at high HCl molar concentrations (1.25 M to 1.75 M), a different behavior as the reaction progressed over time was observed. In the first minutes, the presence of the induction period can be observed where the oxide layer is hydrated and AlOOH is formed, and there is no reaction between aluminum and water yet; thus, no hydrogen is generated. Once the reaction started, two peaks appeared throughout the reaction for each HCl molar concentration. The first is similar to that of curves obtained for low HCl concentrations, showing an increase in the hydrogen production rate in a short period of time, followed by its decrease. This phenomenon can be attributed to the change in the composition and thickness of the hydroxide layer. However, the presence of the second peak, where the highest hydrogen production rate was achieved, confirms the migration of chloride ions through the oxide film where they act like reaction partners, aiding AlOOH layer dissolution. Consequently, the core (aluminum) increases contact with ion species/water molecules, reaching high corrosion rates.
In addition, there is the presence of Na2MoO4 nanoparticles, which, in aqueous solutions, dissociate into sodium and tetrahedral molybdate ions. On the other hand, under acidic conditions, molybdate ions polymerize depending on the acidity degree, (27) [30,31].
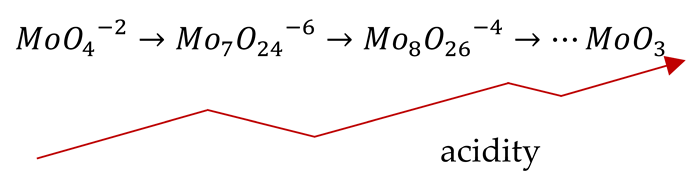
Molybdenum trioxide, MoO3, acts in the corrosion process as a second cathodic reaction (28) [32]; therefore, by increasing the demand for electrons, it causes an increase in the speed of the anodic reaction, which translates into an increase in the aluminum oxidation rate.
Therefore, by having high HCl concentrations and low Na2MoO4 concentrations, the acidity degree remains high for longer during the reaction, preserving galvanic corrosion as a support in the corrosion process. Otherwise, by decreasing the acidity degree, MoO4−2 acts by capturing chloride ions Cl− [33], according to the reaction (29), competing with chloride ions’ migration through the oxide film, inhibiting the corrosion process.
Finally, the pH gradually increases due to the OH- ions present and the rate decreases. It should be noted that the aluminum was completely dissolved at these concentrations of HCl, which is why the curves appear to be incomplete.
Also shown, at a higher HCl molar concentration, lower temperatures are needed to achieve high hydrogen production rates.
3.3. Fitting the Model
Equation (9) was fitted to the experimental data obtained throughout the complete reaction. ρB is the density of aluminum atoms, which equals 0.1 mol/cm3. CAo is the water molecules’ concentration at a particle surface equal to 0.056 mol/cm2. The ratio of aluminum to water obtained from the reaction stoichiometry is b = 0.5. Lo is the initial half thickness of aluminum plate, which equals 0.015 cm.
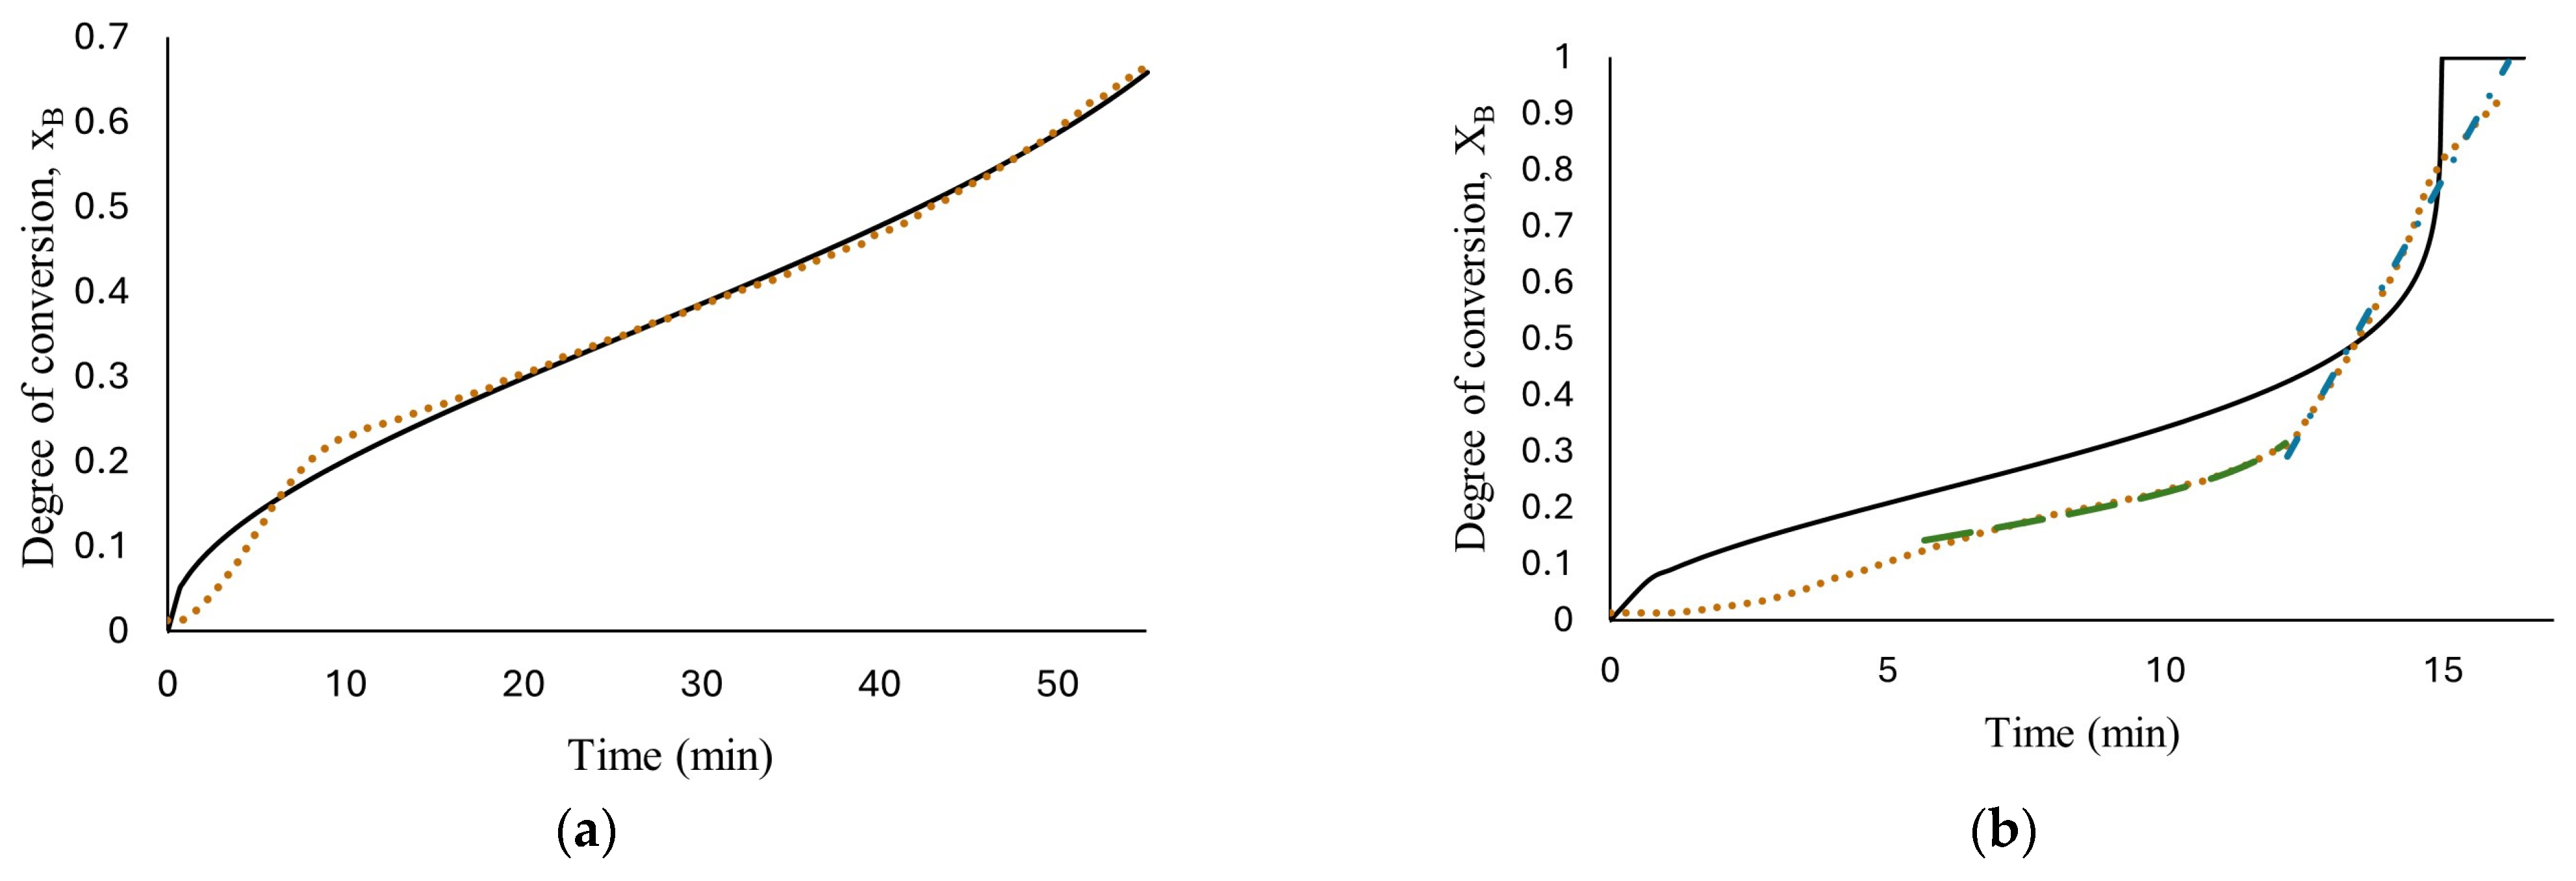
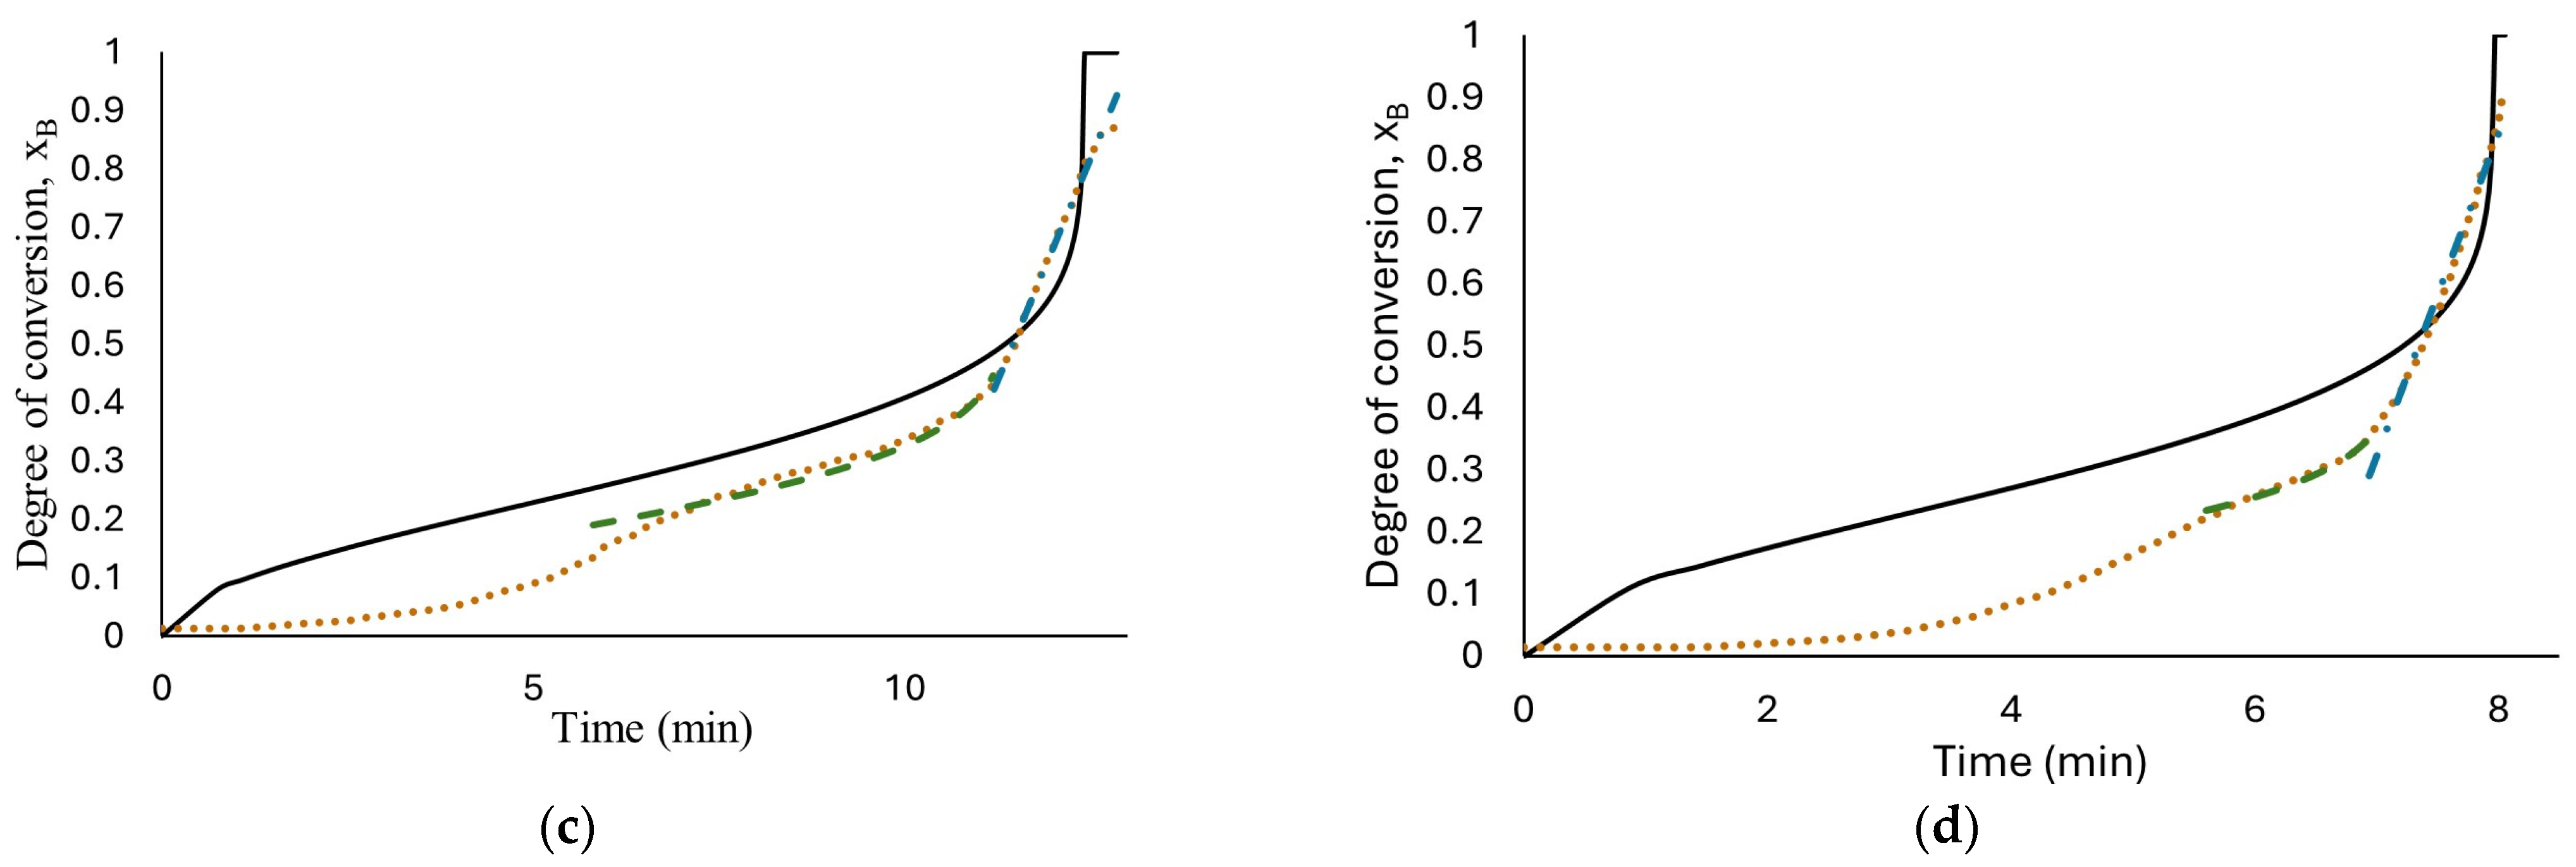
The results of fitting, for all the concentrations tested, are presented in Figure 6. As can be seen, only the reaction with 1.125 M HCl, (a), fits the experimental data with an R-square of 0.995 with a water diffusion coefficient in the hydroxide layer Do = 1.37 × 10⁻⁷ cm2/s, k = 2.49 × 10⁻⁴ s−1 and n = 2.68; these values were calculated using nonlinear regression in Polymath software version 6.1. The parameters obtained from fitting the developed model seem to be better than those obtained from low HCl concentrations in previous work (Martínez-Salazar et al. [10]), suggesting that the reaction media studied (1.125 M HCl) enhance the aluminum–water reaction.
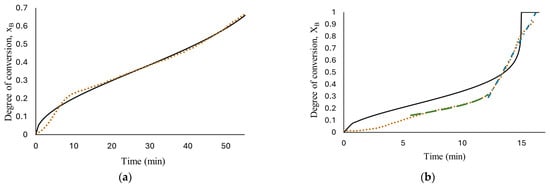
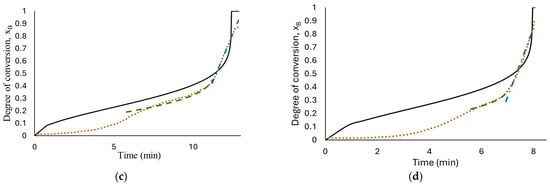
Figure 6.
Results of developed models’ fit: diffusion through AlOOH layer controls the complete reaction, Equation (16), short-time model (diffusion through AlOOH layer controls), Equation (16), long-time model (chemical reaction controls), Equation (26); the experimental data obtained from reaction of HCl solution (a) 1.125 M; (b) 1.25 M; (c) 1.5 M; (d) 1.75 M and flat plate aluminum.
At high HCl concentrations, Equation (16) is not able to illustrate the real phenomenon; this means that the diffusion of ion species/water molecules through AlOOH layer to aluminum surface is not the controlling step for the entire reaction. Confirming the description of the curves observed in Figure 5.
The above condition indicates that the hydrogen process rate cannot be represented by only one step in the control process.
According to Levenspiel [22] if none of the steps is the rate controlling mechanism, a combination of all related steps should be used for the kinetics of hydrogen production by flat plate aluminum corrosion in seawater solutions at high HCl concentrations (1.25 M to 1.75 M) in presence of Na2MoO4.
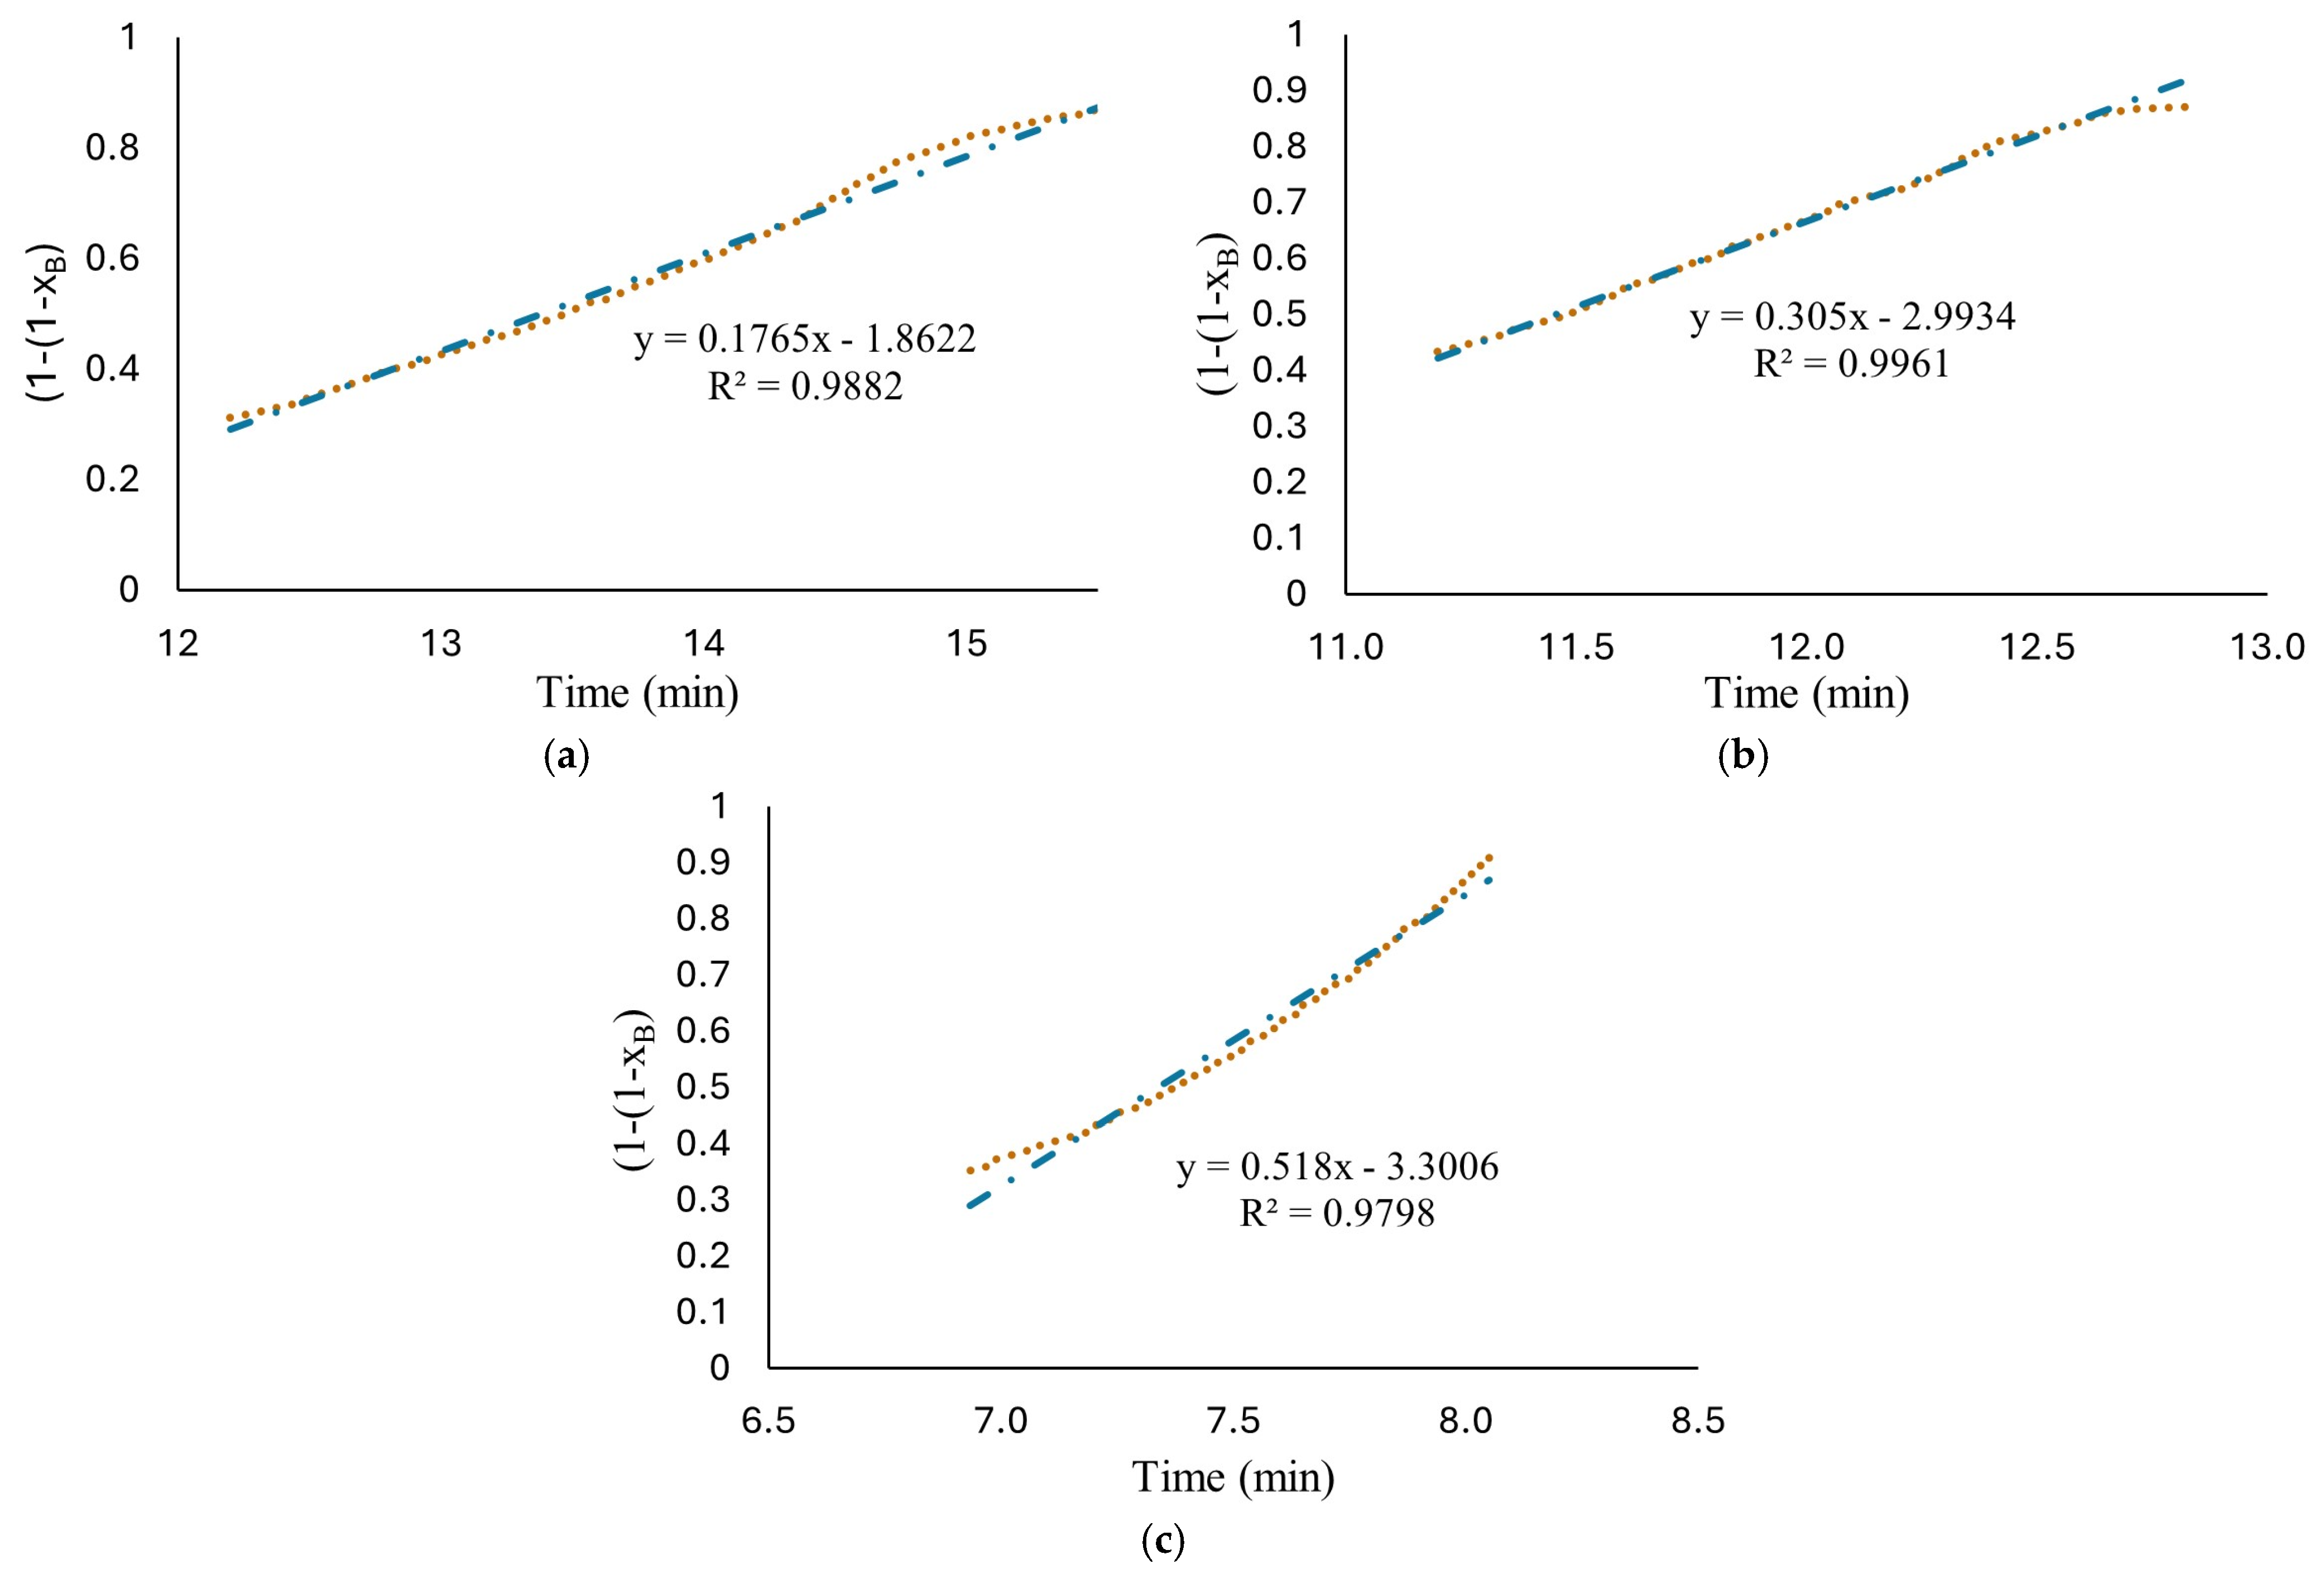
Therefore, based on the behavior observed in Figure 5, hydrogen production at high HCl concentrations (1.25 M to 1.75 M) were evaluated with two models. The short time model, Equation (16), where the diffusion of ion species/water molecules through AlOOH layer to aluminum surface controls the rate and a long time model, Equation (19), where chemical reaction on Al surface controls the rate. The results are shown in Figure 6b–d. As can be observed, the proposed mechanism fits well with the experimental data with an R-square above 0.952. The proposed shrinking core model, developed with the Levenberg–Marquardt nonlinear algorithm, can predict the parameters involved for determining conversion degree with a confidence of <1%. Induction period was excluded from the fitting in kinetics analysis for the reason that no hydrogen is generated at this period of time. Figure 7 shows Equation (16) as a linear function to obtain rate constants. The results show a high fit with an R-square around 0.98.
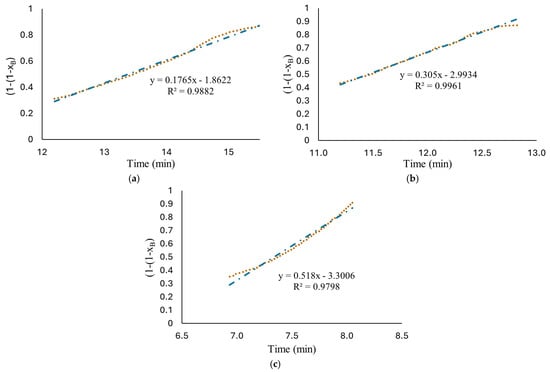
Figure 7.
Plots of versus reaction time in a linear relationship, Equation (26); the experimental data obtained from reaction of HCl solution (a) 1.25 M; (b) 1.5 M; (c) 1.75 M and flat plates aluminum with the long-time model (chemical reaction controls).
These results are similar to those reported by Gai et al. [21] and by Wang et al. [19], who studied the kinetics of aluminum reaction with water for hydrogen production, with H2 production rate curves exhibiting two peaks during the reaction. Gai et al. [21] determined the existence of two controlling stages during the reaction. The initial stage, where the rate was controlled by the Al–water chemical reaction on the aluminum surface, and the final stage, where the diffusion of H2O towards the unreacted aluminum surface controls the reaction rate due to the formation and densification of the hydroxide layer. This kinetic analysis allows us to propose a reasonable description of the reaction mechanism. However, the traditional shrinking core model proposed by Levenspiel was not modified [22], leaving many assumptions that do not represent with certainty the system studied. On the other hand, Wang et al. [19] modified the shrinking core model, taking into account effects such as the increase in particle size and the AlOOH layer’s physical variation. However, they proposed a multistage analytical model, concluding that the overall reaction rate is simultaneously controlled by the three stages, including mass transfer, diffusion and chemical reaction, limiting the proposal of a detailed reaction mechanism.
The kinetic study developed in this work combines two successes: the traditional shrinking core model was modified according to the system studied, and a combination of controlling stages without losing individuality was proposed, achieving a good fit with the experimental data, being able to describe the reaction mechanism.
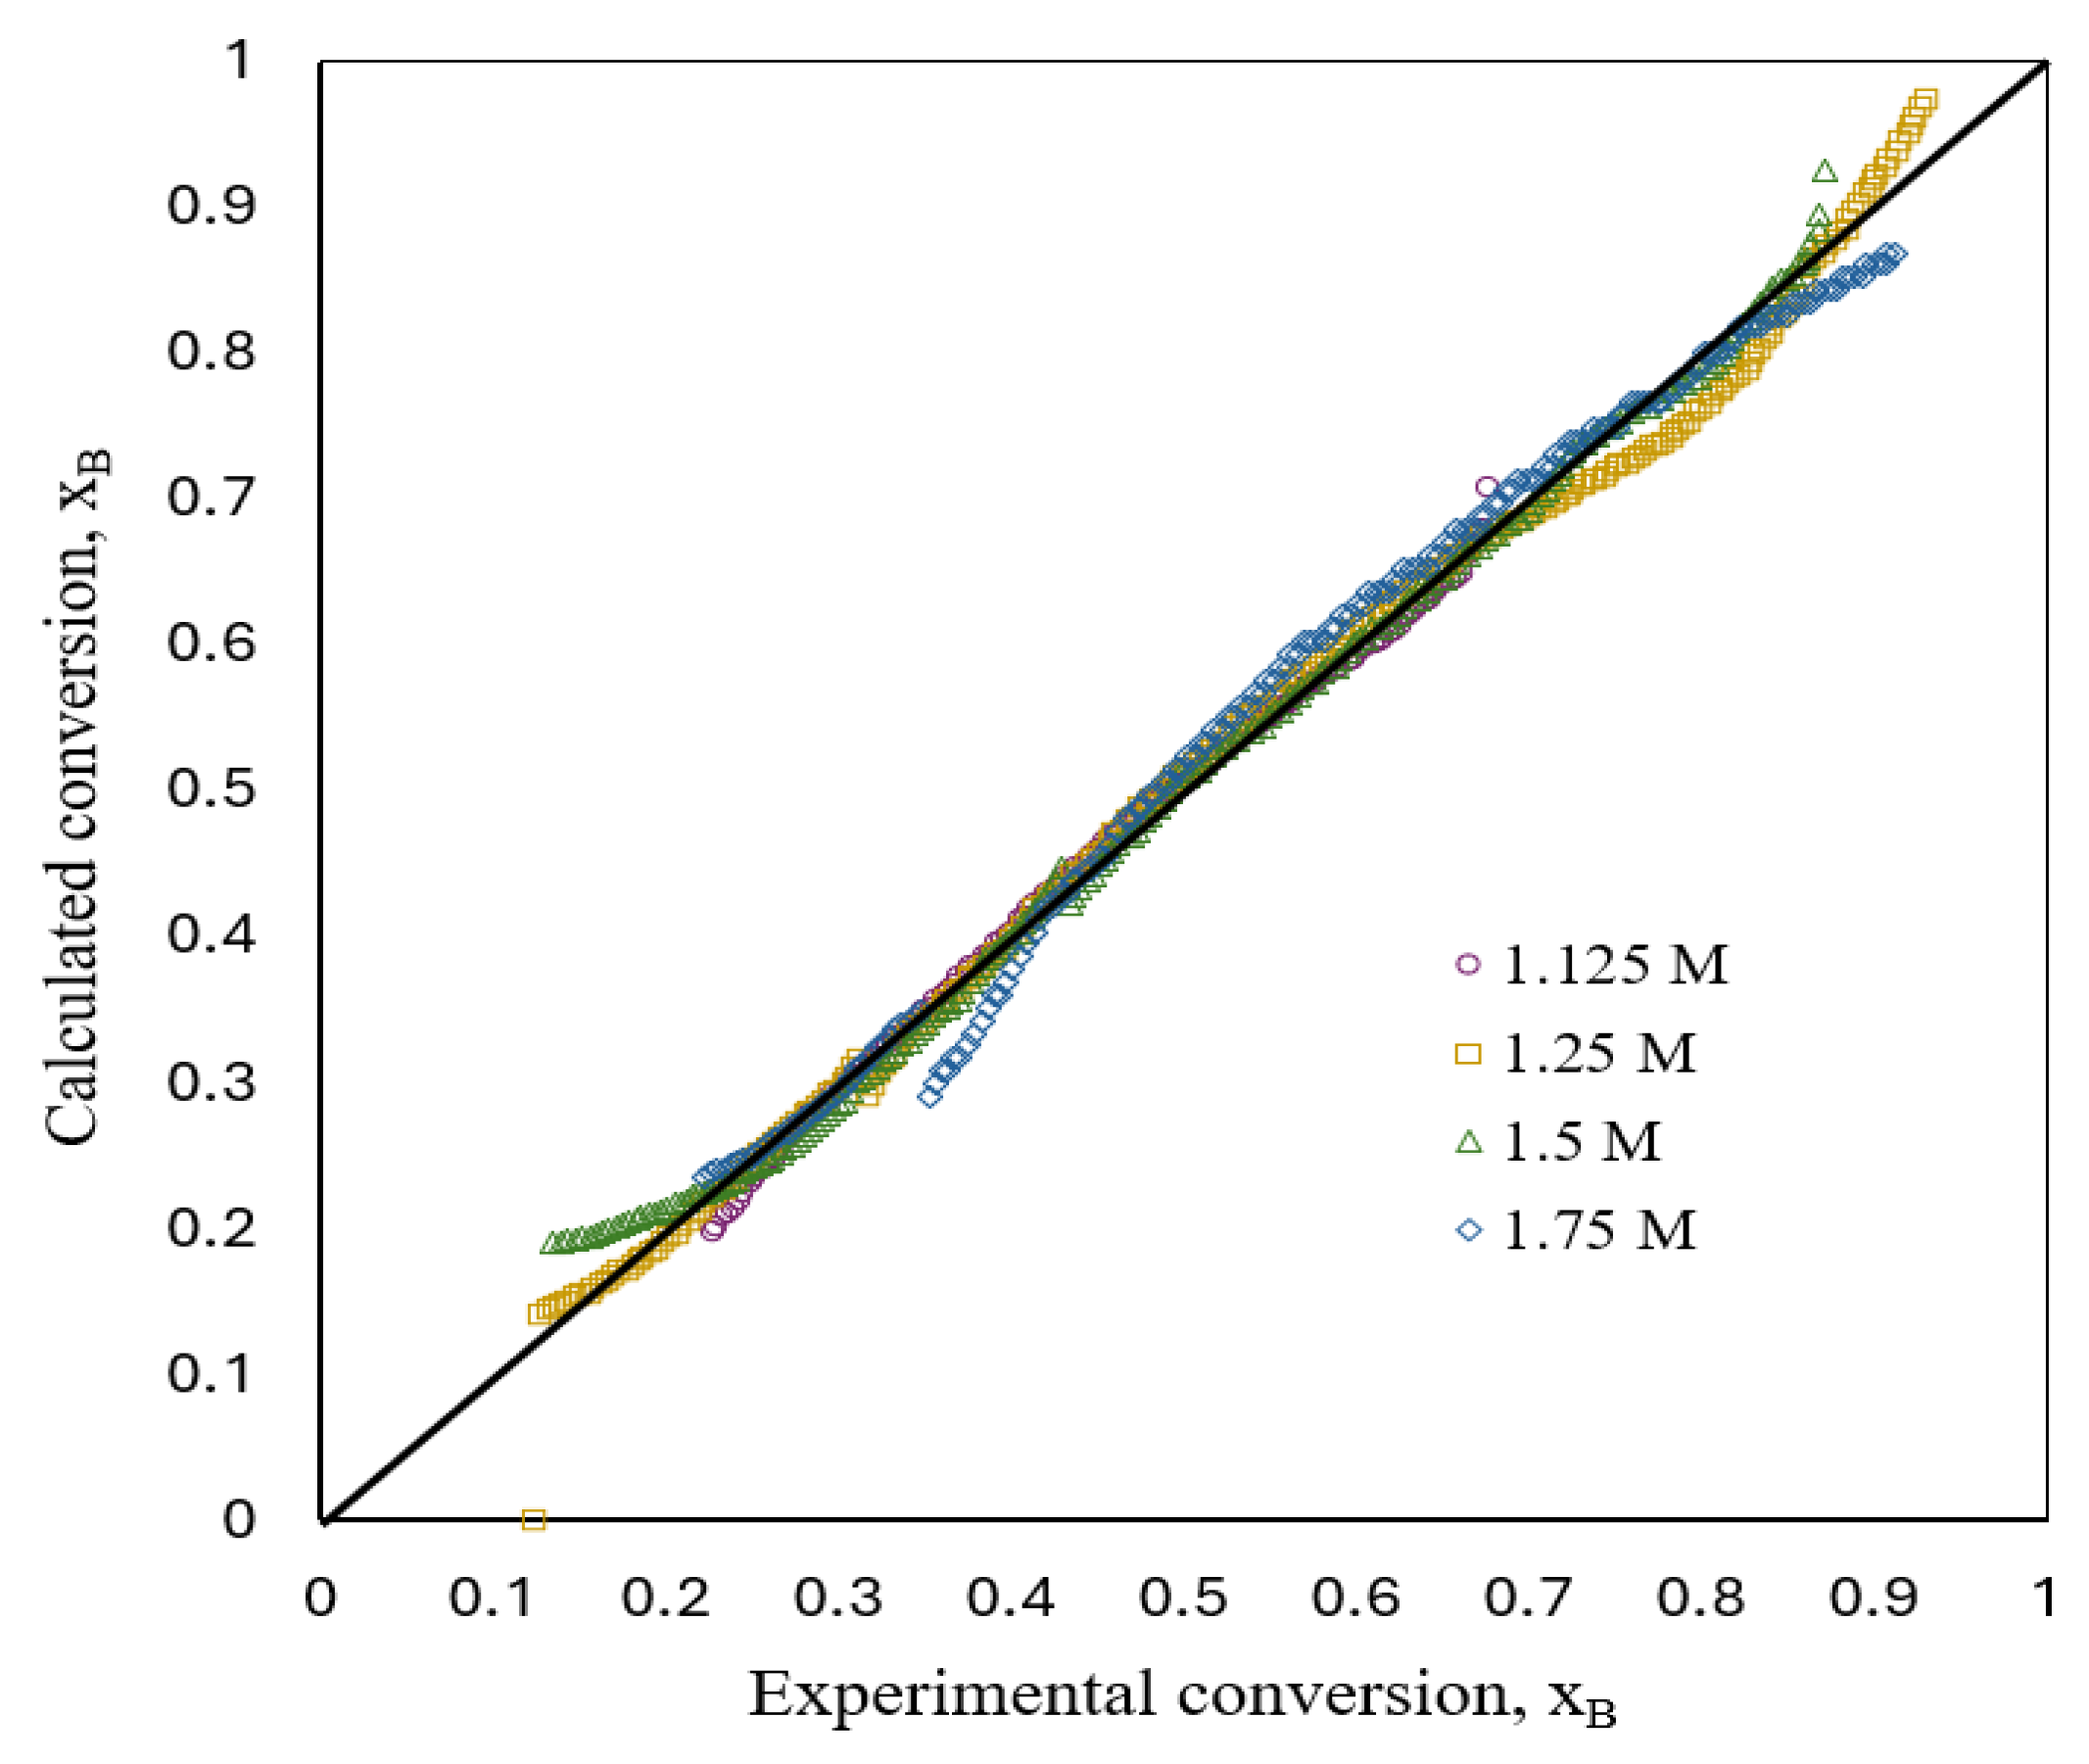
Figure 8 shows a comparison between experimental and estimated fractional conversion for a flat plate aluminum particle with respect to time during the corrosion reactions’ development in aqueous acid solutions obtained by implementing the kinetic model (Equations (16) and (26)). The deviations between both the experimental and estimated values were <5%.
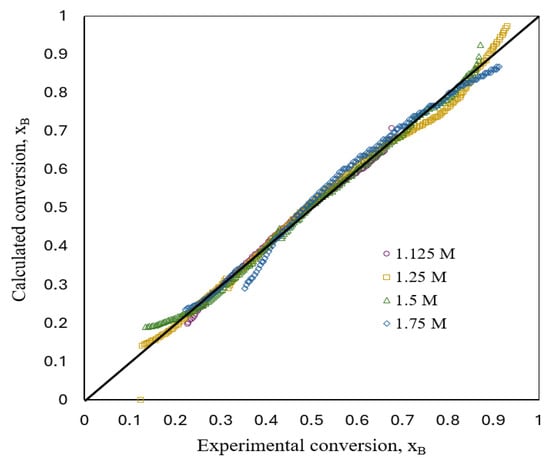
Figure 8.
Comparison between experimental and estimated conversion.
4. Conclusions
The kinetics of hydrogen production by flat plate aluminum corrosion in seawater solutions at high HCl concentrations (1.125 M to 1.75 M) in the presence of Na2MoO4 were studied.
The shrinking core model was applied to describe the kinetics. The traditional model was modified to consider the variation in the diffusion coefficient and the AlOOH layer’s evolution during the reaction. Based on experimental data, the following conclusions can be drawn.
The kinetics of hydrogen production in the studied system change depending on the amount of HCl molar concentrations.
For low HCl concentrations (0.5 M to 1.125 M) [10], a single resistance controls the reaction of the particle throughout the diffusion of ion species/water molecules through the AlOOH layer to the aluminum surface.
For high HCl concentrations (1.25 M to 1.75 M), two controlling stages were determined: the diffusion of ion species/water molecules through the AlOOH layer to the aluminum surface, followed by the chemical reaction on the Al surface. This proposal to combine control stages sequentially and not simultaneously generates the opportunity to confirm the reaction mechanism.
The diffusion coefficient of the hydroxide layer formed on the aluminum changes with time, increasing as the HCl concentration increases. The presence of high HCl concentrations and Na2MoO4 as the promoter achieves an increase in the diffusion coefficient value in the order of 10−11 cm2/s [19,23] to 10−7 cm2/s, reflected in the rise in H2 production.
Shell (hydroxide layer) thickness “n” is not the same as that of the consumed core; instead, it is larger for low HCl concentrations and smaller for high HCl concentrations.
Author Contributions
Writing—original draft, A.L.M.-S.; writing—review and editing, M.A.C.-G.; supervision, L.A.-V.; investigation, P.M.G.-V. and C.V.-O.; data curation, N.R.-V. All authors have read and agreed to the published version of the manuscript.
Funding
We gratefully acknowledge the financial support of this work by Tecnológico Nacional de México; research project 6057.17-P.
Data Availability Statement
The original contributions presented in this study are included in this article. Further inquiries can be directed to the corresponding author.
Conflicts of Interest
The authors declare no conflicts of interest.
References
- Hammi, Z.; Labjar, N.; Dalimi, M.; El Hamdouni, Y.; El Hajjaji, S. Green hydrogen: A holistic review covering life cycle assessment, environmental impacts, and color analysis. Int. J. Hydrogen Energy 2024, 80, 1030–1045. [Google Scholar] [CrossRef]
- Ajanovic, A.; Sayer, M.; Haas, R. The economics and the environmental benignity of different colors of hydrogen. Int. J. Hydrogen Energy 2022, 47, 24136–24154. [Google Scholar] [CrossRef]
- Albahnasawi, A.; Eyvaz, M. Introductory Chapter: Hydrogen Energy. In Clean Energy Technologies-Hydrogen and Gasification Processes; IntechOpen: London, UK, 2022. [Google Scholar] [CrossRef]
- De Blasio, N. The Colors of Hydrogen. Energy 2024, 7, 1. [Google Scholar]
- Dawood, F.; Anda, M.; Shafiullah, G.M. Hydrogen production for energy: An overview. Int. J. Hydrogen Energy 2020, 45, 3847–3869. [Google Scholar] [CrossRef]
- Macanás, J.; Soler, L.; Candela, A.M.; Muñoz, M.; Casado, J. Hydrogen generation by aluminum corrosion in aqueous alkaline solutions of inorganic promoters: The AlHidrox process. Energy 2011, 36, 2493–2501. [Google Scholar] [CrossRef]
- Chai, Y.J.; Dong, Y.M.; Meng, H.X.; Jia, Y.Y.; Shen, J.; Huang, Y.M.; Wang, N. Hydrogen generation by aluminum corrosion in cobalt (II) chloride and nickel (II) chloride aqueous solution. Energy 2014, 68, 204–209. [Google Scholar] [CrossRef]
- Coronel-García, M.A.; Salazar-Barrera, J.G.; Malpica-Maldonado, J.J.; Martínez-Salazar, A.L.; Melo-Banda, J.A. Hydrogen production by aluminum corrosion in aqueous hydrochloric acid solution promoted by sodium molybdate dihydrate. Int. J. Hydrogen Energy 2020, 45, 13693–13701. [Google Scholar] [CrossRef]
- Shmelev, V.; Nikolaev, V.; Lee, J.H.; Yim, C. Hydrogen production by reaction of aluminum with water. Int. J. Hydrogen Energy 2016, 41, 16664–16673. [Google Scholar] [CrossRef]
- Martínez-Salazar, A.L.; Melo-Banda, J.A.; Coronel-García, M.A.; González-Barbosa, J.J.; Domínguez-Esquivel, J.M. Hydrogen generation by aluminum alloy corrosion in aqueous acid solutions promoted by nanometal: Kinetics study. Renew. Energy 2020, 146, 2517–2523. [Google Scholar] [CrossRef]
- Deng, Z.Y.; Ferreira, J.M.; Tanaka, Y.; Ye, J. Physicochemical mechanism for the continuous reaction of γ-Al2O3-modified aluminum powder with water. J. Am. Ceram. Soc. 2007, 90, 1521–1526. [Google Scholar] [CrossRef]
- Bunker, B.C.; Nelson, G.C.; Zavadil, K.R.; Barbour, J.C.; Wall, F.D.; Sullivan, J.P.; Windisch, C.F.; Engelhardt, M.H.; Baer, D.R. Hydration of passive oxide films on aluminum. J. Phys. Chem. B 2002, 106, 4705–4713. [Google Scholar] [CrossRef]
- Deng, Z.Y.; Liu, Y.F.; Tanaka, Y.; Ye, J.; Sakka, Y. Modification of Al particle surfaces by γ-Al2O3 and its effect on the corrosion behavior of Al. J. Am. Ceram. Soc. 2005, 88, 977–979. [Google Scholar] [CrossRef]
- Alwitt, R.S. The growth of hydrous oxide films on aluminum. J. Electrochem. Soc. 1974, 121, 1322–1328. [Google Scholar] [CrossRef]
- Branzoi, V.; Golgovici, F.; Branzoi, F. Aluminium corrosion in hydrochloric acid solutions and the effect of some organic inhibitors. Mater. Chem. Phys. 2003, 78, 122–131. [Google Scholar] [CrossRef]
- Altun, H.; Sen, S. Studies on the influence of chloride ion concentration and pH on the corrosion and electrochemical behaviour of AZ63 magnesium alloy. Mater. Des. 2004, 25, 637–643. [Google Scholar] [CrossRef]
- Li, X.; Deng, S.; Fu, H. Sodium molybdate as a corrosion inhibitor for aluminium in H3PO4 solution. Corros. Sci. 2011, 53, 2748–2753. [Google Scholar] [CrossRef]
- Shams El Din, A.M.; Wang, L. Mechanism of corrosion inhibition by sodium molybdate. Desalination 1996, 107, 29–43. [Google Scholar] [CrossRef]
- Wang, X.; Li, G.; Eckhoff, R.K. Kinetics study of hydration reaction between aluminum powder and water based on an improved multi-stage shrinking core model. Int. J. Hydrogen. Energy 2021, 46, 33635–33655. [Google Scholar] [CrossRef]
- Radwan, H.M. Shrinking Core Model and Experimental Study of the Hydrolysis Reaction in the Cu-Cl cycle for Hydrogen Production. Ph.D. Thesis, Memorial University of Newfoundland, St. John’s, NL, Canada, 2024. [Google Scholar]
- Gai, W.Z.; Liu, W.H.; Deng, Z.Y.; Zhou, J.G. Reaction of Al powder with water for hydrogen generation under ambient condition. Int. J. Hydrogen Energy 2012, 37, 13132–13140. [Google Scholar] [CrossRef]
- Levenspiel, O. Chemical Reaction Engineering, 3rd ed.; John Wiley & Sons: Hoboken, NJ, USA, 1998. [Google Scholar]
- Razavi-Tousi, S.S.; Szpunar, J.A. Modification of the shrinking core model for hydrogen generation by reaction of aluminum particles with water. Int. J. Hydrogen Energy 2016, 41, 87–93. [Google Scholar] [CrossRef]
- De la Lanza Espino, G. Características Físico-Químicas de los Mares en México, 1st ed.; Plaza y Valdés: Mexico City, Mexico, 2001. [Google Scholar]
- Panzarini, R.N. Introducción a la Oceanografía General, 2nd ed.; Eudeba: Buenos Aires, Argentina, 1970. [Google Scholar]
- Khanna, P.K.; Gaikwad, S.; Adhyapak, P.V.; Singh, N.; Marimuthu, R. Synthesis and characterization of copper nanoparticles. Mater. Lett. 2007, 61, 4711–4714. [Google Scholar] [CrossRef]
- Himmelblau, D.M.; Riggs, J.B. Basic Principles and Calculations in Chemical Engineering, 8th ed.; Prentice Hall: Hoboken, NJ, USA, 2012. [Google Scholar]
- Nakagaki, S.; Bail, A.; dos Santos, V.C.; de Souza, V.H.R.; Vrubel, H.; Nunes, F.S.; Ramos, L.P. Use of anhydrous sodium molybdate as an efficient heterogeneous catalyst for soybean oil methanolysis. Appl. Catal. A Gen. 2008, 351, 267–274. [Google Scholar] [CrossRef]
- Mitchell, P.C.H. Speciation of Molybdenum Compounds in Water. In Ultraviolet Spectra and REACH Read across Report for the International Molybdenum Association; REACH Molybdenum Consorti: Schmallenberg, Germany, 2009. [Google Scholar]
- Williams, P.A. Encyclopedia of Geology. In Minerals|Molybdates; Elsevier: Amsterdam, The Netherlands, 2005. [Google Scholar] [CrossRef]
- Srinivasan, B.R. Does an all-sulphur analogue of heptamolybdate exist? J. Chem. Sci. 2004, 116, 251–259. [Google Scholar] [CrossRef]
- Milazzo, G.; Caroli, S.; Braun, R.D. Tables of standard electrode potentials. J. Electrochem. Soc. 1978, 125, 261C. [Google Scholar] [CrossRef]
- Devasenapathi, A.; Raja, V.S. Effect of externally added molybdate on repassivation and stress corrosion cracking of type 304 stainless steel in hydrochloric acid. Corrosion 1996, 52, 243–249. [Google Scholar] [CrossRef]

Disclaimer/Publisher’s Note: The statements, opinions and data contained in all publications are solely those of the individual author(s) and contributor(s) and not of MDPI and/or the editor(s). MDPI and/or the editor(s) disclaim responsibility for any injury to people or property resulting from any ideas, methods, instructions or products referred to in the content. |
© 2025 by the authors. Licensee MDPI, Basel, Switzerland. This article is an open access article distributed under the terms and conditions of the Creative Commons Attribution (CC BY) license (https://creativecommons.org/licenses/by/4.0/).