


Toxic Anionic Azo Dye Removal from Artificial Wastewater by Using Polyaniline/Clay Nanocomposite Adsorbent: Isotherm, Kinetics and Thermodynamic Study

 ,
,  , , ,
, , ,  and
and
Abstract
1. Introduction
2. Materials and Methods
3. Results and Discussion
3.1. Characterization
3.1.1. BET Analysis
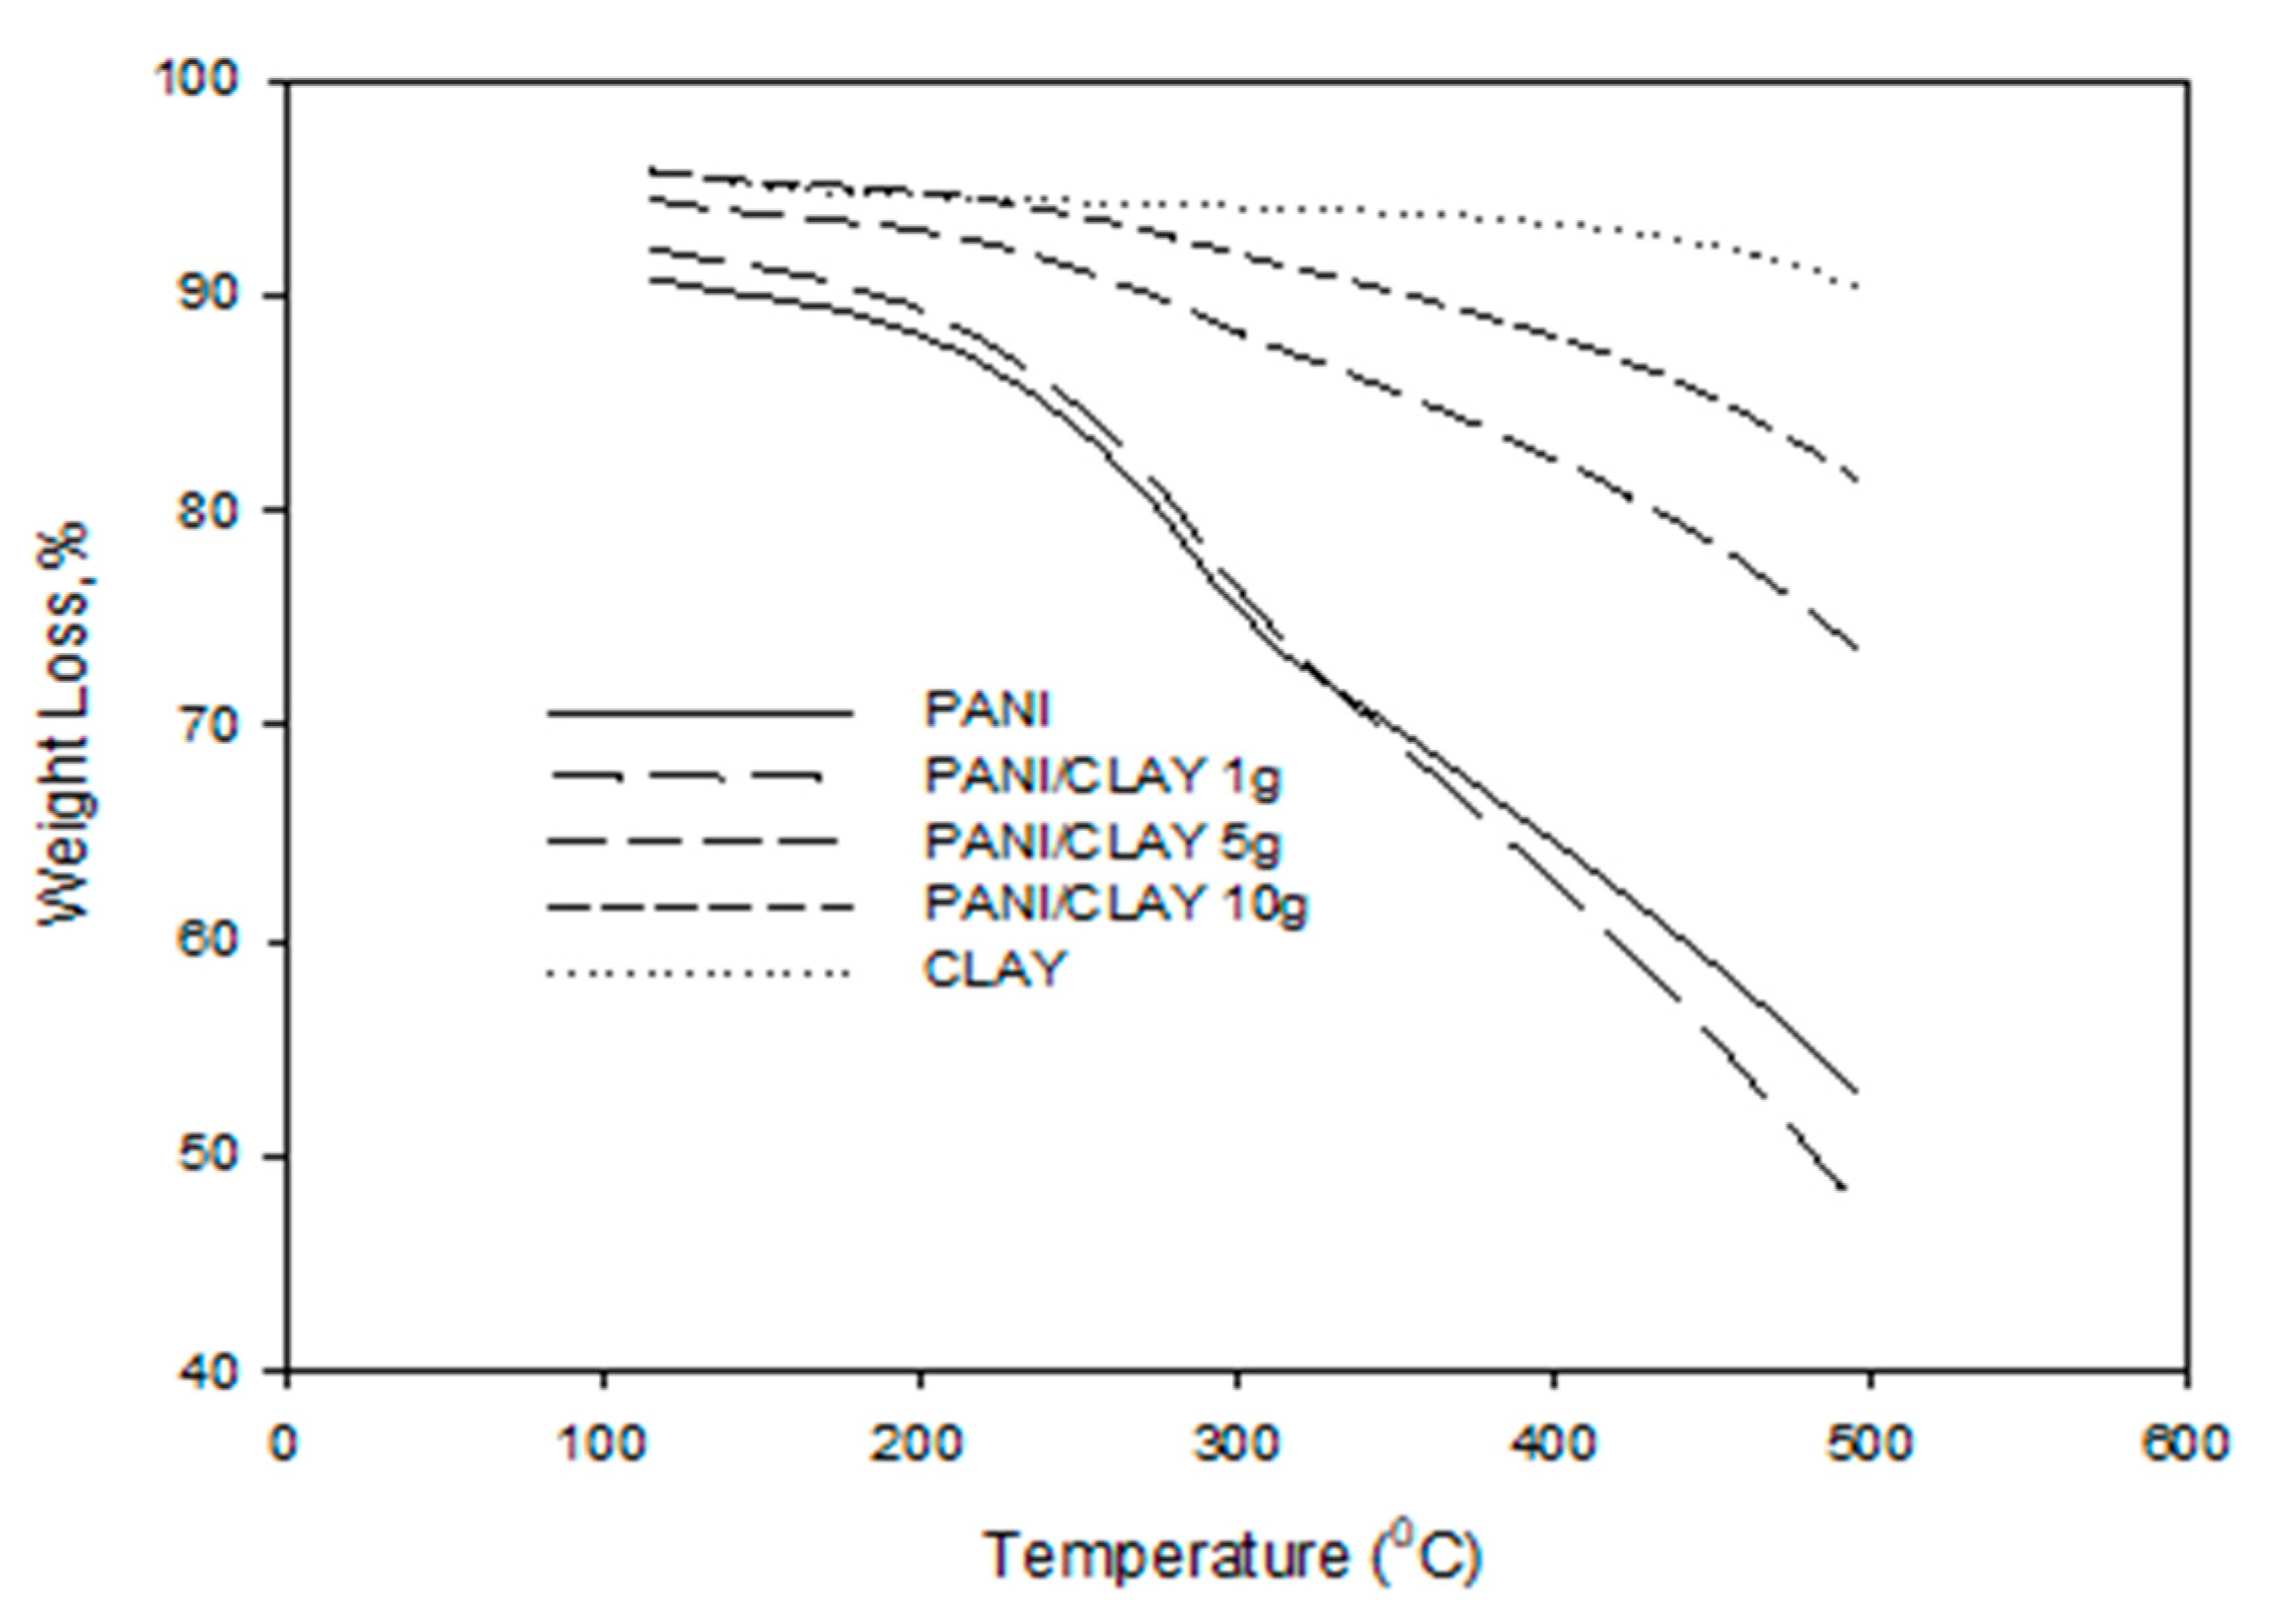
3.1.2. Thermogravimetric Analysis (TGA)
3.1.3. IR Analysis
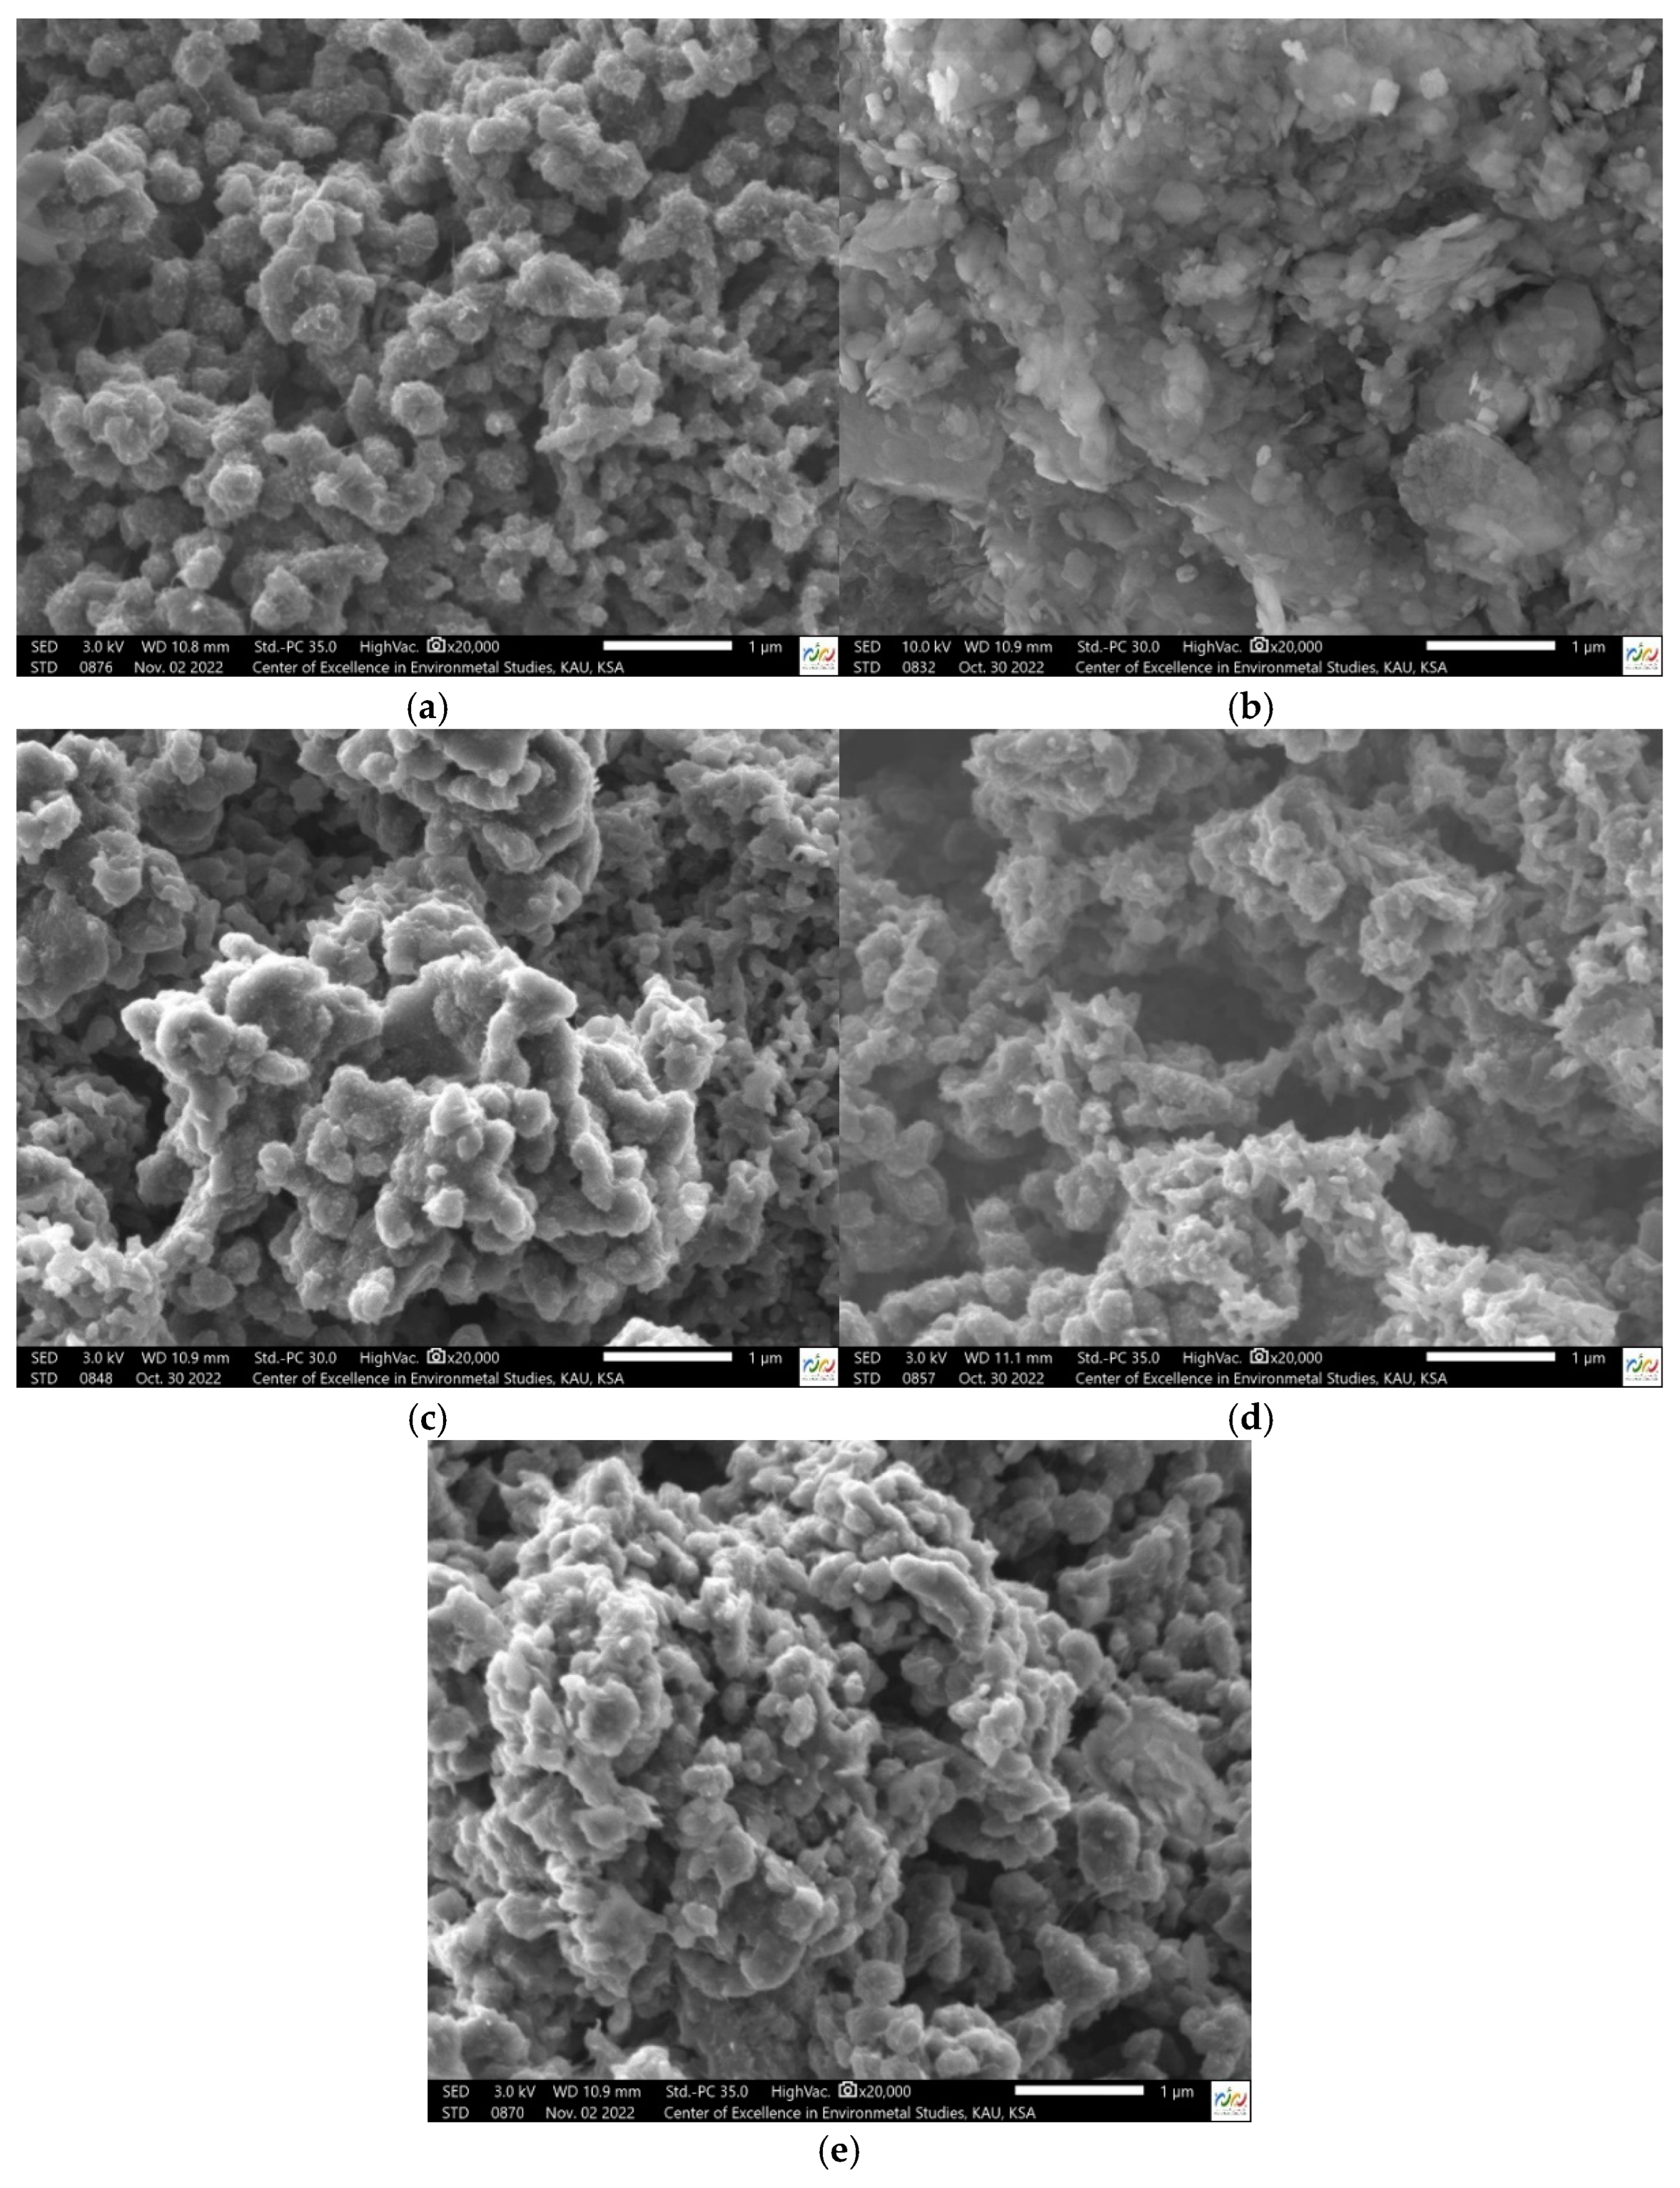
3.1.4. SEM Analysis
3.2. Adsorption Experiments
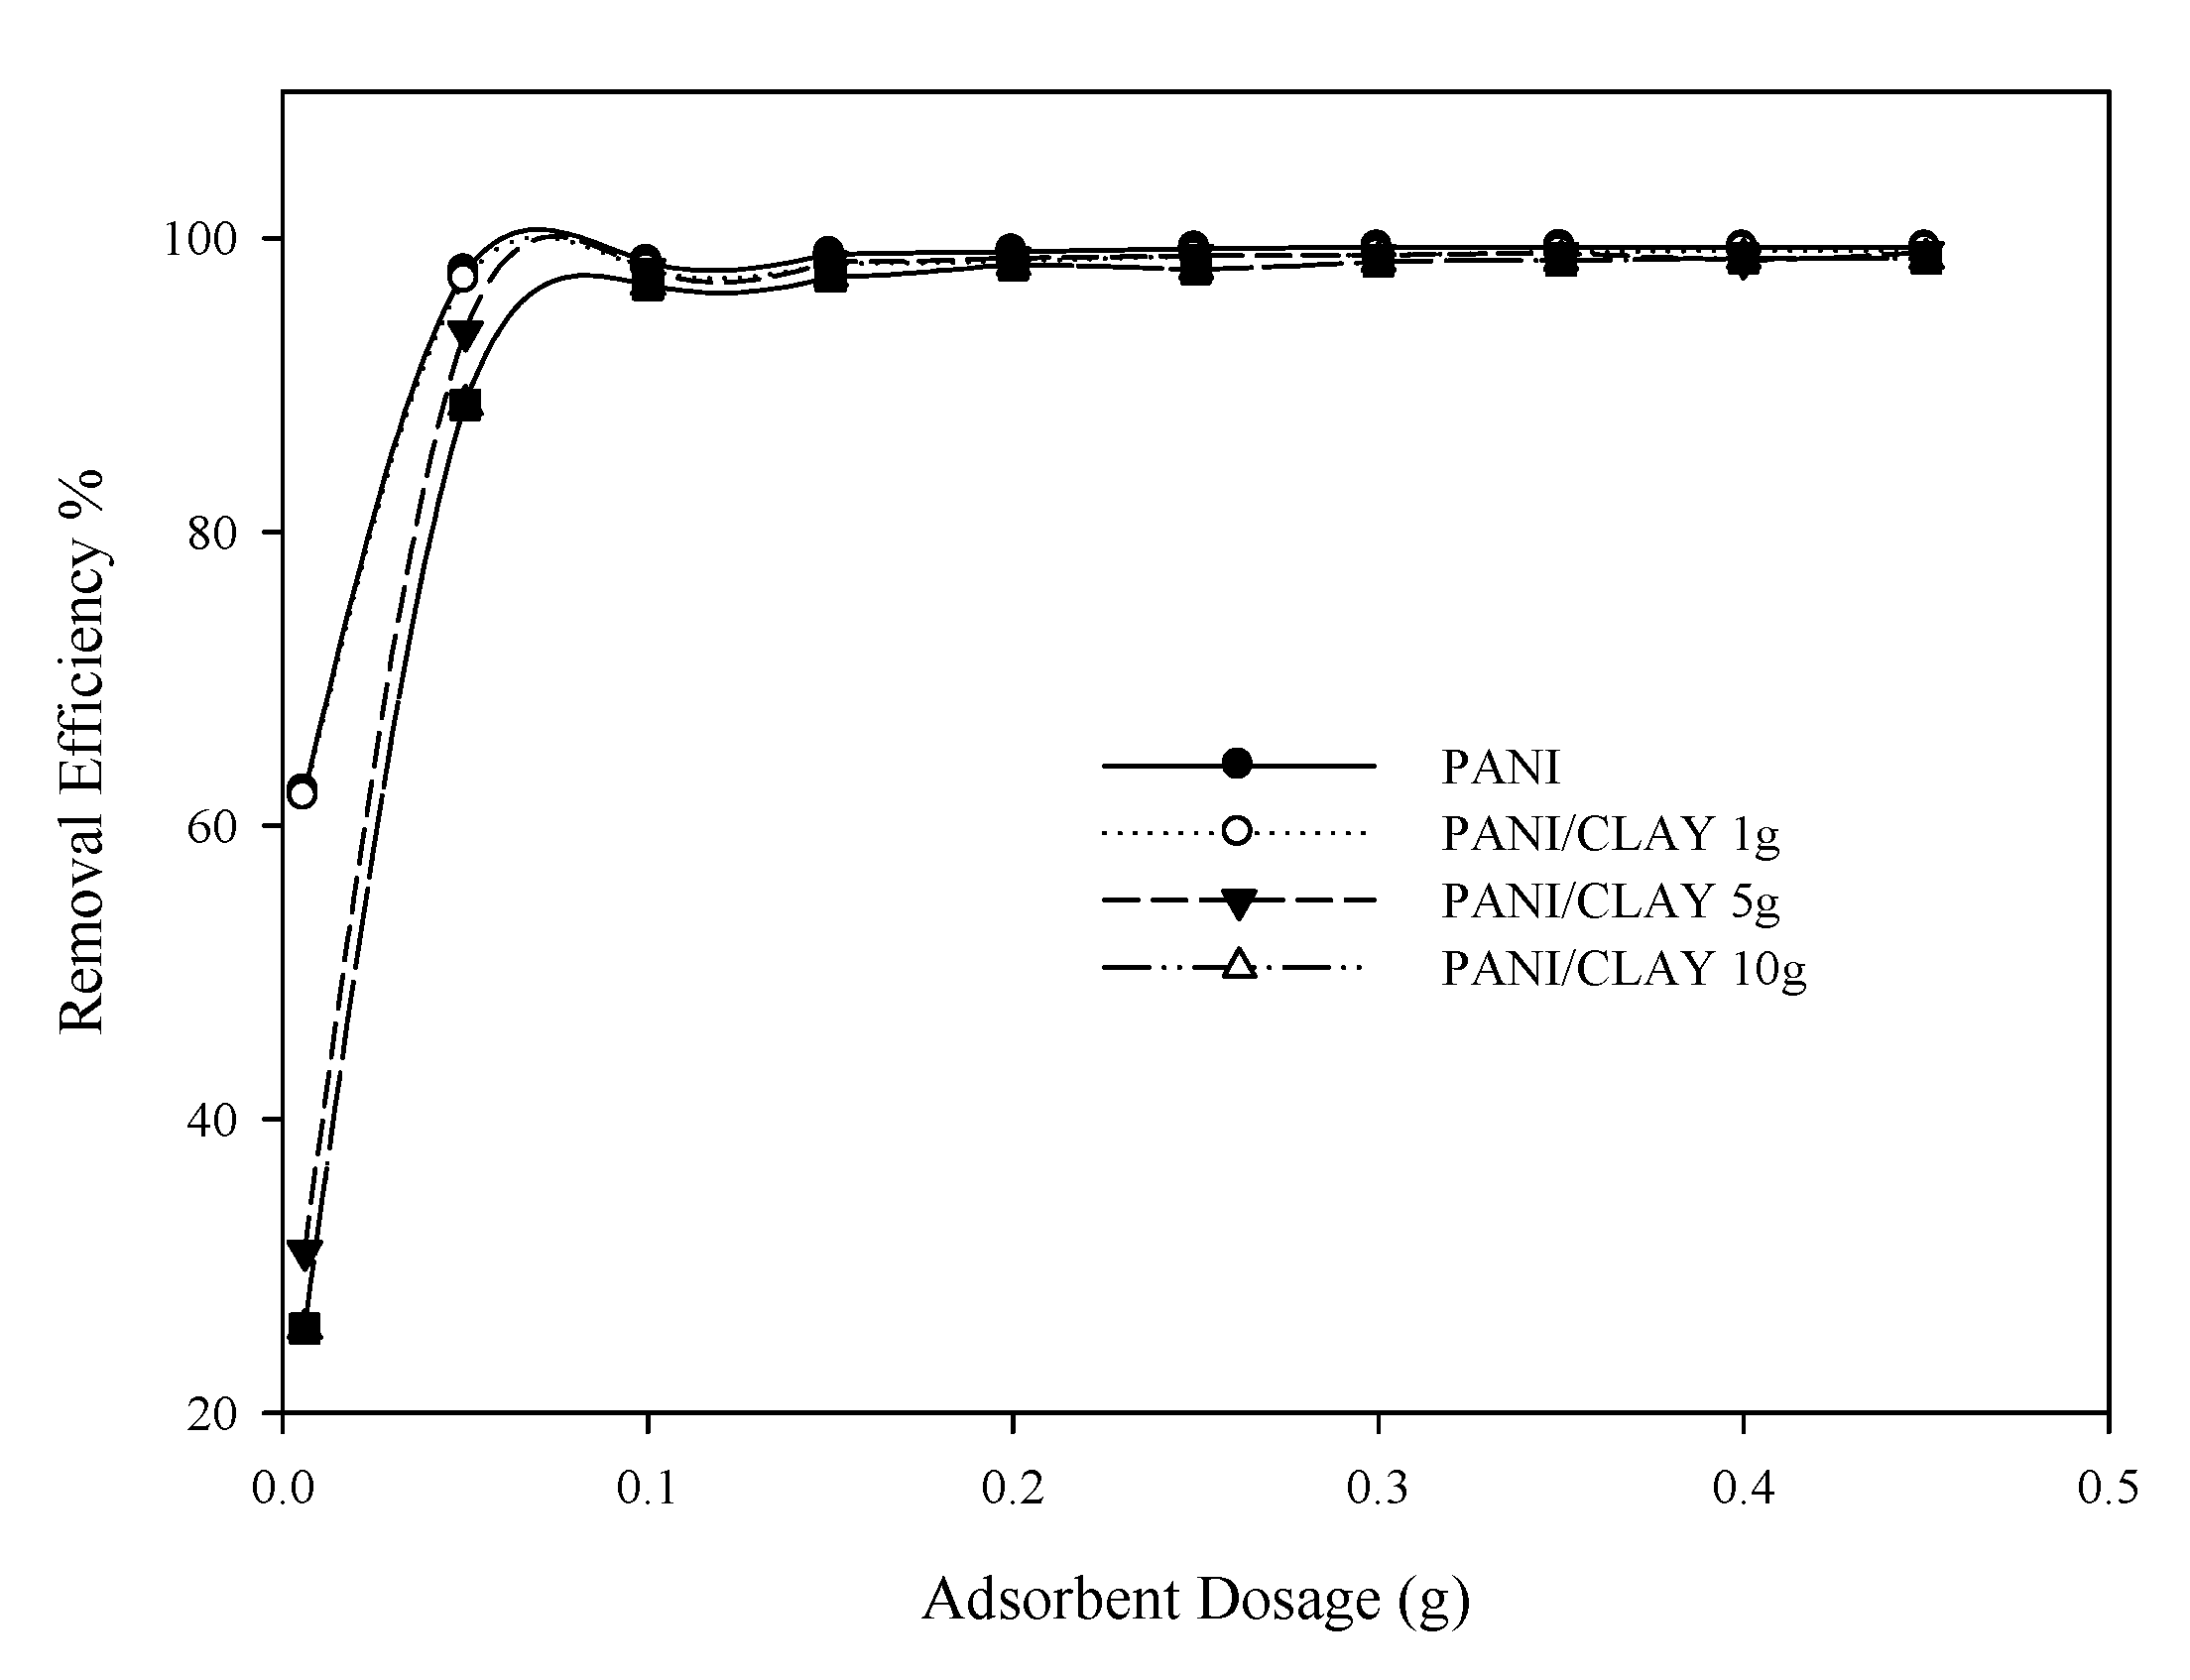
3.2.1. Effect of Adsorbent Dosage
3.2.2. Effect of pH
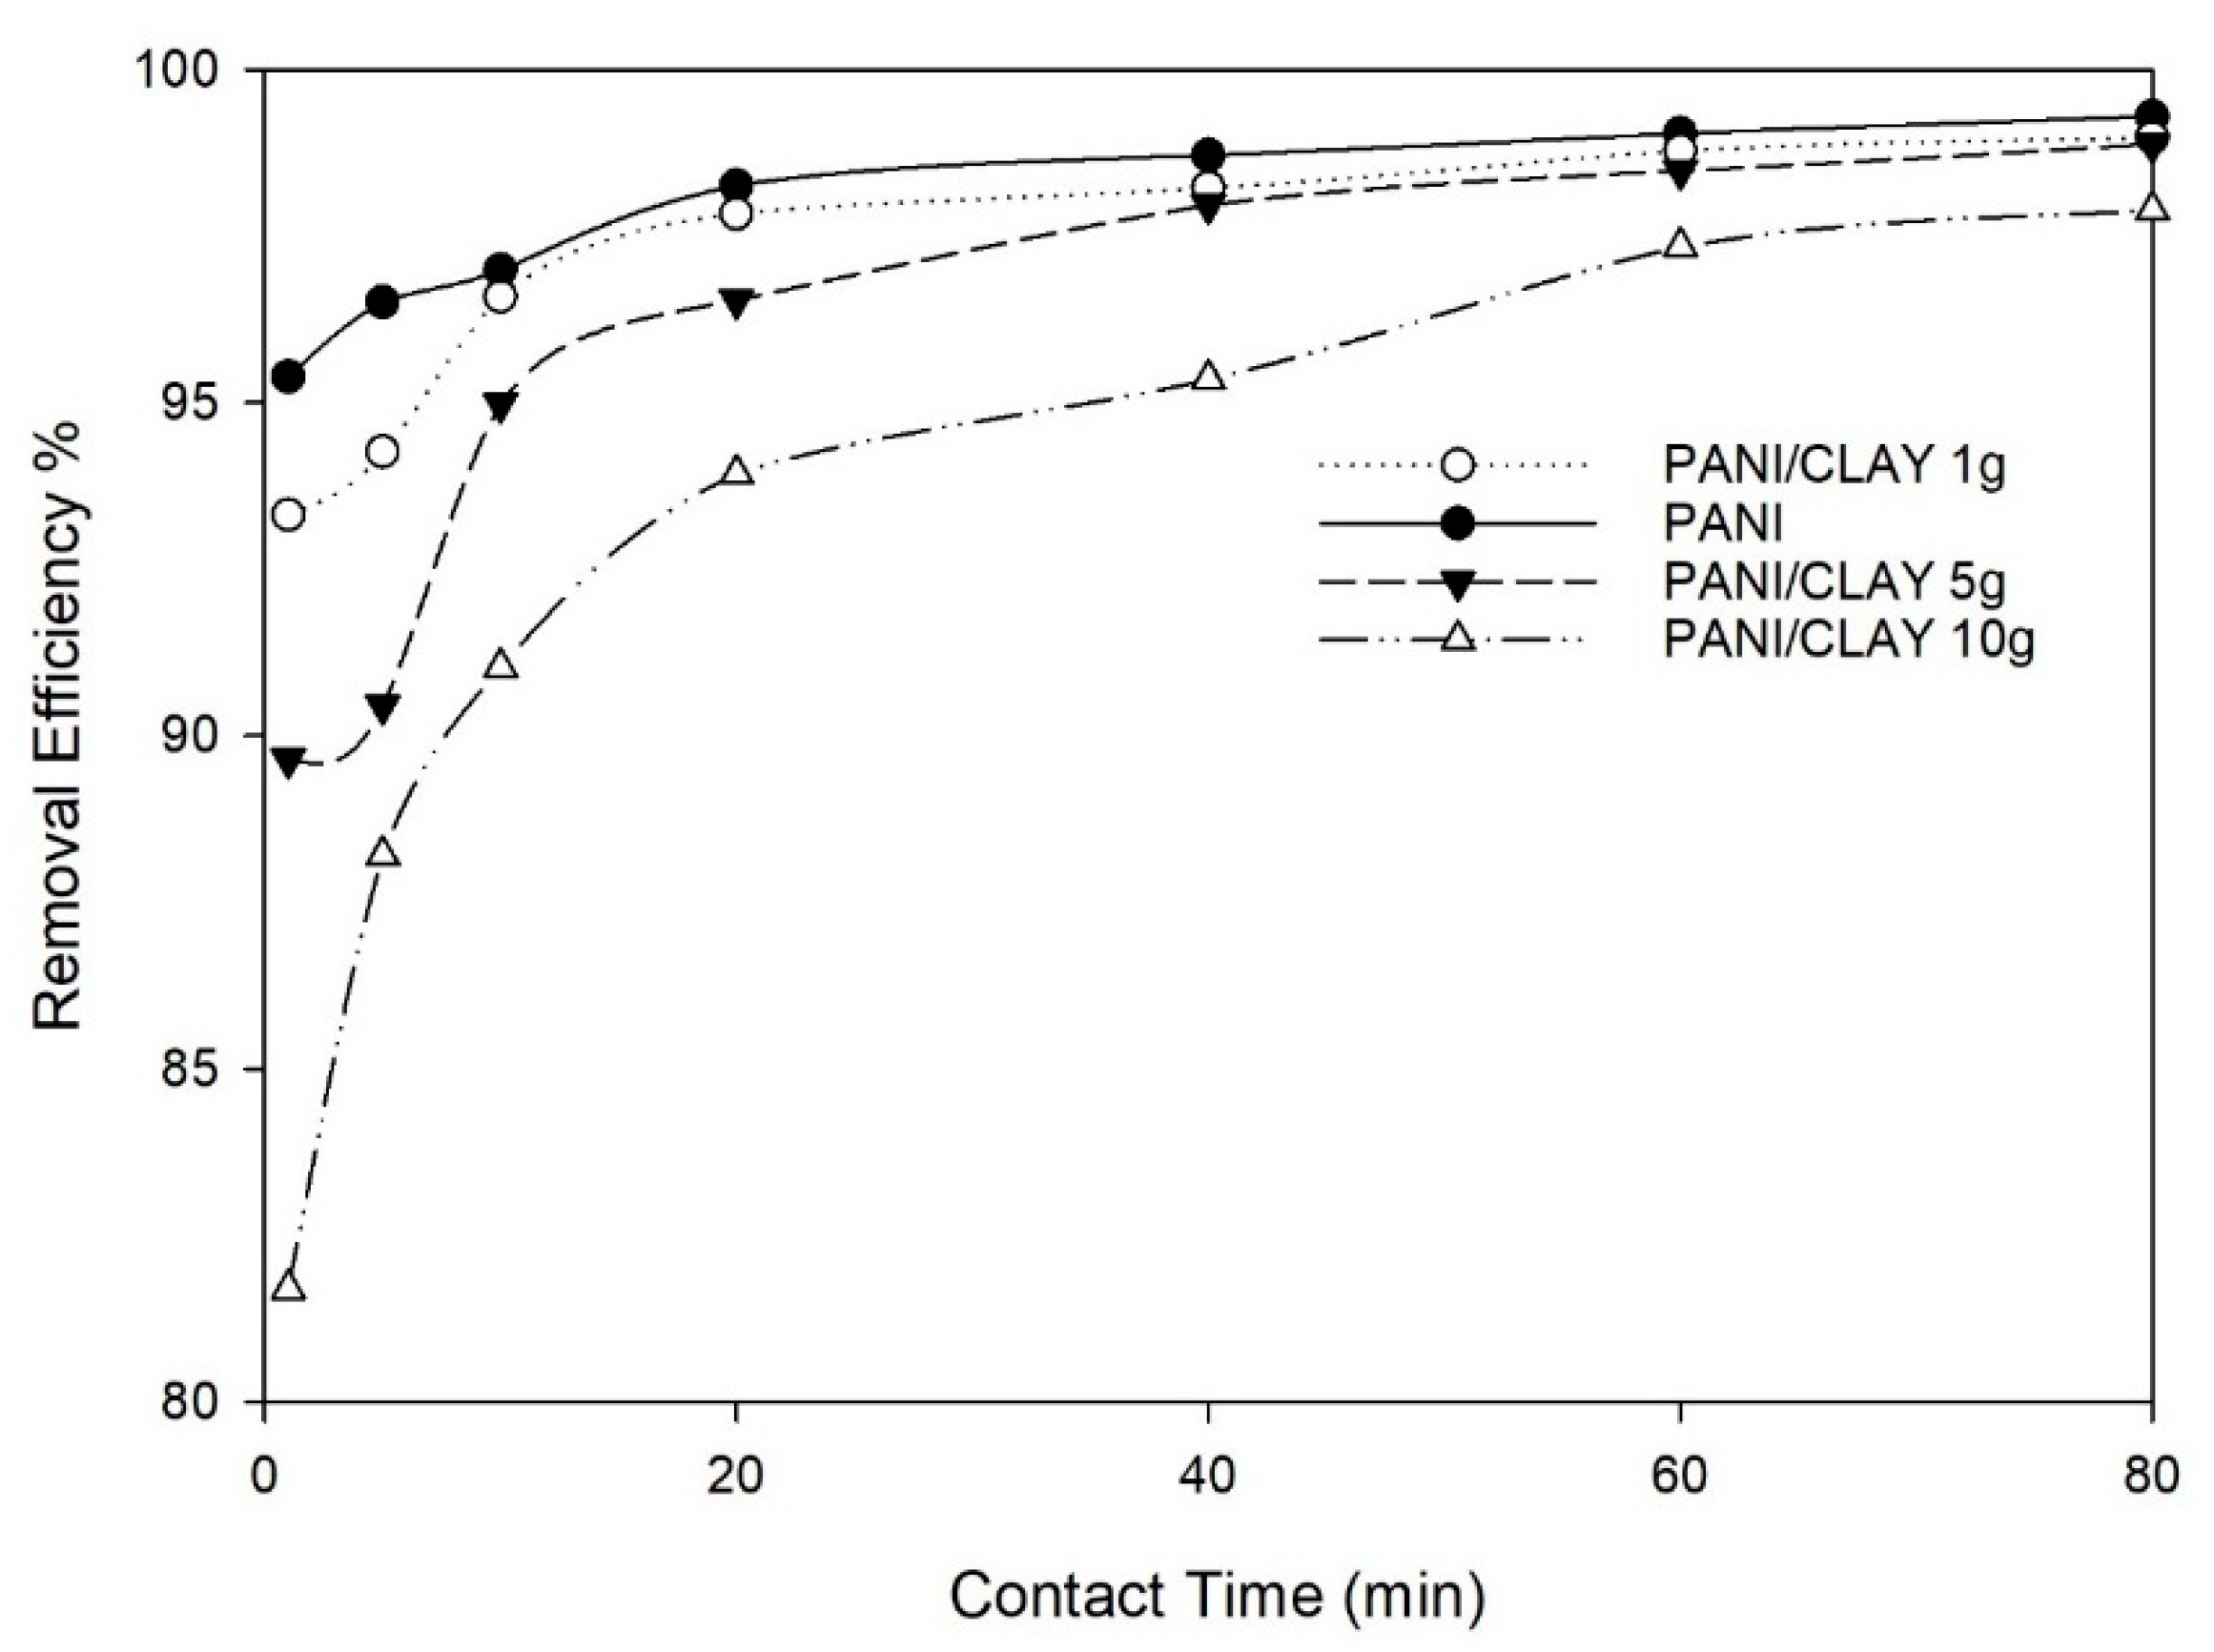
3.2.3. Effect of Contact Time
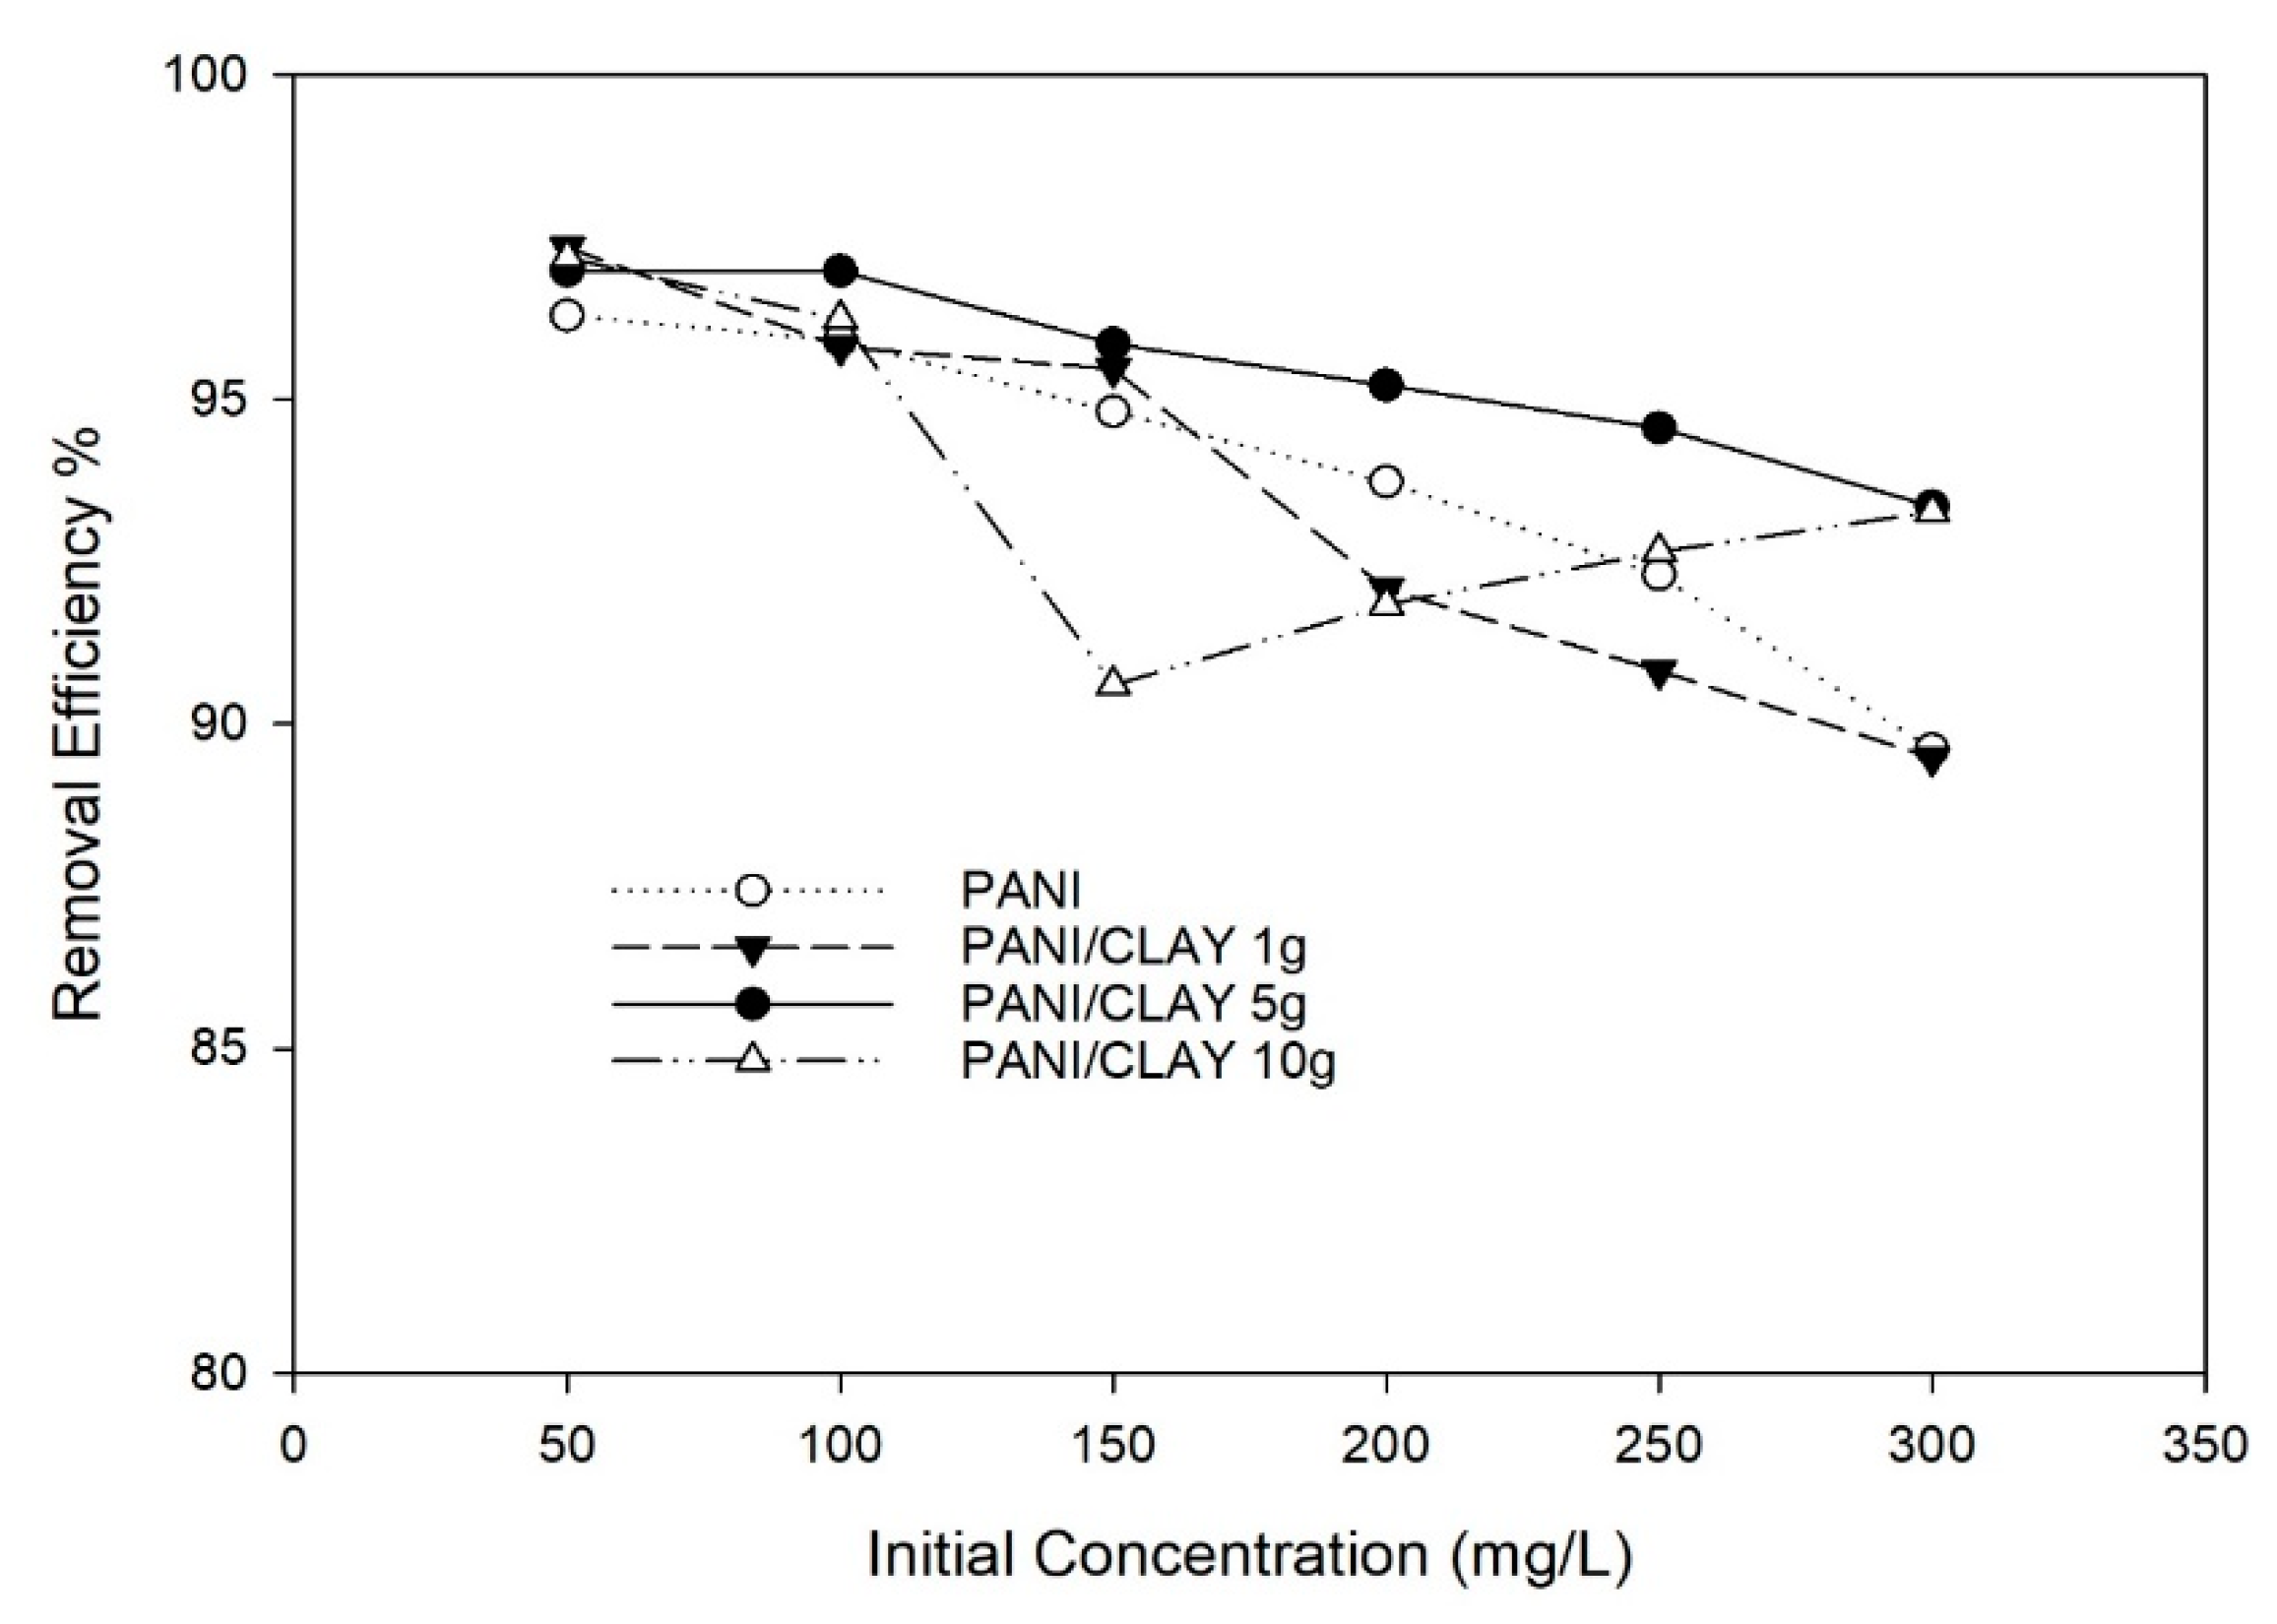
3.2.4. Effect of Initial Concentration
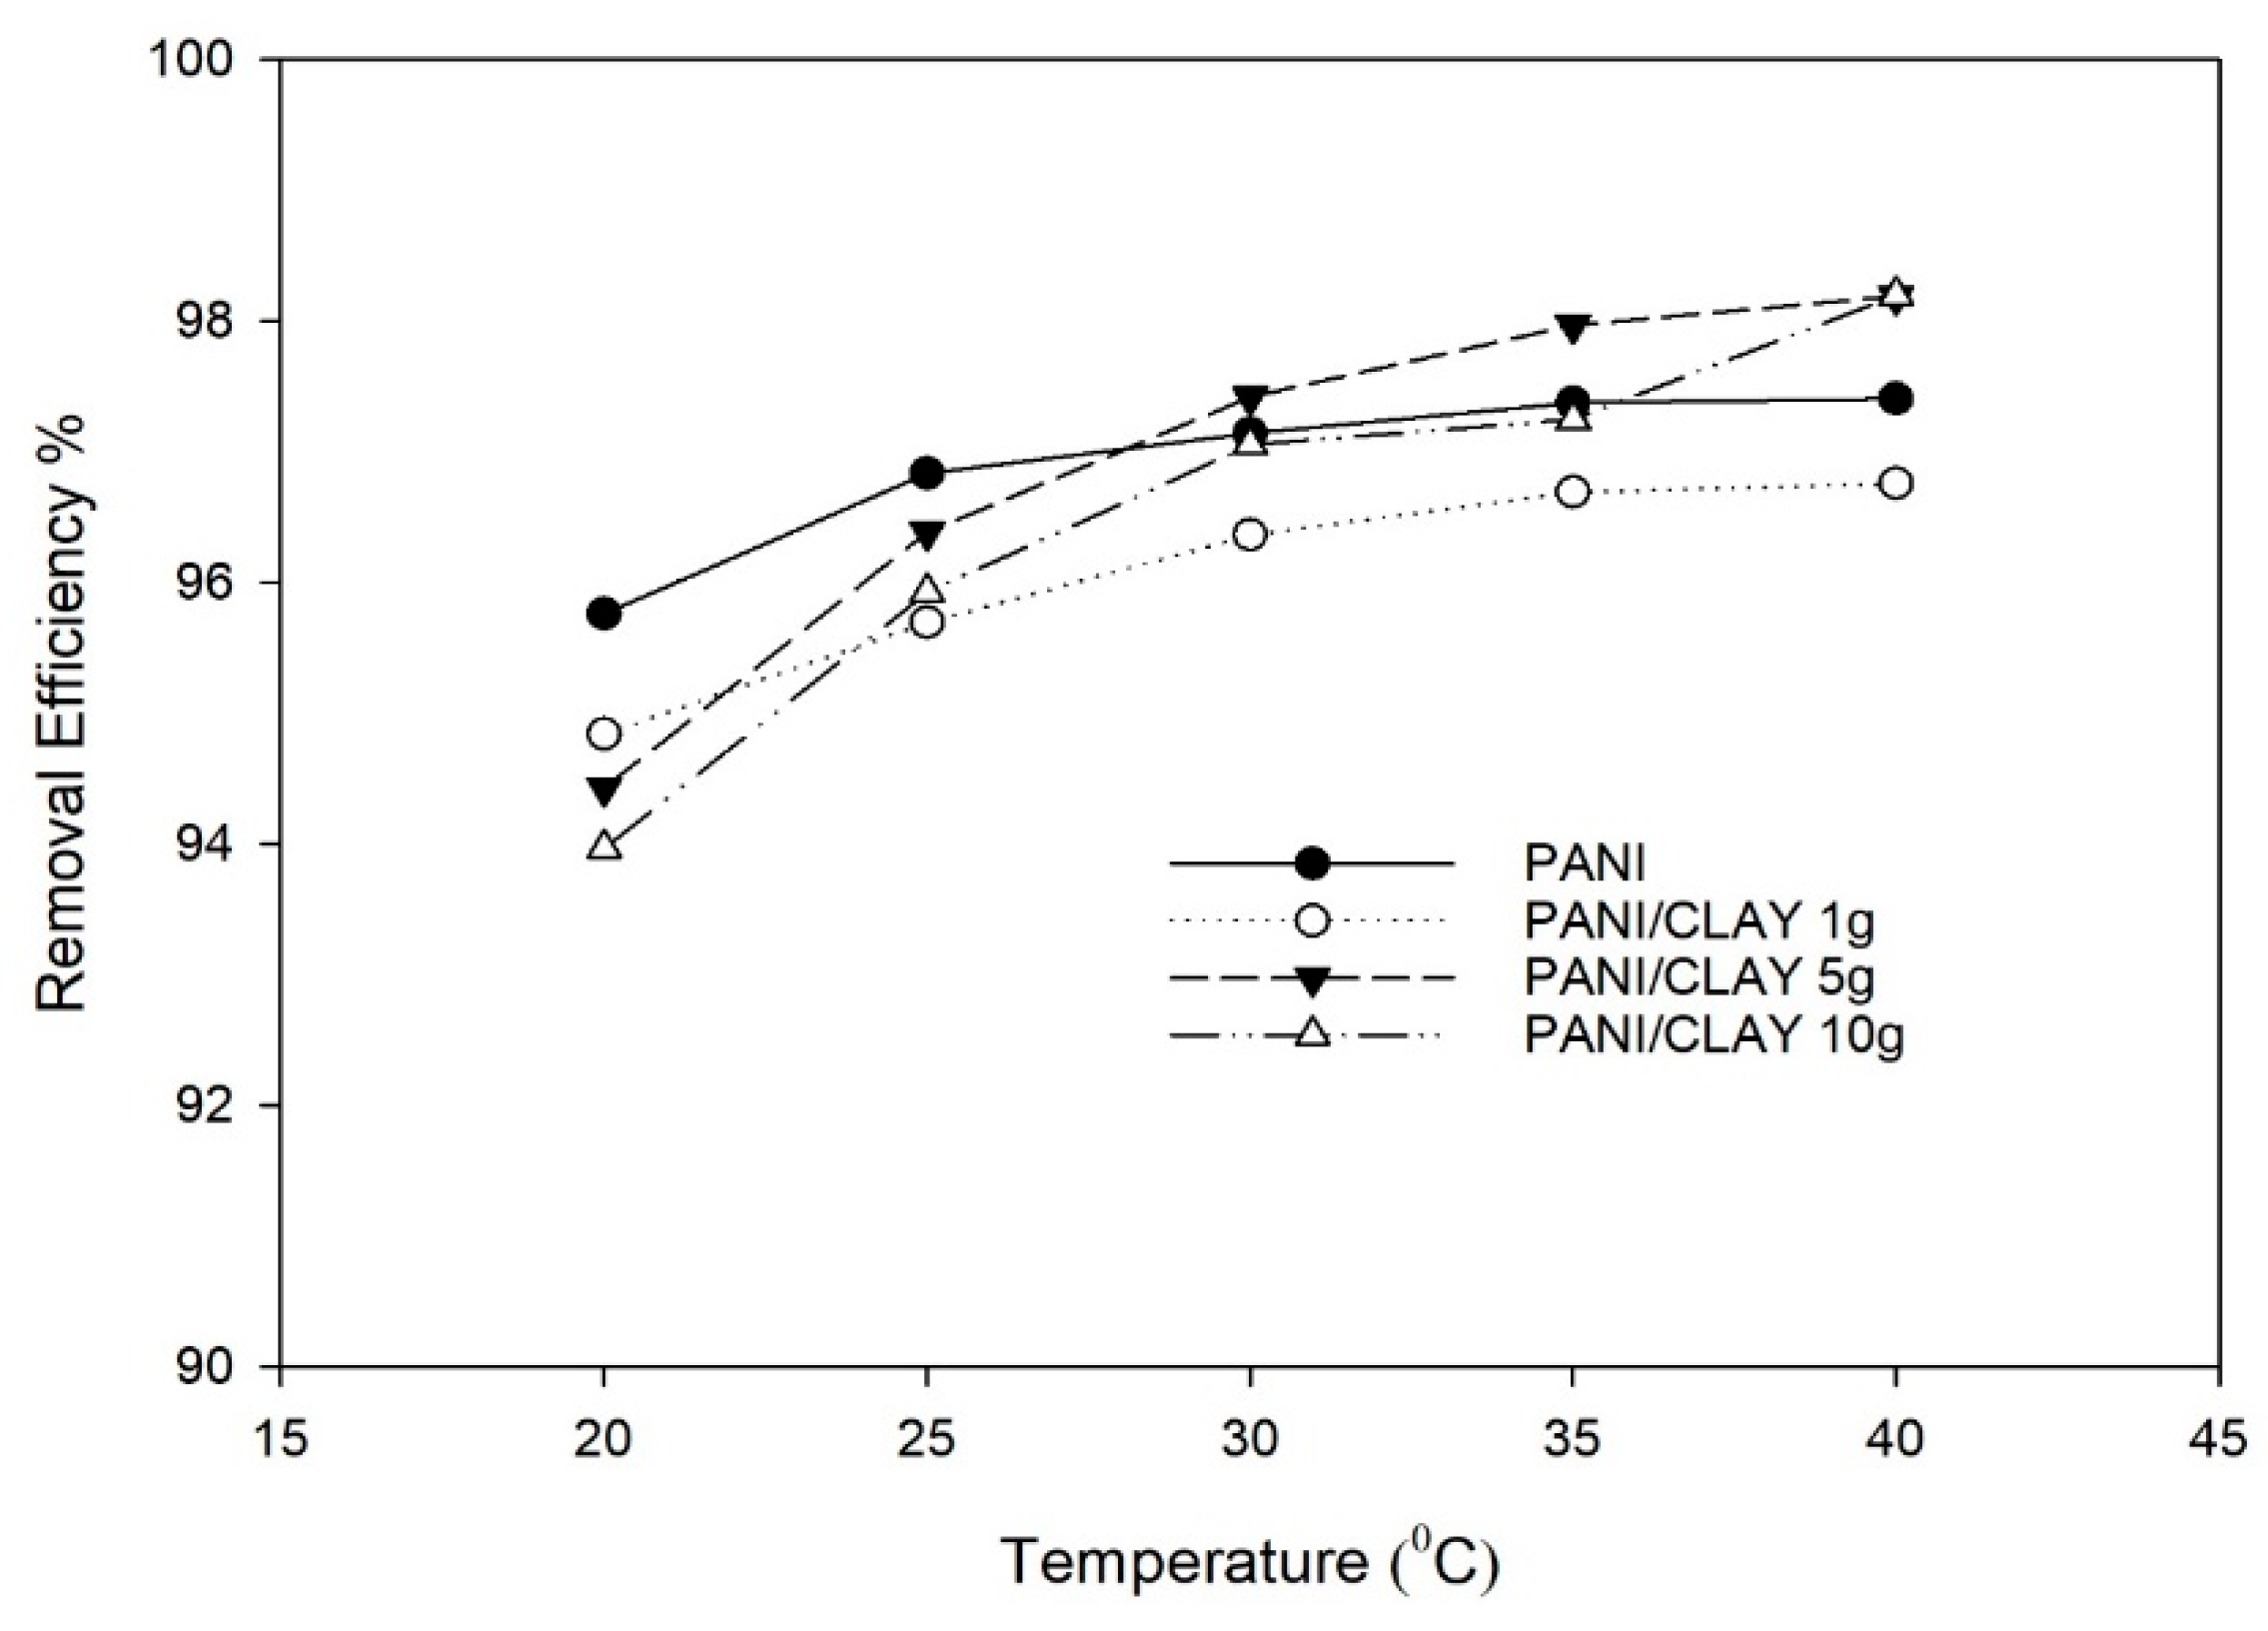
3.2.5. Effect of Temperature
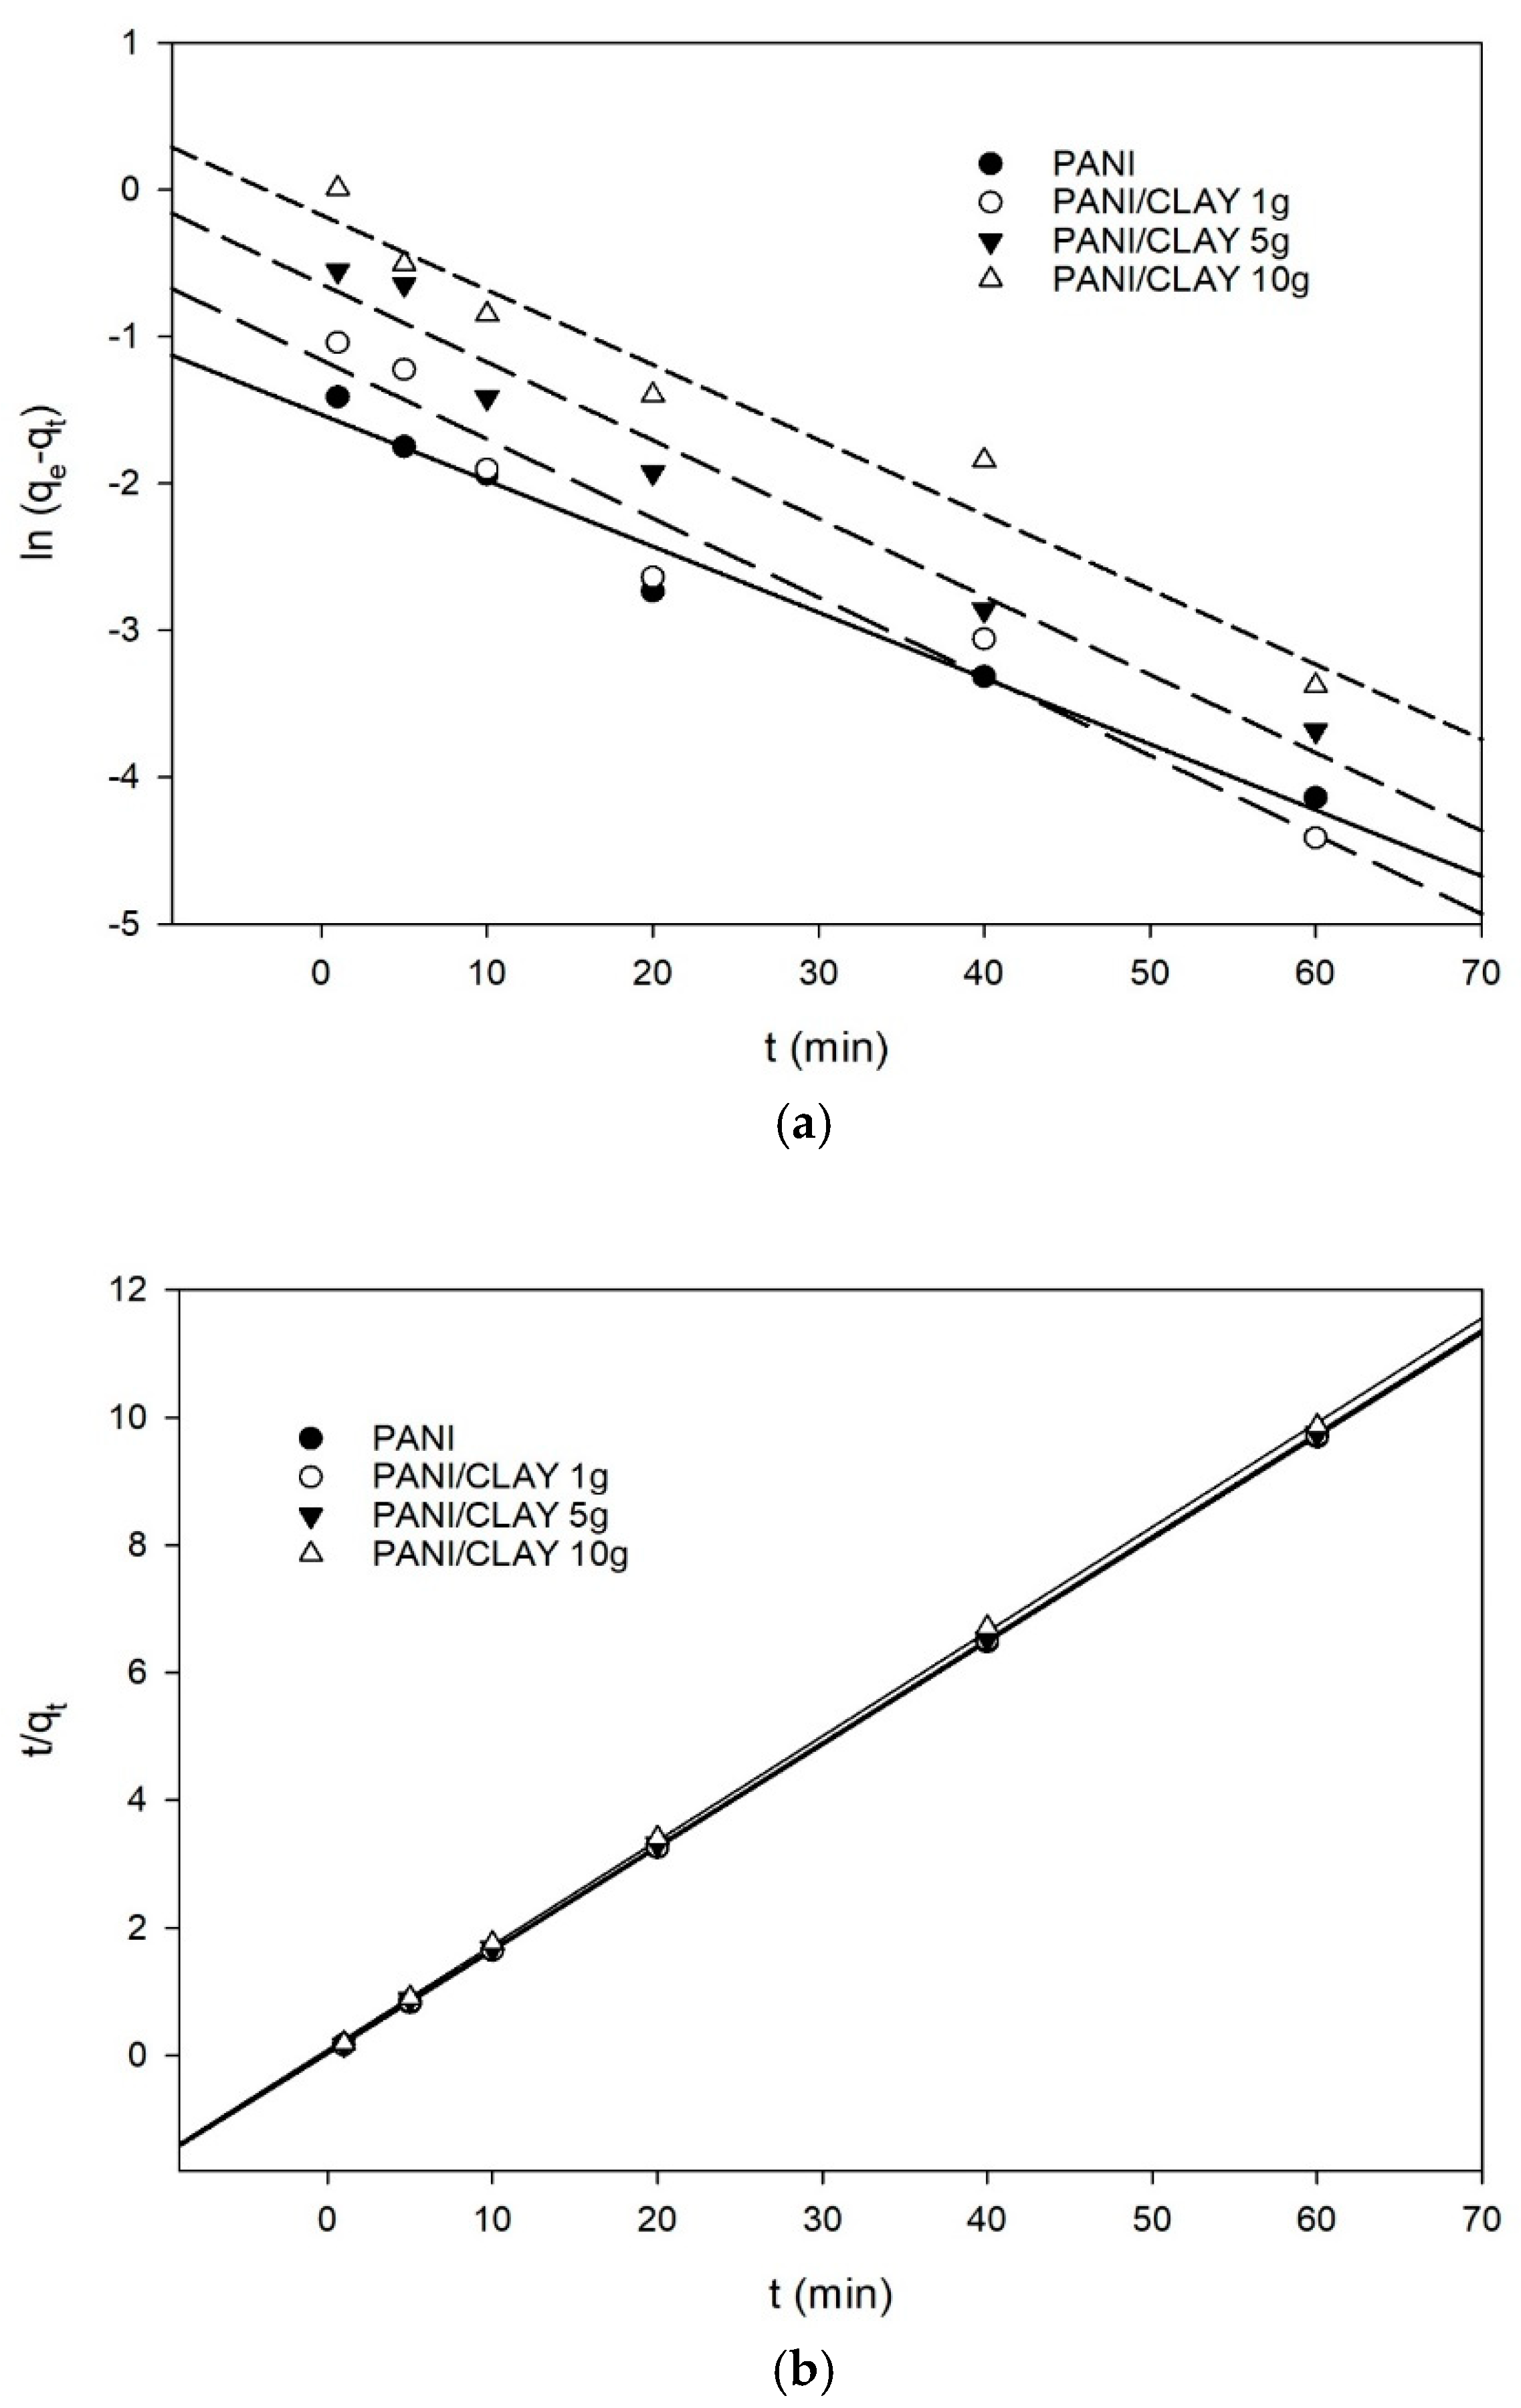
3.3. Adsorption Kinetics
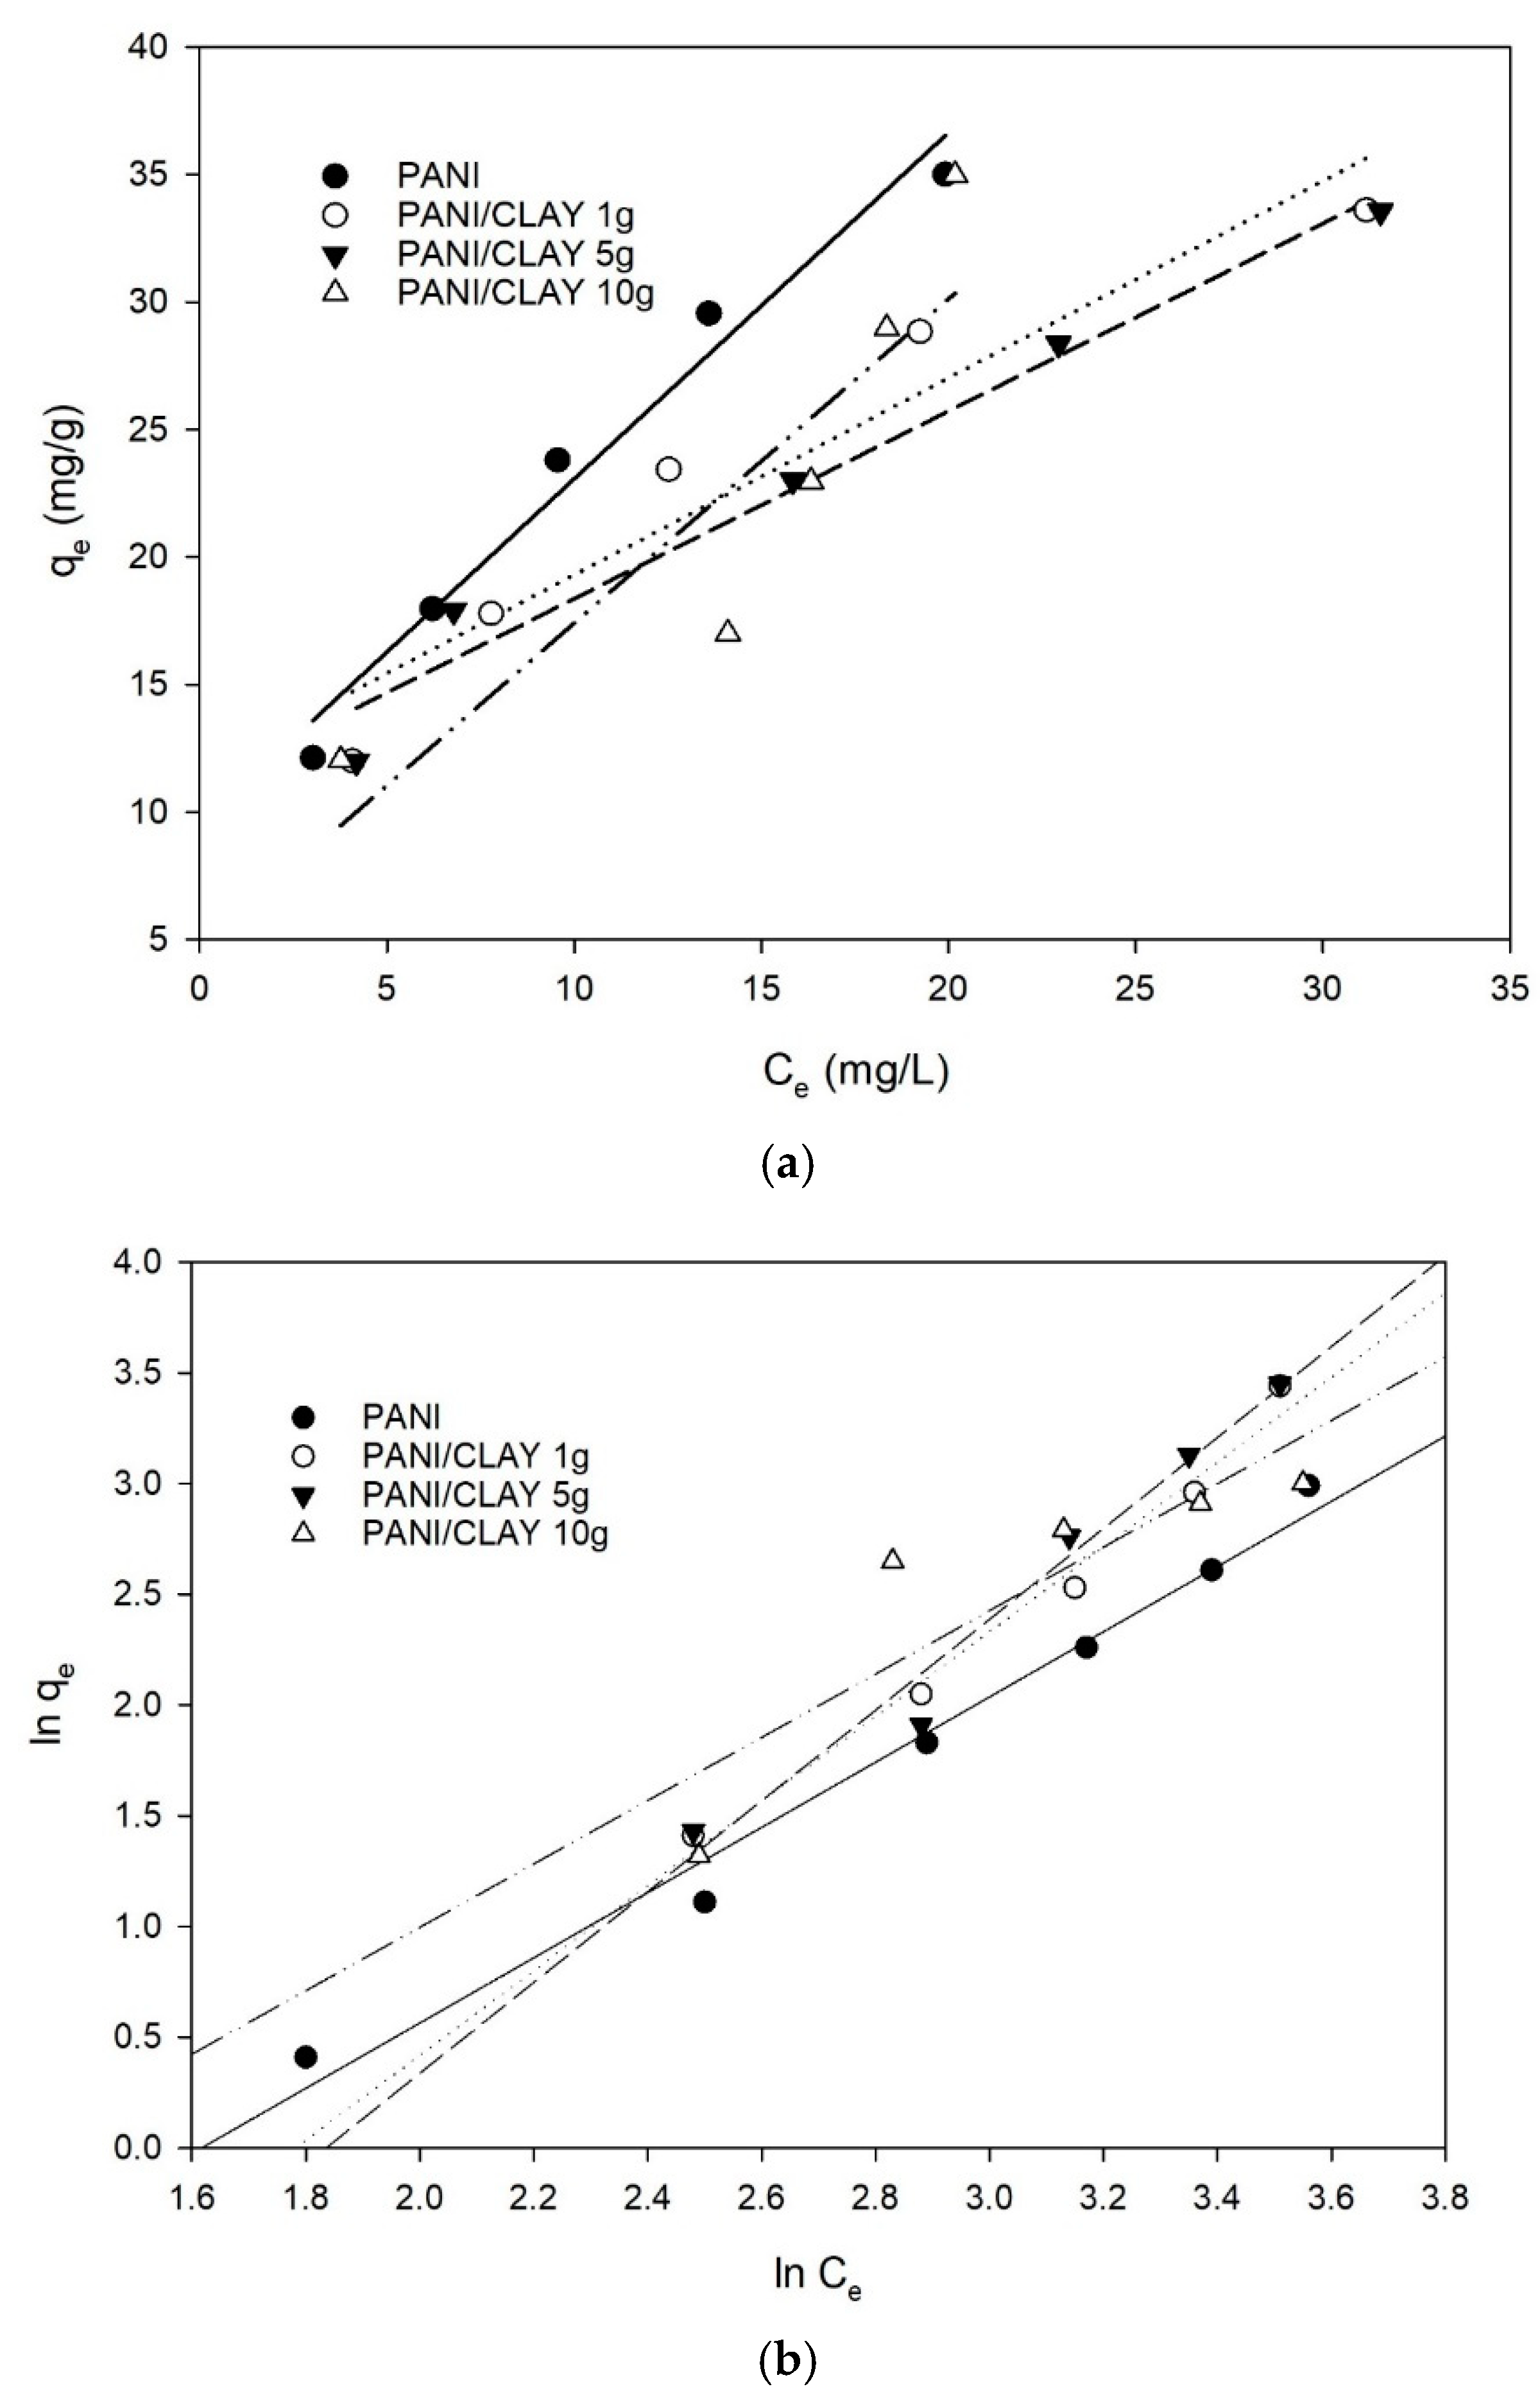
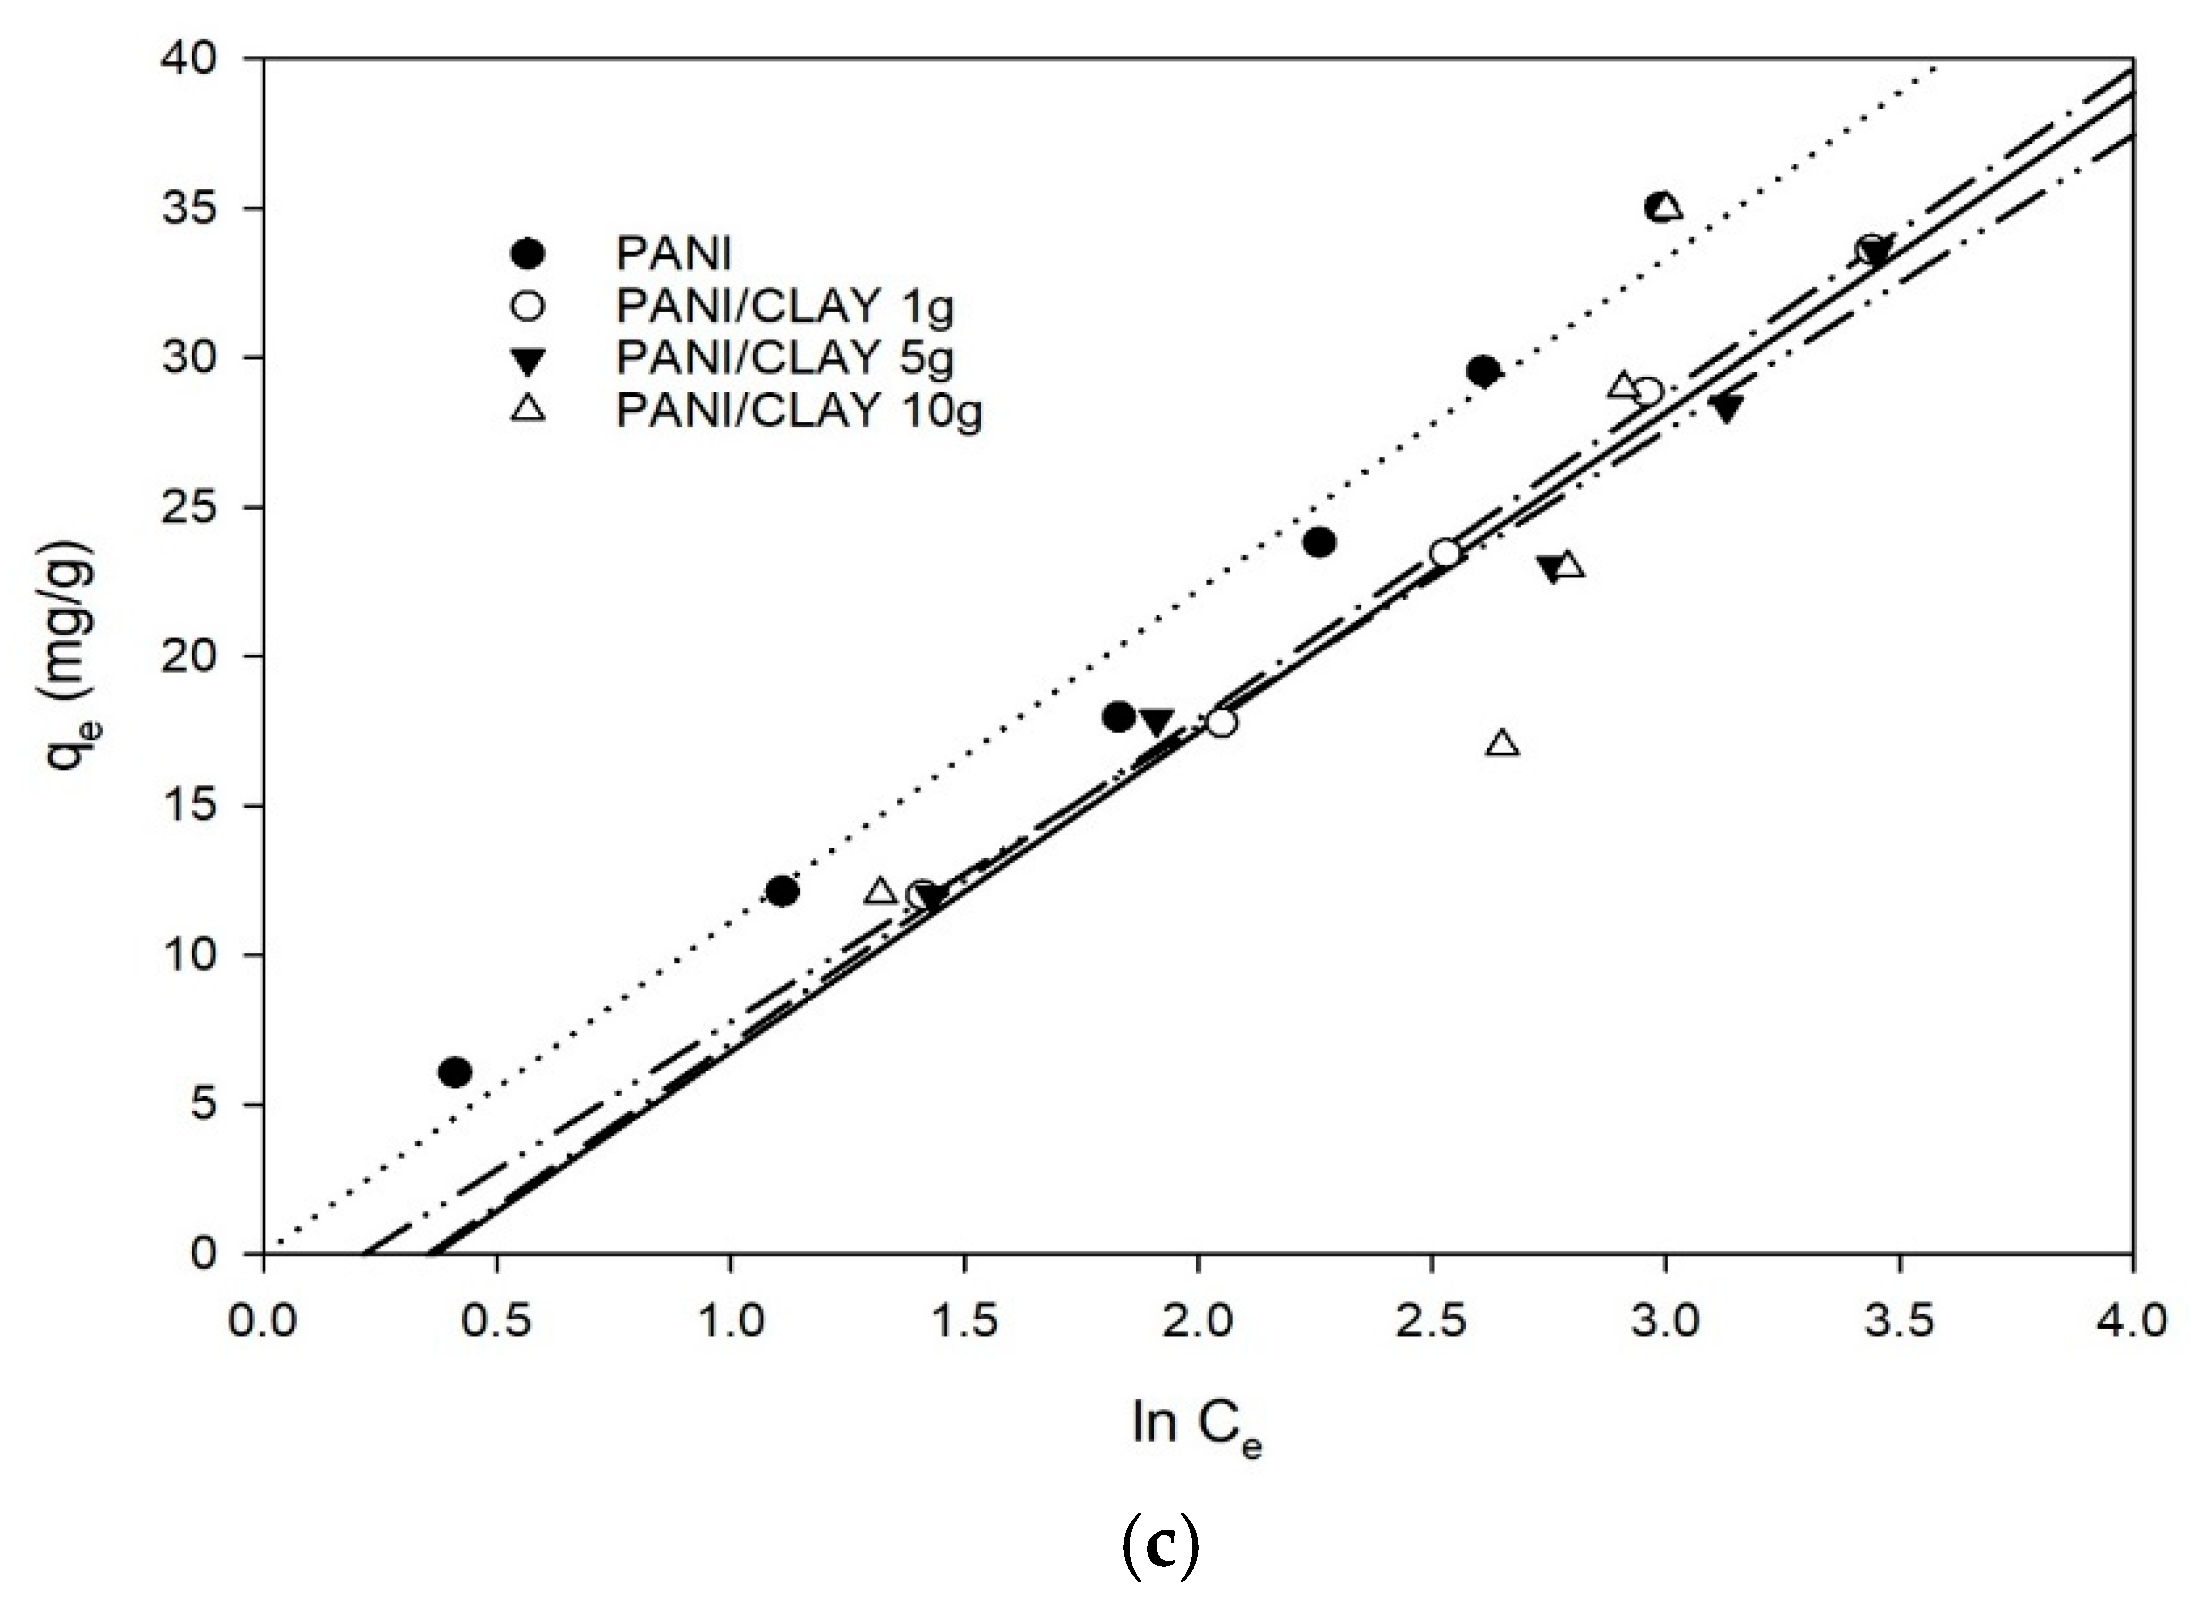
3.4. Adsorption Isotherms
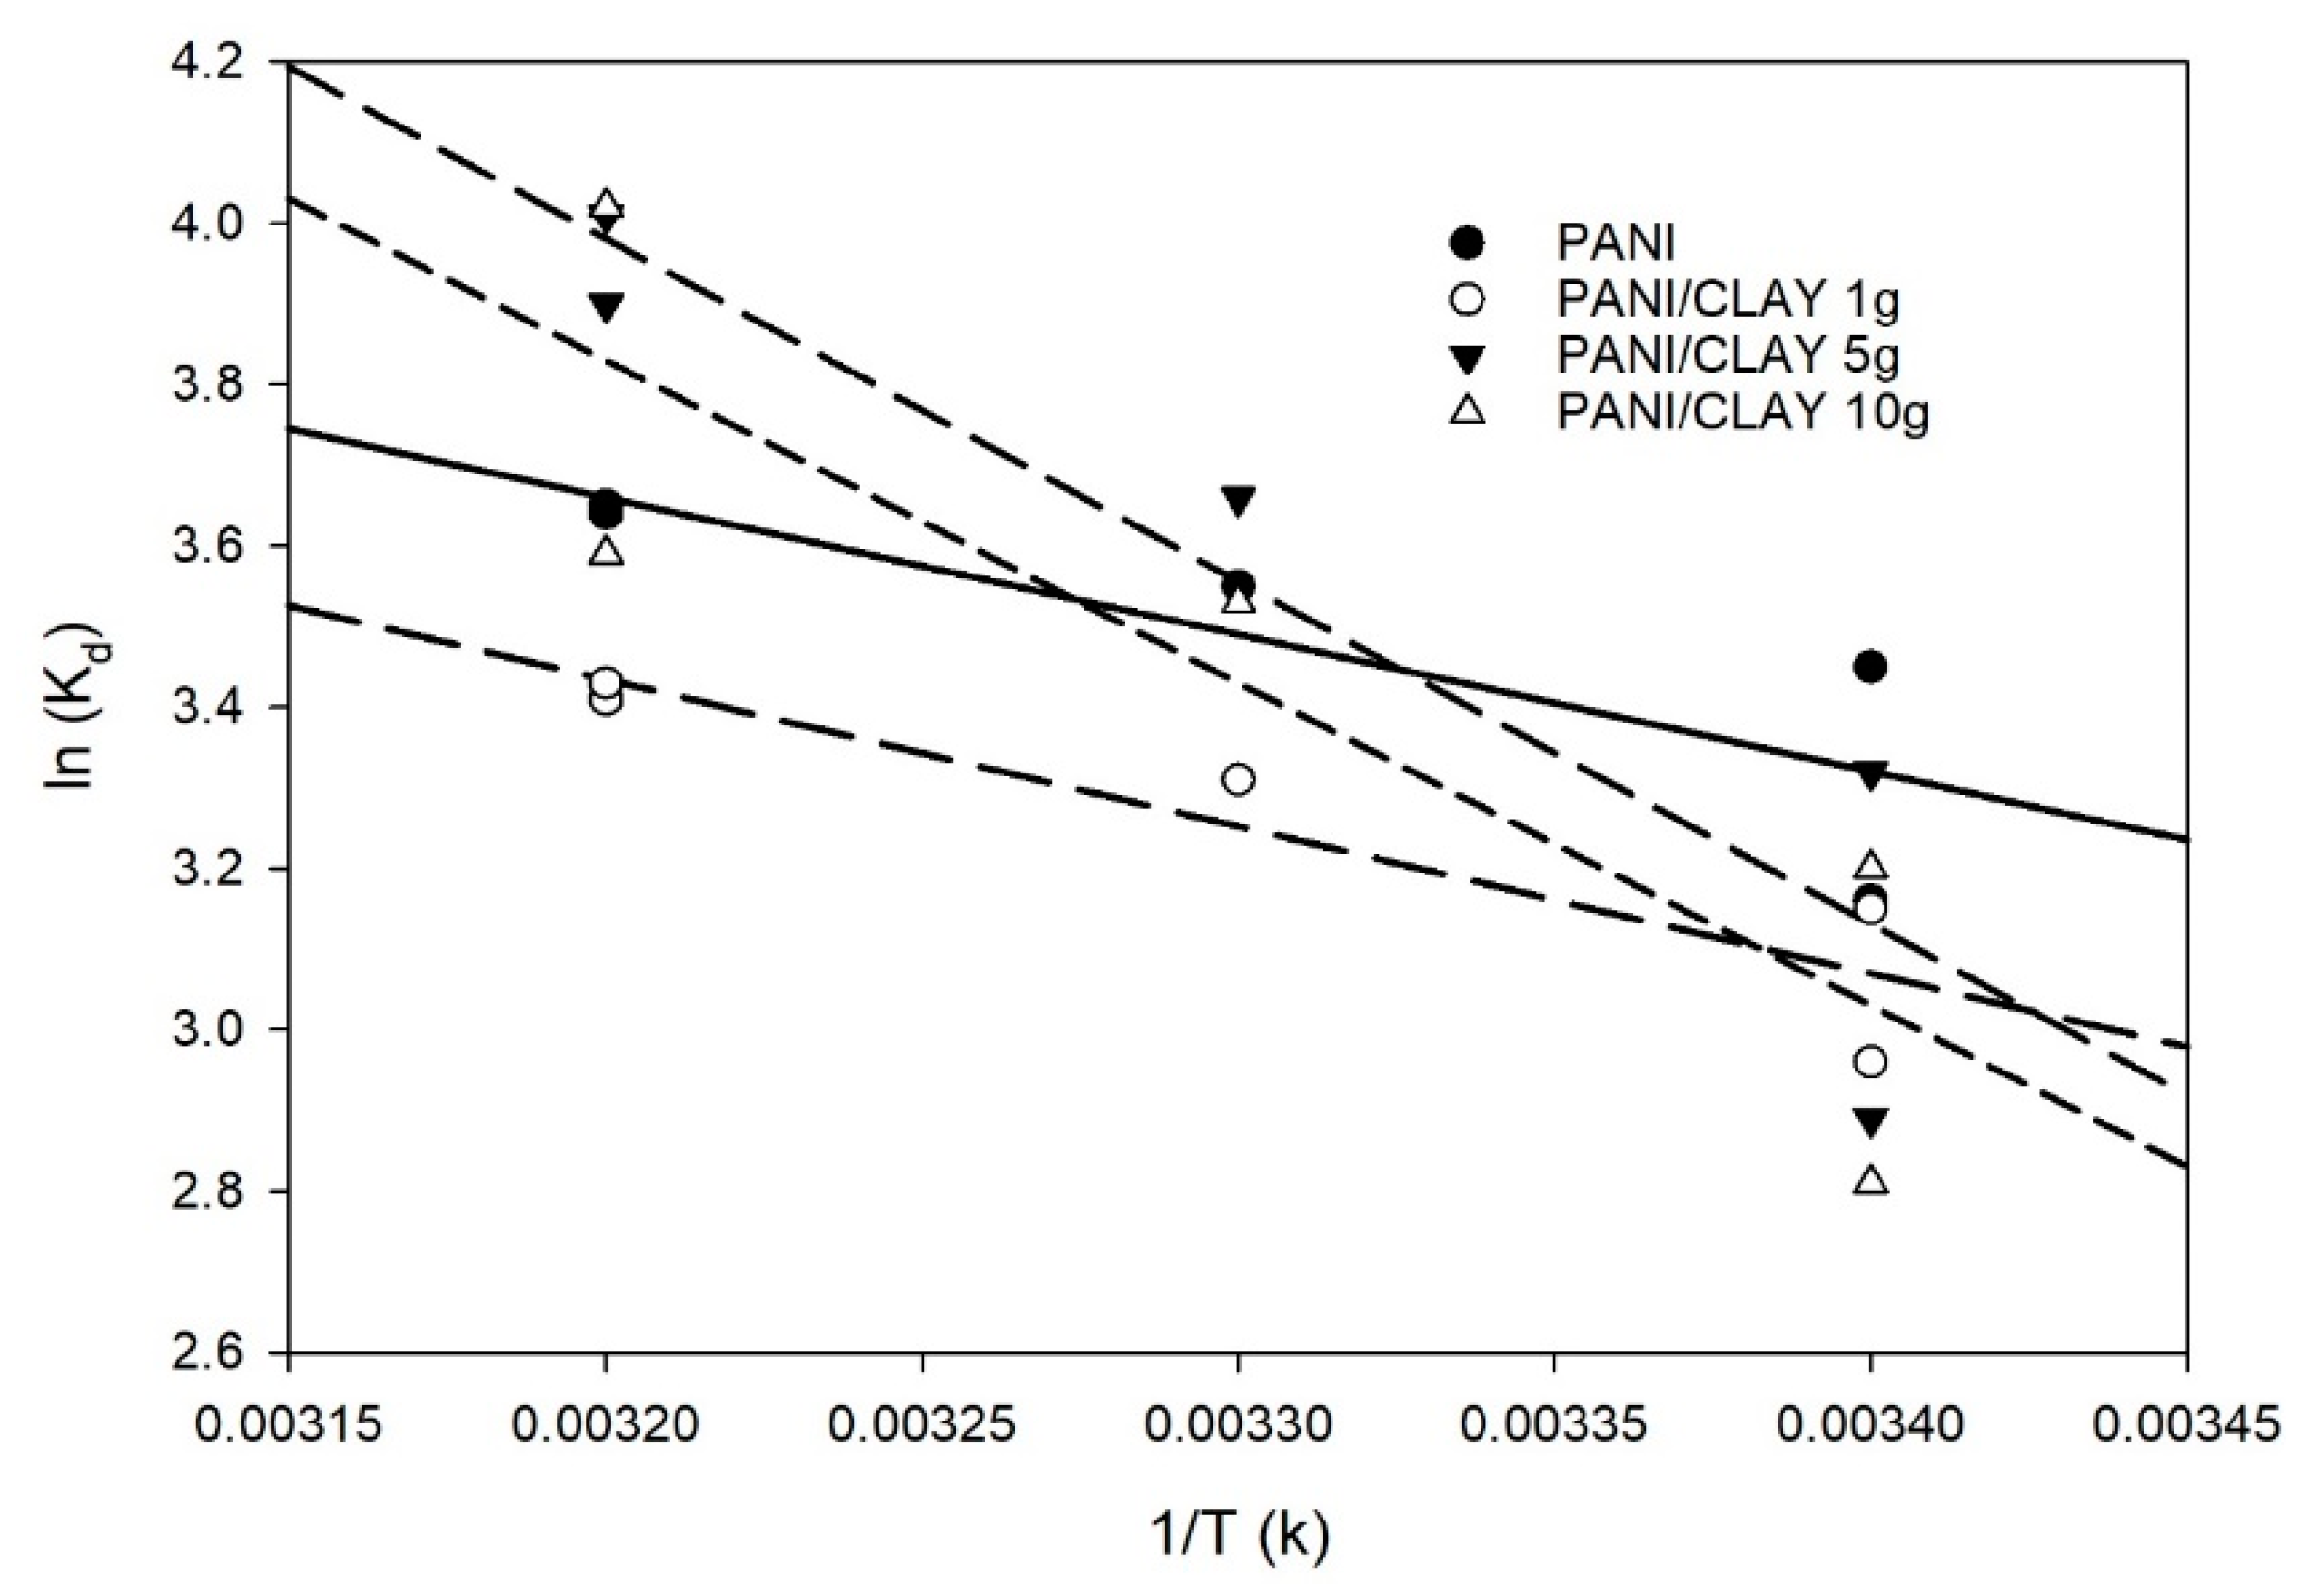
3.5. Adsorption Thermodynamics
3.6. Comparison of Similar Adsorbents for MO Removal
3.7. Possible Removal Mechanism
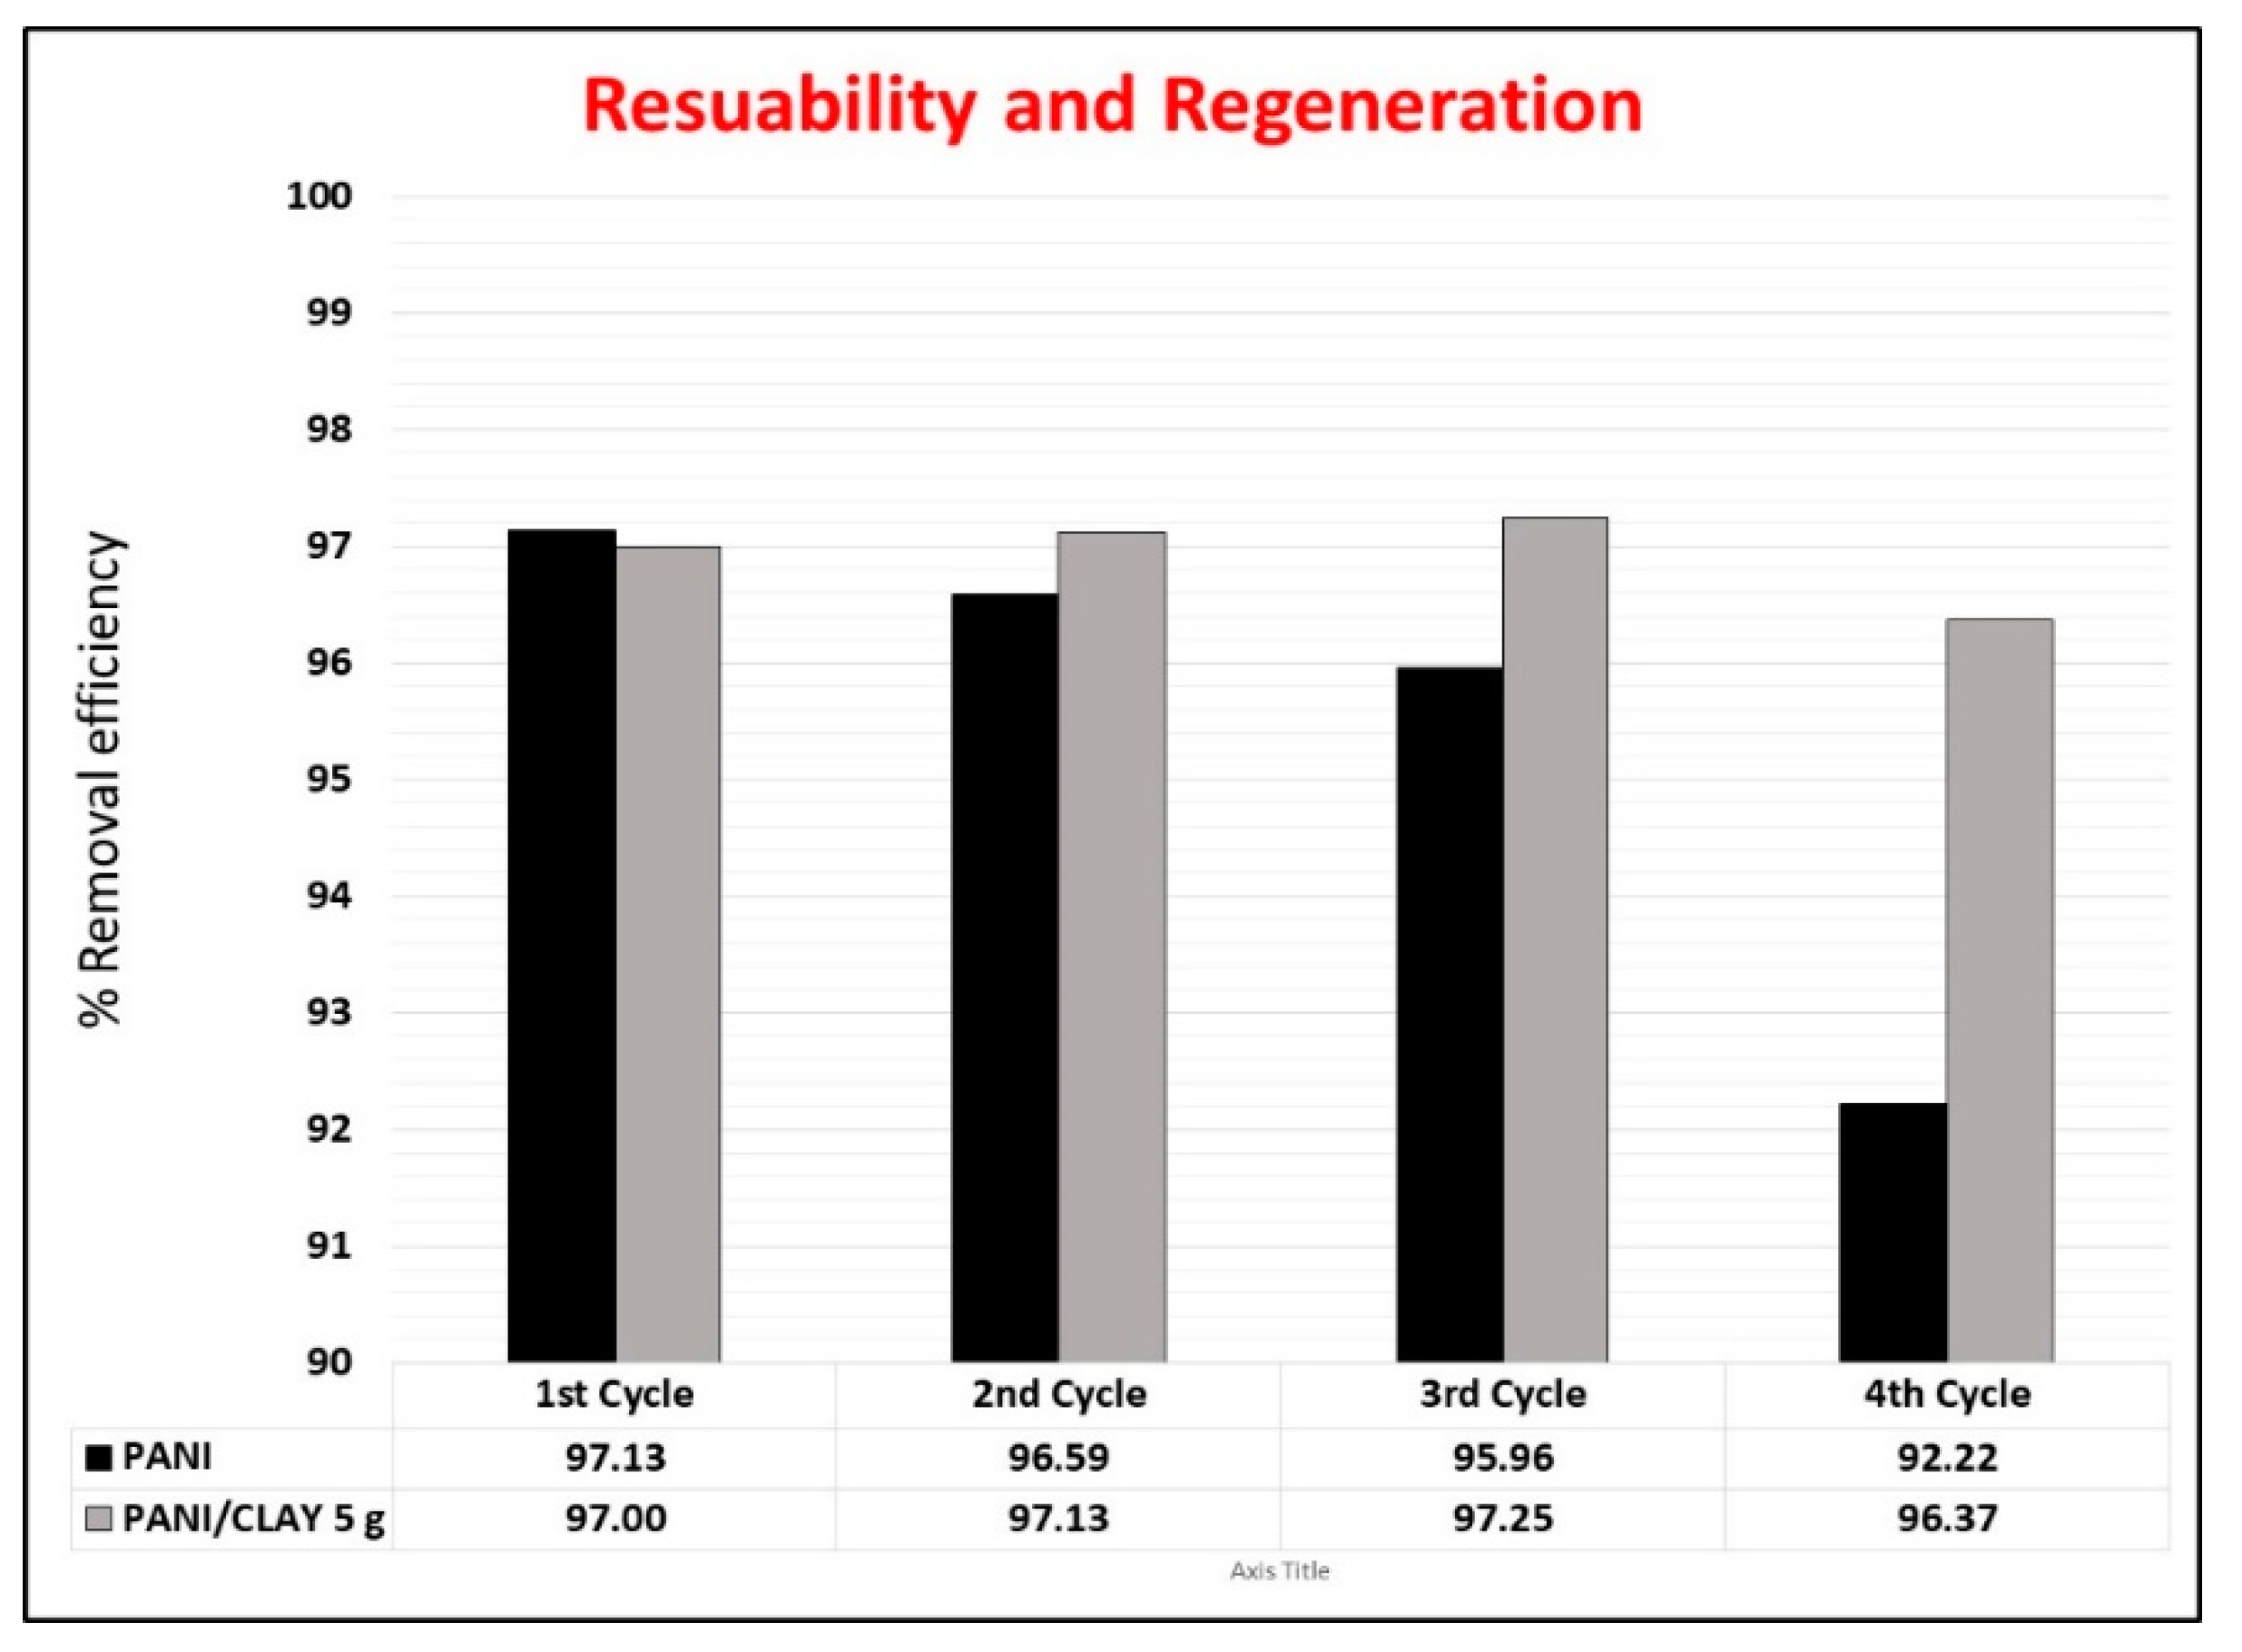
3.8. Reusability Study
4. Conclusions
Author Contributions
Funding
Data Availability Statement
Conflicts of Interest
References
- Kausar, A.; Iqbal, M.; Javed, A.; Aftab, K.; Nazli, Z.i.H.; Bhatti, H.N.; Nouren, S. Dyes Adsorption Using Clay and Modified Clay: A Review. J. Mol. Liq. 2018, 256, 395–407. [Google Scholar] [CrossRef]
- Hajjaji, M.; Alami, A.; Bouadili, A. El Removal of Methylene Blue from Aqueous Solution by Fibrous Clay Minerals. J. Hazard. Mater. 2006, 135, 188–192. [Google Scholar] [CrossRef]
- Şahin, Ö.; Kaya, M.; Saka, C. Plasma-Surface Modification on Bentonite Clay to Improve the Performance of Adsorption of Methylene Blue. Appl. Clay Sci. 2015, 116–117, 46–53. [Google Scholar] [CrossRef]
- Rauf, M.A.; Salman Ashraf, S. Survey of Recent Trends in Biochemically Assisted Degradation of Dyes. Chem. Eng. J. 2012, 209, 520–530. [Google Scholar] [CrossRef]
- Wang, C.C.; Juang, L.C.; Hsu, T.C.; Lee, C.K.; Lee, J.F.; Huang, F.C. Adsorption of Basic Dyes onto Montmorillonite. J. Colloid Interface Sci. 2004, 273, 80–86. [Google Scholar] [CrossRef]
- Hessel, C.; Allegre, C.; Maisseu, M.; Charbit, F.; Moulin, P. Guidelines and Legislation for Dye House Effluents. J. Environ. Manag. 2007, 83, 171–180. [Google Scholar] [CrossRef] [PubMed]
- Periyasamy, A.P. Recent Advances in the Remediation of Textile-Dye-Containing Wastewater: Prioritizing Human Health and Sustainable Wastewater Treatment. Sustainability 2024, 16, 495. [Google Scholar] [CrossRef]
- Nishino, A.; Taki, A.; Asamoto, H.; Minamisawa, H.; Yamada, K. Kinetic, Isotherm, and Equilibrium Investigation of Cr(VI) Ion Adsorption on Amine-Functionalized Porous Silica Beads. Polymers 2022, 14, 2104. [Google Scholar] [CrossRef]
- Saad, E.M.; Wagdy, M.; Orabi, A.S. Advanced Nano Modification of Ecofriendly Glauconite Clay for High Efficiency Methylene Blue Dye Adsorption. Sci. Rep. 2024, 14, 23614. [Google Scholar] [CrossRef]
- Bhaumik, M.; McCrindle, R.; Maity, A. Efficient Removal of Congo Red from Aqueous Solutions by Adsorption onto Interconnected Polypyrrole-Polyaniline Nanofibres. Chem. Eng. J. 2013, 228, 506–515. [Google Scholar] [CrossRef]
- Chen, H.; Zhao, J.; Zhong, A.; Jin, Y. Removal Capacity and Adsorption Mechanism of Heat-Treated Palygorskite Clay for Methylene Blue. Chem. Eng. J. 2011, 174, 143–150. [Google Scholar] [CrossRef]
- Ighnih, H.; Haounati, R.; Ouachtak, H.; Regti, A.; El Ibrahimi, B.; Hafid, N.; Jada, A.; Labd Taha, M.; Addi, A.A. Efficient Removal of Hazardous Dye from Aqueous Solutions Using Magnetic Kaolinite Nanocomposite: Experimental and Monte Carlo Simulation Studies. Inorg. Chem. Commun. 2023, 153, 110886. [Google Scholar] [CrossRef]
- Ighnih, H.; Haounati, R.; Eshaghi Malekshah, R.; Ouachtak, H.; Toubi, Y.; Alakhras, F.; Jada, A.; Ait Addi, A. Sunlight Driven Photocatalytic Degradation of RhB Dye Using Composite of Bismuth Oxy-Bromide Kaolinite BiOBr@Kaol: Experimental and Molecular Dynamic Simulation Studies. J. Photochem. Photobiol. A Chem. 2023, 445, 115071. [Google Scholar] [CrossRef]
- Liu, P. Polymer Modified Clay Minerals: A Review. Appl. Clay Sci. 2007, 38, 64–76. [Google Scholar] [CrossRef]
- Yagub, M.T.; Sen, T.K.; Afroze, S.; Ang, H.M. Dye and Its Removal from Aqueous Solution by Adsorption: A Review. Adv. Colloid Interface Sci. 2014, 209, 172–184. [Google Scholar] [CrossRef]
- Cottet, L.; Almeida, C.A.P.; Naidek, N.; Viante, M.F.; Lopes, M.C.; Debacher, N.A. Adsorption Characteristics of Montmorillonite Clay Modified with Iron Oxide with Respect to Methylene Blue in Aqueous Media. Appl. Clay Sci. 2014, 95, 25–31. [Google Scholar] [CrossRef]
- Mu, B.; Wang, A. Adsorption of Dyes onto Palygorskite and Its Composites: A Review. J. Environ. Chem. Eng. 2016, 4, 1274–1294. [Google Scholar] [CrossRef]
- Amari, A.; Gannouni, H.; Khan, M.I.; Almesfer, M.K.; Elkhaleefa, A.M.; Gannouni, A. Effect of Structure and Chemical Activation on the Adsorption Properties of Green Clay Minerals for the Removal of Cationic Dye. Appl. Sci. 2018, 8, 2302. [Google Scholar] [CrossRef]
- Pajak, M. Adsorption Capacity of Smectite Clay and Its Thermal and Chemical Modification for Two Anionic Dyes: Comparative Study. Water. Air. Soil Pollut. 2021, 232, 83. [Google Scholar] [CrossRef]
- Xia, H.; Wang, Q. Ultrasonic Irradiation: A Novel Approach To Prepare Conductive Polyaniline/Nanocrystalline Titanium Oxide Composites. Chem. Mater. 2002, 14, 2158–2165. [Google Scholar] [CrossRef]
- Pandiselvi, K.; Thambidurai, S. Chitosan-ZnO/Polyaniline Ternary Nanocomposite for High-Performance Supercapacitor. Ionics 2014, 20, 551–561. [Google Scholar] [CrossRef]
- Mu, B.; Tang, J.; Zhang, L.; Wang, A. Preparation, Characterization and Application on Dye Adsorption of a Well-Defined Two-Dimensional Superparamagnetic Clay/Polyaniline/Fe3O4 Nanocomposite. Appl. Clay Sci. 2016, 132–133, 7–16. [Google Scholar] [CrossRef]
- Nasar, A.; Mashkoor, F. Application of Polyaniline-Based Adsorbents for Dye Removal from Water and Wastewater—A Review. Environ. Sci. Pollut. Res. 2019, 26, 5333–5356. [Google Scholar] [CrossRef] [PubMed]
- Khan, M.I. Adsorption of Methylene Blue onto Natural Saudi Red Clay: Isotherms, Kinetics and Thermodynamic Studies. Mater. Res. Express 2020, 7, 055507. [Google Scholar] [CrossRef]
- Saad, M.; Tahir, H.; Khan, J.; Hameed, U.; Saud, A. Synthesis of Polyaniline Nanoparticles and Their Application for the Removal of Crystal Violet Dye by Ultrasonicated Adsorption Process Based on Response Surface Methodology. Ultrason. Sonochem. 2017, 34, 600–608. [Google Scholar] [CrossRef]
- Lyu, W.; Yu, M.; Feng, J.; Yan, W. Highly Crystalline Polyaniline Nanofibers Coating with Low-Cost Biomass for Easy Separation and High Efficient Removal of Anionic Dye ARG from Aqueous Solution. Appl. Surf. Sci. 2018, 458, 413–424. [Google Scholar] [CrossRef]
- Lyu, W.; Wu, J.; Zhang, W.; Liu, Y.P.; Yu, M.; Zhao, Y.; Feng, J.; Yan, W. Easy Separated 3D Hierarchical Coral-like Magnetic Polyaniline Adsorbent with Enhanced Performance in Adsorption and Reduction of Cr(VI) and Immobilization of Cr(III). Chem. Eng. J. 2019, 363, 107–119. [Google Scholar] [CrossRef]
- Soltani, H.; Belmokhtar, A.; Zeggai, F.Z.; Benyoucef, A.; Bousalem, S.; Bachari, K. Copper(II) Removal from Aqueous Solutions by PANI-Clay Hybrid Material: Fabrication, Characterization, Adsorption and Kinetics Study. J. Inorg. Organomet. Polym. Mater. 2019, 29, 841–850. [Google Scholar] [CrossRef]
- Haitham, K.; Razak, S.; Nawi, M.A. Kinetics and Isotherm Studies of Methyl Orange Adsorption by a Highly Recyclable Immobilized Polyaniline on a Glass Plate. Arab. J. Chem. 2019, 12, 1595–1606. [Google Scholar] [CrossRef]
- Hasan, M.; Rashid, M.M.; Hossain, M.M.; Al Mesfer, M.K.; Arshad, M.; Danish, M.; Lee, M.; El Jery, A.; Kumar, N. Fabrication of Polyaniline/Activated Carbon Composite and Its Testing for Methyl Orange Removal: Optimization, Equilibrium, Isotherm and Kinetic Study. Polym. Test. 2019, 77, 105909. [Google Scholar] [CrossRef]
- Ben Ali, M.; Wang, F.; Boukherroub, R.; Lei, W.; Xia, M. Phytic Acid-Doped Polyaniline Nanofibers-Clay Mineral for Efficient Adsorption of Copper (II) Ions. J. Colloid Interface Sci. 2019, 553, 688–698. [Google Scholar] [CrossRef] [PubMed]
- El-shazly, A.H.; Elkady, M.; Abdelraheem, A. Investigating the Adsorption Behavior of Polyaniline and Its Clay Nanocomposite towards Ammonia Gas. Polymers 2022, 14, 4533. [Google Scholar] [CrossRef]
- Gholami, H.; Shakeri, A.; Saadattalab, V. Investigation of Physical and Mechanical Properties of Polyaniline/MMT Nanocomposites. Curr. Chem. Lett. 2017, 6, 151–158. [Google Scholar] [CrossRef]
- Haloi, D.J.; Ata, S.; Singha, N.K. Synthesis of Poly(2-Ethylhexyl Acrylate)/Clay Nanocomposite via In Situ and Surface Initiated-Atom Transfer Radical Polymerization. Adv. Sci. Eng. Med. 2014, 6, 240–245. [Google Scholar] [CrossRef]
- Majka, T.M.; Leszczyńska, A.; Pielichowski, K. Thermal Stability and Degradation of Polymer Nanocomposites. In Polymer Nanocomposites; Springer International Publishing: Cham, Switzerland, 2016; pp. 167–190. [Google Scholar]
- Saadattalab, V.; Shakeri, A.; Gholami, H. Effect of CNTs and Nano ZnO on Physical and Mechanical Properties of Polyaniline Composites Applicable in Energy Devices. Prog. Nat. Sci. Mater. Int. 2016, 26, 517–522. [Google Scholar] [CrossRef]
- Panda, A.K.; Mishra, B.G.; Mishra, D.K.; Singh, R.K. Effect of Sulphuric Acid Treatment on the Physico-Chemical Characteristics of Kaolin Clay. Colloids Surf. A Physicochem. Eng. Asp. 2010, 363, 98–104. [Google Scholar] [CrossRef]
- Duhan, M.; Kaur, R. Adsorptive Removal of Methyl Orange with Polyaniline Nanofibers: An Unconventional Adsorbent for Water Treatment. Environ. Technol. 2020, 41, 2977–2990. [Google Scholar] [CrossRef]
- Zhang, S.; Gao, L.; Shan, L.; Wang, R.; Min, Y. Comparative Study on the Adsorption of NO2 Using Different Clay/Polyaniline Composites. Ind. Eng. Chem. Res. 2018, 57, 6897–6903. [Google Scholar] [CrossRef]
- Zhao, W.; Hao, C.; Guo, Y.; Shao, W.; Tian, Y.; Zhao, P. Optimization of Adsorption Conditions Using Response Surface Methodology for Tetracycline Removal by MnFe2O4/Multi-Wall Carbon Nanotubes. Water 2023, 15, 2392. [Google Scholar] [CrossRef]
- Saif Ur Rehman, M.; Munir, M.; Ashfaq, M.; Rashid, N.; Nazar, M.F.; Danish, M.; Han, J.I. Adsorption of Brilliant Green Dye from Aqueous Solution onto Red Clay. Chem. Eng. J. 2013, 228, 54–62. [Google Scholar] [CrossRef]
- Zaremotlagh, S.; Hezarkhani, A. Removal of Textile Dyes from Aqueous Solution by Conducting Polymer Modified Clinoptilolite. Environ. Earth Sci. 2014, 71, 2999–3006. [Google Scholar] [CrossRef]
- Akti, F.; Okur, M. The Removal of Acid Violet 90 from Aqueous Solutions Using PANI and PANI/Clinoptilolite Composites: Isotherm and Kinetics. J. Polym. Environ. 2018, 26, 4233–4242. [Google Scholar] [CrossRef]
- Largo, F.; Haounati, R.; Ouachtak, H.; Hafid, N.; Jada, A.; Addi, A.A. Design of Organically Modified Sepiolite and Its Use as Adsorbent for Hazardous Malachite Green Dye Removal from Water. Water Air Soil Pollut. 2023, 234, 183. [Google Scholar] [CrossRef]
- Deb, A.; Kanmani, M.; Debnath, A.; Bhowmik, K.L.; Saha, B. Ultrasonic Assisted Enhanced Adsorption of Methyl Orange Dye onto Polyaniline Impregnated Zinc Oxide Nanoparticles: Kinetic, Isotherm and Optimization of Process Parameters. Ultrason. Sonochem. 2019, 54, 290–301. [Google Scholar] [CrossRef]
- Ouaddari, H.; Abbou, B.; Lebkiri, I.; Habsaoui, A.; Ouzzine, M.; Fath Allah, R. Removal of Methylene Blue by Adsorption onto Natural and Purified Clays: Kinetic and Thermodynamic Study. Chem. Phys. Impact 2024, 8, 100405. [Google Scholar] [CrossRef]
- Wu, L.; Liu, X.; Lv, G.; Zhu, R.; Tian, L.; Liu, M.; Li, Y.; Rao, W.; Liu, T.; Liao, L. Study on the Adsorption Properties of Methyl Orange by Natural One-Dimensional Nano-Mineral Materials with Different Structures. Sci. Rep. 2021, 11, 10640. [Google Scholar] [CrossRef]
- Auta, M.; Hameed, B.H. Modified Mesoporous Clay Adsorbent for Adsorption Isotherm and Kinetics of Methylene Blue. Chem. Eng. J. 2012, 198–199, 219–227. [Google Scholar] [CrossRef]
- Eleryan, A.; Aigbe, U.O.; Ukhurebor, K.E.; Onyancha, R.B.; Hassaan, M.A. Adsorption of Direct Blue 106 Dye Using Zinc Oxide Nanoparticles Prepared via Green Synthesis Technique. Environ. Sci. Pollut. Res. 2023, 30, 69666–69682. [Google Scholar] [CrossRef]
- Sukla Baidya, K.; Kumar, U. Adsorption of Brilliant Green Dye from Aqueous Solution onto Chemically Modified Areca Nut Husk. S. Afr. J. Chem. Eng. 2021, 35, 33–43. [Google Scholar] [CrossRef]
- Ho, Y.-S. Isotherms for the Sorption of Lead onto Peat: Comparison of Linear and Non-Linear Methods. Pol. J. Environ. Stud. 2006, 15, 81–86. [Google Scholar]
- Karthikeyan, M.; Satheesh Kumar, K.K.; Elango, K.P. Conducting Polymer/Alumina Composites as Viable Adsorbents for the Removal of Fluoride Ions from Aqueous Solution. J. Fluor. Chem. 2009, 130, 894–901. [Google Scholar] [CrossRef]
- Ai, L.; Jiang, J.; Zhang, R. Uniform Polyaniline Microspheres: A Novel Adsorbent for Dye Removal from Aqueous Solution. Synth. Met. 2010, 160, 762–767. [Google Scholar] [CrossRef]
- Chen, H.; Yan, H.; Pei, Z.; Wu, J.; Li, R.; Jin, Y.; Zhao, J. Trapping Characteristic of Halloysite Lumen for Methyl Orange. Appl. Surf. Sci. 2015, 347, 769–776. [Google Scholar] [CrossRef]
- Sharma, V.; Rekha, P.; Mohanty, P. Nanoporous Hypercrosslinked Polyaniline: An Efficient Adsorbent for the Adsorptive Removal of Cationic and Anionic Dyes. J. Mol. Liq. 2016, 222, 1091–1100. [Google Scholar] [CrossRef]
- Tanzifi, M.; Hosseini, S.H.; Kiadehi, A.D.; Olazar, M.; Karimipour, K.; Rezaiemehr, R.; Ali, I. Artificial Neural Network Optimization for Methyl Orange Adsorption onto Polyaniline Nano-Adsorbent: Kinetic, Isotherm and Thermodynamic Studies. J. Mol. Liq. 2017, 244, 189–200. [Google Scholar] [CrossRef]
- Vidya, J.; John Bosco, A.; Haribaaskar, K.; Balamurugan, P. Polyaniline—BiVO4 Nanocomposite as an Efficient Adsorbent for the Removal of Methyl Orange from Aqueous Solution. Mater. Sci. Semicond. Process. 2019, 103, 104645. [Google Scholar] [CrossRef]
- Bekhoukh, A.; Moulefera, I.; Zeggai, F.Z.; Benyoucef, A.; Bachari, K. Anionic Methyl Orange Removal from Aqueous Solutions by Activated Carbon Reinforced Conducting Polyaniline as Adsorbent: Synthesis, Characterization, Adsorption Behavior, Regeneration and Kinetics Study. J. Polym. Environ. 2022, 30, 886–895. [Google Scholar] [CrossRef]
- Al-Odayni, A.B.; Alsubaie, F.S.; Saeed, W.S. Nitrogen-Rich Polyaniline-Based Activated Carbon for Water Treatment: Adsorption Kinetics of Anionic Dye Methyl Orange. Polymers 2023, 15, 806. [Google Scholar] [CrossRef]
- Abbou, B.; Lebkiri, I.; Ouaddari, H.; El Amri, A.; Achibat, F.E.; Kadiri, L.; Ouass, A.; Lebkiri, A.; Rifi, E.H. Improved Removal of Methyl Orange Dye by Adsorption Using Modified Clay: Combined Experimental Study Using Surface Response Methodology. Inorg. Chem. Commun. 2023, 155, 111127. [Google Scholar] [CrossRef]
- Stejskal, J. Interaction of Conducting Polymers, Polyaniline and Polypyrrole, with Organic Dyes: Polymer Morphology Control, Dye Adsorption and Photocatalytic Decomposition; Springer International Publishing: Bratislava, Slovakia, 2020; Volume 74, ISBN 0123456789. [Google Scholar]
- Stejskal, J. Recent Advances in the Removal of Organic Dyes from Aqueous Media with Conducting Polymers, Polyaniline and Polypyrrole, and Their Composites. Polymers 2022, 14, 4243. [Google Scholar] [CrossRef]
- Iwuozor, K.O.; Ighalo, J.O.; Emenike, E.C.; Ogunfowora, L.A.; Igwegbe, C.A. Adsorption of Methyl Orange: A Review on Adsorbent Performance. Curr. Res. Green Sustain. Chem. 2021, 4, 100179. [Google Scholar] [CrossRef]


| Method | CLAY | PANI | PANI/CLAY 1 g | PANI/CLAY 5 g | PANI/CLAY 10 g |
|---|---|---|---|---|---|
| MultiPoint BET (m2/g) | 37.38 | 25.35 | 22.91 | 13.32 | 13.44 |
| BJH method cumulative adsorption pore volume (cm3/g) | 0.0486 | 0.0295 | 0.0277 | 0.0195 | 0.0225 |
| BJH method adsorption pore radius (Å) | 17.41 | 19.56 | 18.32 | 18.34 | 18.17 |
| Adsorption Model | Kinetics Parameters | Values | |||
|---|---|---|---|---|---|
| PANI | PANI/CLAY 1 g | PANI/CLAY 5 g | PANI/CLAY 10 g | ||
| Pseudo-first-order | qe (mg/g) | 0.2168 | 0.3146 | 0.5289 | 0.8452 |
| k1 (g/mg/h) | −0.0449 | −0.0539 | −0.0533 | −0.0511 | |
| R2 | 0.976 | 0.9574 | 0.9707 | 0.9598 | |
| Pseudo-second-order | qe (mg/g) | 6.211 | 6.196 | 6.203 | 6.146 |
| k2 (g/mg/h) | 0.906 | 0.704 | 0.400 | 0.239 | |
| R2 | 1 | 1 | 1 | 0.9999 | |
| Adsorption Isotherm Model | Parameters | Values | |||
|---|---|---|---|---|---|
| PANI | PANI/CLAY 1 g | PANI/CLAY 5 g | PANI/CLAY 10 g | ||
| Langmuir | qmax (mg/g) | 55.866 | 47.170 | 41.494 | 42.017 |
| KL | 0.082 | 0.080 | 0.104 | 0.093 | |
| R2 | 0.9873 | 0.9991 | 0.9725 | 0.6496 | |
| Freundlich | n | 1.502 | 1.641 | 1.901 | 1.762 |
| 1/n | 0.6659 | 0.6093 | 0.526 | 0.5675 | |
| Kf | 5.155 | 4.685 | 5.607 | 5.112 | |
| R2 | 0.9837 | 0.9754 | 0.9843 | 0.9211 | |
| Temkin | KT | 1.004 | 0.874 | 1.248 | 1.167 |
| bt | 223.325 | 248.306 | 293.037 | 283.251 | |
| R2 | 0.9784 | 0.9911 | 0.9648 | 0.7813 | |
| Composite | T (K) | ∆G° (KJ/mol) | ∆H° (KJ/mol) | ∆S° (J/mol K) |
|---|---|---|---|---|
| PANI | 293 | −7.70 | 17.97 | 88.37 |
| 298 | −8.55 | |||
| 303 | −8.95 | |||
| 308 | −9.32 | |||
| 313 | −9.50 | |||
| PANI/CLAY 1 g | 293 | −7.22 | 18.29 | 87.42 |
| 298 | −7.79 | |||
| 303 | −8.35 | |||
| 308 | −8.73 | |||
| 313 | −8.92 | |||
| PANI/CLAY 5 g | 293 | −7.03 | 43.31 | 172.57 |
| 298 | −8.23 | |||
| 303 | −9.21 | |||
| 308 | −9.98 | |||
| 313 | −10.45 | |||
| PANI/CLAY 10 g | 293 | −6.84 | 42.88 | 170.10 |
| 298 | −7.93 | |||
| 303 | −8.88 | |||
| 308 | −9.20 | |||
| 313 | −10.45 |
| Adsorbent | qmax (mg/g) | Ref. No. |
|---|---|---|
| Halloysite nanoclays | 25 | [54] |
| Nanoporous hypercrosslinked polyaniline | 220 | [55] |
| Polyaniline nano-adsorbent | 75.9 | [56] |
| Immobilized polyaniline glass and polyaniline powder | 93 and 147 | [29] |
| Polyaniline BiVO4 nanocomposite | 75 | [57] |
| Polyaniline activated carbon composite | 285 | [30] |
| Polyaniline nanofibers | 25 | [38] |
| Halloysite and chrysotile | 13.56 and 31.46 | [47] |
| Polyaniline reinforced activated carbon | 46.82 and 192.52 | A. Bekhoukh (2022) [58] |
| Nitrogen-rich polyaniline-based activated carbon | 405.6 | [59] |
| Surfactant-modified clay | 15.58 | [60] |
| Polyaniline/clay nanocomposite (10 g CLAY, 1 g CLAY and pure PANI) | 42.02, 47.17 and 55.87 | This work |
Disclaimer/Publisher’s Note: The statements, opinions and data contained in all publications are solely those of the individual author(s) and contributor(s) and not of MDPI and/or the editor(s). MDPI and/or the editor(s) disclaim responsibility for any injury to people or property resulting from any ideas, methods, instructions or products referred to in the content. |
© 2025 by the authors. Licensee MDPI, Basel, Switzerland. This article is an open access article distributed under the terms and conditions of the Creative Commons Attribution (CC BY) license (https://creativecommons.org/licenses/by/4.0/).
Share and Cite
Khan, M.I.; Yahya, S.A.; ElKhaleefa, A.; Shigidi, I.; Ali, I.H.; Rehan, M.; Pirzada, A.M. Toxic Anionic Azo Dye Removal from Artificial Wastewater by Using Polyaniline/Clay Nanocomposite Adsorbent: Isotherm, Kinetics and Thermodynamic Study. Processes 2025, 13, 827. https://doi.org/10.3390/pr13030827
Khan MI, Yahya SA, ElKhaleefa A, Shigidi I, Ali IH, Rehan M, Pirzada AM. Toxic Anionic Azo Dye Removal from Artificial Wastewater by Using Polyaniline/Clay Nanocomposite Adsorbent: Isotherm, Kinetics and Thermodynamic Study. Processes. 2025; 13(3):827. https://doi.org/10.3390/pr13030827
Chicago/Turabian StyleKhan, Mohammad Ilyas, Saif Ahmed Yahya, Abubakr ElKhaleefa, Ihab Shigidi, Ismat Hassan Ali, Mohammad Rehan, and Abdul Majeed Pirzada. 2025. "Toxic Anionic Azo Dye Removal from Artificial Wastewater by Using Polyaniline/Clay Nanocomposite Adsorbent: Isotherm, Kinetics and Thermodynamic Study" Processes 13, no. 3: 827. https://doi.org/10.3390/pr13030827
APA StyleKhan, M. I., Yahya, S. A., ElKhaleefa, A., Shigidi, I., Ali, I. H., Rehan, M., & Pirzada, A. M. (2025). Toxic Anionic Azo Dye Removal from Artificial Wastewater by Using Polyaniline/Clay Nanocomposite Adsorbent: Isotherm, Kinetics and Thermodynamic Study. Processes, 13(3), 827. https://doi.org/10.3390/pr13030827