Article

An Analysis of a Cement Hydration Process Using Glass Waste from Household Appliances as a Supplementary Material

by
Karolina Bekerė
,
Jurgita Malaiškienė
* and
Jelena Škamat
Laboratory of Composite Materials, Faculty of Civil Engineering, Vilnius Gediminas Technical University, Sauletekio av. 11, 10223 Vilnius, Lithuania
*
Author to whom correspondence should be addressed.
Processes 2025, 13(3), 840; https://doi.org/10.3390/pr13030840
Submission received: 13 February 2025 / Revised: 26 February 2025 / Accepted: 11 March 2025 / Published: 13 March 2025
(This article belongs to the Special Issue Green Chemistry: From Wastes to Value-Added Products (2nd Edition))

Abstract

:
Due to the significant increase in consumerism, the amount of household appliance waste has been growing, particularly in the form of glass. This study explores the possibility of using this glass (HAGw) as a replacement additive in cement-based products. The article examines the properties of HAGw, including its chemical composition (XRF), mineral composition (XRD), particle morphology, and size distribution. Scanning electron microscopy (SEM) analysis revealed that HAGw particles could partially crystallise, forming needle-shaped minerals. When replacing 10%, 20%, and 30% of cement with dispersive HAGw, the rate of cement hydration remains unchanged; however, the amount of heat released decreases proportionally to the amount of waste used. Thermogravimetric analysis indicated that substituting a part of the cement with HAGw reduces the amount of portlandite over longer curing periods, indicating the pozzolanic activity of the glass, while the quantity of calcium silicate hydrates (C-S-H) remains similar to the control sample. In the microstructure of the samples, numerous agglomerates of glass particles are formed, increasing the porosity of the cement matrix and reducing its strength. However, over time, the surface of the glass particles begins to dissolve, leading to the formation of new cement hydrates that gradually fill the voids. This process enhances cement density, increases the ultrasonic pulse velocity, and improves compressive strength, particularly after 90 days, compared to the properties of the samples at 7 and 28 days of curing.

1. Introduction

Globally, a wide range of glass products are manufactured, encompassing glass utilised for packaging, household appliances, optical devices, and solar panels, among others, each exhibiting distinct properties. As glass production and consumption increase steadily on an annual basis, a concomitant increase in glass waste is observed [1,2,3]. Although simple household glass can be separated and recycled, a significant amount of other glass waste remains challenging to recycle sustainably [4,5,6]. This is due to the cost and time-consuming nature of the recycling procedure. Glass must undergo a processing temperature range of 1200–1400 °C to remove impurities such as dirt and rust from the final product [7].
However, if the glass waste is not properly sorted, it can become contaminated, affecting its reuse and negatively impacting the properties of the final product. It is indicated that up to 75% of all glass waste produced is landfilled, and its recycling rate is relatively low compared to other solid waste streams [7,8]. Therefore, the recycling of glass waste would both conserve landfill space and also preserve the natural resources utilised in the production of glass or cement and other materials. For instance, the recycling of a ton of glass would result in the conservation of approximately 590 kg of sand, 172 kg of limestone, 186 kg of soda ash, 3.4 kg of air pollutants, 19 litres of fuel, and 42 kilowatt-hours of energy [2]. Not recycling glass waste results in its accumulation in common landfills, posing a significant environmental threat worldwide. This is due to the non-biodegradable nature of glass, which undergoes a prolonged degradation period [9,10,11].
Glasses can be classified on the basis of their fundamental compositions as follows: soda-lime glasses, borosilicate glasses, lead glasses, barium glasses, and aluminium silicate glasses. According to reference [12], the chemical composition of glasses from various sources exhibits significant variations. The percentages of calcium, silicon, alumina, and magnesia differ considerably between different types of glass. In general, silica (65–75%) constitutes the predominant component of primary urban glass waste, which also contains sodium oxide (12–15%), calcium (6–12%), and alumina (0.5–5%) [13].
Ordinary household glass from undamaged bottles and jars can undergo indefinite recycling due to its relatively stable chemical composition and mechanical properties [14,15,16]. The fundamental components of glass manufacturing are sand, caustic soda, and limestone. It is notable that for every ton of recycled glass, including sand and soda, a corresponding ton of natural resources is conserved. However, the process of recycling glass is often hindered by the presence of contaminants and broken glass. This poses a significant threat to personnel safety and can also damage recycling equipment, leading to an increase in costs in the recycling process. The sorting of broken glass by colour is particularly challenging due to the different melting points of different glass colours [16,17]. For many decades, waste glass has been utilised worldwide primarily for the production of glass fibre and blown glass granules. However, these products have limited capacity to absorb the substantial amounts of glass waste generated on a global scale [9]. Research is underway worldwide on the recycling of non-containerized waste glass for various applications, including road asphalt pavement aggregates, concrete production aggregates, cement replacement, glass tile production, and glass fibre insulation materials [18,19]. Additionally, crushed glass waste can serve as a fluxing additive, reducing the firing temperature for ceramics. It can also be used as an additive for clay and glass aggregates in building construction and for the production of glass ceramics [20].
Regarding CO2 emissions from the production of building materials, cement has the largest footprint of CO2 due to the high temperatures used, up to 1400 °C, and the high CaCO3 content. Therefore, reducing the production of clinker is one of the global sustainability challenges of the 21st century [21,22]. Exacerbating climate change, the extraction of raw materials for concrete, including fine and coarse aggregate, unfortunately disrupts habitats and depletes natural resources, negatively impacting biodiversity and ecosystems [23]. Over the past decade, the advent of novel environmental regulations that tax waste emissions based on weight and type has prompted a concerted effort to produce cementitious materials that substitute part of the clinker and aggregates with alternative materials [17,20,24]. The alkali–silica reaction (ASR) exerts a substantial influence on the mechanical performance and longevity of various cement-based composites containing waste glass. Such preventive measures can be implemented by incorporating a suitable pozzolanic material [25,26,27].
One study [1] demonstrated that the incorporation of glass resulted in a decline in the concrete flexibility and density that is associated with the irregular form of the granules leading to increased friction between the particles and the penetration of air into the cementitious mixture. The weak bond between the glass particles and the cement matrix significantly reduced the mechanical properties of the concrete, such as its compressive, tensile, and flexural strengths [8,23,28]. However, there are also controversial studies, e.g., Corinaldesi et al. (2005) [26] have shown that macroscopically no detrimental effects were observed in mortars in which 30–70% of the fine sand was replaced by 100 μm particles of ground glass. On the contrary, a substantial improvement in the mechanical performance of the mortar was determined, resulting in a more robust mortar with increased compressive and flexural strength. This improvement can be attributed to the beneficial impact of glass waste on the microstructural properties of the mortar [12]. The incorporation of dispersive glass with a particle diameter smaller than 38 μm resulted in an enhancement in the reactivity of the glass, the increased compressive strength of the mortar, and reduced shrinkage. Furthermore, mortars formulated with glass particles ranging from 45 to 75 μm exhibited the highest levels of compressive strength (40 MPa after 90 days), the densest microstructures, and a reduced propensity for ASR [24].
Wright et al. [28] determined that the main factor that contributes to the reduction in concrete strength is the absence of adhesion between the cement matrix and the glass particles. Additionally, waste glass filler exhibits irregular shapes, dense surfaces, and high brittleness, which also contribute to the decline in concrete strength. However, Esmaeili and Oudah Al-Mwanes [10] found that replacing up to 30% of fine aggregate with glass increased the compressive strength of ultrahigh-performance concrete (UHPC) after 7, 28, and 56 days by 4%, 8%, and 15%, respectively. Furthermore, Yoo et al. [29] have demonstrated that UHPC incorporating waste glass can manifest remarkably robust mechanical properties. Consequently, a comprehensive and detailed investigation is imperative, given the controversial outcomes observed when diverse waste glass is utilised as a component of cementitious mixtures.
As the review of the works in the field shows, the obtained effect can vary when different types of glass waste are added to a cement-based material, which is largely due to differences in chemical composition, in phases composing the glass, and its fineness. However, data from studies on how specific waste glass from household appliances affects the properties of cement-based materials are still lacking in the scientific literature.
The present study focusses on the investigation and analysis of the properties of household appliance glass waste (HAGw) and its effect on the hydration of ordinary Portland cement and the physical and mechanical properties of the cement-based compositions. The potential implementation of HAGw in cement mixtures has significant environmental benefits, including a reduction in landfill areas and the adoption of more sustainable binder production technologies.

2. Materials and Methods
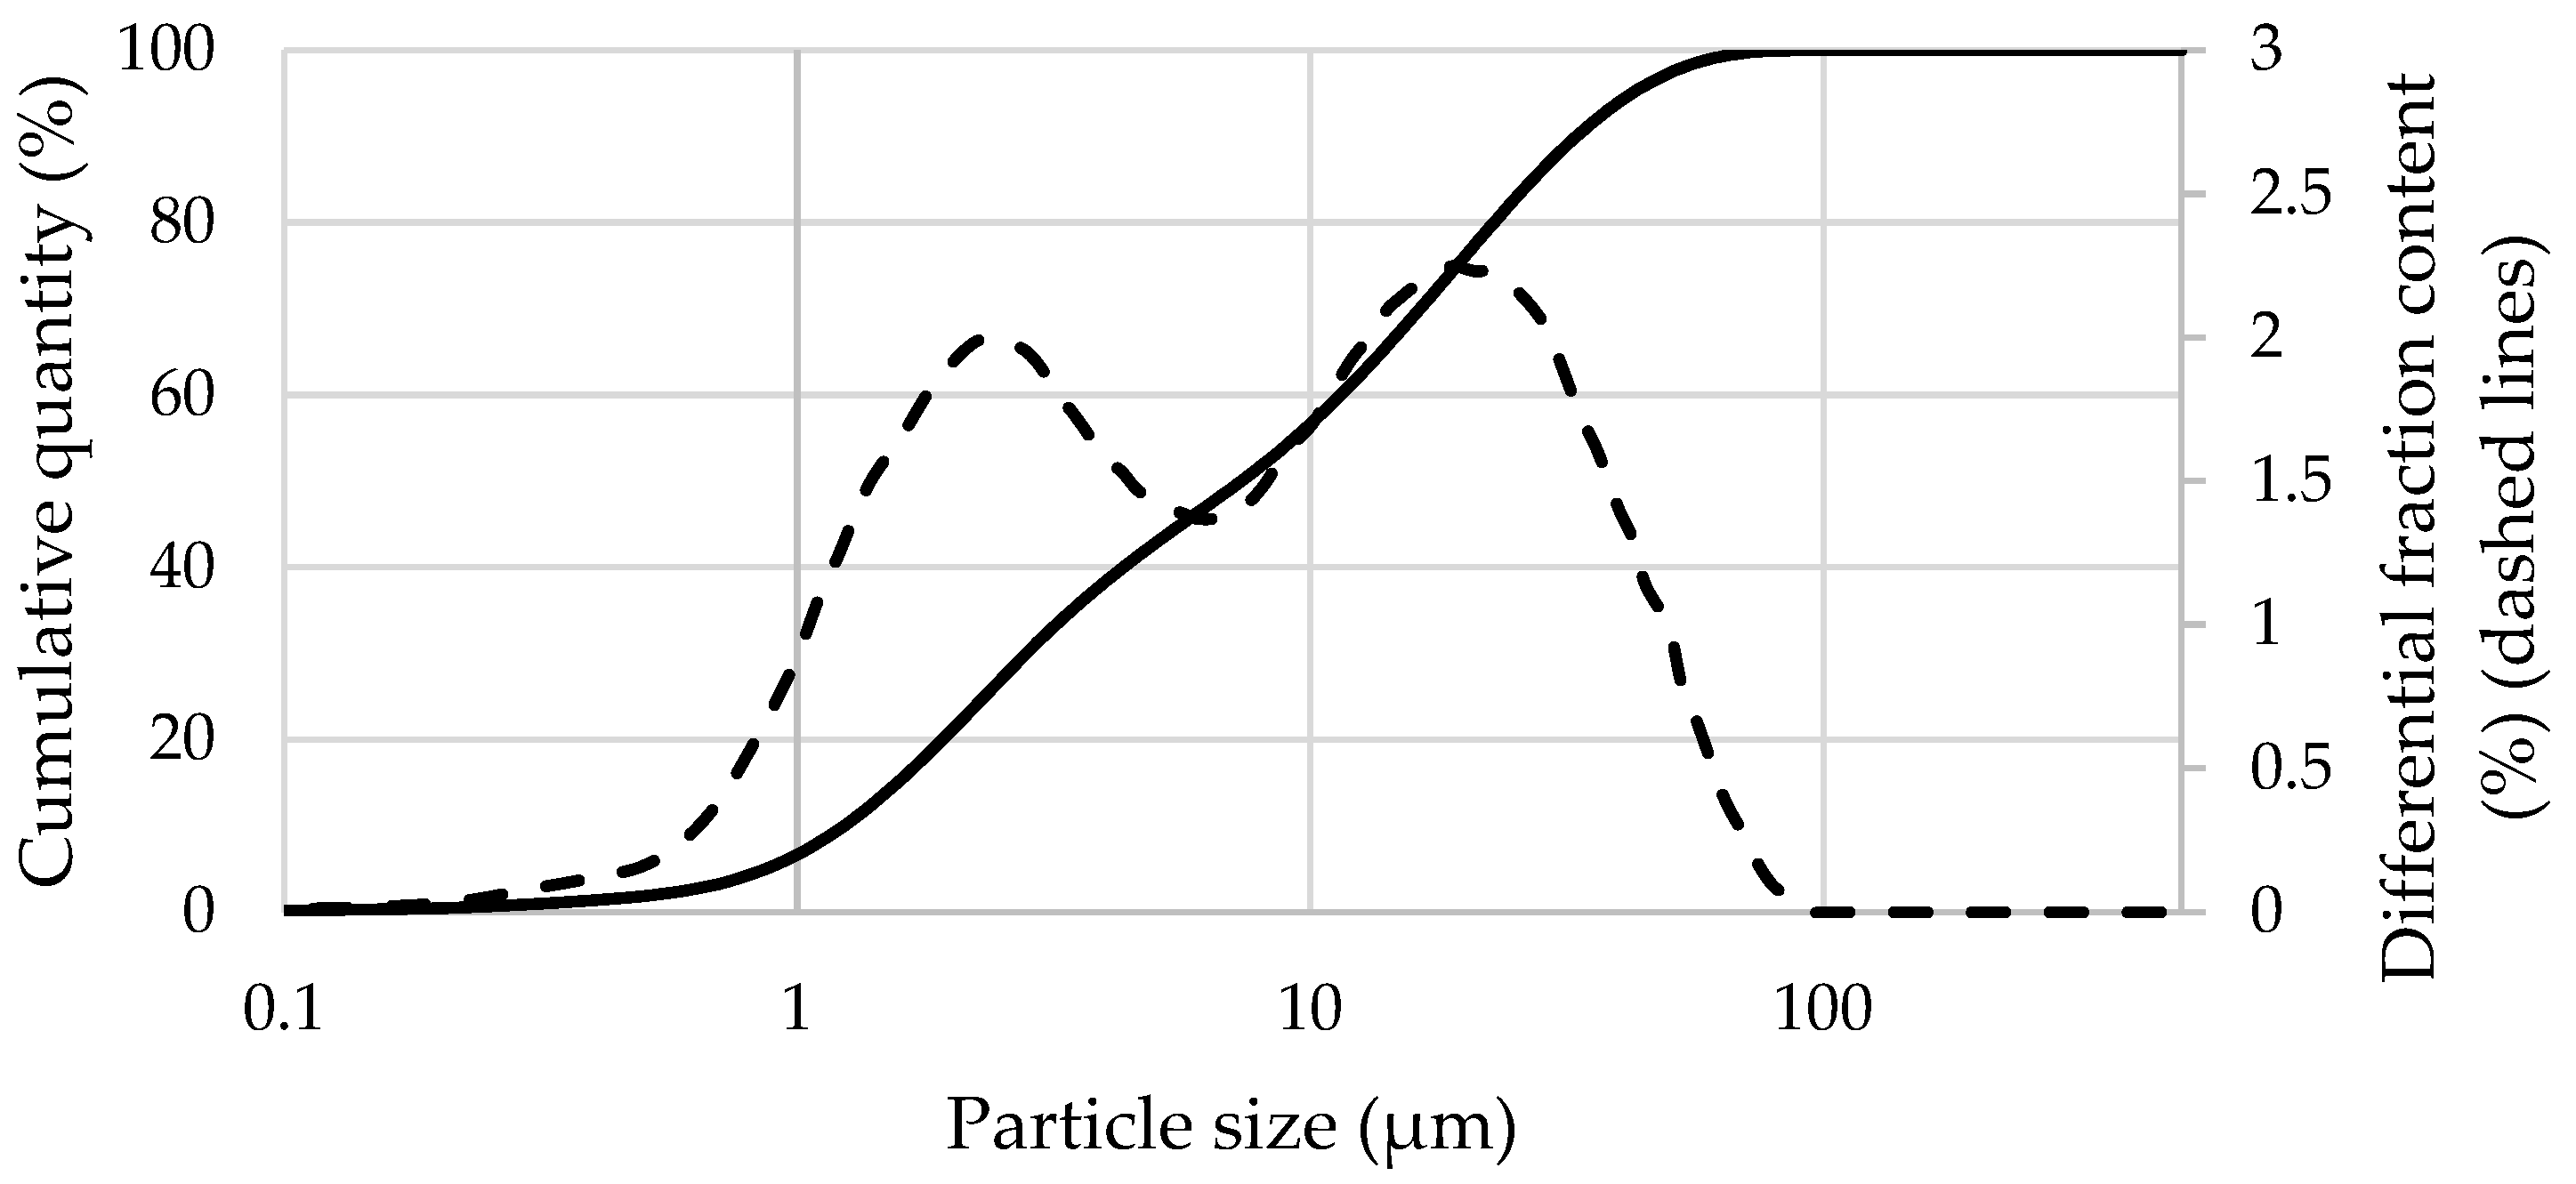
2.1. Materials

For the experiments, CEM I 42.5R cement from JSC Akmenės cementas (Akmenė, Lithuania) and HAGw (JSC Atliekų tvarkymo centras, Vilnius, Lithuania) were used. Table 1 presents the chemical composition of the materials used (by XRF; Rigaku Primus IV, Rigaku, Tokyo, Japan). The compressive strength of the cement at 28 days is 54.6 MPa, the initial setting time is 150 min and the final setting time is 200 min, the fineness according to Blaine is 3560 m2/kg, and the amount of water needed for a normal consistency is 25.4%.
The chemical composition analysis of HAGw showed that this glass is mainly composed of 81.4% SiO2, 6.51% Na2O, 3.74% CaO, 3.70% CO2, 2.91% Al2O3, 1.26% K2O, and 0.130% WO3. According to the high amount of SiO2, it should be a high-pozzolanity additive. However, glass containing crystalline phases is classified as having an intermediate pozzolanic activity, as the crystalline phase is less involved in chemical reactions compared to the amorphous phase [30]. XRD analysis (Figure 1a) showed that HAGw is mainly amorphous; however, low-expressed reflections attributable to crystalline tridymite (T) and sodium silicate (N) were identified as well. This was confirmed by SEM analysis (Figure 1b), which revealed many needle-shaped crystals growing from coarser HAGw particles of irregular form. According to the EDS analysis, the elemental composition of these needle-shaped crystals is as follows: 59.8% O, 12.2% Na, 24.2% Si, and 3.8% Ca.
The particle size of HAGw was analysed with the CILAS 1090 device (3P Instruments GmbH & Co., Odelzhausen, Germany) in water using the ultrasonic dispersion method. Figure 2 shows the distribution of the HAGw particle size with average particle sizes of 12.9 μm, d10 1.23 μm, d50 7.33 μm, and d90 33.0 μm. The distribution of particle sizes is bimodal, which means that there are many particles of about 2 µm in size and then about 23 µm. It is also evident from the SEM images that the glass waste particles are not of uniform size; some are larger, with fine particles adhering to them. The uneven particle size distribution may have occurred due to the crystalline phase in the glass, which requires greater energy to break down to a uniform size, similar to the particle size distribution in the amorphous phase.

2.2. Preparation of Samples

HAGw was used for cement mixtures, where cement was replaced with 0%, 10%, 20%, and 30% of glass waste. First, dry mixing was performed in a planetary mixer for 1 min followed by mixing for another 3 min with water. The same portion of water was used in all studied mixtures, maintaining a constant water-to-solid ratio (W/S) of 0.35. This W/S was selected because the calorimeter usage recommendations specify this amount of water for cementitious mixtures. For clarity, the same W/S was chosen to investigate other properties, because the workability of the resulting mixture was suitable for specimen preparation. After mixing, the spread of the mixture was determined immediately according to LST EN 12706 [31]. A steel cylinder with the inner dimensions of Ø = 3 cm and h = 5 cm was used. Figure 3 presents the results of a spread evaluation, revealing that, due to a higher specific surface area and needle-shaped growing crystals, the spread with a HAGw decreases by up to 25%. According to the authors of [32], at higher doses of glass waste, the particles intersected each other and a negative impact on flowability was caused by the particle morphology and roughness of their surface predominated, leading to a rise in friction resistance.
After the spread test, 40 × 40 × 40 mm3 specimens were formed, which were demoulded after 24 h of curing at a temperature of 20 ± 2 °C and a relative humidity of about 95%. The formed specimens were stored in water at a temperature of 20 ± 1 °C until the day of the test (for 7, 28, and 90 days).

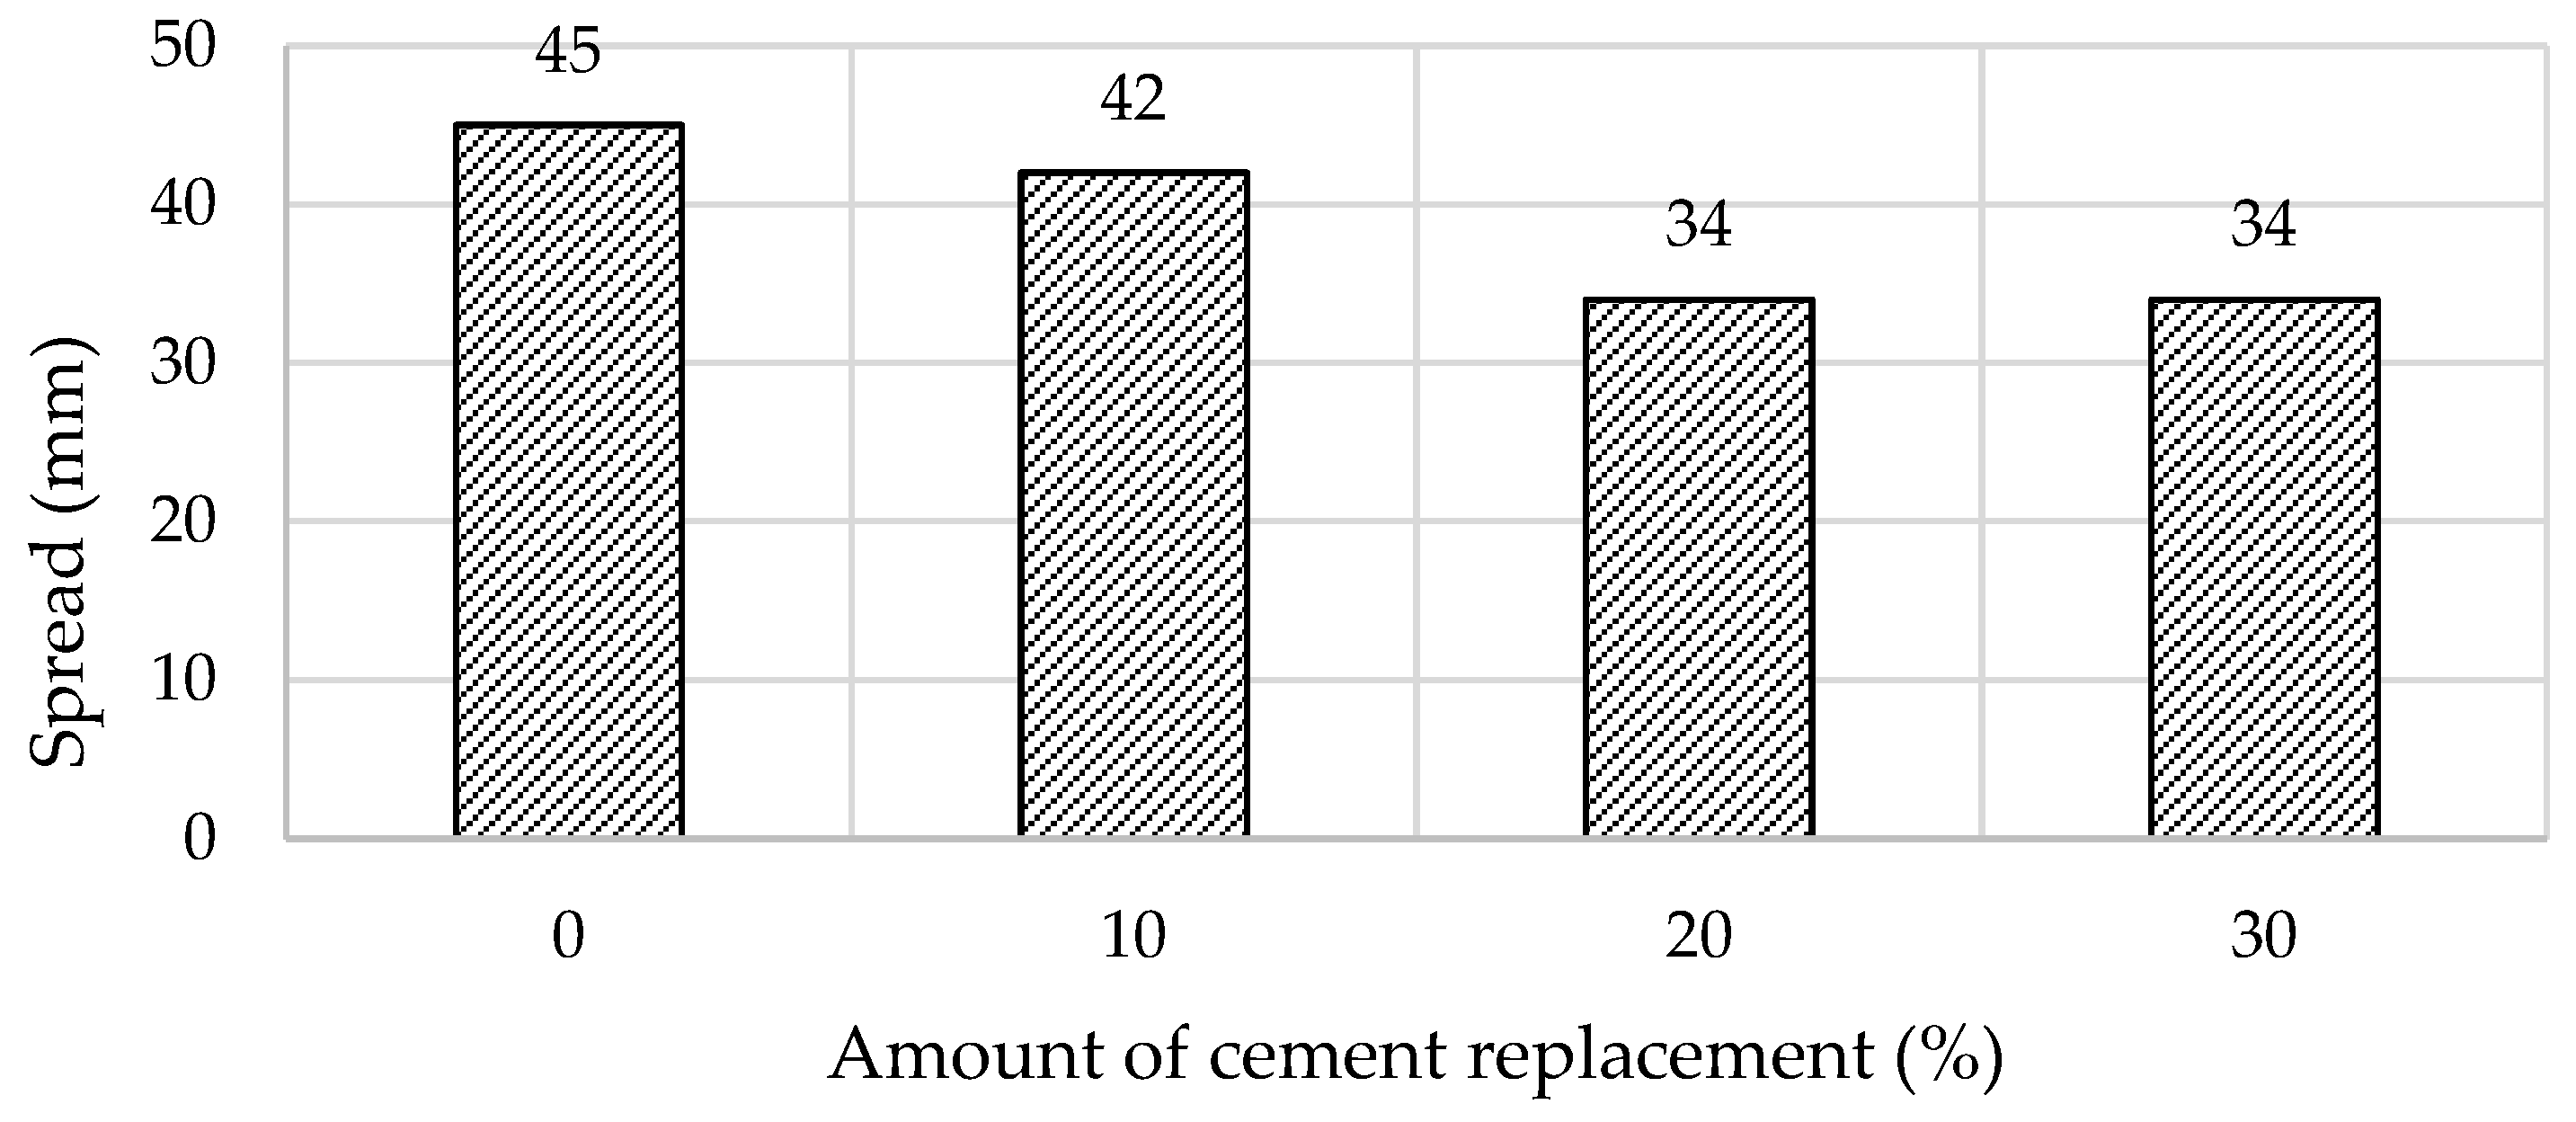
2.3. Methods Used for the Tests

Calorimetry analysis of the studied mixtures was conducted for 48 h using ToniCAL III equipment (Toni Technick GmBh, Berlin, Germany). A total of 100 g of dry material was tested and a W/S of 0.35 was maintained. Measurements were performed at a 20 ± 1 °C temperature.
The properties of the specimens were tested after 7, 28, and 90 days of curing using three samples of each studied composition. The density was calculated from the dimensions measured with a 0.01 mm accuracy and mass was measured with a 0.01 g accuracy. The method described in [33] was applied to determine the ultrasonic pulse velocity (UPV). The compressive strength of the samples was determined with the Tinius Olsen H200 KU press (Tinius Olsen, Orlando, FL, USA), in accordance with the LST EN 196-1 [34]. Furthermore, the index of pozzolanic activity IPA was calculated using Equations (1) and (2) [35]:
IPA = (Cs/Cref)∙100, %
where Cs is the value of the compressive strength of the studied sample, in MPa, and Csref is the compressive strength of the reference sample (C), in MPa.
IPAK = IPA/K, %
where IPAK is the index of pozzolanic activity recalculated for the same cement quantity, in %, IPA is the index of pozzolanic activity from Equation (1), in %, and K is the coefficient of cement mass portion in the studied composition (K = 0.7, 0.8, and 0.9).
Thermogravimetry (TG) and derivative thermogravimetry (DTG) analyses were conducted with the Perkin Elmer TGA 4000 equipment (Perkin Elmer, Waltham, MA, USA) using a platinum crucible. The test conditions were as follows: sample mass—~40–50 mg; heating medium—N2 gas; temperature interval for analysis—from room to 950 °C; and heating rate—10 °C/min.
The microstructure of the cement compositions cured for 7, 28, and 90 days was analysed by scanning electron microscopy (SEM) with a JEOL JSM-7600F instrument (JEOL, Tokyo, Japan). The fracture surface of the studied samples was analysed at an 8 mm working distance and a 10 kV accelerating voltage was applied. The samples were gold-coated by vacuum evaporation before analysis. Elemental microanalysis was performed using an energy dispersive spectrometer (EDS), the Inca Energy 350 (Oxford Instruments, Abingdon, UK), equipped with a Silicon Drift-type X-Max20 detector.
For the phase analysis of the compositions, a DRON-7 diffractometer was used (Bourevestnik, St. Petersburg, Russia) with an X-ray wavelength λ = 0.1541837 nm (Cu-Kα). The X-ray diffraction curves were recorded between a 4° and 60° 2θ angle under the following test parameters: a 30 kV voltage, a 15 mA current, a 0.02° scanning step, and an exposure time per step of 2 s.

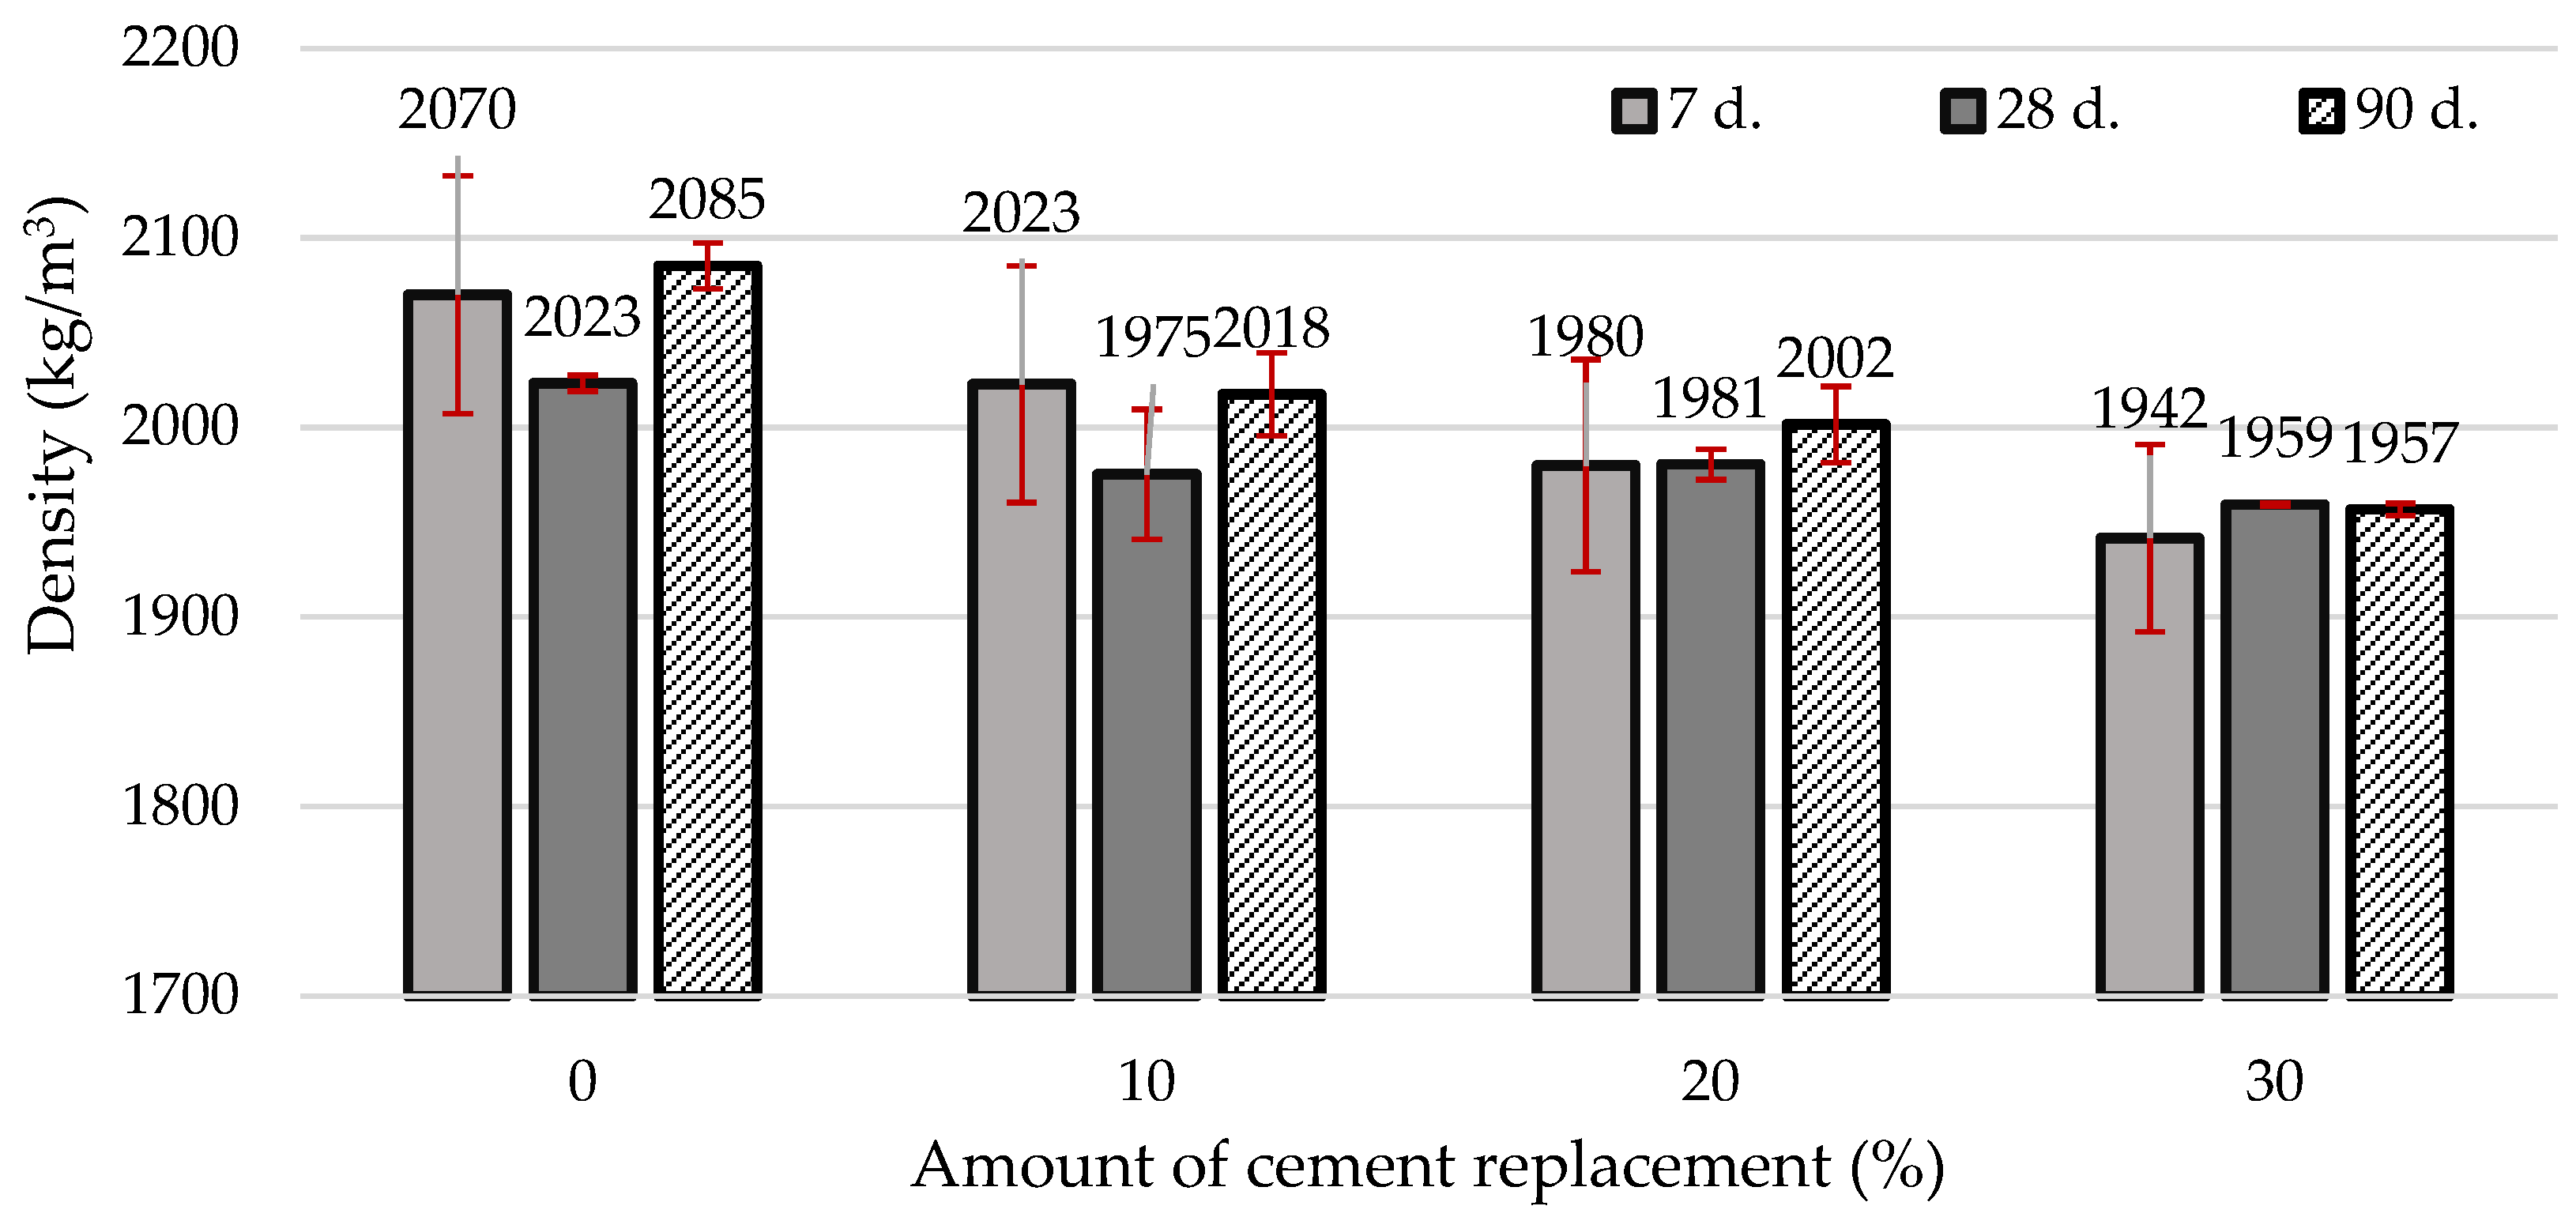
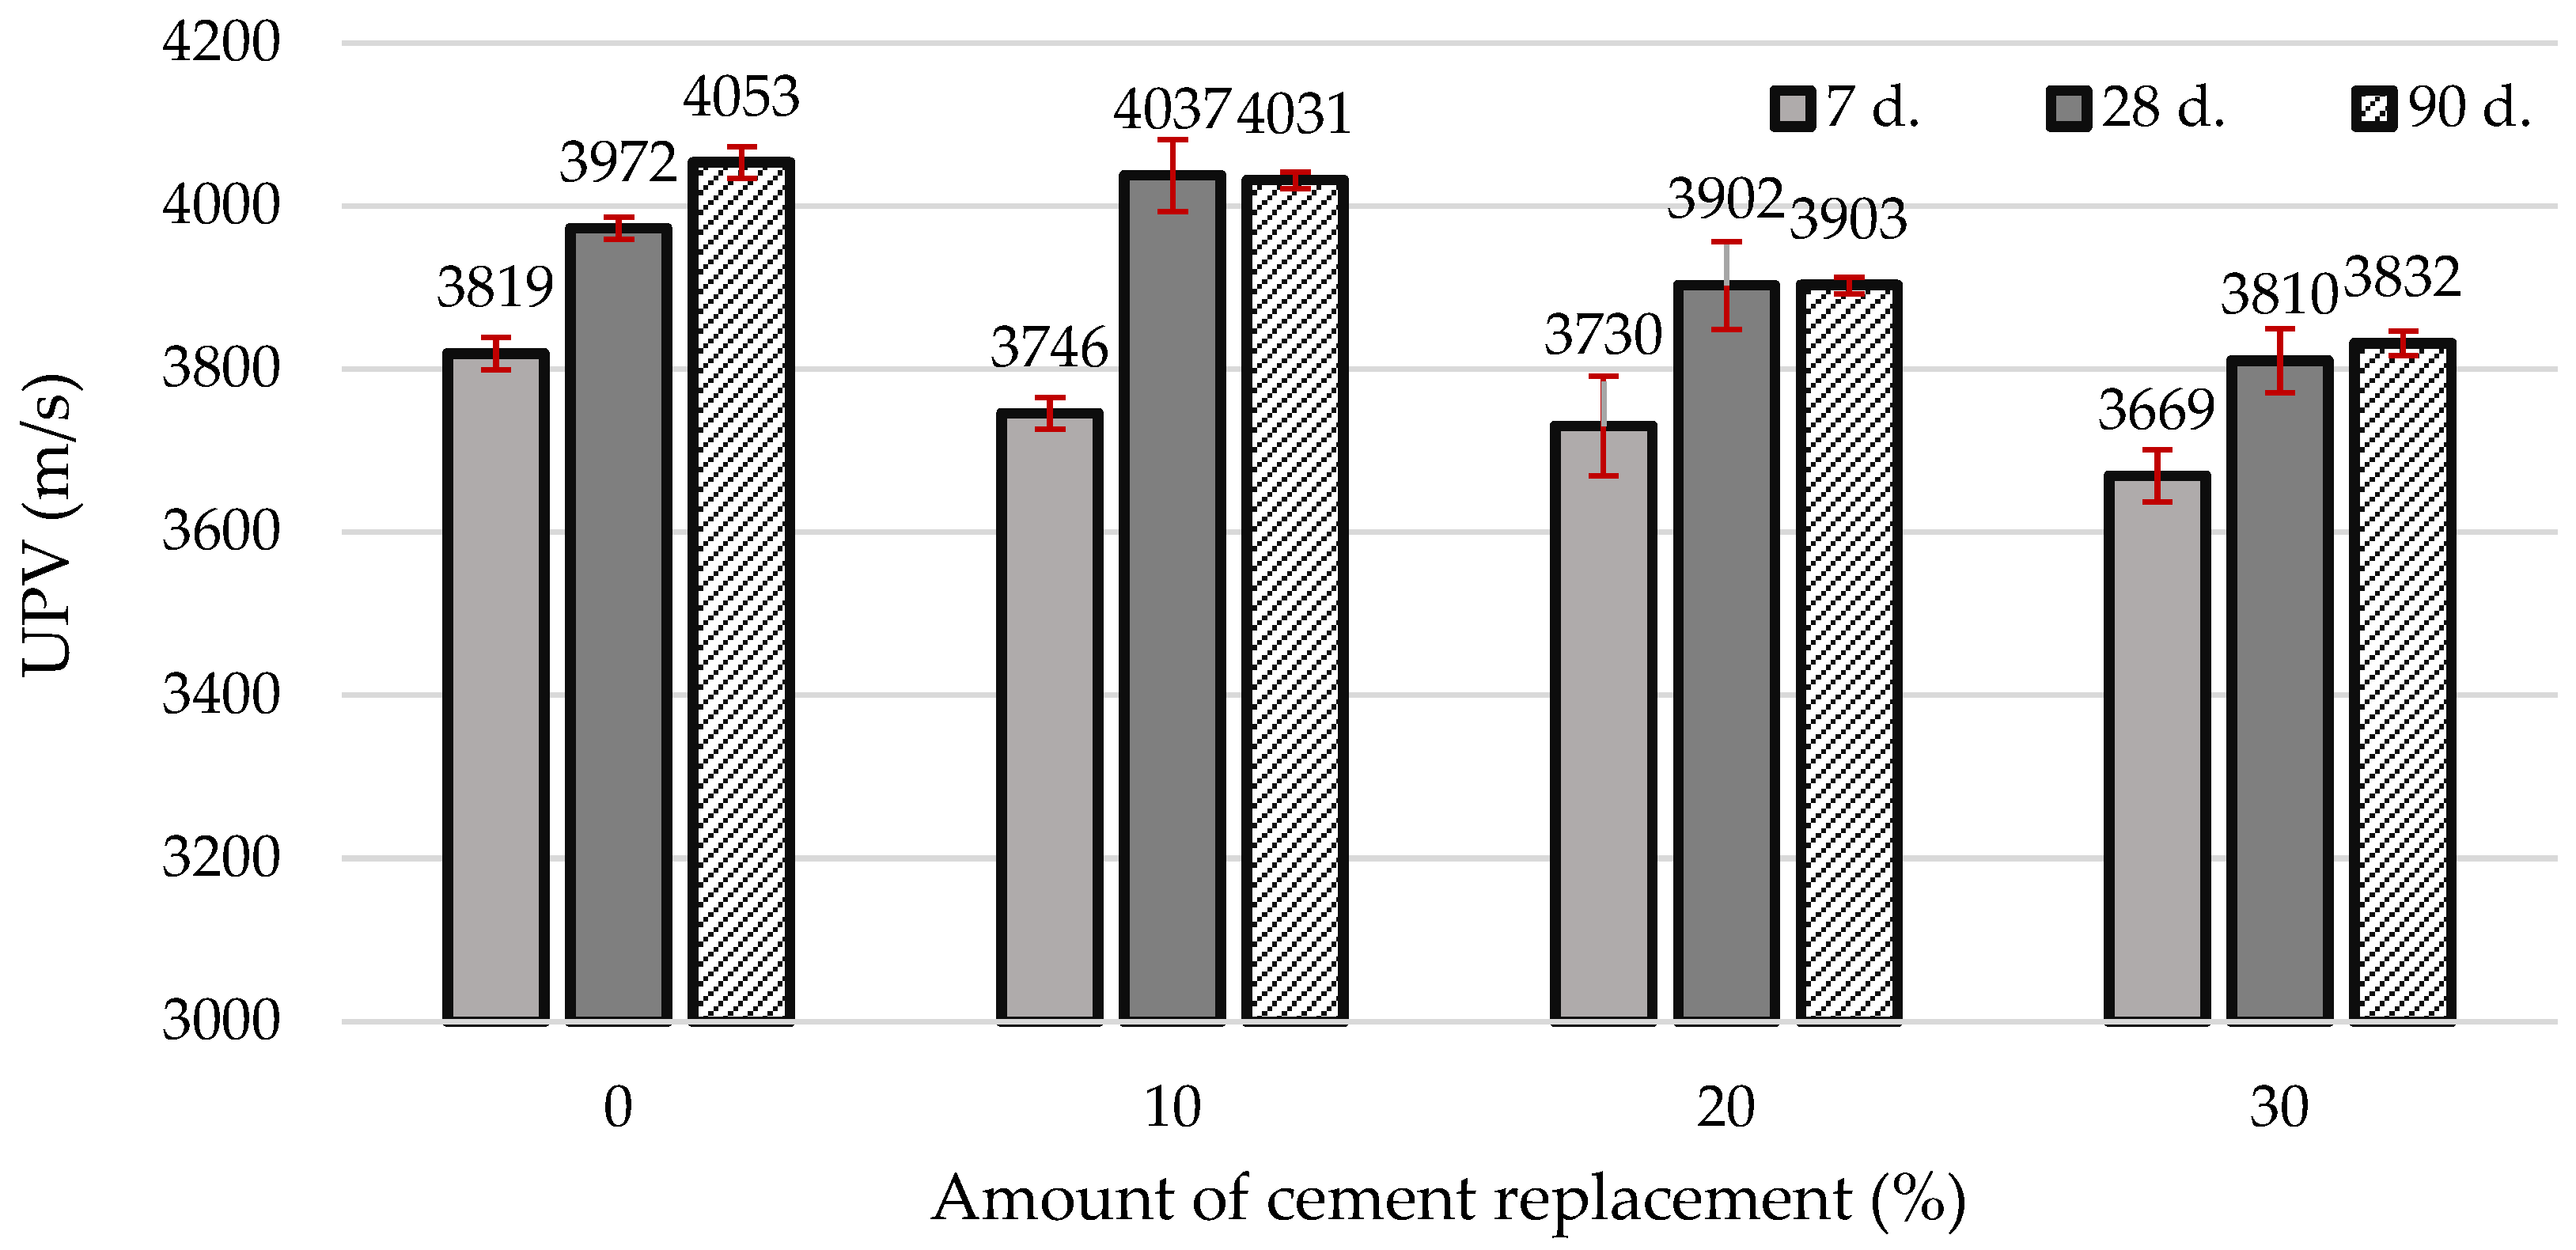
3. Results and Discussion

The results of calorimetry (Figure 4, Table 2) revealed that HAGw tends to accelerate cement hydration during the first curing days due to an amount of sodium compounds, which usually accelerate cement hydration, but this effect is not very significant. According to the works [36,37,38,39], the incorporation of alkalis based on sodium or potassium significantly modifies the hydration kinetics of Portland cement especially in the first 16 h. Elevated sodium compound concentrations reduce Ca2⁺ ion activity in the pore solution while simultaneously promoting the precipitation of Ca(OH)2 and enhancing the dissolution rate of tricalcium silicate (C3S), leading to an increased overall degree of hydration. KOH addition elevates the supersaturation of portlandite, thereby facilitating its nucleation and growth, and reduces the critical supersaturation threshold required for the nucleation of calcium–silicate–hydrate (C-S-H). In addition, the acceleration of cement hydration can be influenced by the high surface area of HAGw, because the particles need a higher amount of water, as shown in the decreased spread results (Figure 3).
The total heat released (Figure 4b) decreases in the HAGw samples due to the lower amount of cement; after 48 h, 10% of HAGw decreased the total heat released by 10%; however, 30% of HAGw decreased it by 23.4%. This shows that HAGw can have reactivity in the first days of hydration, especially when its amount is 20–30%. Greater differences in total heat released appear after a longer period of time. For example, after 12 h, the heat released by HAGw30 decreased by about 10% compared to the control sample; after 24 h, it decreased by about 17%; after 32 h, by about 20%; and after 48 h, by 23.4%. This means that during this period, the formation of portlandite decreases due to the significantly lower amount of cement. According to the author of [40], the heat released during cement hydration is primarily due to the reaction of tricalcium silicate (C3S), which produces calcium hydroxide, and the amount of heat generated is directly related to the amount of calcium hydroxide formed.
It was determined that HAGw reduces density and UPV by approximately 6%, regardless of the curing time of the samples (Figure 5 and Figure 6). When only 10% of the cement is replaced with HAGw, the change is minimal, the UPV after 28 days even being approximately 1.6% higher. The main reason for the decrease in density is due to the formation of glass particle agglomerates in the structure of the cement stone (Figure 7, Figure 8 and Figure 9). Usually, the density over time is similar or could increase due to cement hydration and the formation of different densities of C-S-H.
Comparing the microstructure of the reference and HAGw30 samples after 7 days of curing, no significant differences are observed (Figure 7a,b); the structure is quite dense and the plate-shaped crystals of the forming portlandite are visible. The main difference is the agglomerates of HAGw particles formed throughout the sample (Figure 7c,d), where increased amounts of voids can be seen, leading to a decrease in the sample density. In addition, these voids can create weak zones in the cement matrix, negatively affecting not only density but also mechanical properties [41]. After 28 days, the structure of both the control and HAGw30 samples becomes denser (Figure 8a,b). The agglomerates remain, but as the glass slowly dissolves, new crystals form (Figure 8c), which begin to fill the cavities, and the porosity in the areas of the agglomerates decreases (Figure 8d). After 90 days of curing, an even denser structure is observed, mainly composed of C-S-H (Figure 9a,b), and the areas of the agglomerates become scarcely visible, as during cement hydration, various forms of crystal hydrates grew, filling most of the voids (Figure 9c,d). Glass waste contains large amounts of silica, which reacts with calcium hydroxide to form additional C-S-H [42]. This pozzolanic reaction enhances the microstructure, making it denser and potentially increasing the material’s strength over time. The formation of C-S-H reduces the presence of large capillary pores, resulting in a denser and less porous structure. However, if the glass is not finely ground, it can act as an inert filler, reducing the overall reactivity and leaving voids [43].
These microstructural changes also determined the increase in compressive strength over a longer period (Figure 10). After 7 days of curing, the compressive strength compared to the control samples was similar to that of HAGw10 (62.7 MPa and 62.4 MPa). Further increasing the HAGw content to 20% and 30% resulted in compressive strength reductions of 11% and 21%, respectively. After 28 days of curing, due to the ongoing pozzolanic reaction, the compressive strength of the control samples and HAGw10 and HAGw20 was practically identical, with only an 11% lower strength observed in the HAGw30 samples; however, the production of such a binder would likely generate approximately 30% less CO2. After 90 days, the compressive strength of HAGw10 and HAGw20 was about 10% higher than that of the control sample, while HAGw30 was broadly similar to the control sample at 86.2 MPa. It is important to note that when using only cement, the compressive strength after 28 and 90 days remains similar, probably due to the use of rapid-hardening CEM I 42.5 R cement. However, when a portion of the cement is replaced with glass, which exhibits pozzolanic properties, the hydration process extends over a longer period. As the glass particles gradually dissolve, they fill the voids within the formed agglomerates, leading to a significant increase in strength over time. These trends are particularly evident when analysing the pozzolanic activity index IPA (Table 3), which clearly increases as curing time lengthens, with a particularly high IPAK index obtained when the compressive strength is calculated based on the same cement content.
X-ray analysis (Figure 11) showed that all samples contained similar crystal compounds portlandite and calcite, and the cement minerals alite and belite. When evaluating the portlandite content based on the intensity of the main curve’s maximum (34.09°), it can be seen that in all curing periods, the intensity of portlandite in the samples with HAGw is lower, and as curing time increases, the maximum of the main curves for alite and belite decrease, indicating an intense pozzolanic reaction.
A more precise analysis of the quantities of formed hydrates and carbonates was performed using the thermogravimetric analysis method (Figure 12 and Table 4).
Taking into account the overall mass losses, it can be observed that the largest mass losses occurred in the control samples after 28 and 90 days. The mass loss of HAGw30 approximately 18% after 90 days is very similar to the mass loss of the control samples after 28 days. The smallest mass losses, about 15%, were observed in HAGw30 after 7 and 28 days. The reduction in total mass loss in the HAGw30 samples is due to a significantly lower amount of portlandite (Table 4), which decomposes in a temperature range of 420–530 °C [35,44]. After 7, 28, and 90 days of curing, the portlandite content in the HAGw30 samples was found to be 26%, 36%, and 40%, respectively; lower, compared to the control samples. After 7 days of the curing of the samples, the difference was the smallest and was due to the 30% lower cement content. However, because of the intensification of the pozzolanic reaction with time, the portlandite content decreased further. Consequently, mass losses in the temperature interval of 110 °C to 320 °C become very similar, and when recalculated based on an equal cement content, the mass losses in HAGw30 samples are approximately 40% higher. In this temperature range, the decomposition of the C-S-H and C-A-S-H phases predominates, further confirming the occurrence of the pozzolanic reaction. After a longer curing period, the DTG curves shifted to the right (decomposing temperature increased from 117 °C up to 175 °C), and the newly formed crystalline hydrates decomposed at higher temperatures. This indicates that, as the curing time increases, a greater quantity of stable hydration products forms, which tends to become more crystalline and thermally stable, thus requiring higher temperatures for decomposition [45]. Additionally, during hydration, the pore structure becomes denser, reducing porosity, which hinders heat transfer. Such a more compact structure demands more energy (higher temperatures) to initiate mineral decomposition. Another contributing factor could be the formation of stronger chemical bonds between hydration products, which require more thermal energy to break, leading to the decomposition peak shifting to higher temperatures. For example, C-S-H exhibits a trend toward increased compositional homogeneity over time. Specifically, in simple ordinary Portland cement pastes, C-S-H initially shows a bimodal distribution in the early stages of hydration, which gradually transitions to a unimodal distribution as the hydration process progresses [46,47]. For similar reasons, the portlandite curve broadens after 90 days of curing of the samples. The amount of carbonates, which decompose in the temperature interval of 610–770 °C, is initially lower in the HAGw30 samples compared to the control sample, but it increases after 90 days.

4. Conclusions

It was determined that glass waste from household appliances is composed of the following main oxides: 81.4% SiO2, 6.5% Na2O, and 3.7% CaO; it comprises not only an amorphous phase, but also some crystalline tridymite and sodium silicate. The particles of dispersive HAGw have an irregular shape with growing needle-shaped crystals.
HAGw decreases the spread of cement paste by up to 25% due to the higher specific surface area, compared to cement, and the needle-shaped irregular particles, which leads to increased friction resistance and intersection with one another.
Calorimetry tests show that HAGw does not significantly accelerate cement hydration in the initial days, likely due to its sodium content. Despite some reactivity, HAGw reduces the total heat released because of the lower cement content in the cement paste. After 48 h, 30% HAGw resulted in a 23.4% decrease in heat release. This reduction is linked to decreased portlandite formation.
HAGw is a good pozzolanic additive due to its composition and average particle size of about 13 µm, but it could have a negative effect on the density, UPV, and compressive strength of cement stone due to the agglomeration of HAGw particles. Microstructure analysis reveals that, after 7 days of curing, both the control and HAGw30 samples exhibit a dense structure with plate-shaped portlandite crystals, although HAGw30 shows agglomerates of glass particles that create voids, reducing density and potentially weakening the cement matrix. After 28 days, the structure becomes denser as the glass dissolves and new crystals form, filling some of the voids. By 90 days, the structure is significantly denser, primarily composed of C-S-H, and the agglomerates are less visible, with the pozzolanic reaction enhancing the microstructure. After 90 days, the compressive strength of HAGw10 and HAGw20 was about 10% higher than that of the control sample.
Thermogravimetric analysis reveals that HAGw30 samples exhibit lower mass losses compared to the control samples, primarily due to a significantly reduced amount of portlandite. Over time, the pozzolanic reaction intensifies, further reducing portlandite content and increasing mass losses in the 110 °C to 320 °C range, predominantly due to the decomposition of the C-S-H and C-A-S-H phases. As curing progresses, the DTG curves shift rightward, indicating the formation of more stable, crystalline hydration products that require higher temperatures for decomposition. This is supported by the densification of the pore structure and the strengthening of chemical bonds between hydration products, which demand more thermal energy to break. These findings highlight the ongoing pozzolanic reaction and the development of a more thermally stable and compact structure in the HAGw30 samples over time.

Author Contributions

Conceptualization, K.B. and J.M.; methodology, K.B.; software, K.B.; validation, J.M. and J.Š.; formal analysis, K.B. and J.M.; investigation, K.B., J.M. and J.Š.; resources, K.B. and J.M.; data curation, K.B., J.M. and J.Š.; writing—original draft preparation, K.B. and J.M.; writing—review and editing, J.M. and J.Š.; visualisation, K.B., J.M. and J.Š.; supervision, J.M.; project administration, J.M. All authors have read and agreed to the published version of the manuscript.

Funding

This research received no external funding.

Data Availability Statement

All data are presented in the article.

Conflicts of Interest

The authors declare no conflicts of interest.

Abbreviations

The following abbreviations are used in this manuscript:
HAGwHousehold appliance glass waste
C-S-HCalcium silicate hydrates
C-A-S-HCalcium aluminium silicate hydrates
UPVUltrasound pulse velocity

References

  1. Hamada, H.; Alattar, A.; Tayeh, B.; Yahaya, F.; Thomas, B. Effect of Recycled Waste Glass on the Properties of High-Performance Concrete: A Critical Review. Case Stud. Constr. Mater. 2022, 17, e01149. [Google Scholar] [CrossRef]
  2. Premathilaka, K.K.W.; Liyanapathirana, D.S.; Leo, C.J.; Hu, P. Application of Recycled Waste Glass to Replace Traditional Quarried Aggregates: A Comprehensive Review. J. Build. Eng. 2024, 86, 108846. [Google Scholar] [CrossRef]
  3. Wang, H.Y. A Study of the Effects of LCD Glass Sand on the Properties of Concrete. Waste Manag. 2009, 29, 335–341. [Google Scholar] [CrossRef]
  4. Shayan, A.; Xu, A. Value-Added Utilisation of Waste Glass in Concrete. Cem. Concr. Res. 2004, 34, 81–89. [Google Scholar] [CrossRef]
  5. Mohajerani, A.; Vajna, J.; Cheung, T.H.H.; Kurmus, H.; Arulrajah, A.; Horpibulsuk, S. Practical Recycling Applications of Crushed Waste Glass in Construction Materials: A Review. Constr. Build. Mater. 2017, 156, 443–467. [Google Scholar] [CrossRef]
  6. Butler, J.H.; Hooper, P. Glass Waste. In Waste: A Handbook for Management; Academic Press: Cambridge, MA, USA, 2011; pp. 151–165. [Google Scholar] [CrossRef]
  7. Çelik, A.İ.; Özkılıç, Y.O.; Zeybek, Ö.; Karalar, M.; Qaidi, S.; Ahmad, J.; Burduhos-Nergis, D.D.; Bejinariu, C. Mechanical Behavior of Crushed Waste Glass as Replacement of Aggregates. Materials 2022, 15, 8093. [Google Scholar] [CrossRef]
  8. Surendran, H.; Akhas, P.K. Properties of High-Performance Concrete Incorporating Toughened Glass Waste Coarse Aggregate: An Experimental Study. Structures 2024, 60, 105897. [Google Scholar] [CrossRef]
  9. Dong, W.; Li, W.; Tao, Z. A Comprehensive Review on Performance of Cementitious and Geopolymeric Concretes with Recycled Waste Glass as Powder, Sand or Cullet. Resour. Conserv. Recycl. 2021, 172, 105664. [Google Scholar] [CrossRef]
  10. Esmaeili, J.; Oudah Al-Mwanes, A. A Review: Properties of Eco-Friendly Ultra-High-Performance Concrete Incorporated with Waste Glass as a Partial Replacement for Cement. Mater. Today Proc. 2021, 42, 1958–1965. [Google Scholar] [CrossRef]
  11. Su, N.; Chen, J.S. Engineering Properties of Asphalt Concrete Made with Recycled Glass. Resour. Conserv. Recycl. 2002, 35, 259–274. [Google Scholar] [CrossRef]
  12. Shi, C.; Zheng, K. A Review on the Use of Waste Glasses in the Production of Cement and Concrete. Resour. Conserv. Recycl. 2007, 52, 234–247. [Google Scholar] [CrossRef]
  13. Liu, Y.; Shi, C.; Zhang, Z.; Li, N. An Overview on the Reuse of Waste Glasses in Alkali-Activated Materials. Resour. Conserv. Recycl. 2019, 144, 297–309. [Google Scholar] [CrossRef]
  14. Mariaková, D.; Mocová, K.A.; Fořtová, K.; Pavlů, T.; Hájek, P. Waste Glass Powder Reusability in High-Performance Concrete: Leaching Behavior and Ecotoxicity. Materials 2021, 14, 4476. [Google Scholar] [CrossRef] [PubMed]
  15. Sobolev, K.; Türker, P.; Soboleva, S.; Iscioglu, G. Utilization of Waste Glass in ECO-Cement: Strength Properties and Microstructural Observations. Waste Manag. 2007, 27, 971–976. [Google Scholar] [CrossRef] [PubMed]
  16. Ferdous, W.; Manalo, A.; Siddique, R.; Mendis, P.; Zhuge, Y.; Wong, H.S.; Lokuge, W.; Aravinthan, T.; Schubel, P. Recycling of Landfill Wastes (Tyres, Plastics and Glass) in Construction—A Review on Global Waste Generation, Performance, Application and Future Opportunities. Resour. Conserv. Recycl. 2021, 173, 105745. [Google Scholar] [CrossRef]
  17. Rashid, K.; Hameed, R.; Ahmad, H.A.; Razzaq, A.; Ahmad, M.; Mahmood, A. Analytical Framework for Value Added Utilization of Glass Waste in Concrete: Mechanical and Environmental Performance. Waste Manag. 2018, 79, 312–323. [Google Scholar] [CrossRef]
  18. Saltan, M.; Öksüz, B.; Uz, V.E. Use of Glass Waste as Mineral Filler in Hot Mix Asphalt. Sci. Eng. Compos. Mater. 2015, 22, 271–277. [Google Scholar] [CrossRef]
  19. Kazmi, D.; Williams, D.J.; Serati, M. Waste Glass in Civil Engineering Applications—A Review. Int. J. Appl. Ceram. Technol. 2020, 17, 529–554. [Google Scholar] [CrossRef]
  20. Kazmi, D.; Serati, M.; Williams, D.J.; Qasim, S.; Cheng, Y.P. The Potential Use of Crushed Waste Glass as a Sustainable Alternative to Natural and Manufactured Sand in Geotechnical Applications. J. Clean. Prod. 2021, 284, 124762. [Google Scholar] [CrossRef]
  21. Stefanidou, M.; Kesikidou, F.; Konopisi, S.; Vasiadis, T. Investigating the Suitability of Waste Glass as a Supplementary Binder and Aggregate for Cement and Concrete. Sustainability 2023, 15, 3796. [Google Scholar] [CrossRef]
  22. Ibrahim, K.I.M. Recycled Waste Glass Powder as a Partial Replacement of Cement in Concrete Containing Silica Fume and Fly Ash. Case Stud. Constr. Mater. 2021, 15, e00630. [Google Scholar] [CrossRef]
  23. Stochino, F.; Alibeigibeni, A.; Zucca, M.; Valdes, M.; Concu, G.; Simoncelli, M.; Pisani, M.A.; Bernuzzi, C. Mechanical behavior of composite slabs with recycled concrete aggregates: A preliminary study. Structures 2024, 70, 107838. [Google Scholar] [CrossRef]
  24. De Castro, S.; De Brito, J. Evaluation of the Durability of Concrete Made with Crushed Glass Aggregates. J. Clean. Prod. 2013, 41, 7–14. [Google Scholar] [CrossRef]
  25. Chen, G.; Lee, H.; Young, K.L.; Yue, P.L.; Wong, A.; Tao, T.; Choi, K.K. Glass Recycling in Cement Production—An Innovative Approach. Waste Manag. 2002, 22, 747–753. [Google Scholar] [CrossRef]
  26. Corinaldesi, V.; Gnappi, G.; Moriconi, G.; Montenero, A. Reuse of Ground Waste Glass as Aggregate for Mortars. Waste Manag. 2005, 25, 197–201. [Google Scholar] [CrossRef]
  27. Tan, K.H.; Du, H. Use of Waste Glass as Sand in Mortar: Part I—Fresh, Mechanical and Durability Properties. Cem. Concr. Compos. 2013, 35, 109–117. [Google Scholar] [CrossRef]
  28. Wright, J.R.; Cartwright, C.; Fura, D.; Rajabipour, F. Fresh and Hardened Properties of Concrete Incorporating Recycled Glass as 100% Sand Replacement. J. Mater. Civ. Eng. 2014, 26, 1–11. [Google Scholar] [CrossRef]
  29. Yoo, D.Y.; You, I.; Zi, G. Effects of Waste Liquid–Crystal Display Glass Powder and Fiber Geometry on the Mechanical Properties of Ultra-High-Performance Concrete. Constr. Build. Mater. 2021, 266, 120938. [Google Scholar] [CrossRef]
  30. Higuchi, A.M.D.; Marques, M.G.; Ribas, L.F.; Vasconcelos, R.P. Use of glass powder residue as an eco-efficient supplementary cementitious material. Constr. Build. Mater. 2021, 304, 124640. [Google Scholar] [CrossRef]
  31. LST EN 12706; Adhesives-Test Methods for Hydraulic Setting Floor Smoothing and/or Levelling Compounds—Determination of Flow Characteristics. Lietuvos Standartizacijos Departamentas: Vilnius, Lithuania, 2004.
  32. Tian, Z.; Wang, Q.; Hou, S.; Shen, X. Effects of Multi-Sized Glass Fiber-Reinforced Polymer Waste on Hydration and Mechanical Properties of Cement-Based Materials. J. Build. Eng. 2025, 102, 112070. [Google Scholar] [CrossRef]
  33. Malaiskiene, J.; Costa, C.; Baneviciene, V.; Antonovic, V.; Vaiciene, M. The Effect of Nano SiO2 and Spent Fluid Catalytic Cracking Catalyst on Cement Hydration and Physical Mechanical Properties. Constr. Build. Mater. 2021, 299, 124281. [Google Scholar] [CrossRef]
  34. LST EN 196-1; Methods of Testing Cement—Part 1: Determination of Strength. Lietuvos Standartizacijos Departamentas: Vilnius, Lithuania, 2016.
  35. Malaiškienė, J.; Bekerė, K. Impact of Electronic Waste Glass on the Properties of Cementitious Materials. Buildings 2024, 14, 1218. [Google Scholar] [CrossRef]
  36. Way, S.J.; Shayan, A. Early Hydration of a Portland Cement in Water and Sodium Hydroxide Solutions: Composition of Solutions and Nature of Solid Phases. Cem. Concr. Res. 1989, 19, 759–769. [Google Scholar] [CrossRef]
  37. Huang, L.; Yang, Z. Early Hydration of Tricalcium Silicate with Potassium Hydroxide and Sulfate from Pore Solution and Solid View. Constr. Build. Mater. 2020, 230, 116988. [Google Scholar] [CrossRef]
  38. Wagner, D.; Bellmann, F.; Neubauer, J. Impact of KOH on the Interfacial Precipitation Rates of C-S-H during the Early Hydration of C3S. Cem. Concr. Res. 2021, 146, 106488. [Google Scholar] [CrossRef]
  39. Zheng, Z.; Yang, J.; Fu, H.; Liu, Q.; Li, Y.; Ma, X.; Zhang, P. The Coupling Impact of NaOH and NaNO3 on Hydration Process, Products and Sr2+ Adsorption Ability of the Major Phases in Portland Cement. Constr. Build. Mater. 2025, 459, 139813. [Google Scholar] [CrossRef]
  40. Beaudoin, J.; Odler, I. Hydration, Setting and Hardening of Portland Cement. In Lea’s Chemistry of Cement and Concrete; Butterworth-Heinemann: Oxford, UK, 2019; pp. 157–250. [Google Scholar] [CrossRef]
  41. Chen, C.; Habert, G.; Bouzidi, Y.; Jullien, A. Environmental Impact of Cement Production: Detail of the Different Processes and Cement Plant Variability Evaluation. J. Clean. Prod. 2010, 18, 478–485. [Google Scholar] [CrossRef]
  42. Shao, Y.; Lefort, T.; Moras, S.; Rodriguez, D. Studies on Concrete Containing Ground Waste Glass. Cem. Concr. Res. 2000, 30, 91–100. [Google Scholar] [CrossRef]
  43. Taha, B.; Nounu, G. Properties of Concrete Contains Mixed Colour Waste Recycled Glass as Sand and Cement Replacement. Constr. Build. Mater. 2008, 22, 713–720. [Google Scholar] [CrossRef]
  44. Mikhailenko, P.; Cassagnabère, F.; Emam, A.; Lachemi, M. Influence of Physico-Chemical Characteristics on the Carbonation of Cement Paste at High Replacement Rates of Metakaolin. Constr. Build. Mater. 2018, 158, 164–172. [Google Scholar] [CrossRef]
  45. Gabrovšek, R.; Vuk, T.; Kaučič, V. Evaluation of the Hydration of Portland Cement Containing Various Carbonates by Means of Thermal Analysis. Acta Chim. Slov. 2006, 53, 159–165. [Google Scholar]
  46. Richardson, I.G.; Groves, G.W. Microstructure and Microanalysis of Hardened Ordinary Portland Cement Pastes. J. Mater. Sci. 1993, 28, 265–277. [Google Scholar] [CrossRef]
  47. Richardson, I.G. Tobermorite/Jennite- and Tobermorite/Calcium Hydroxide-Based Models for the Structure of C-S-H: Applicability to Hardened Pastes of Tricalcium Silicate, β-Dicalcium Silicate, Portland Cement, and Blends of Portland Cement with Blast-Furnace Slag, Metakaolin, or Silica Fume. Cem. Concr. Res. 2004, 34, 1733–1777. [Google Scholar] [CrossRef]
Figure 1. The X-ray pattern (a) (T—tridymite, N—sodium silicate) and SEM image (b) (magnification 5000) of HAGw.
Processes 13 00840 g001
Figure 2. Particle size distribution of HAGw.
Processes 13 00840 g002
Figure 3. The spread of cement pastes with HAGw.
Processes 13 00840 g003
Figure 4. The impact of the amount of HAGw on the heat flow (a) and the total heat released (b) of the binder.
Processes 13 00840 g004
Figure 5. The impact of the amount of HAGw on cement stone density after 7, 28, and 90 days.
Processes 13 00840 g005
Figure 6. The impact of the amount of HAGw on the UPV after 7, 28, and 90 days.
Processes 13 00840 g006
Figure 7. The impact of HAGw on the microstructure of cement stone after 7 days: (a) control sample (×3000), (b) HAGw30 (×3000), (c) HAGw30 (×300), and (d) agglomerates in HAGw30 (×3000).
Processes 13 00840 g007
Figure 8. The impact of HAGw on the microstructure of cement stone after 28 days: (a) control sample (×3000), (b) HAGw30 (×1000), (c) HAGw30 (×30,000), and (d) agglomerates in HAGw30 (×3000).
Processes 13 00840 g008
Figure 9. The impact of HAGw on the microstructure of cement stone after 90 days: (a) control sample (×3000), (b) HAGw30 (×3000), (c) HAGw30 (×250), and (d) agglomerates in HAGw30 (×3000).
Processes 13 00840 g009
Figure 10. The impact of HAGw content on compressive strength values at 7, 28, and 90 days.
Processes 13 00840 g010
Figure 11. XRD patterns of samples C, HAGw10, HAGw20, and HAGw30 (P—portlandite, C—calcite, A—alite, B—belite) after 7, 28, and 90 days.
Processes 13 00840 g011
Figure 12. TG (a) and DTG (b) curves at 7, 28, and 90 days.
Processes 13 00840 g012
Table 1. Chemical composition of raw materials.
MaterialsCaOSiO2SO3Al2O3Fe2O3MgOK2ONa2OP2O5SrOTiO2BaOCO2ClZrO2WO3ZnO
Cement63.4202.734.573.463.711.300.14--0.320.06----0.01
HAGw3.7481.40.042.910.050.031.266.510.010.0050.020.033.700.080.050.13-
Table 2. The heat and time of hydration of the tested cement samples.
Paste
Designation
Time of the Second Maximum (h)Heat After Hours of Hydration (J/g)
12243648
C9.45120.4236.8302.8352.5
HAGw109.79105.4211.7271.8317.2
HAGw209.4396.3192.6248.4291.5
HAGw309.3986.8176.1229.3270.1
Table 3. IPA (IPAK) of hardened cement samples, %.
Amount of Replaced Cement (%)After 7 DaysAfter 28 DaysAfter 90 Days
1099.5 (110.6)99.4 (110.5)109.8 (122.0)
2089.2 (111.4)99.2 (124.0)108.8 (136.0)
3078.8 (112.6)89.0 (127.1)98.1 (140.0)
Table 4. Mass loss, in %, in decomposition temperature ranges and amount of CH after 7, 28, and 90 days of curing.
Mark110–170 °C, %180–320 °C, %110–350 °C, % at Equal
Cement Content
420–530 °C, %CH Content in
Sample, %
CH Content at Equal
Cement Content, %
At 610–770 °C, %
After 7 days
C3.033.166.194.0016.4416.442.12
HAGw303.122.968.692.9612.1717.381.41
After 28 days
C2.753.766.514.4218.1718.171.96
HAGw302.853.599.202.8311.6316.621.79
After 90 days
C2.835.178.003.7315.3315.332.25
HAGw302.835.0211.212.269.2913.273.4
Disclaimer/Publisher’s Note: The statements, opinions and data contained in all publications are solely those of the individual author(s) and contributor(s) and not of MDPI and/or the editor(s). MDPI and/or the editor(s) disclaim responsibility for any injury to people or property resulting from any ideas, methods, instructions or products referred to in the content.

