Abstract
Small nuclear power reactors have small core dimensions, frequent power changes, and more severe power distortion compared to nuclear power stations. However, their core has fewer measurement points, making it difficult to observe their core power distribution. High-precision physical calculation programs can accurately calculate the core power distribution, but the real-time performance of the calculation is poor, which is not conducive to online use. In this study, based on physical computing programs, the power distribution spectrum library of small nuclear power reactors under different operating conditions is calculated, and artificial intelligence algorithms are designed. A data-driven model for the proxy relationship between operating state parameters and core power distribution is trained and constructed to achieve rapid calculation and online support of core power distribution, which improves the level of online safety supervision of small power reactors. Numerical experiments show that this method has high accuracy and good robustness, and can meet the requirements of small nuclear power reactor operation safety support. This research is based on a data-driven proxy model and has achieved fast computation of power distribution in the fuel cores of small modular reactors. It addresses the issue of insufficient real-time performance of high-precision physical programs and has important significance for the safe operation of reactors.
1. Introduction
Compared to onshore nuclear power plants, the core size of marine pressurized water reactors is smaller. In order to meet the maneuverability requirements of ships, the operating conditions change more frequently, resulting in more severe distortion of the core power distribution [1,2]. Therefore, the core operation process requires more focused supervision. However, due to limitations such as guarantee conditions, power distribution measurement points are usually not set up inside the core of marine reactors, or only a small number of measurement points are set up, making it difficult to accurately control the power distribution of the core [3,4,5]. Large scale high-precision physical computing programs can accurately calculate the power distribution of the core based on its structure and state parameters, but usually require a large amount of computing resources and a long computing time, which is not conducive to online use [6,7].
With the development of computer technology, data-driven and artificial intelligence technology have caused a series of technological revolutions in various industries and spawned the concept of new engineering. In the field of reactor physics calculation, data-driven and artificial intelligence solutions have also been gradually proposed by scholars and have received extensive attention [8,9,10,11]. There are more and more studies on the application of artificial intelligence in core power calculation. Many studies have not been limited to simple machine learning; it has begun to be used in combination with some optimization algorithms, and the focus of application has also diversified.
In recent years, a physical information-driven neural network algorithm (PINN) has been proposed [12,13,14]. After this method was proposed, it attracted the attention of many scholars in the field of reactor physics analysis, and many researchers continue to improve and optimize this method. Liu Dong et al. [15] have tried to solve the multi-dimensional neutron diffusion equation by using the neural network algorithm driven by physical information, and combined a series of accelerated convergence measures and efficient parallel search technology of the effective multiplication coefficient (keff), and finally obtained some high-precision calculation results for the above-mentioned equation. Wang Jiangyu et al. [16] started from another physical principle and considered the non-smoothness of the neutron diffusion equation. Based on this, a conservative physical information-driven neural network algorithm (cPINN) was introduced. By setting other conservation constraints, the application scope of the algorithm was expanded, and the neutron diffusion equation in inhomogeneous media was solved in the proton domain of different materials. Yang Yu et al. [17] proposed a data-driven physical information-driven neural network algorithm (DEPINN) for solving eigenvalue problems in nuclear physics, especially the eigenvalue problem of neutron diffusion. To a certain extent, the technical innovation has been carried out, and the training accuracy and efficiency of neural networks have been improved. However, compared with traditional neural networks, a large amount of data needed to be provided, which has been reduced. Prantikos Konstantinos et al. [18] used the neural network algorithm driven by physical information to change the other research direction. The purpose is to access the reactor digital twin technology and solve the neutron diffusion equation under point reactor dynamics. It is clear that the neural network algorithm driven by physical information has great advantages in computational efficiency. Compared with the traditional numerical solution method, PINN does not need to spend a lot of time on dividing more complex networks, and provides two aspects of optimization, namely, irregular problems and high-dimensional problems. It provides a more efficient way to solve these two problems. Elhareef Mohamed H et al. [19] solved the diffusion equations of the mono-energetic group and multi-energetic group based on the neural network algorithm driven by physical information. The error of the results obtained on the mono-energetic group and multi-energetic group is 15 times, which needs further improvement. For the physical information-driven neural network algorithm, Kharazmi Ehsand et al. [20] further developed a more accurate PINN model, called the deep machine learning technology hp-VPINN model. This model was developed by Kharazmi Ehsand based on the subdomain Petrov Galerkin method [21]. The combination of the physical information-driven neural network algorithm and this method greatly improves the accuracy of its calculation. The results of this study have outstanding practicability. Finally, on the basis of the above development, Zeng Fulin et al. [22] mainly used the deep machine learning technology hp-VPINN model developed by Kharazmi Ehsand et al. [6] and combined the model with the hyperparameter self-optimization technology in the whale optimization algorithm to realize the solution of different equations of a single–double-group and single-multi medium. There are three main types, namely, the neutron diffusion equation of single-energy single-medium, single-energy multi-medium, and double-group multi-medium. Similar to the main contribution of Yang Yu, they are all ways to achieve higher prediction accuracy with fewer training data. This improvement is to achieve a high-fidelity output of the whole reactor neutron flux solution.
The above research shows that the data-driven method has been widely studied in the field of core physics calculation, and has achieved considerable results. The data-driven core power distribution calculation proxy model has a good theoretical basis. The core physics surrogate model calculation method based on data-driven and artificial intelligence is a bridge-type calculation method based on a high-precision and high-fidelity physics calculation program. It can not only ensure certain calculation accuracy, but also achieve fast real-time calculation. It is a solution to the problem of the high-precision core physics calculation program being difficult to synchronize with the actual operation process of the reactor.
Traditional machine learning methods rely on a large amount of labeled data and have insufficient generalization ability, while physics-driven models (such as PINN) face difficulties in converging under complex boundary conditions. In this study, by integrating the prior knowledge from the spectrum library and data augmentation technology, a surrogate model suitable for the multi-dimensional power distribution of small reactors was constructed. This significantly reduces the demand for training data and compensates for the deficiencies of traditional methods.
In this paper, based on the core power distribution data under different working conditions obtained by core physical calculation, the core power distribution data spectrum library is constructed and used as the sample library. The data-driven core power distribution calculation agent model based on a neural network is designed for online supervision of a marine small pressurized water reactor core. The content is organized as follows. The design of the core power distribution calculation agent model is introduced in Section 2. In Section 3, the construction and training of the sample set are introduced. The tests and verification of the model are proposed in Section 4. Finally, conclusions are summarized in Section 5.
2. Core Power Distribution Calculation Agent Model
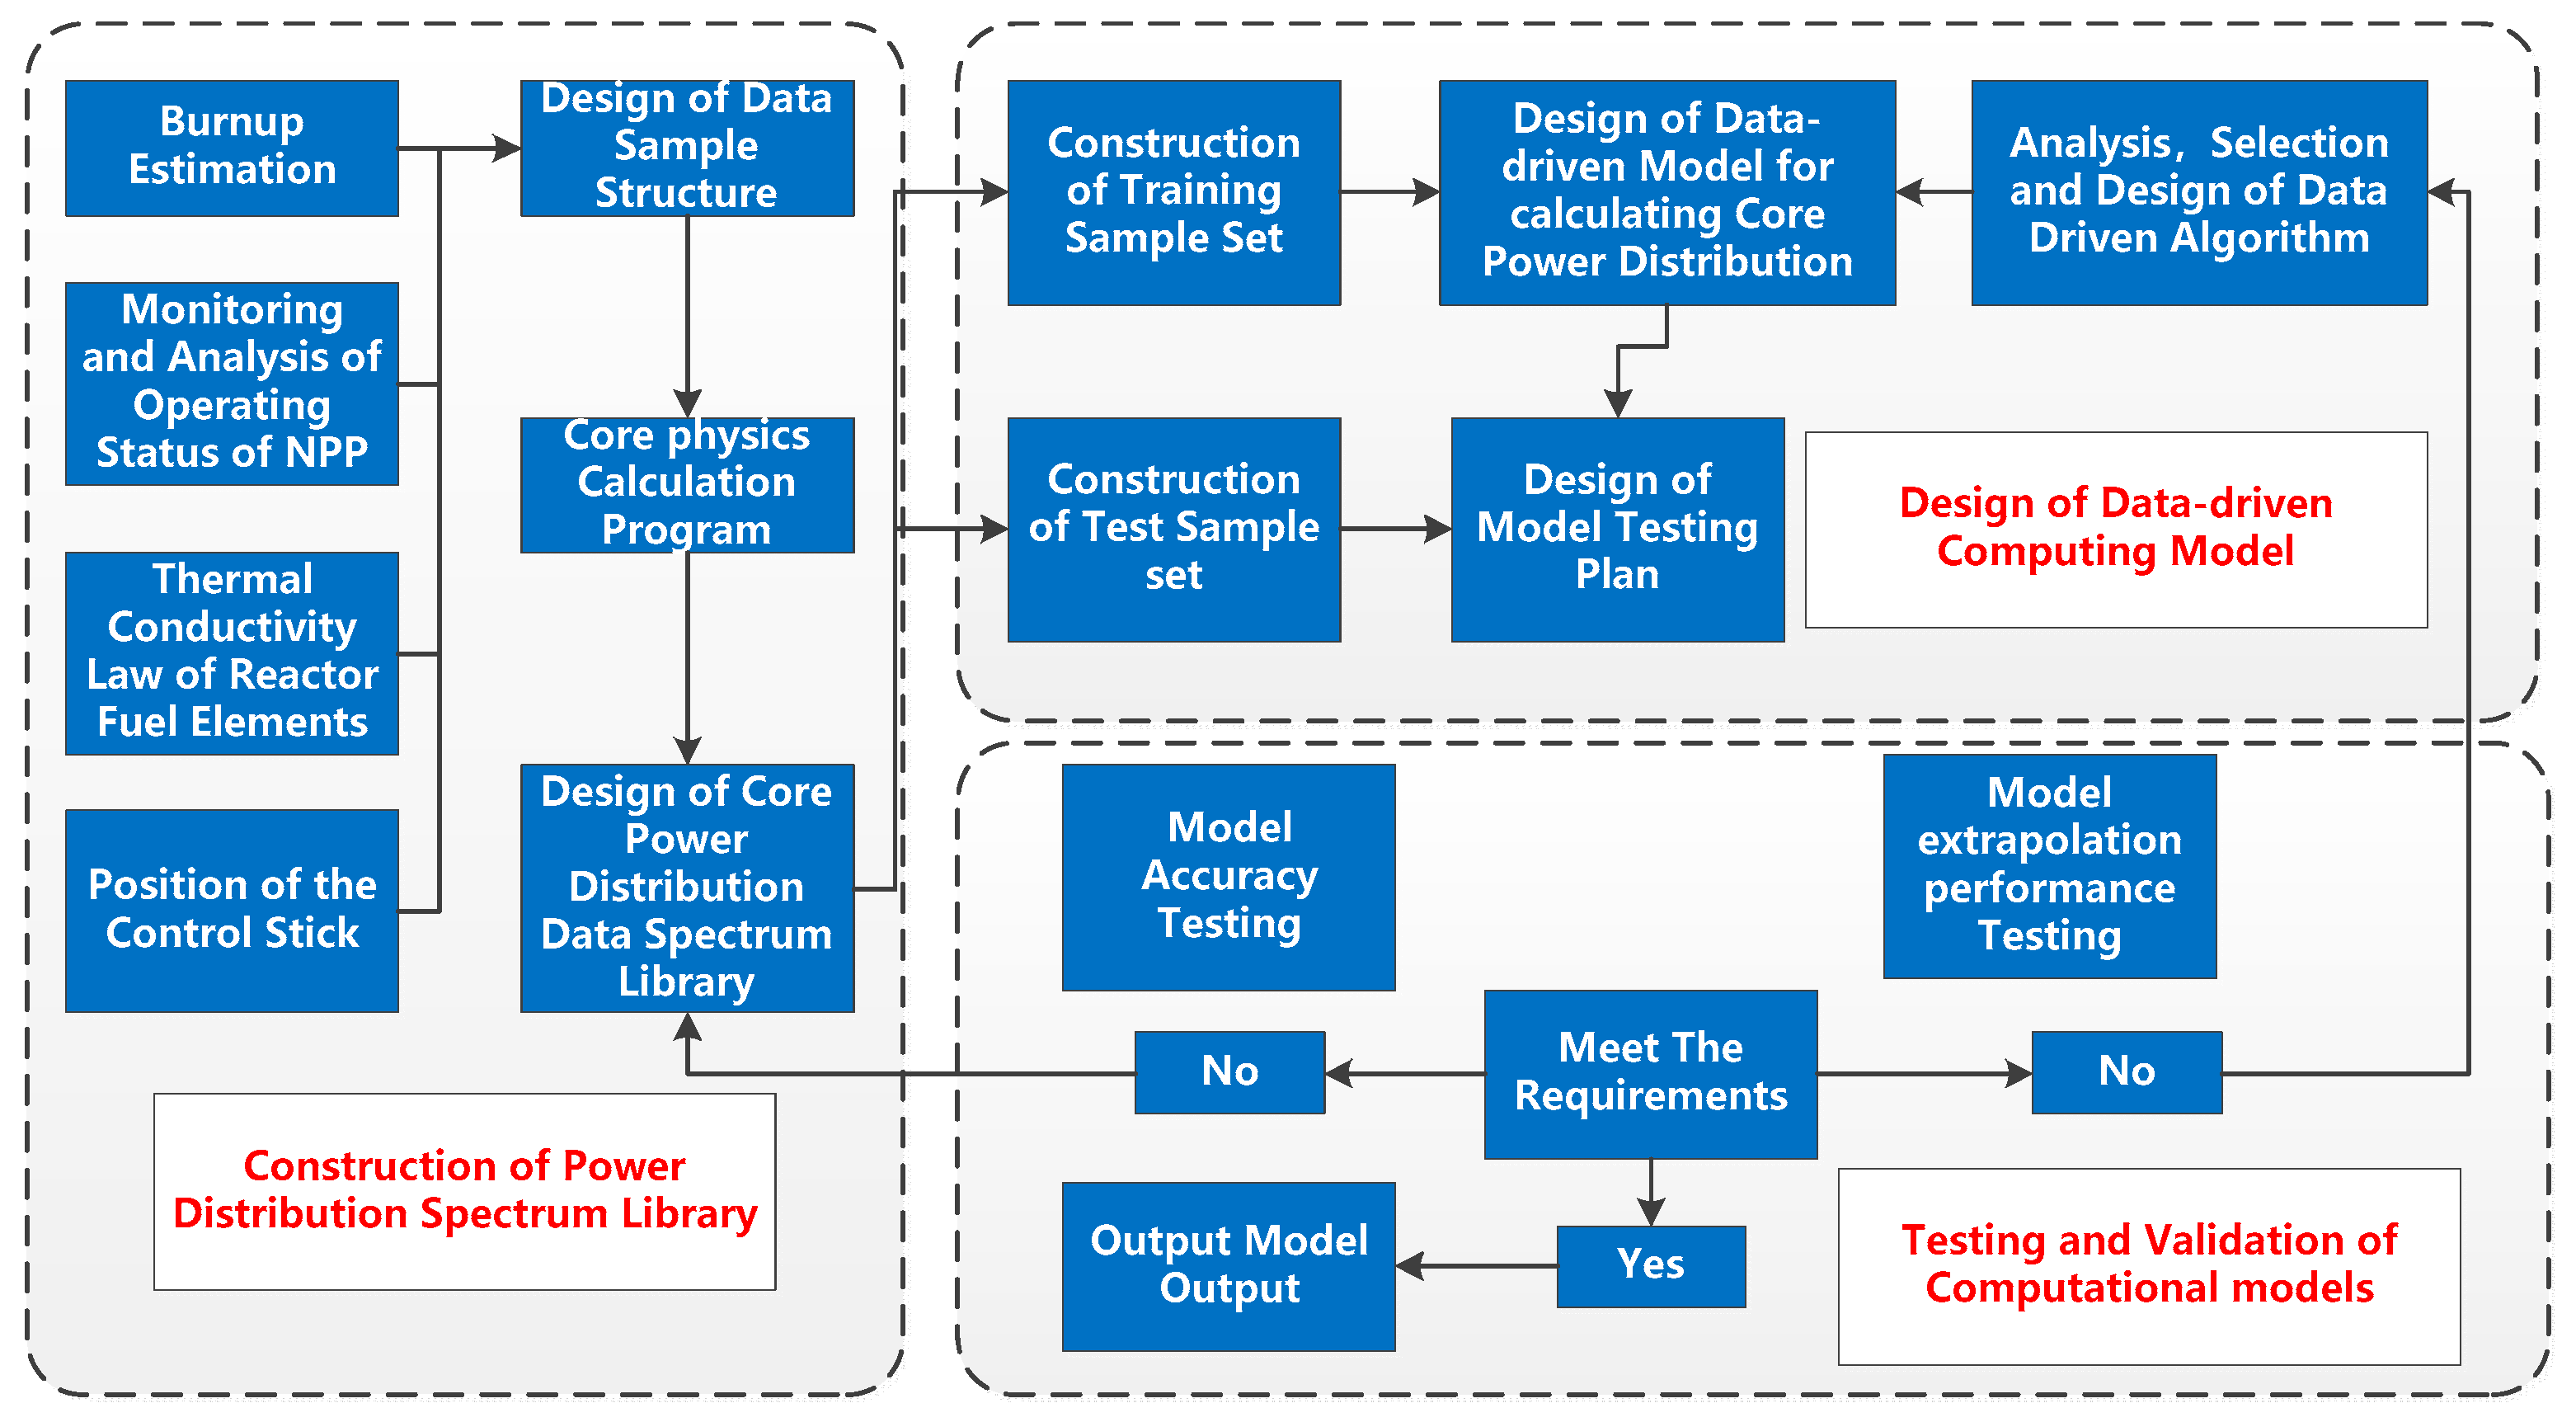
The core power distribution calculation agent model design system consists of three parts: the construction of the power distribution spectrum library, the design of the data-driven calculation model, and the test and verification of the calculation model. The architecture design is shown in Figure 1. When constructing the spectrum library, it is necessary to study the internal physical state of the core. According to a series of analysis and estimation, the design scheme of the data sample library is proposed. This process mainly analyzes the selection of input parameters and working conditions. On this basis, a spectral library of core power distribution is constructed according to the data calculated by the physical calculation program. The design of the model mainly considers the selection and establishment of the neural network model. Through research and analysis, a suitable and available neural network model is selected for research. The process of verification and testing requires a lot of data analysis. The fast calculation method of core power distribution based on data is experimentally verified, and the accuracy and generalization ability of the verification structure results are analyzed, compared, and evaluated. The effectiveness of the algorithm has been verified.

Figure 1.
Algorithm architecture design of core power distribution calculation surrogate model.
2.1. Construction of Power Distribution Spectrum Library
In this part, the neutron physics calculation program HELIOS is selected to model a set of fuel assemblies, and the appropriate input and output parameters are designed to calculate and construct the power distribution data spectrum library.
2.1.1. Selection and Modeling of Physical Computing Program
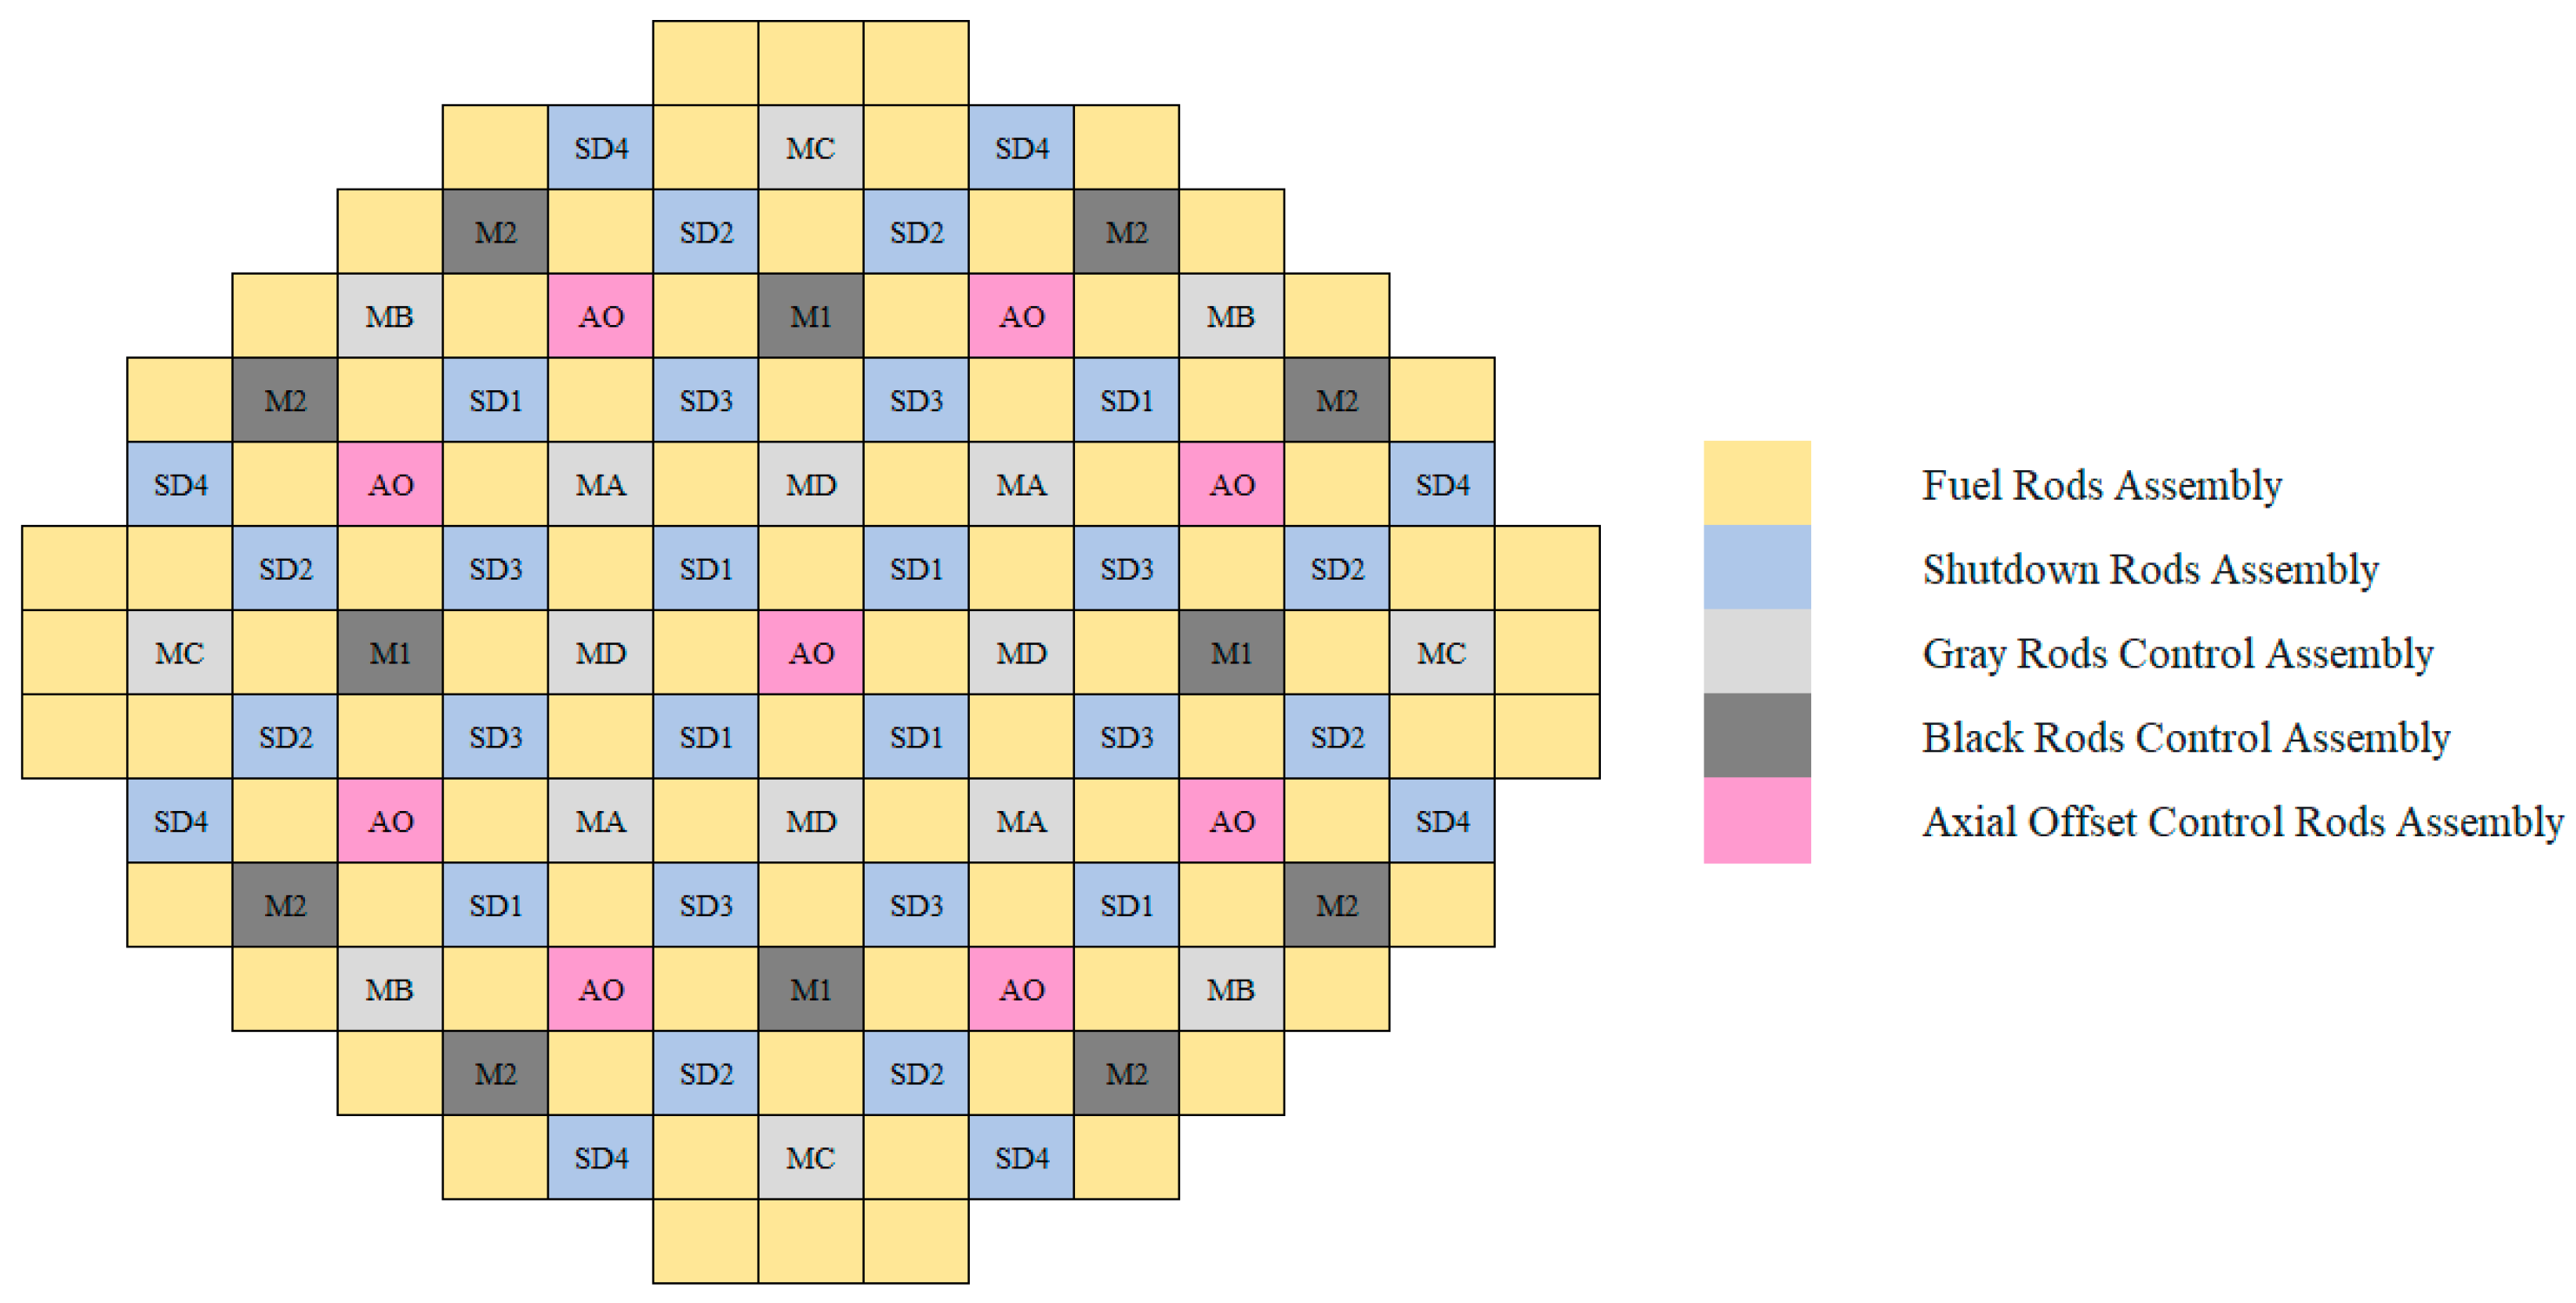
The reactor core applied in this research is similar to that of the AP1000, and the structure is shown in Figure 2 [23].
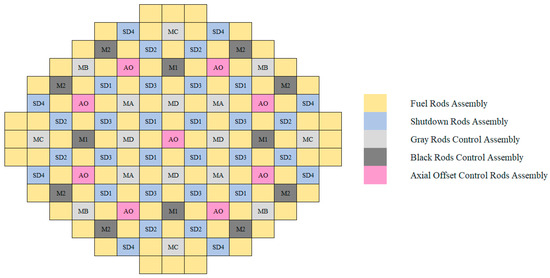
Figure 2.
AP1000 reactor core structure.
Table 1 lists the characteristics of HELIOS, SERPENT, and MCNP. As a deterministic calculation program, HELIOS has higher computational efficiency compared to the Monte Carlo programs SERPENT and MCNP. HELIOS exhibits high adaptability when dealing with complex geometric problems, such as two-dimensional lattice calculations. At the same time, it also adopts the subgroup method to improve the resonance calculation accuracy. Compared with SERPENT and MCNP, HELIOS strikes a better balance between computational efficiency and engineering practicality, making it suitable for generating large-scale power distribution spectral libraries. Therefore, HELIOS was adopted for physical calculations in this study.

Table 1.
Characteristics of HELIOS, SERPENT, and MCNP.
The output results of the HELIOS program have been verified through IAEA benchmark problems (such as the VVER-1000 fuel assembly). The maximum error is less than 2%, meeting the engineering accuracy requirements.
The HELIOS program is divided into three modules, of which the AURORA module is the module for input parameters, the ZENITH module is the module for output parameters, and the HELIOS module is the module for calculation. The HELIOS calculation module input card also includes three parts: aurora-03.inp, aurora-31.inp, and zenith.inp. The input module AURORA edits the input material size, material type, nuclear density, geometric distribution, boundary properties, burnup depth, etc., through input cards with different functions, and runs the program to output the required parameters. This study uses the HELIOS program to model a set of fuel assemblies.
2.1.2. Design of Input and Output Parameters
The inputs are the normalized temperature and burnup, and the outputs are the power values of each unit within the fuel assembly. The Adam optimizer is chosen with a learning rate of 0.001, and the mean squared error (MSE) is used as the loss function. The number of training epochs is dynamically adjusted to 30,000 via the Early Stopping method to ensure the convergence of the model.
There are many physical quantities related to the core power distribution, such as pressure, thermal conductivity, spatial position of the control rod, and physical properties of moderator. In this paper, the average core temperature and burnup are selected as independent variable parameters to study. There are three reasons for this:
- (1)
- The parameters are easy to obtain. The average temperature of the core can be calculated by the data of the reactor inlet temperature measuring point and the reactor outlet temperature measuring point. Since many control parameters choose the average temperature as a reference, this paper chooses the average temperature as an input parameter. The reactor burnup can be calculated quickly by integrating these two parameters with reference to the reactor power and operating time.
- (2)
- The parameters are simple and easy to analyze. Temperature is a widely known physical quantity, which can be easily accepted and quickly understood by reactor operators, and the analysis does not need to make very complex calculations or require research, so that people at all levels can quickly observe. Although the burnup involves integral calculation, as long as the reactor power and operation time are recorded, the required parameters can be quickly obtained through some calculation programs without further analysis and simplification.
- (3)
- The parameters are relatively independent. These two parameters are independent of some other parameters, especially the reactor burnup. This parameter is related to the core energy release and fuel quality, and will not be affected by other parameters. The reactor temperature has a great relationship with the core power, and has no direct relationship with the parameters such as pressure and spatial position.
2.1.3. Core Operating Condition Design
- (1)
- Reactor core temperature range setting
The selection of the average temperature range of the core is mainly considered to cover the working temperature range of the common PWR from cold state to hot state, that is, the temperature range of 30 °C~300 °C (303 K~573 K), and finally the temperature range of 300 K~580 K is selected. When designing the step size, considering the actual situation that the monitoring demand for the core power distribution is small in the cold state and the supervision demand is large in the hot state, a large temperature interval is designed in the cold state and a small temperature interval is designed in the hot state to meet the needs of model training.
The training set and the test set are randomly divided at a ratio of 3:1, and the input parameters (temperature and burnup) are independently distributed. To avoid the spurious correlation of time-series data, 5-fold cross-validation is used to optimize the hyperparameters. The input parameters (temperature and burnup) of the model are independent variables under steady-state conditions, and no dynamic time-series data are introduced, thus avoiding potential misleading in regression analysis.
The temperature points of the final reactor average temperature training sample set are 300 K, 350 K, 400 K, 450 K, 480 K, 490 K, 500 K, 510 K, 520 K, 530 K, 540 K, 550 K, 560 K, 570 K, and 580 K; and the temperature points of the test set are 485 K, 505 K, 525 K, 545 K, and 565 K.
- (2)
- Reactor burnup depth interval setting
The setting of reactor burnup depth mainly considers three typical cases: the beginning of life, the middle of life, and the end of life. Considering the setting of temperature and fuel consumption, different temperature points and different fuel consumption values are brought into the calculation model of fuel assembly power distribution based on the HELIOS program. A total of 45 groups of training data and 15 groups of test data are obtained, as shown in Table 2 and Table 3.
Table 2.
Design of training data set.
Table 3.
Test data set design.
2.2. Data-Driven Computing Model Design
A data-driven model is a kind of algorithm that relies on data to learn and make decisions. It can extract information and data links from data, and learn and build models through the characteristics of data, so as to realize users’ tasks such as prediction and classification of required targets. The biggest feature of this algorithm is that the judgment of its prediction evaluation index has a great relationship with data. This method is widely used in machine learning and artificial intelligence. The neural network algorithm required in this paper is a data-driven application.
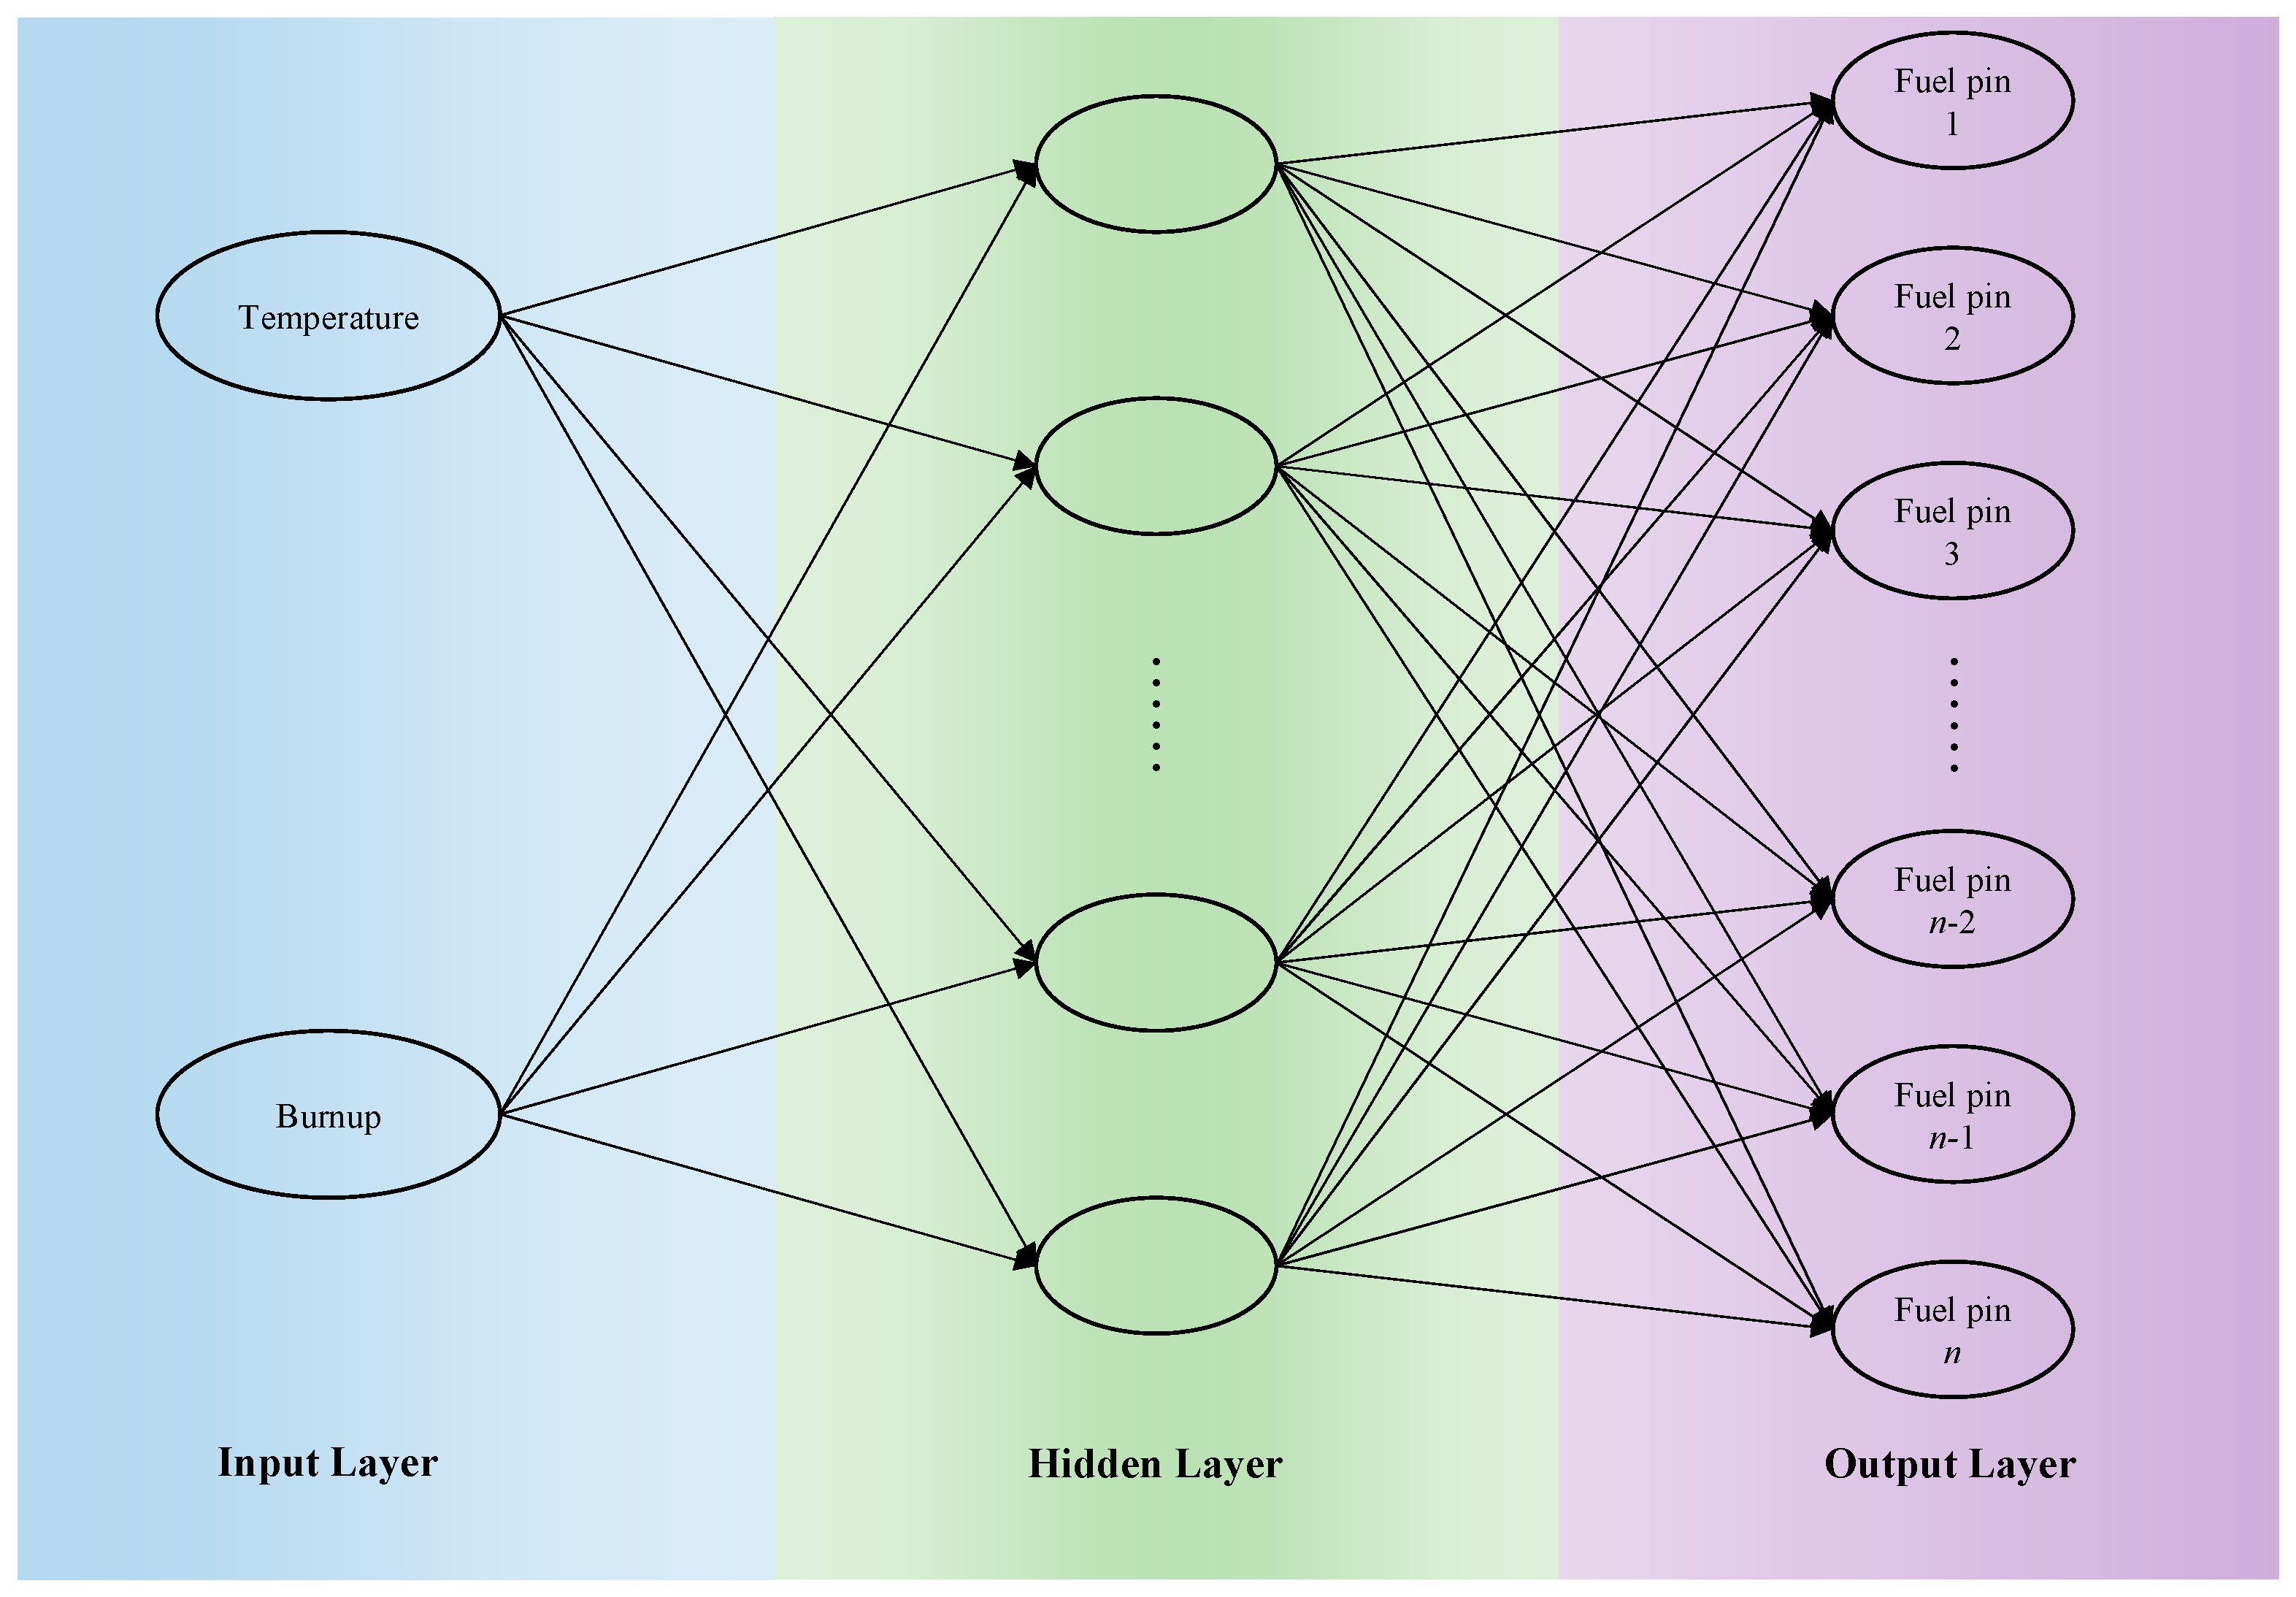
In this paper, the algorithm model of a fully connected neural network is selected. A fully connected neural network is also called multilayer perceptron (MLP). Each neuron in each layer of the fully connected neural network is connected to all neurons in the previous layer. Each connection has a certain weight. This complex cross-structure can deal with nonlinear separable problems, and the more layers, the more complex the relationship between data that can be extracted. Figure 3 details the specific settings of the fully connected neural network for power distribution calculation. A fully connected network is suitable for mapping from low-dimensional inputs (temperature, burnup) to high-dimensional outputs (power distribution). Through a grid search, it is determined that a network with a hidden layer (64 nodes) represents the optimal complexity.
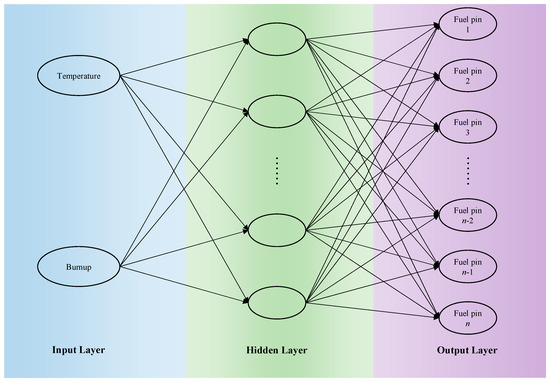
Figure 3.
Power distribution calculation fully connected neural network design.
In the above figure, the input layer contains two input parameters: temperature and burnup. The hidden layer activation function plays a role in this layer; the output layer contains n elements, which represent the power value of n fuel elements in the assembly. Each element in the upper and lower layers is connected to each other, which eventually constitutes such a network model. The activation function uses a simple and efficient ReLU (Rectified Linear Unit) activation function. First, because of its simple calculation, it has certain advantages in dealing with nonlinear problems. Secondly, because there is no negative value in the input of this question, that is, there will be no “Dead ReLU” situation.
The improvements of data-driven methods mainly include the following aspects: accuracy, efficiency, robustness, and interpretability. Since the main task of this problem is to predict the core power distribution, the accuracy and efficiency are mainly considered in the improvement. Accuracy refers to the accuracy of data-driven algorithms in prediction or classification tasks. Efficiency refers to the computing speed and resource consumption of data-driven algorithms. The corresponding improvement evaluation indicators are accuracy and efficiency.
3. Sample Set Construction and Training
In the second part, the data are classified into a sample set and test set. This process strictly ensures the mutual exclusion between different data sets and avoids the decrease in prediction accuracy caused by the intersection of information. On this basis, some noise processing is carried out on the data, and some unreasonable or meaningless data are removed to ensure the quality of the data. Then, the normalized processing is carried out; the output is all converted into a value near 1; then, a series of data obtained after such processing is made into a new table; and then the new table is used to conduct the analysis during training and testing. The purpose of this step is to eliminate the influence of dimension on data values and reduce the complexity of learning. Z-score standardization is adopted in this research:
where and are the mean and standard deviation of the training set, respectively.
Through Z-score standardization, the mean of the data is set to 0 and the standard deviation is set to 1, so that all features are within a similar scale range. In this way, gradient descent can update the model parameters more effectively, thereby accelerating the convergence speed of the model and reducing the training time. It is clear that the purpose of the sample set is to evaluate the accuracy of the model, and the final performance index is evaluated by mean square error. Table 4 shows the style of the training set after processing.
Table 4.
Partial data of training set.
Firstly, the neural network model should be defined. Through the previous research and analysis, a multi-to-many fully connected neural network model is selected. The input layer is the average temperature of the reactor core and the reactor burnup, and the output layer is the corresponding power of each component in the assembly. Then, the training set can be read for learning. In order to improve the prediction accuracy of the model and increase the amount of data, a data expansion technique is used to expand the data to two thousand. The specific operation is as follows:
- (1)
- Randomly extract a data point from the training set of the original data spectral library.
- (2)
- Add a random value in the normal distribution to all the elements of this data point. The mean value of the normal distribution is 0, and the standard deviation is 0.1, that is, N(0, 0.01), which constitutes a new data point.
- (3)
- Continue to repeat the above two steps until the number of data expands to 2000, thus completing data expansion.
After the neural network model and data are prepared, the data can be loaded and the next step can start training. In training, different training rounds can be set by changing the program. Through the input and output of the learning training set of one round, a neural network model is finally obtained. It is not difficult to foresee that different training rounds will also have a certain impact on the test results, and the specific qualitative and quantitative analysis will be conducted in the next section.
After the training is completed, the model can be tested. The specific steps are as follows:
- (1)
- Read the data of the test set to the corresponding path.
- (2)
- Extract independent variables and dependent variables, and load the data of independent variables into the model.
- (3)
- The model predicts the output of the independent variables in turn, and analyzes the error with the results of the test set.
- (4)
- Output prediction results, tabulate the prediction results, and compare them with the calculated true values.
- (5)
- Output the evaluation index of the model and judge the quality of the model.
The steps of the test process are relatively simple, but it is necessary to have a more appropriate analysis of the data and results. The following section mainly analyzes the results.
4. Model Testing and Verification
The experiment was conducted on an 11th Gen Intel(R) Core(TM) i7-11800H @ 2.30 GHz processor and an NVIDIA GeForce RTX 3050 Ti Laptop GPU, using Python 3.8 and the PyTorch 1.12 framework.
4.1. Effect of Different Rounds on Prediction
The core power distribution is a series of specific values. The trained model belongs to a data regression model. Therefore, the evaluation of the model has set three evaluation indicators for this model, namely, the total deviation value, the mean absolute error, and the mean squared error.
In addition, the model is compared to evaluate the model, and the horizontal and vertical comparisons are carried out respectively. In the first training, only training with 500 epochs was performed. Epoch represents the process of the neural network model learning the training set completely, that is, traversing the data once. After 500 rounds of training, the neural network model has a predicted output. In order to make an intuitive comparison, the predicted values of a set of neural network models are compared with the HELIOS calculation program in Table 5.
Table 5.
Comparison of calculated and predicted values.
The total deviation value is 987.4433, the average absolute error is 0.1959, and the mean square error is 0.2327. Then, in order to make a comparison, the epochs are set to 30,000, that is, the number of training rounds is increased to 30,000. The evaluation results of 30,000 rounds are listed below. The total deviation value is 120.5367, the average absolute error is 0.0239, and the mean square error is 0.0012.
Through the comparison of the evaluation results of the two, increasing the number of rounds can better improve the quality of the neural network model, and it can be seen that the average absolute error of 30,000 rounds has reached about 0.02. Because the data have been normalized, it is not difficult to obtain the relative error at this time. It is about 2%, which has met the requirements of less than 5%, so the model can be used as the final result of the research. Next, an in-depth data analysis of this training will be carried out. Some data will be processed below to make it easier to observe and analyze.
4.2. The Influence of Different Working Conditions on the Prediction
The test sample data set is brought into the fully connected neural network calculation model for testing, and the test results are obtained. All the test calculation process delays are within seconds, which can meet the online support requirements. Next, the calculation accuracy is compared and analyzed.
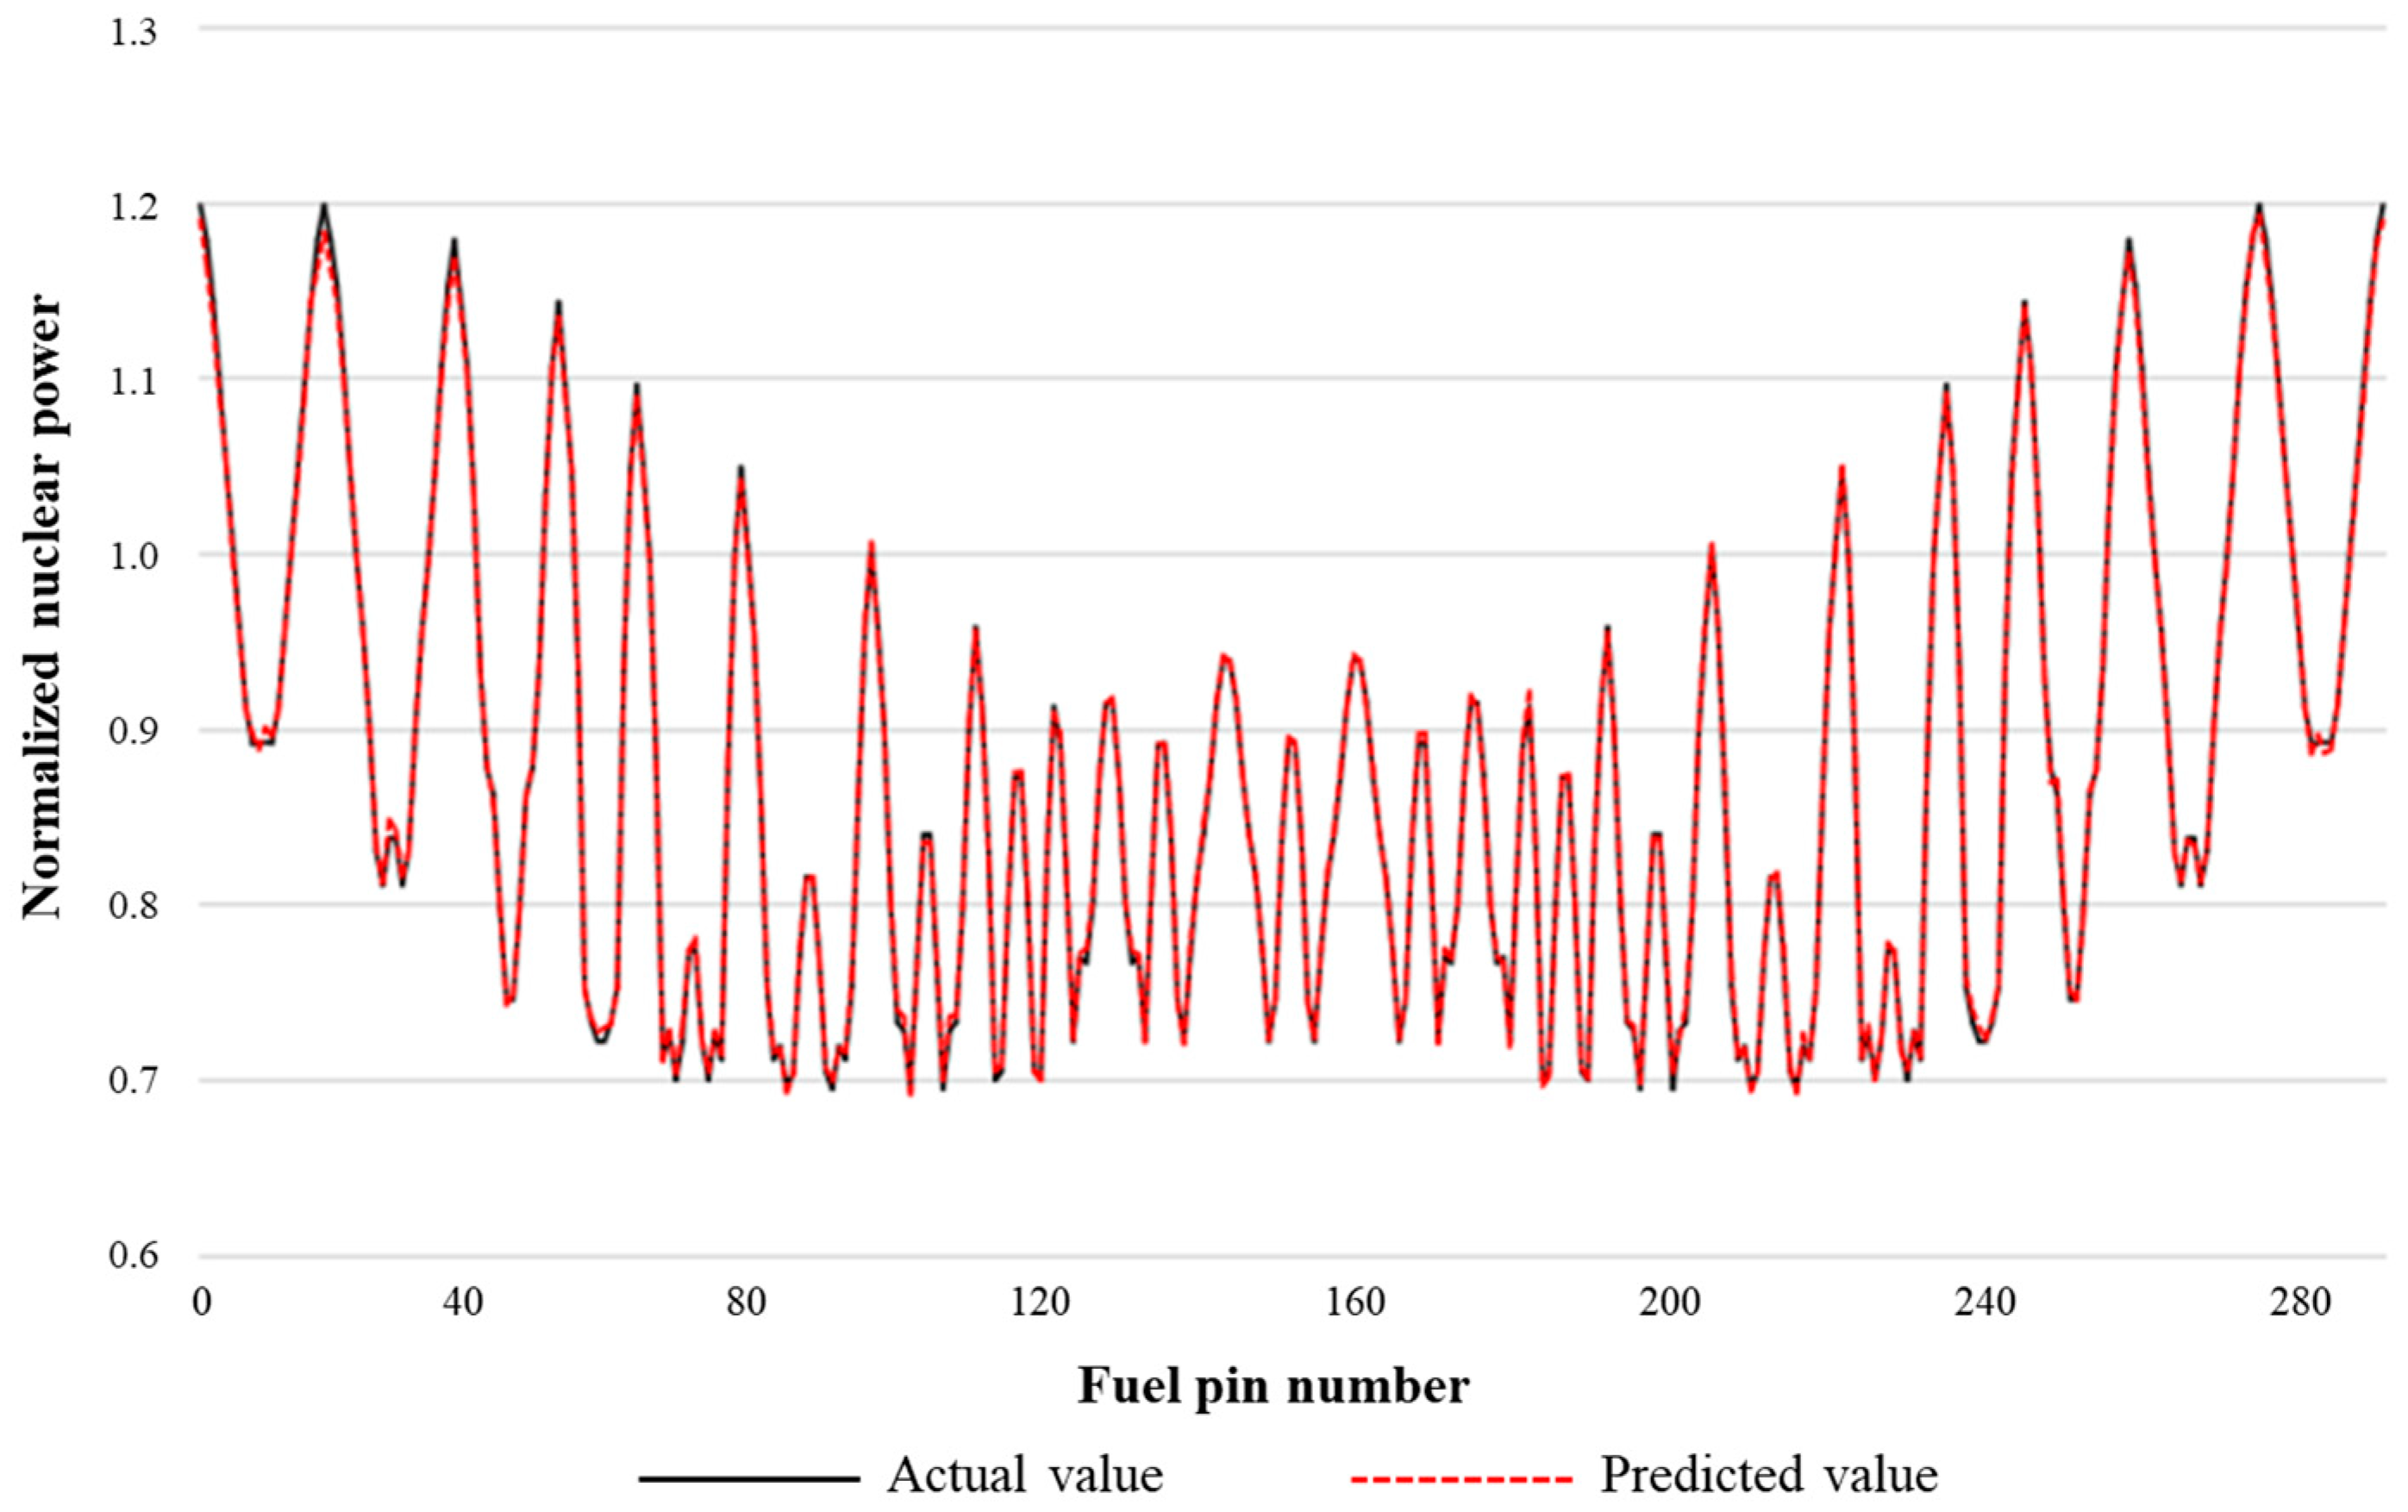
Figure 4 shows the comparison of the calculation results at the beginning of core life and a temperature of 485 K. The abscissa in the diagram represents the number of fuel elements in the fuel assembly, the actual value curve in the ordinate represents the nuclear power value of the fuel element calculated by the HELIOS program, and the predicted value curve represents the nuclear power value of the fuel element calculated by the data-driven model. It is not difficult to find that the two are in good agreement through curve observation, and there is only a very small error at the inflection points such as peak power and trough.

Figure 4.
Comparison of calculation results at beginning of core life and temperature of 485 K.
When the core temperature is 485 K, the calculation results of core power distribution under different burnup depths are compared and analyzed, as shown in Figure 5. The abscissa of each curve in Figure 5 represents the number of fuel elements in the fuel assembly, and the ordinate represents the relative error of the nuclear power of each fuel element calculated by the data-driven calculation model relative to the nuclear power of the fuel element calculated by the HELIOS physical calculation program.
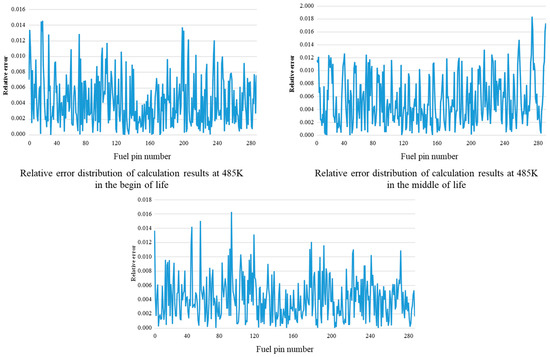
Figure 5.
Comparison of calculation error of power distribution at different burnup depths at 485 K.
Comparing the calculation results under different burnup depths, it can be found that the maximum calculation error is about 1.5% at the beginning of the life, about 1.8% in the middle of the life, and about 1.6% at the end of the life. The calculation error increases first and then decreases with the increase in burnup depth, and the maximum error position is not the same. However, the maximum calculation error of the three stages is less than 2%, which can meet the requirements of core supervision accuracy during reactor operation.
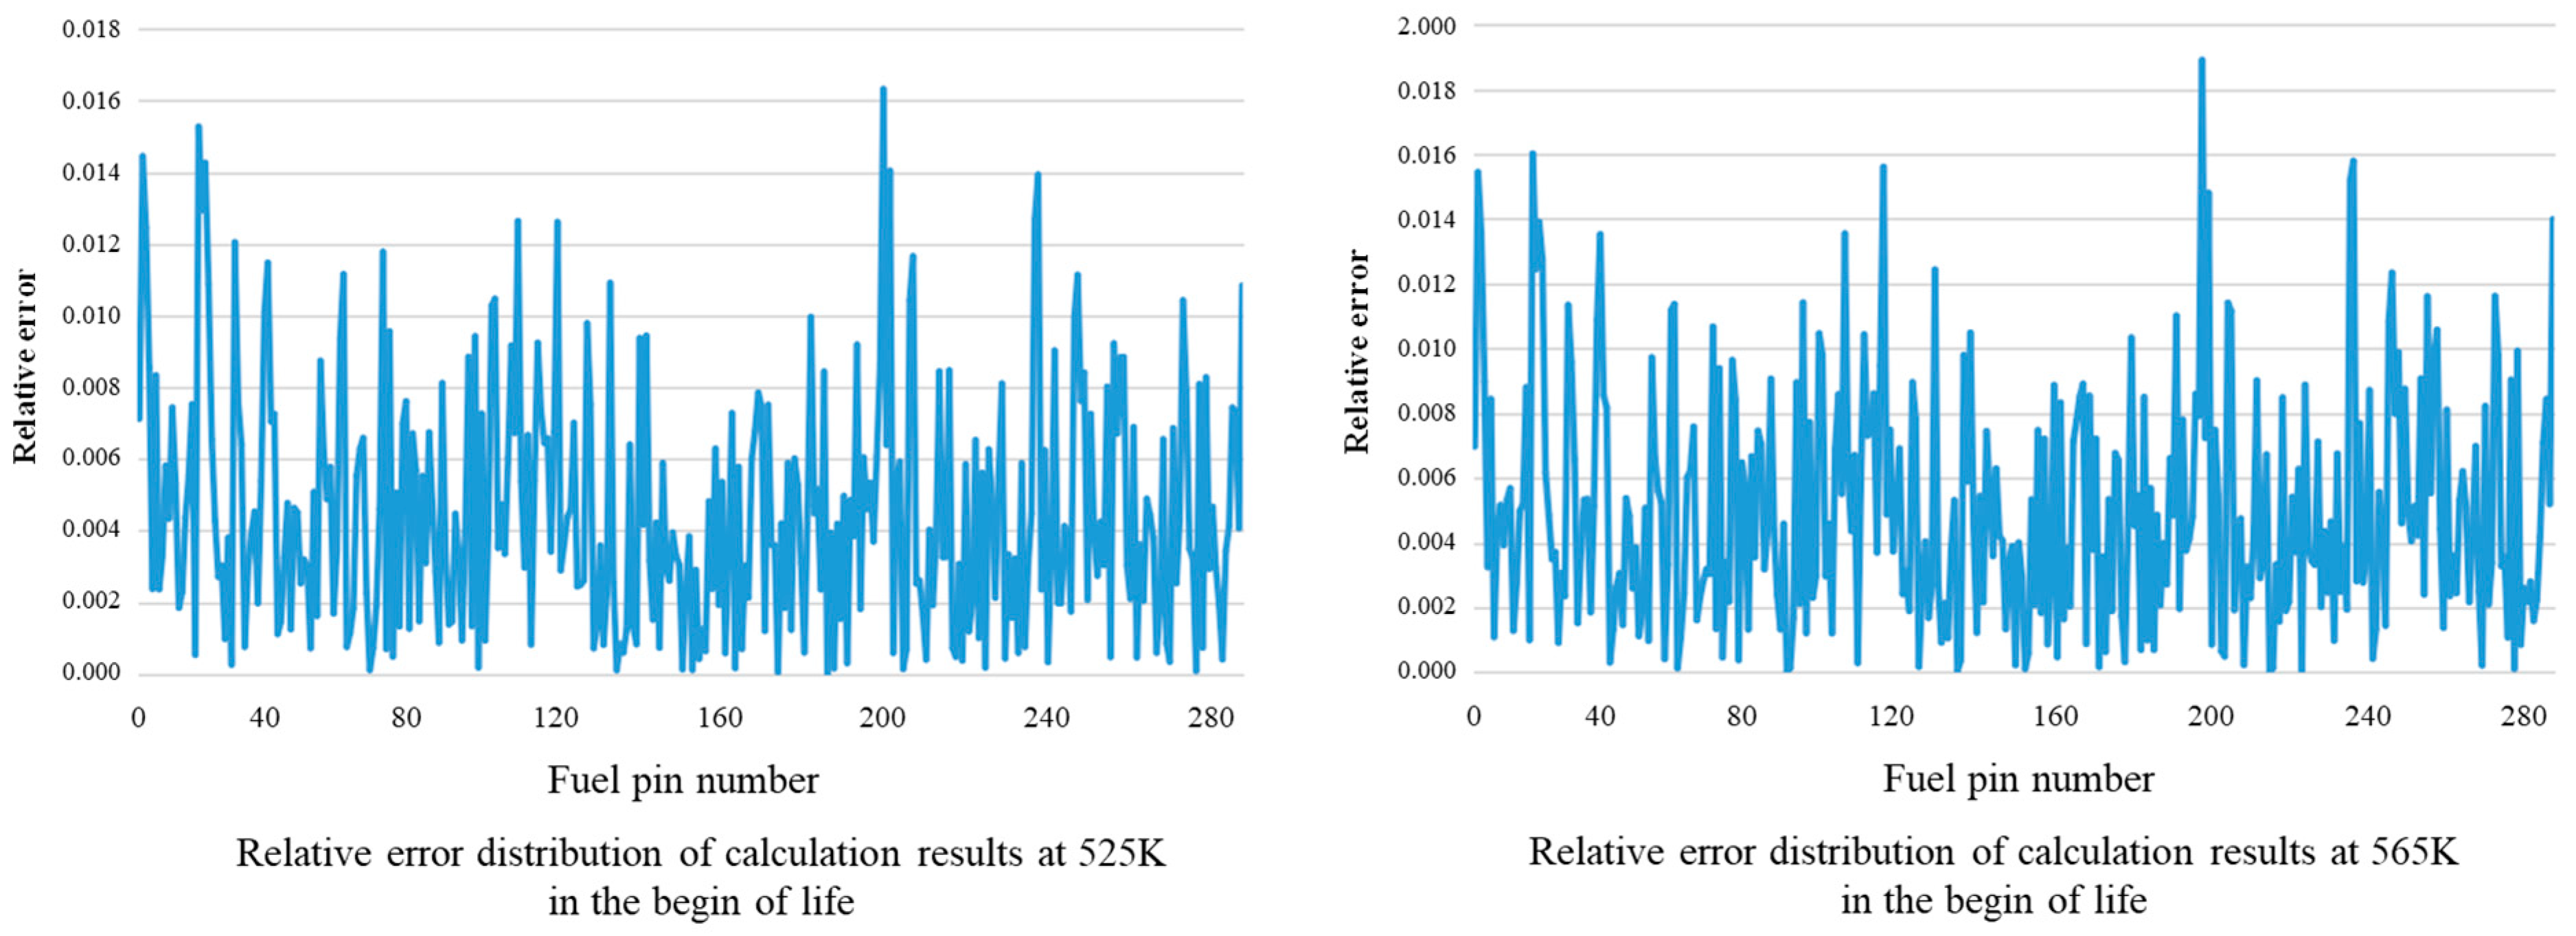
The calculation errors of the two temperature points of 525 K and 565 K at the beginning of the life are compared, as shown in Figure 6. It can be seen from Figure 6 that under the same burnup, the maximum error of fuel element power calculation increases slightly with the increase and decrease in core temperature, and the maximum error position is basically the same, but the maximum value of related calculation error is less than 2%, which can meet the requirement of core supervision accuracy during reactor operation.

Figure 6.
Comparison of calculation errors of power distribution at different temperatures in the begin of life.
4.3. Prediction Results of Different Models
In addition to the above analysis, it is also compared with the neural network model of deep learning. This comparison uses all the test set data, that is, the three models predict all the 15 working conditions in the test set once, and finally output an evaluation result. Considering that the purpose of this process is only to make comparisons, training with only 500 epochs is used to compare the evaluation results. Table 6 shows the calculation accuracy and efficiency of different models. The evaluation results of a simple neural network are as follows: the total deviation value is 987.4433, the average absolute error is 0.1959, and the mean square error is 0.2326. The bias value of the binary regression model is 53.6718, the average absolute error is 0.0106, and the mean square error is 0.0002. The bias value of the deep learning neural network is 21.3427, the average absolute error is 0.0042, and the mean square error is 0.00003. Among them, it is not difficult to see that the neural network of deep learning has higher accuracy, but deep learning can easily overfit, and the lack of training will lose the sensitivity to input parameters. Therefore, it is highly dependent on data, and it is difficult to improve the prediction effect. Finally, we can conclude that the fully linked neural network has a high degree of plasticity while ensuring accuracy and speed, and the network can be designed according to different heap types for learning. This kind of network model is more suitable for the prediction model with less input parameters and more output parameters. It has a good prediction effect and can complete certain needs.
Table 6.
Calculation accuracy and efficiency of different models.
In addition to the error analysis, the calculation time is also evaluated. The test set has 15 sets of data, that is, 15 working conditions. Each time, all the test sets are tested once, and the time is within 1 s. That is to say, the predicted time is at the millisecond level, which can fully meet the needs of online prediction.
5. Conclusions
In response to the practical issues of high-precision core physics calculation programs consuming a large amount of computing power and time when calculating the core power distribution and not being suitable for online use, this paper proposes relying on the pre-calculated reactor power distribution data library from physical calculation programs. A fully connected artificial neural network surrogate calculation model is designed and trained to replace the core physics calculation model for rapid calculation of the core power distribution, thereby providing online support for core supervision during reactor operation.
Through numerical verification, it is found that the lower the temperature and the smaller the burnup, the higher the prediction accuracy. The prediction effect for the central part of the assembly is significantly better than that for the periphery. However, all prediction errors are less than 5%, meeting the requirements of calculation accuracy. The calculation time is in the millisecond range. Compared with traditional high-precision program calculations, the calculation efficiency has been improved by thousands of times.
Therefore, this method not only has an extremely fast calculation speed but also can achieve a calculation accuracy similar to that of core physics calculation programs, which can meet the basic requirements of online supervision of high-mobility marine small reactor cores. This study, based on the data-driven surrogate model, realizes the rapid calculation of the core power distribution of small power reactors, compensates for the lack of real-time performance of high-precision physical programs, and is of great significance for the safe operation of reactors.
Author Contributions
All authors contributed to the study conception and design. Material preparation, data collection and analysis were performed by X.W., S.L. and Y.Z. The first draft of the manuscript was written by X.W. and C.Z. And all authors commented on previous versions of the manuscript. All authors have read and agreed to the published version of the manuscript.
Funding
This work is supported by the following sources the National Natural Science Foundation of China (No. 12305198), China Postdoctoral Science Foundation (Postdoc No. 48884), and the Natural Science Foundation of Hubei province (No. 2023AFB341). The authors would like to show their great appreciation to other members in team for their support and contribution to this research.
Data Availability Statement
The original contributions presented in the study are included in the article; further inquiries can be directed to the corresponding author.
Conflicts of Interest
The authors declare that they have no known competing financial interests or personal relationships that could have appeared to influence the work reported in this paper.
References
- Dong, L.; Qi, L.; Lei, T.; Ping, A.; Fan, Y. Solving Multi-Dimensional Neutron Diffusion Equation Using Deep Machine Learning Technology Based on PINN Model. Nucl. Power Eng. 2022, 43, 1–8. [Google Scholar] [CrossRef]
- Wang, J.; Peng, X.; Chen, Z.; Zhou, B.; Zhou, Y.; Zhou, N. Surrogate modeling for neutron diffusion problems based on conservative physics-informed neural networks with boundary conditions enforcement. Ann. Nucl. Energy 2022, 176, 109234. [Google Scholar] [CrossRef]
- Yang, Y.; Gong, H.; Zhang, S.; Yang, Q.; Chen, Z.; He, Q.; Li, Q. A data-enabled physics-informed neural network with comprehensive numerical study on solving neutron diffusion eigenvalue problems. Ann. Nucl. Energy 2023, 183, 109656. [Google Scholar] [CrossRef]
- Prantikos, K.; Tsoukalas, L.H.; Heifetz, A. Physics-Informed Neural Network Solution of Point Kinetics Equations for a Nuclear Reactor Digital Twin. Energies 2022, 15, 7697. [Google Scholar] [CrossRef]
- Elhareef, M.H.; Wu, Z. Physics-Informed Neural Network Method and Application to Nuclear Reactor Calculations: A Pilot Study. Nucl. Sci. Eng. 2022, 197, 601–622. [Google Scholar] [CrossRef]
- Kharazmi, E.; Zhang, Z.; Karniadakis, G.E. hp-VPINNs: Variational physics-informed neural networks with domain decomposition. Comput. Methods Appl. Mech. Eng. 2021, 374, 113547. [Google Scholar] [CrossRef]
- Zeng, F.; Zhang, X.; Zhao, P. Study on Neutron Diffusion Calculation Method Based on hp-VPINN. Nucl. Power Eng. 2024, 45, 53–62. [Google Scholar] [CrossRef]
- Chen, H.; Hu, N.; Cheng, Z.; Zhang, L.; Zhang, Y. A deep convolutional neural network based fusion method of two-direction vibration signal data for health state identification of planetary gearboxes. Measurement 2019, 146, 268–278. [Google Scholar] [CrossRef]
- Chen, Z.; Gryllias, K.; Li, W. Mechanical fault diagnosis using Convolutional Neural Networks and Extreme Learning Machine. Mech. Syst. Signal Process. 2019, 133, 106272. [Google Scholar] [CrossRef]
- Dias, A.; Silva, F. Determination of the power density distribution in a PWR reactor based on neutron flux measurements at fixed reactor incore detectors. Ann. Nucl. Energy 2016, 90, 148–156. [Google Scholar] [CrossRef]
- Roop, J.P. A randomized neural network based Petrov–Galerkin method for approximating the solution of fractional order boundary value problems. Results Appl. Math. 2024, 23, 100493. [Google Scholar] [CrossRef]
- Talon, J.D.; Martinez, A.S.; Gonçalves, A.C. Continuous mapping of nuclear reactor core power using artificial neural network even in the presence of inactive detectors. Nucl. Eng. Technol. 2024, 56, 4983–4996. [Google Scholar] [CrossRef]
- Yadav, V.; Casel, M.; Ghani, A. RF-PINNs: Reactive flow physics-informed neural networks for field reconstruction of laminar and turbulent flames using sparse data. J. Comput. Phys. 2025, 524, 113698. [Google Scholar] [CrossRef]
- Fukaya, Y.; Okita, S.; Nakagawa, S.; Goto, M.; Ohashi, H. Computed tomography neutron detector system to observe power distribution in a core with long neutron flight path. Ann. Nucl. Energy 2022, 168, 108911. [Google Scholar] [CrossRef]
- Hong, Q.; Jun, M.; Bo, W.; Sichao, T.; Jiayi, Z.; Biao, L.; Tong, L.; Ruifeng, T. Application of Data-Driven technology in nuclear Engineering: Prediction, classification and design optimization. Ann. Nucl. Energy 2023, 194, 110089. [Google Scholar] [CrossRef]
- Li, W.; Ding, P.; Xia, W.; Chen, S.; Yu, F.; Duan, C.; Cui, D.; Chen, C. Artificial neural network reconstructs core power distribution. Nucl. Eng. Technol. 2022, 54, 617–626. [Google Scholar] [CrossRef]
- Riva, S.; Introini, C.; Cammi, A. Multi-physics model bias correction with data-driven reduced order techniques: Application to nuclear case studies. Appl. Math. Model. 2024, 135, 243–268. [Google Scholar] [CrossRef]
- Wang, P.; Liang, W.; Gong, H.; Chen, J. Decoupling control of core power and axial power distribution for large pressurized water reactors based on reinforcement learning. Energy 2024, 313, 133967. [Google Scholar] [CrossRef]
- Wang, X.; Zheng, Y.; Wang, X.; Li, X. Using ex-core detectors and deep neural networks for monitoring power distribution in small space reactors. Nucl. Eng. Des. 2025, 431, 113721. [Google Scholar] [CrossRef]
- Xia, H.; Li, B.; Liu, J. Research on intelligent monitor for 3D power distribution of reactor core. Ann. Nucl. Energy 2014, 73, 446–454. [Google Scholar] [CrossRef]
- Birri, A.; Blue, T.E. Methodology for inferring reactor core power distribution from an optical fiber based gamma thermometer array. Prog. Nucl. Energy 2020, 130, 103552. [Google Scholar] [CrossRef]
- Daniell, J.; Kobayashi, K.; Alajo, A.; Alam, S.B. Digital twin-centered hybrid data-driven multi-stage deep learning framework for enhanced nuclear reactor power prediction. Energy AI 2025, 19, 100450. [Google Scholar] [CrossRef]
- Lin, C. Passive Safety Advanced Nuclear Power Plant AP1000; Atomic Energy Press: Beijing, China, 2008. [Google Scholar]

Disclaimer/Publisher’s Note: The statements, opinions and data contained in all publications are solely those of the individual author(s) and contributor(s) and not of MDPI and/or the editor(s). MDPI and/or the editor(s) disclaim responsibility for any injury to people or property resulting from any ideas, methods, instructions or products referred to in the content. |
© 2025 by the authors. Licensee MDPI, Basel, Switzerland. This article is an open access article distributed under the terms and conditions of the Creative Commons Attribution (CC BY) license (https://creativecommons.org/licenses/by/4.0/).