Article

Heavy Metal Pollution in a Cu Mine Dump and in Close Agricultural Soils and Crops in Mozambique

by
Severino dos Santos Savaio
1,
Ana Barreiro
2,*,
Avelino Núñez-Delgado
2,
Antonio Suluda
3,
Esperanza Álvarez-Rodríguez
2 and
María J. Fernández-Sanjurjo
2
1
Department of Geoscience and Environment, Faculty of Geoscience and Environment, University Púnguè, Chimoio 333, Mozambique
2
Department Soil Science and Agricultural Chemistry, Engineering Polytechnic School, University of Santiago de Compostela, Campus Terra, 27002 Lugo, Spain
3
Department of Chemistry, Faculty of Science and Technology, University Licungo, Maputo 106, Mozambique
*
Author to whom correspondence should be addressed.
Processes 2025, 13(3), 902; https://doi.org/10.3390/pr13030902
Submission received: 2 March 2025 / Revised: 15 March 2025 / Accepted: 17 March 2025 / Published: 19 March 2025
(This article belongs to the Special Issue Soil Remediation Processes)

Abstract

:
Heavy metal pollution is investigated for a mine dump and soils and crops located 0.5, 1, 1.5, 3 and 6 km from a Cu mine, analyzing the total, available and exchangeable Cu, Zn, Cr, Ni, Cd and Pb. The maximum total contents in the dumping site reached 10,000, 1500, 1000, 230, 180 and 0.6 mg kg−1 for Cu, Cr, Ni, Zn, Pb and Cd, respectively. Within agricultural soils, those located 1.5 km away showed the highest total concentrations. The available Cu, Zn, Cd and Pb values were higher in the dump compared with the soils, while Cr and Ni stood out in the samples located 1.5 km away. Regarding crops, the Cu, Cr, Ni, Cd and Pb concentrations were higher in plants situated 3 km away. Considering the toxicity limits, Cr and Ni presented higher levels in most cases, while Cu exceeded the limits in most of the dump and soil samples located 1.5 km away, whereas Pb only exceeded them in the dump. The contents in crops indicated higher values in plants growing 3 km away, with all samples showing Cr pollution problems. These results can be considered of environmental significance, both for Mozambique and globally in areas affected by heavy metal pollution caused by mining activities.

Graphical Abstract

1. Introduction

The extraction of metals through mining, especially copper and iron, began in the Metal Age (6000–1000 BC) with extremely inefficient practices which left large areas with high heavy metal contents [1], reaching both soils and waterways. Over time, these extractive activities have been subjected to different technical improvements, but they still cause a strong environmental impact affecting geomorphological aspects. Mining activities leave large quantities of sterile materials of variable compositions which may be weathered by climatic conditions, leading to serious environmental damage [2,3,4,5]. Previous studies focusing on the effects of open-air mining have shown that heavy metals can be released during the process of altering waste sterile materials resulting from mining exploitation, and then they may be leached, absorbed by plants or retained in the soil [6,7,8].
The toxicity of these elements depends on factors such as their concentration, speciation and bioavailability [9,10]. If the heavy metals in a mine dump reach toxic levels, then they may affect plant establishment and growth, which would promote an increase in the potential for erosion as well as enhanced dispersion of pollutants to adjacent areas. In fact, previous studies have reported a high degree of toxicity in mine dumps and nearby soils, waterways and vegetation surrounding these zones [11,12,13]. The extension of a polluted area can exceed that of the dump, reaching distances as far as 50 km downstream in the case of, for example, As [14]. Another hazard associated with the establishment of mine dumps is the risk of dam ruptures, which can cause huge ecological impacts even years after a dam’s failure [15].
Among heavy metals, Cu is one with increasing demand and growing extraction levels in mines [1]. Therefore, Cu mines are spread across the world, causing pollution which affects soils, water and vegetation in nearby areas [16] and even altering the function of the microbiome across the aquatic–riparian interface [17]. Cu is most commonly found in the Earth’s crust as copper-iron-sulfide and copper sulfide minerals with low Cu concentrations (between 0.3 and 1.7% Cu) [18]. The oxidation of these Cu sulfides may generate high acidity, giving rise to extremely low pH values in drainage waters and causing increased Cu solubility and dispersion through the soils and waters in the vicinity [5,19,20]. In this regard, some studies [21,22] reported that certain soils located in the vicinity of Cu mine tailings were highly polluted by this heavy metal. A recent study described how tomato plants growing in mining tailings from a mine where Ag, Cu, Pb, and Zn were extracted exhibited important alterations in their morphological and physiological parameters, with a significant reduction in yield [23]. Other authors also found high contents for Cu and other heavy metals such as Cd, Cr, Hg, As, Ni, Co, Pb and Zn in soils and groundwater in areas close to abandoned metal mining dumps [6,7,8,24].
In Mozambique, Cu mining is clearly relevant, with a high number of abandoned mines with no restoration processes implemented, which facilitates the dispersion of Cu and other heavy metals by means of water or wind, resulting in toxicity problems affecting the soil and crops in the vicinity. Despite these risks, there is a total lack of studies focusing on both the presence and availability of different heavy metals in the region and their background values, either in soils or in crops. Specifically, they are completely absent in the vicinity of the Cu mine of Mundonguara, although previous research has been carried out focusing on other mining explorations, such as coal [25].
With the above background, the aims of this work are to obtain experimental data corresponding to the degree of heavy metal pollution associated with the old Cu mine of Mundonguara (Manica, Mozambique) and estimate the tolerance and accumulation of heavy metals in crops as well as the environmental toxicity derived from the mine dump by analyzing agricultural soils and plants located at different distances from the mine (0.5, 1, 1.5, 3 and 6 km). This assessment will consider the threshold values established for (1) the total and available content of the heavy metals Cu, Zn, Cr, Ni, Cd, and Pb in soil samples and (2) the total contents of these heavy metals in the root and aerial parts of crops present in these soil samples. The results of this research could cover the information gap currently existing in the geographical area under study and could be relevant to shedding light on the environmental situation related to heavy metal pollution derived from metal mining in the region.

2. Materials and Methods
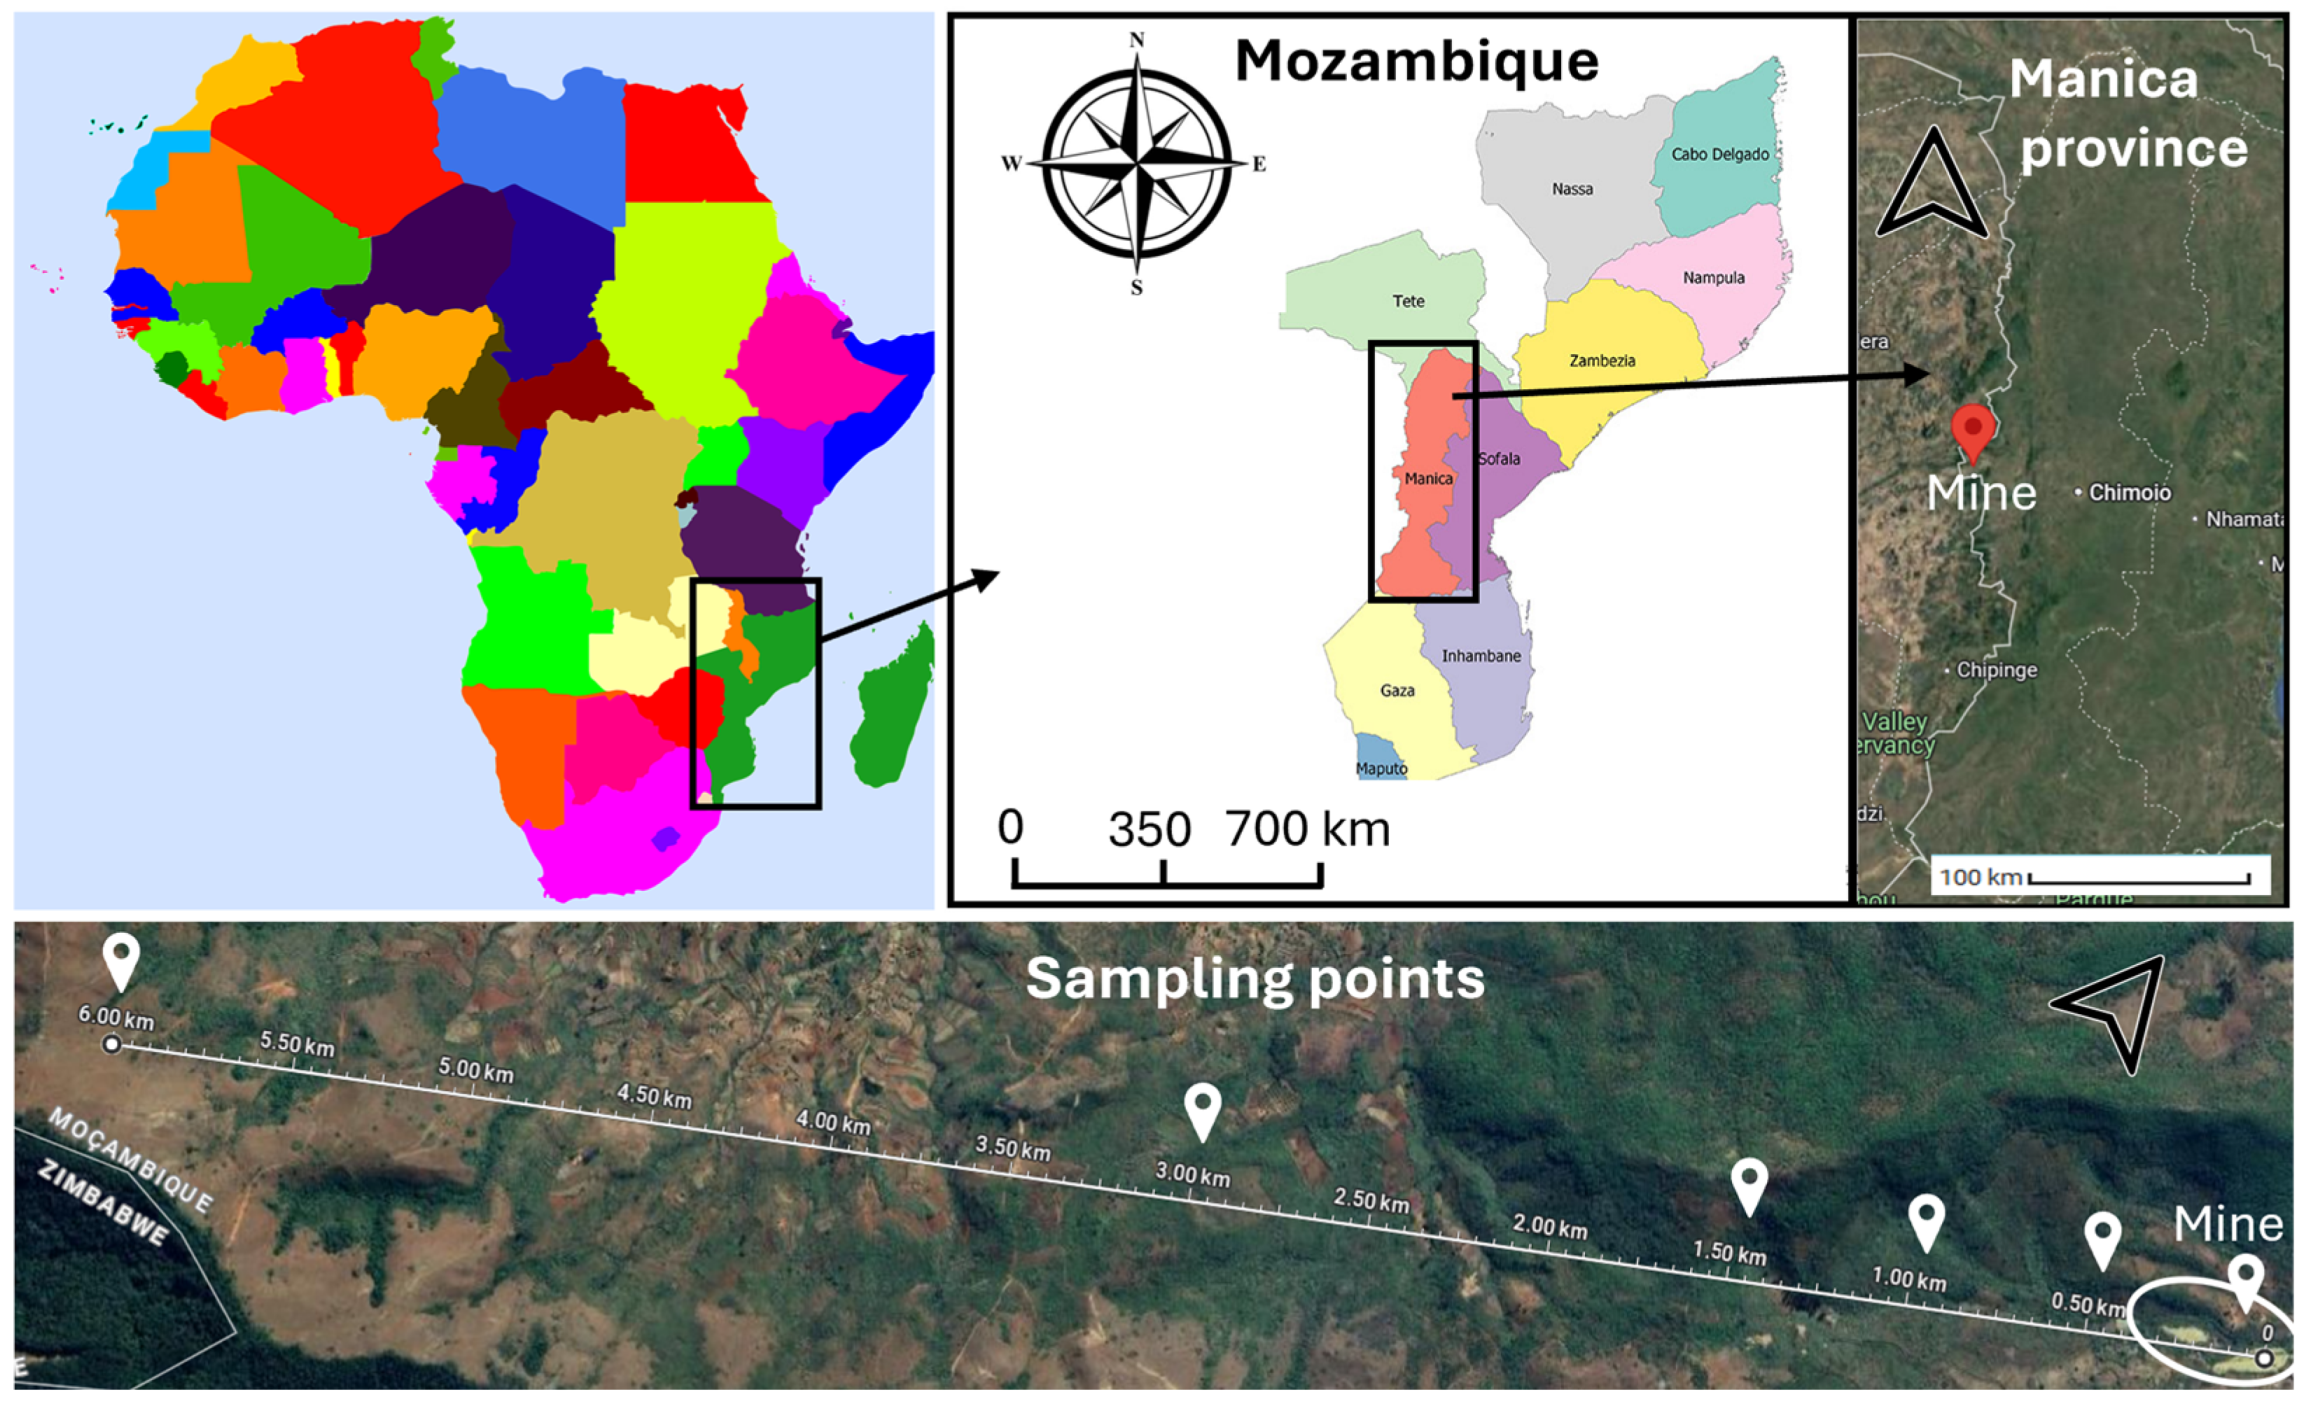
2.1. The Study Area

The research was carried out in the area of the Mundonguara copper mine in the central region of Mozambique, Manica Province (Manica District) (Figure 1). According to the MAE (2005) [26], a raised-relief map of the Manica District shows mountainous elevations (approximately 75% of the district’s area, with average altitudes above 700 m.a.s.l. and reaching 2000 m.a.s.l. at the highest points), with an east-west orientation for mountains and ranges. The topography of the region is strongly influenced by its lithology, which is highly distinctive because while most of the surface of Mozambique is dominated by sedimental parent material, the central-west part of the country, where our study was located, presents diverse plutonic rocks, both volcanic and intrusive [27].
The slope index varies between 2% and 8%, being more pronounced in the main natural waterways. The district is fundamentally made up of eruptive, Tertiary (Mesozoic) and Precambrian rocks, with a predominance of granite rocks, green lutites, gneisses and conglomerates. The district is quite rich in mineral resources, occupying a privileged position in relation to the others in the province. In the Manica region, there are deposits and occurrences of gold, copper, bauxite, asbestos, talc, manganese, iron, chromium and nickel, with the most important resources being gold and copper.
Regarding the climate, it is sub-tropical and divided into two seasons: a hot and rainy one which lasts from October to March and a cold and dry one which lasts between April and September. The district’s average annual rainfall is about 1200 mm, varying between 800 mm and 1400 mm. Rainfall increases from east to west (from the tableland toward the mountains). Temperatures are between 17.5 and 22.5 °C.
The most common soils in the study area show a moderate degree of ferralitization, while typical ferralitic soils with a high degree of ferralitization are found in the vicinity of the main waterways, where the humidity is high. However, there are also sandy (red) soils with a lighter surface layer and low fertility which are highly susceptible to erosion, mainly in areas close to rivers and waterways and especially in the southern part. There is also an abundance of clay soils (clay loam) in the territory [26].

2.2. Characteristics of the Mundonguara Mine

The Cu mine is located approximately 15 km from Vila de Manica, where mineralized bodies of sulfides containing copper and other metals are embedded in komatiites, felsites, carbonate rocks and serpentinites [28].
Two types of mineralization occurred in this mine. The first is primary copper mineralization in discrete lenticular dioritic intrusive bodies. Mineralization occurred in the form of intense disseminations of chalcopyrite and pyrrhotite, with the thickness exceeding 12 m and with Cu grades ranging from 1.8% to 26%. It is assumed that these intrusive bodies and their associated mineralization are located at significantly deeper levels. Felsic intrusions with a high degree of alteration hosting disseminated sulfides after sulfide mineralization were also identified 1.5 km west of the mine [28]. The second type of in-mine sulfide mineralization is presented in two distinct domains: sheared massive sulfide veins over 1.5 m thick within the komatiites and discrete sulfide veins in the stockworks and tectonic breccias within the more competent rocks [28].
The deposit presents compositional variations of Cu and polymetals (Cu, Co, Ag and Ni). Cooper (with a grade above 28%, 0.69% Co, 0.00031% Ag and 1.22% Ni) was exploited under open air for about 87 years. Copper extraction ended in 1998, leaving a heap of sterile materials covering a surface of 4.5 ha [28].

2.3. Collection of Soil, Dump Waste Material, Water and Plant Samples

To carry out this study, a variety of dump waste samples were taken (at depths of 0–20 cm and 20–40 cm) in different areas of the Cu mine dump, specifically at the center (CE), north (N), south (S), east (E) and west (W) of its site. Additional samples were taken at the same two depths in cultivated soils located at different distances from the dump (0.5, 1.0, 1.5, 3.0 and 6.0 km) situated in the western zone, which is in the direction of the predominant winds (east to west), as this is an agricultural area, complemented by additional samples corresponding to the crops growing in these soils. The orography of this area does not favor runoff traveling from the mine toward the agricultural region. In each area of the heap, and in each of the agricultural soils collected, 8 samples (4 superficial and 4 subsurface) were made up of 10 subsamples taken in a zig-zag manner. In the case of plants, the most abundant spontaneous species were collected in each of the sampling areas of the heap, using a 50 cm square which was thrown three times at random, obtaining a composite sample for each point. In the dump, the predominant spontaneous species is Bauhinia galpinii, and other species were extremely poorly represented. Existing crops were collected from the agricultural soil surrounding the mine, namely Zingiber officinale (0.5 km from the mine), Brassica oleracea (1 km), Psidium guajava (1.5 km), Phaseolus vulgaris (3 km), and Mangifera indica (6 km). At each soil sampling point, 10 plants of each species were collected, separating the roots, stems and leaves and making a sample composed of these three parts for each species and sampling point. Table 1 shows the rock types, and the vegetation collected at the different sampling points.
It is worth noting that in the study area, the cultivated soils are irrigated with water coming from inside the mine, with the intensity of irrigation being higher in the area between 1 and 3 km away from the dump, which is where sandy soil textures are dominant. Irrigation water was sampled using standard methods [29] to allow subsequent analyses at the laboratory.

2.4. Analytical Methods

The dump and cultivated soil materials sampled in the dump and away from the mine were air-dried and sieved using a 2 mm mesh. The parameters determined are detailed in Table 2. In all of the vegetation samples, separate analyses were performed for the roots, stems and leaves of each species. All samples were dried at 60 °C and ground before analysis (Table 2). Irrigation water samples were collected and analyzed (Table 2) as well.

2.5. Statistical Analyses

SPSS software (version SPSS 27.0 for Windows) was used to carry out statistical analyses corresponding to simple and stepwise correlations, regression and ANOVA tests comparing the four field replicates in the different sampling points.

3. Results and Discussion

3.1. General Characteristics of the Mine Dump Materials and the Surrounding Soils

Table 3 shows the main physicochemical characteristics of the dump materials in the various zones subjected to sampling and the soil samples taken at different distances from the dump. Regarding texture, in general, clayed texture dominated both the heap samples and cultivated soils, with the highest value (clay > 80%) corresponding to the soils situated at higher distances from the dump, coinciding with the lithological change of gneiss and granite to serpentinite and schists.
Organic matter contents were higher inside the mine dump, with contents reaching 4.28% for the 0–20 cm depth samples and 3.94% for the depth of 20–40 cm, whereas in the different soils outside of the dump, the values ranged between 1.49% and 2.81% (for the 0–20 cm depth samples) and from 1.01% to 1.57% (for the 20–40 cm depth samples) (Table 3). Although these are relatively low values, even for cultivated soils, they are within the range of values found in other soils in Mozambique [34]. These low levels of organic compounds may be related to the climate, with high temperatures being favorable for microbial activity which rapidly decomposes organic matter when there is enough soil humidity.
Regarding the pH in water, the levels were between 5.2 (in the 0–20 cm layer of the S zone of the dump) and 6.5 (for the subsurface layer in the S zone) (Table 3). These scores correspond to soils in an acid-to-subacid range, which is in agreement with the predominantly siliceous lithology and the high rainfall values characterizing the area. Cultivated soils have a pH of about 6.0, being in the optimal pH range for the growth of most crops, which is considered to be between 5.5 and 7.0 [35].
As for the exchangeable cations, the values in the mine dump were significantly higher (p < 0.05) than those in the cultivated soils, also showing higher concentrations at depths of 0–20 cm (compared with 20–40 cm) in most zones (Table 3). These high levels in the heap may be due to several factors. As it is a mine, waste material accumulated in the dump over a long period of time (34 years) and probably had a greater tendency to change, thus providing more cations. These cations (and mostly Ca and Mg, which are the most abundant resources) can come from the alteration of minerals such as hornblende, talc, clinochlore and biotite (Table 4), which are present more in waste material than in cultivated soils. Covre et al. (2022) [36] also found high levels of exchangeable Ca, Mg and K in tailings from a Cu mine in Brazil, justifying the results through the presence of amphiboles in the first two cations and feldspars and micas for K.
According to Buol et al. (1975) [37], a cultivated soil would have significant problems due to Ca, Mg and K shortages when the concentrations are lower than 1.5, 0.4 and 0.2 cmol(+) kg−1, respectively. Taking this into account, Ca would be at low levels in the cultivated soils in the current study, showing a maximum value of 1.3 cmol(+) kg−1, and even K would be close to the minimum level, since its maximum value was 0.3 cmol(+) kg−1. The scarcity affecting these cations would be justified by the type of parent material and by the abundant precipitation which promotes cationic leaching. On the contrary, relatively high Mg concentrations stood out, which was probably also related to the parent material, given that serpentinite appeared at a distance of 1.5 km from the dump (a distance at which Mg was the most abundant cation), whereas in other areas, certain other minerals also rich in Mg appeared (such as talc, clinochlore, hornblende or biotite) (Table 4).
Regarding exchangeable Al, its presence was low in the cation exchange complex for both the dump and soil samples, with a range between 0.00 and 0.13 cmol(+) kg−1, which was in agreement with the pH values of the samples (most of them being about six). The results in this dump differed from those obtained by other authors at other mine dumps, such as Álvarez et al. (2010) [38], who found Al levels of up to 2.16 cmol(+) kg−1 in an abandoned Cu mine in Galicia (Spain). This difference can be fundamentally due to the parent material, which influences the acidity conditions. In fact, Alvarez et al. (2010) [38] pointed out the presence of metal sulfides in the sterile materials of the dump they studied, resulting in extremely low pH values (<4.0). In the current work, the pH scores were generally above 5.4 at both soil depths and in the heap material. Thus, Al was precipitated, and the exchange complex was dominated by Ca and Mg. Similar results were reported by Todorova and Kostadinova (2019) [39] for another Cu mine.
As for the eCEC, Lopes (1989) [40] indicated that levels ranging from 11 to 50 cmol(+) kg−1 are considered high in soils, while Buol et al. (1975) [37] pointed out that values lower than 4 cmol(+) kg−1 would indicate problems in crop soils due to low eCECs. Following these criteria, the cultivated soils of the present study had extremely low eCECs (between 0.29 and 1.67 cmol(+) kg−1 for both depths in all samples) (Table 3). This low eCEC can be explained by the minerals present in the clay fraction, among which were kaolinite and gibbsite (Table 4), and (probably) non-crystalline Fe and Al minerals, which have variable charges and low ion exchange capacities, in conjunction with the low organic matter contents of these soils. In the center of the mine dump (with materials showing higher organic matter contents), the eCEC maximum values were 19.5 cmol(+) kg−1 at a depth of 0–20 cm and 3.9 cmol(+) kg−1 at 20–40 cm.
Regarding the available P, its levels were also higher inside the dump, reaching about 29.09 mg kg−1 for the 0–20 cm depth samples and 20.18 mg kg−1 for those at the 20–40 cm depth, while in the agricultural soils, the concentrations were lower at both depths (between 2.00 and 4.14 mg kg−1). According to authors such as Buol et al. (1975) [37] and Domínguez Vivancos (1997) [41], available P values below 5 mg kg−1 are considered low or extremely low, which highlights the scarce P concentrations in the soils in the current study, possibly due to the existence of non-crystalline Fe and Al minerals that have a high pH point of zero charge value and therefore a positive charge at the pH of these soils, making P unavailable. All of this indicates rather low fertility potential for these agricultural soils [42].

3.2. Heavy Metals in the Mine Dump and in the Surrounding Soils

3.2.1. Total Heavy Metal Contents

Copper was present in concentrations significantly higher (p < 0.05) than those of the other heavy metals, giving the sequence Cu > Cr > Ni > Zn > Pb > Cd when considering the whole set of samples. The presence of Cu in these samples is associated with that of other heavy metals, as indicated by the significant correlations (p < 0.01) obtained with Zn, Cd and Pb (with their r values being 0.514, 0.516 and 0.503, respectively). Likewise, significant correlations were obtained for Zn with Ni, Cd, Cr and Pb (with r values of 0.484, 0.813, 0.726 and 0.533, respectively), for Ni with Cd, Pb and Cr (with r values of 0.427, 0.29 and 0.586, respectively), for Cd with Pb and Cr (with r values of 0.726 and 0.407, respectively) and for Pb with Cr (r = 0.252).
Copper concentrations were highly variable in the mine dump material (Figure 2), being generally higher in the surface layer, which was probably related to its high affinity for organic compounds [43,44]. Considering the average concentrations at each sampling point, the highest values (reaching 9478.8 mg kg−1) were detected in the surface layer of the E zone in the heap, and the lowest (19.37 mg kg−1) was found in the subsurface layer of the S zone. In other studies, located in Galicia (NW Spain), the total Cu contents reported for mine dump materials were about 773 mg kg−1 in a Cu mine [45], between 10 and 100 mg kg−1 in a pyritic mine [46] and between 274 and 5421 mg kg−1 in a tungsten mine [11], with all of them being lower than those obtained in the E zone of the dump in the current study. In the cultivated soils located at different distances from the dump, the levels varied between 4947.4 mg kg−1 at 1.5 km and 130.9 mg kg−1 at 3 km, with both in the subsurface layer. The values in the dump were always higher in the surface layer, while no clear trend was found for the soils.
It must be noted that the possible existence of soil metal pollution is considered when the contents of some heavy metals are clearly higher than those usually present in natural soils. Macías and Calvo (2009) [47] indicated that the normal total Cu levels in soils would be between 20 and 100 mg kg−1, while Dusengemungu et al. (2022) [48] reported that 1–140 mg kg−1 are frequent Cu soil concentrations. The recommended limit values for agricultural soils given by authors such as Kabata-Pendias (2011) [49] and Dusengemungu et al. (2022) [48] are between 23 and 100 mg kg−1. The data obtained in the current work were generally above those ranges, and even in some parts of the dump and for the cultivated soils located 1.5 km from the mine, they exceeded the reference values for “anomalous” soils (>2000 mg kg−1) [50,51] and for industrial soils (1000–8000 mg kg−1) [47].
The high Cu concentrations found in the cultivated soils at 1.5 km (Figure 2) coincided with the dominant presence of serpentinite rocks in that area (Table 1), although they were much higher than those obtained in the soils of other serpentinite areas, where they did not exceed 800 mg kg−1 [47], with the most frequent range being between 40 and 400 mg kg−1. Therefore, there may be other causes responsible for the high Cu contents found at 1.5 km from the dump, such as the irrigation of those soils with water from inside the mine dump, which presented Cu levels reaching 186.88 µg L−1 (Table 5). In this line, Saha et al. (2022) [52] indicated that the high ecological risk in some areas near an abandoned mine in Mexico was due to the persistent use of contaminated irrigation water (in their case by As). Air pollution from particles from the dump could be another reason for the high Cu levels.
Figure 2. Total concentrations (mg kg−1) of heavy metals in the mine dump for center (CE), north (N), south (S), east (E) and west (W) and soils located at 0.5, 1, 1.5, 3 and 6 km distances and at two depths (0–20 cm and 20–40 cm). Average values for quadruplicates shown with error bars. The horizontal lines indicate the toxicity thresholds [49].
Processes 13 00902 g002
Referring to Zn, its mean total concentrations were above 100 mg kg−1 in most cases and at each sampling point. The highest values were detected in the central zone of the mine (173.0–224.6 mg kg−1) and at distances of 1 km and 1.5 km (162.0 and 204.5 mg kg−1, respectively), while the lowest levels corresponded to the S zone (13.3–31.3 mg kg−1). As a comparison, the total Zn contents obtained in different mine waste materials from Galicia (Spain) were 57.8 mg kg−1 in a Cu mine [45], between 100 and 175 mg kg−1 in a pyritic mine [46] and between 74 and 895 mg kg−1 in a tungsten mine [11]. According to Macías and Calvo (2009) [47], Zn concentrations in soils usually vary between 10 and 300 mg kg−1, although these authors found concentrations of 750 mg kg−1 in Galician agricultural soils. For Bowie and Thornton (1985) [50], the “normal” values in soils would be in a range between 25 and 200 mg kg−1. Dusengemungu et al. (2022) [48] gave a range of 17–125 mg kg−1 for Zn in soil surface horizons around the world and a recommended limit of 74 mg kg−1 for agricultural soils. Tietjen (1975) [53] and Kabata-Pendias (2011) [49] considered 300 mg kg−1 as the Zn soil toxicity limit. Taking into account all of these results, the Zn values in the samples of the current study could generally be considered in the normal range both inside and outside of the mine, although they were, in most cases, higher than the upper limit recommended for agricultural soils.
Regarding the total Cr, its content was clearly higher in the agricultural soils around the mine (ranging between 846.7 and 3882.0 mg kg−1) compared with those in the dump (48.3–1312.5 mg kg−1). High values stood out at distances between 1 and 3 km, especially at 1.5 km, where they were above 3000 mg kg−1. According to Macías and Calvo (2009) [47], the most frequent values in soils were between 40 and 200 mg kg−1, while many legislative bodies indicate that 100 mg kg−1 would be the maximum acceptable value for Cr in agricultural soils [43,51], and Kabata-Pendias (2011) [49] proposed a toxicity limit between 75 and 100 mg kg−1. The values found in the present study were much higher than the above recommended limits, especially in the agricultural soils, and even exceeded the concentrations reported for soils in serpentinite quarries [54]. High Cr levels are often associated with mining areas of ultrabasic and basic rocks and areas where Cr is involved in industrial use [47]. In the present study, the presence of ultrabasic rocks such as serpentinites could explain some of the high values detected in the soils, especially in those located at distances of 1.5 km away (Figure 2). In fact, Macías and Calvo (2009) [47] indicated that values between 1000 and 3400 mg kg−1 have been found in ultrabasic rocks, and levels of up to 10,000 mg kg−1 can be reached in soils developed over these rocks. In any case, as noted above, the Cr scores quantified in the current investigation were rather high for all of the cultivated soil samples, like in some parts of the dump. In light of this, and in addition to the presence of ultrabasic rocks at some points, the irrigation of these agricultural soils with mine water, together with a potential aerial input from the heap material, could be considered to eventually influence the Cr contents, as previously indicated by other authors [55].
Another heavy metal under study was Ni, which showed values below those of Cr but highly similar behavior, with a significant correlation between both elements (r = 0.58, p < 0.01) and also much higher levels in the cultivated soils than in the dump (Figure 2). The Ni concentrations in the heap material ranged between 62.3 and 805.3 mg kg−1, while the range was from 491.6 to 2427.0 mg kg−1 in the cultivated soils. Previous investigations reported total Ni contents in dump waste materials from Galicia (Spain) of 5 mg kg−1 for a Cu mine, between 100 and 1000 mg kg−1 for a pyritic mine, and <0.5 mg kg−1 for a tungsten mine [11,45,46]. Alloway (1990) [56] indicated that the average Ni range in soils is 20–40 mg kg−1, while Bowie and Thornton (1985) [50] reported that normal Ni values range from 2 to 100 mg kg−1 in soils, considering anomalous concentrations surpassing 8000 mg kg−1. Tietjen (1975) [53] and Kabata-Pendias (2011) [49] situated the toxicity limit for Ni at 100 mg kg−1. High Ni values are frequently detected in soils over serpentinized basic rocks, with concentrations reaching up to 2500 mg kg−1 [57], while they have been found to be between 1000 and 4000 mg kg−1 for soils over basic rocks [47].
Considering that the legislative bodies from a variety of countries indicate that the maximum Ni values in agricultural soils should be between 50 and 100 mg kg−1, with those reaching 500 mg kg−1 needing urgent intervention according to Dutch laws [51], the values found in the current study would indicate the existence of problems due to high Ni contents, especially in agricultural soils. These high values could again be justified by the presence of ultrabasic rocks in the area, given that the highest concentrations appeared at a distance of about 1.5 km, where serpentinite abounds (Table 1). Although, as discussed in the case of Cr, other causes could also be partially responsible.
In relation to Cd, the values were between 0.03 and 0.67 mg kg−1, being generally higher in the cultivated soils compared with the mine dump. For the latter, the Cd levels were clearly higher in the surface layer (0–20 cm), especially in the E zone (0.575 mg kg−1), whereas in the crop soils, the values were higher in the deepest layer (20–40 cm), again surpassing the samples situated at 1.5 and 3 km from the mine. Compared with previous studies, the total Cd contents were 0.08 mg kg−1 in a Cu mine and lower than 0.5 mg kg−1 for the pyritic mine and wolfram mine in Galicia mentioned above [11,45,46]. According to Macías and Calvo (2009) [47], the most frequent Cd values in soils ranged between 0.01 and 3 mg kg−1, with granitic areas having the lowest levels. These authors gave the following sequence for Cd in soils according to the parent rock from which they were derived: limestone > basic rocks > slates > ultrabasic rocks = shales > quartzites = granites. In the present study, the cultivated soils over granite had, in general, the lowest Cd concentrations (at distances of 0.5 to 1 km from the mine), particularly in the surface layer. Given the danger associated with this element, the toxicity limit proposed by Tietjen (1975) [53] and Kabata-Pendias (2011) [49] is 5 mg kg−1. Taking this into account, and considering the soils of the present study, no particularly noteworthy problems associated with the presence of Cd would be expected, given that its values were below those limits in all samples.
When considering the Pb levels, the samples from the dump were in a range from 1.18 to 171.16 mg kg−1, highlighting the surface layer of the E zone (like what happened with Cu and Cd). In the cultivated soils, the range was from 14.43 to 79.16 mg kg−1, with the highest levels again situated at a distance of 1.5 km away for both layers (Figure 2). Bowie and Thornton (1985) [50] indicated that the normal range for Pb in soils would be 10–150 mg kg−1, while for Macías and Calvo (2009) [47], the most frequent range oscillated between 3 and 189 mg kg−1, with an average value of about 30 mg kg−1. Dusengemungu et al. (2022) [48] considered a similar range (1.5–176 mg kg−1) in surface horizons and a concentration of 26 mg kg−1 as a limit for agricultural soils. However, many countries proposed higher levels (50–100 mg kg−1) as being tolerable for agricultural soils [43,49]. In the present study, the values were within the above indicated normal ranges for soils, although many of them showed levels above the limits for agricultural soils.
As shown in Table 5 (which includes the concentrations of the different heavy metals present in the water extracted from the mine and used for irrigation of the cultivated soils located at distances between 1 and 3 km from the dump), the values were below the maximum limits allowed by the FAO [58,59], which are 200, 5000, 10, 100, 2000 and 200 µg L−1 for Ni, Pb, Cd, Cr, Zn and Cu, respectively. In any case, the levels of most of the heavy metals in the irrigation water were generally higher than those detected in different waste waters also used for irrigation [60] and those in spring waters from other serpentinite areas [61]. As several authors pointed out [52,61,62], long-term irrigation with water containing a certain concentration of heavy metals (not necessarily extremely high) is one of the main causes of accumulation of these hazardous elements in soil.

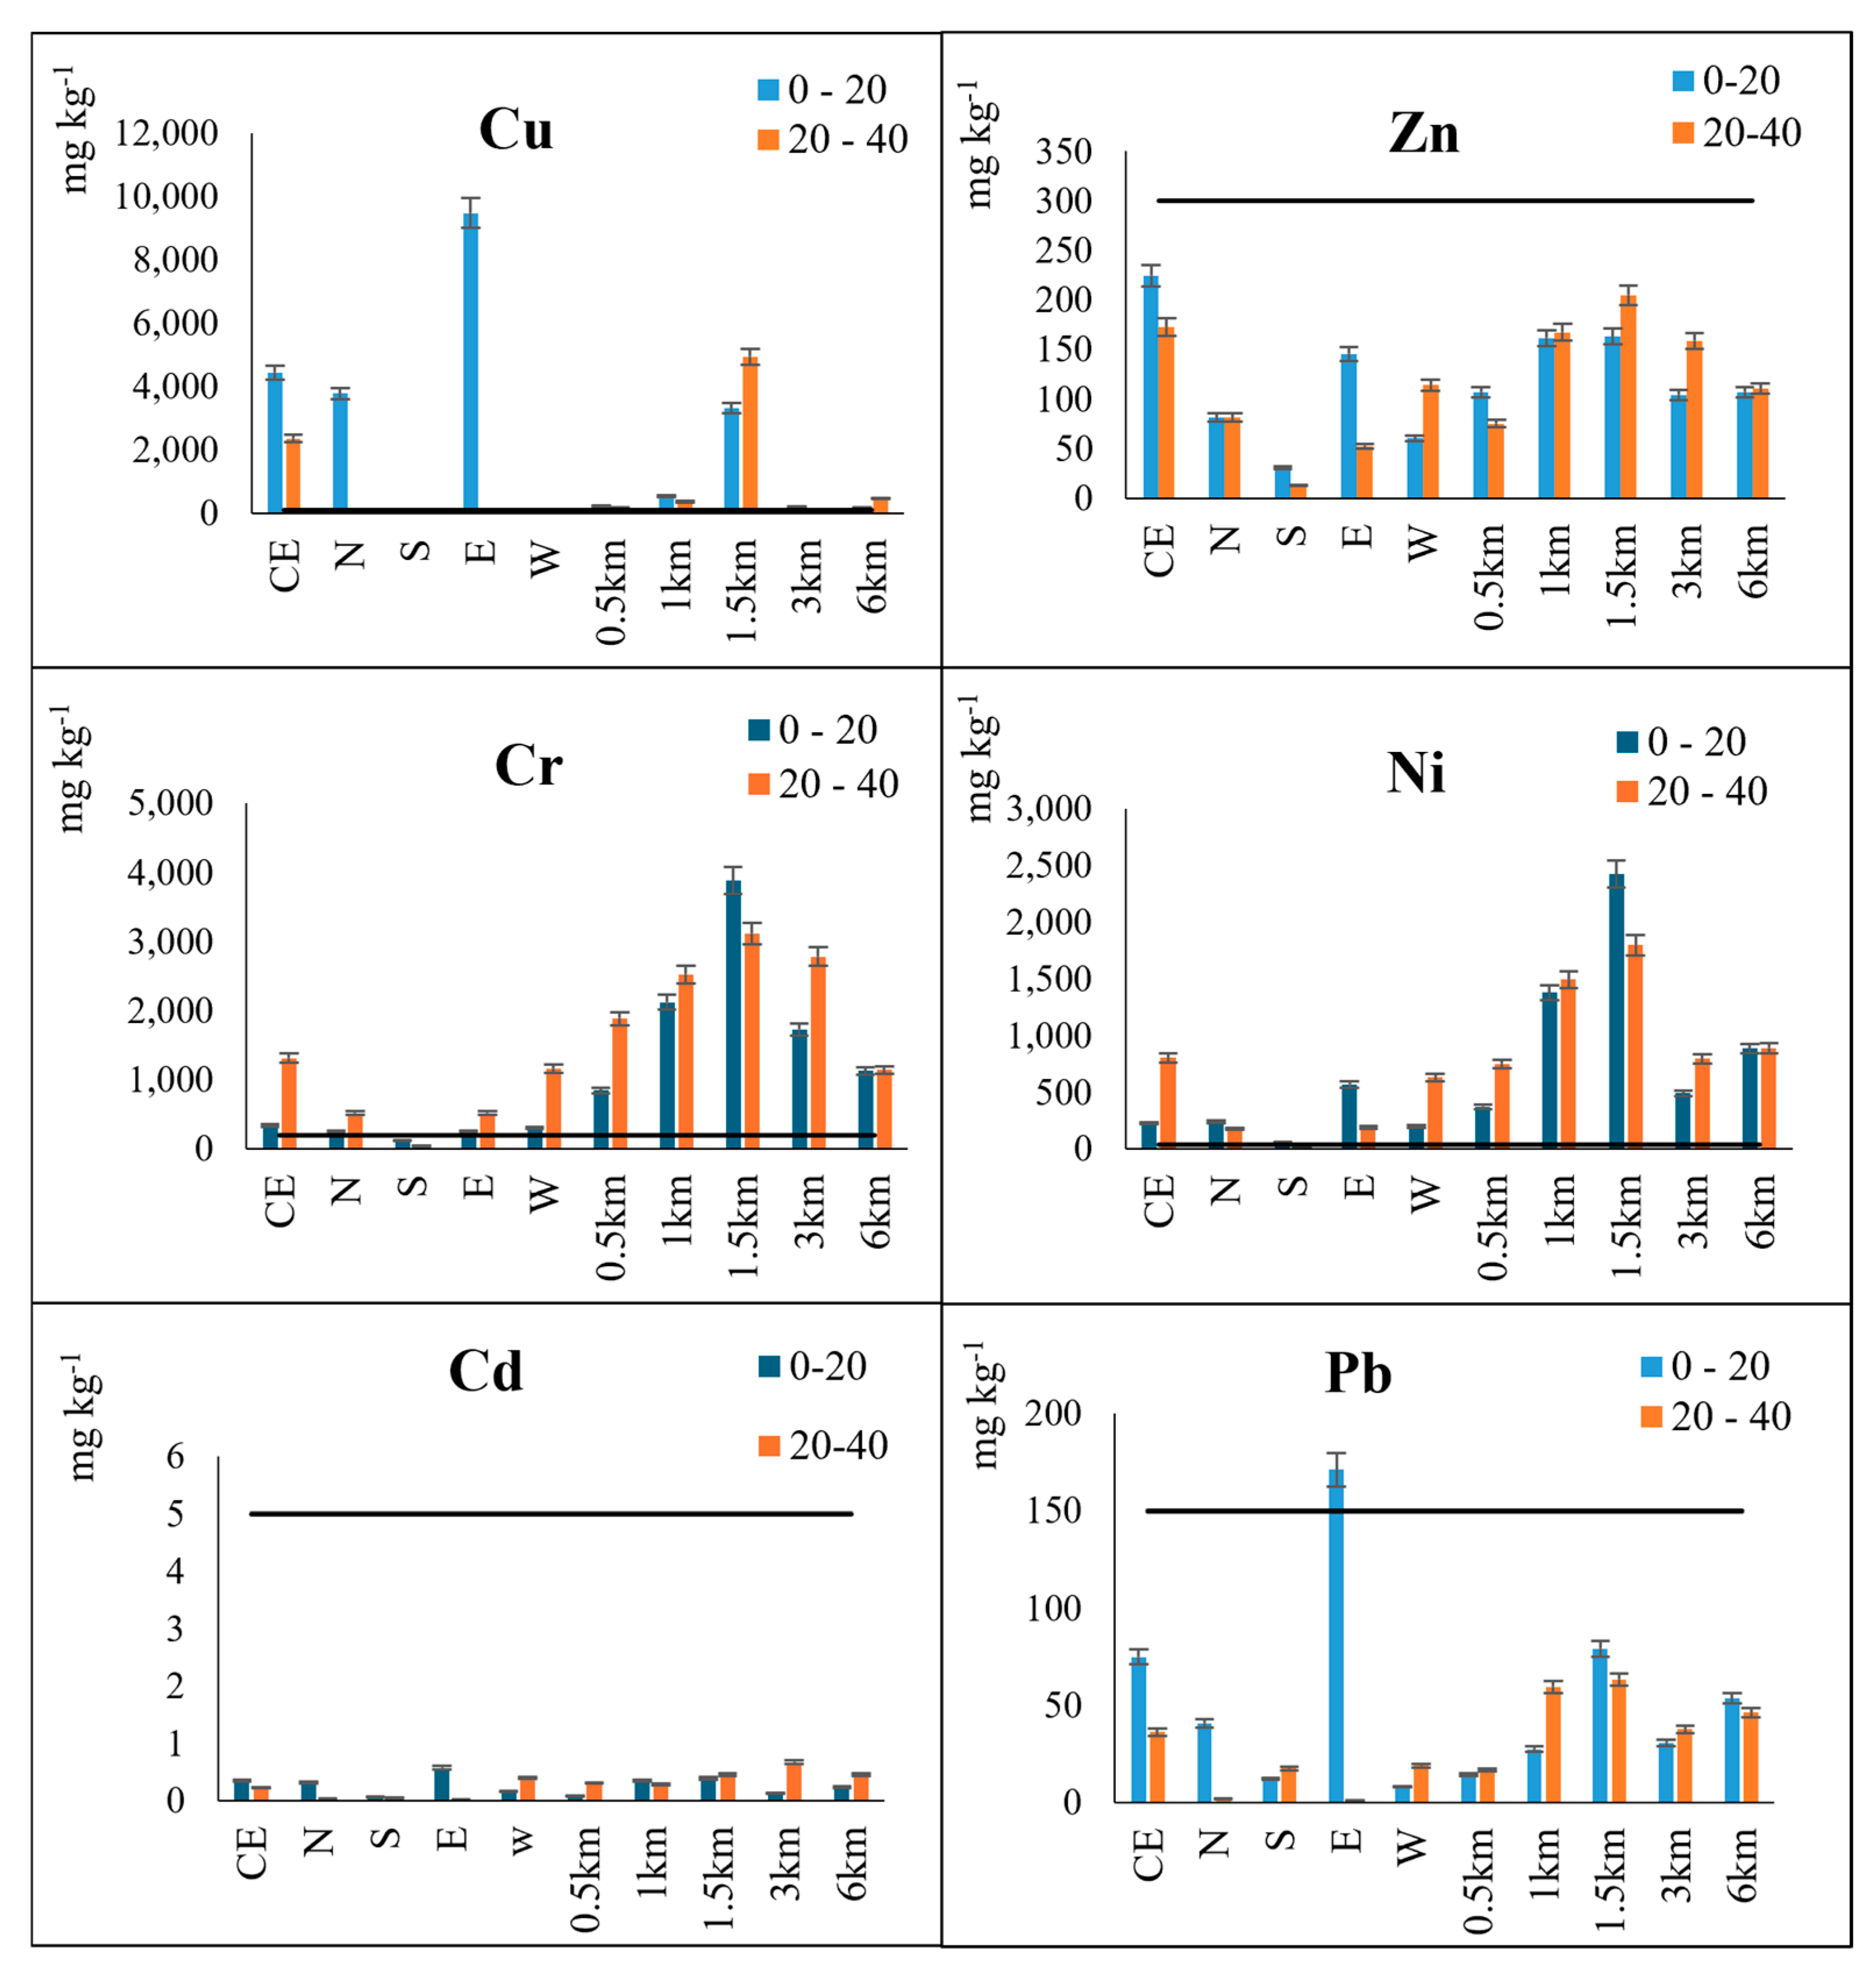
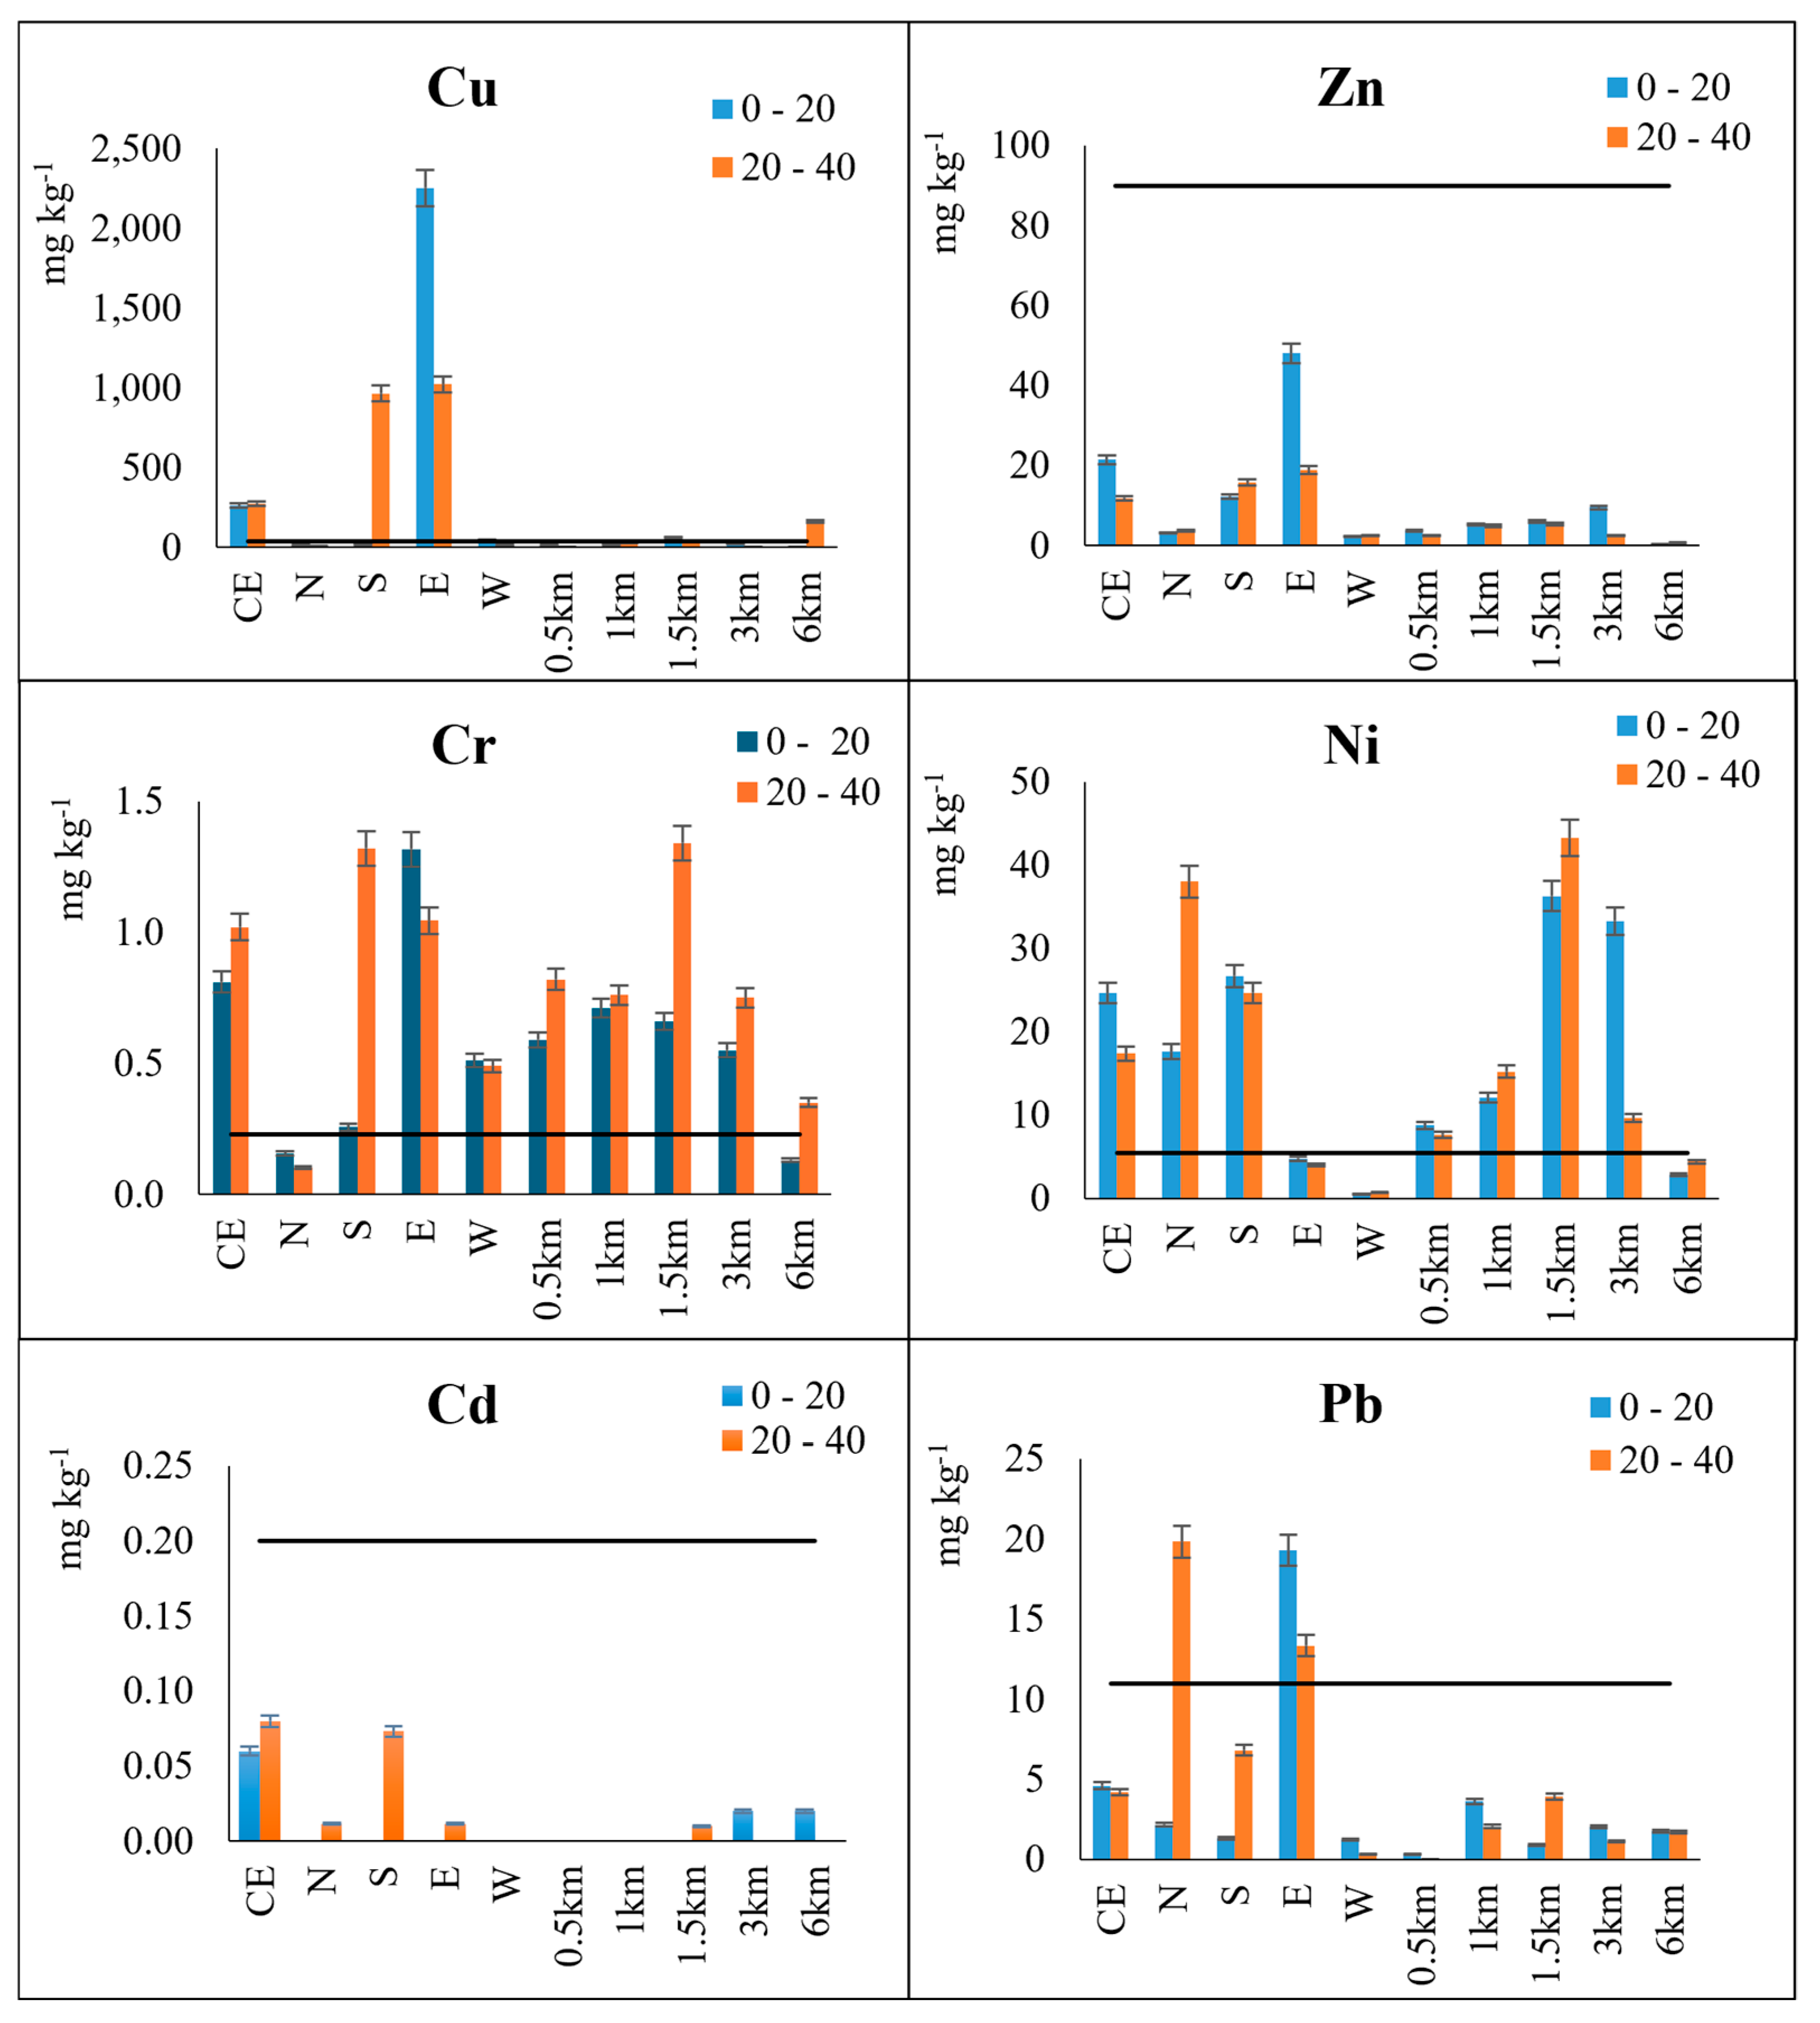
3.2.2. Available Heavy Metal Contents

The available Cu concentrations were higher inside the mine dump, with the most marked values (2252.97 mg kg−1) being in the E zone and at a depth of 0–20 cm, as was the case for the total Cu. These available Cu levels far exceeded those found in Galicia (Spain) in a tungsten mine (<1000 mg kg−1) [11] and in a Cu mine (50–100 mg kg−1) [63]. In the agricultural soil samples of the current study, the available Cu concentrations did not exceed 100 mg kg−1, with less pronounced differences compared with those in the total fraction. The ratio of available Cu to total Cu was generally between 6% and 28% in the dump and in the range of 3–11% for the agricultural soils, thus showing much lower scores than those found in the previously mentioned tungsten mine (up to 85% of the total Cu was available). Copper availability is closely related to its speciation in soils, as Cu appears in different forms, including those linked to exchangeable sites, precipitated or adsorbed [64], and its availability also depends on the values for the pH, eCEC and organic matter content. In this way, in the current study, a significant correlation (r = 0.27, p < 0.05) was shown between the available Cu and total Cu, as well as an extremely high correlation with the exchangeable Cu (r = 0.91, p < 0.01) and between the pH and eCEC of the soil samples, explaining 22% of the available Cu variance (Table 6).
The fact that the pH values in the surface layer were lower in the dump (5.4) than in the cultivated soil samples (5.8–6.3) would facilitate the availability of this metal. In addition, the high organic matter contents (which has a marked affinity for Cu) would favor the formation of organometallic complexes, with some of these complexes potentially making Cu unavailable, while other complexes would be able to facilitate its availability [65]. Monterroso et al. (1999) and Álvarez et al. (2003) [11,46] gave toxicity limit values for this element of about 40 mg kg−1 in mine soils when extracted with the Melhich-3 reagent (also used in the current investigation), although these limits could not be taken categorically; rather, they were only used as a reference in the first evaluation of the concentration of this element. When taking this into account, the available Cu concentrations clearly exceeded this limit in several areas of the mine, while most of the agricultural soil samples were below this limit (Figure 3).
Available Zn levels were also clearly higher in the mine heap compared with the cultivated soils, especially in the E zone, with values close to 50 mg kg−1 in the surface layer (Figure 3). Álvarez et al. (2003) [11] obtained concentrations between 5 and 100 mg kg−1 for the available Zn in a tungsten mine, with the most frequent values being approximately 40 mg kg−1, while Otero et al. (2012) [63] reported available Zn concentrations between 2 and 8 mg kg−1 in a Cu mine. The available Zn levels did not exceed 10 mg kg−1 in the cultivated soils of the present study. This behavior differs from that indicated for the total contents, where the highest values were detected in the cultivated soils (together with the central area of the mine dump). Again, the available/total ratio was much higher for Zn in the mine (2–40%) than in the cultivated soils (almost always <4%), with the range being close to that reported by Álvarez et al. (2003) [11] in a tungsten mine (0.7–38%). Similar to what was indicated for Cu, Zn availability was significantly related to the total Zn concentration (r = 0.48, p < 0.05) and increased as a function of the decrease in the pH, organic matter content and clay content values [66]. In this line, the eCEC and pH explained 27% of the available Cu variance (Table 6), which can justify, in part, the higher availability found in the mine area compared with that of the crop soils. Monterroso et al. (1999) [46] proposed a toxicity limit of 90 mg kg−1 for the available Zn, with none of the samples studied in the current research exceeding it.
In relation to the available Cr, no marked differences were found between the mine area and the cultivated soil samples, contrary to what was seen for the total Cr (as the agricultural soils had total Cr levels much higher than those in the mine). In this case, the values of the available forms did not exceed 1.5 mg kg−1, with the lowest concentrations located in the N zone of the mine and 6 km away and the highest concentrations being found in the central zone of the dump. In addition, the ratio of available Cr to total Cr was extremely low in all samples (usually <0.1%), which would decrease its potential toxicity. On the other hand, there was no correlation between the available Cr fraction and the total Cr content. In other mine dumps studied in Galicia [11,63] Cr was hardly found in an available form. This low availability can be attributed, on one hand, to the resistance to alteration presented by primary minerals such as chromite and the low solubility of Cr oxides and hydroxides. On the other hand, it can be attributed to adsorption on clays, organic matter and (mostly) precipitation as oxides or hydroxides, especially at subacid-neutral pH values and with Eh < 600 mV. These conditions are frequent in soils, where the predominant Cr species would be Cr(III), which is less mobile [47,63]. However, the available Cr concentrations found in the current research were higher than the reference value indicated by Macías and Calvo (2009) [47] for soils (0.23 mg kg−1).
Regarding available Ni, its highest concentrations appeared in the agricultural soils located 1.5 km and 3 km away from the mine (with a maximum value of 43 mg kg−1) (Figure 3), following the trend mentioned for the total forms. However, there were areas of the mine (CE, N and S) where the values were also relatively high (between 17 and 38 mg kg−1), a trend which was not observed for the total Ni. The lowest scores (<0.8 mg kg−1) appeared in the W zone of the mine. Previous studies found available Ni values ranging from 0.6 to 13.33 mg kg−1 for a pyritic tailing from lignite extraction [46], reaching 0.40 mg kg−1 in a tailing from a Cu mine [63]. Monterroso et al. (1999) [46] indicated as toxicity limits for Ni values of 4.0 mg kg−1 and 5.5 mg kg−1 (for pH levels of about 5.5 and 6.5, respectively). In the present study, the levels in the mine dump were higher than the above limits, except in the W zone. Also, almost all cultivation soils had higher values, being most evident 1.5 and 3 km from the mine. The highest proportions of available Ni compared with the total Ni were again obtained in the heap samples (except in the W zone), ranging between 2.2% and 43%, while most cultivated soils showed ratios below 2.5%. The factors which most influenced Ni solubility were the presence of clay, organic matter, carbonates, phosphates and sulphates and, above all, acidity, which increased availability, especially at a pH level <6.0 [47,67]. In the present study, the OM, eCEC and pH explained 32% of the variance in available Ni (Table 6). The samples with pH levels <6 (soils located 1.5 and 3 km away from the mine and in the dump area) were the ones with the highest availability of Ni, which also coincided with a serpentinite zone.
The available Cd values were low in all cases (<0.08 mg kg−1). The threshold levels proposed by Monterroso et al. (1999) [46] for mine soils were about 0.25 mg kg−1 due to the high toxicity of Cd. In the current study, all samples had concentrations lower than that proposed limit, coinciding with what was found by Otero et al. (2012) [63] for the tailings of a Cu mine in Galicia (Spain).
Regarding the available Pb, its concentration was clearly higher in the N and E areas of the dump, with maximum levels close to 20 mg kg−1 (Figure 3), while in the rest of the mine and in the cultivated soils, they did not exceed 5 mg kg−1. Otero et al. (2012) [63] found values between 0.02 and 0.73 mg kg−1 in a Cu mine dump, and Monterroso et al. (1999) [46] detected levels between 0.01 and 8.39 mg kg−1 in a lignite mine dump. In the present study, except in the N and E zones, the rest of the samples had values lower than the limit concentration given by Monterroso et al. (1999) [46], which was 11 mg kg−1. In the current investigation, the ratio of available to total Pb was between 0.24% and 13.3% in all samples, and the correlation between the available and total contents was significant (r = 0.46, p < 0.05).
With all of the above data corresponding to the different heavy metals assessed, it can be observed that the levels of available Cu, Zn, Cd and Pb were higher in the dump, obtaining significant correlations between the total and available forms, while for the cultivated soil samples, the high values of Cr and Ni stood out in those samples collected 1.5 km away, which coincided with the presence of serpentinite as lithological material, which also showed a significant correlation (Table 6).

3.2.3. Exchangeable Heavy Metal Contents

Cu was the most abundant heavy metal in the exchange complex of the samples in the present study, followed by Ni and Zn (Figure 4). The maximum exchangeable Cu values were detected in the E and CE zones of the mine, where concentrations close to 200 mg kg−1 were reached (and where the highest total and available Cu levels were also obtained). Except for these two areas, where the exchangeable Cu values were higher than those reported in other metal dumps [68], the rest of the areas evaluated in the present study had lower values. In the surrounding soils, concentrations of exchangeable Cu were generally <0.9 mg kg−1. An exception to this was the soils located 3 and 6 km from the dump, with concentrations of about 13 mg kg−1, comparable to those obtained in soils near a Cu mine in Botswana (from 9.5 to 24.4 mg kg−1) [69]. Exchangeable Cu represented a maximum of 7% of the total Cu and between 5% and 10% of the available Cu. The trend in the different samples was similar to that observed for available Cu (Figure 3 and Figure 4), while a highly significant correlation (r = 0.95, p < 0.01) between the exchangeable and available Cu was also found.
The values for exchangeable Zn were always lower than 12 mg kg−1, with the maximum found again in the E zone of the mine. These concentrations were in the range of those reported for mine tailings with a pH similar to that of the present study [70] but were higher than those obtained in other soils close to a Cu mine [69]. The lowest values in the present study (<0.5 mg kg−1) were detected in the N and W zones of the mine and in the soils located 0.5 km and 6 km away. Exchangeable Zn represented a percentage of the total Zn between 0% (N and W zones) and 8% (surface layer of the E zone), while compared with the available Zn, it was between 0% (N and W zones) and 64% (6 km away). We also observed a highly similar trend for both (Figure 4) and a significant correlation (r = 0.37, p < 0.05) higher than that found between the exchangeable and total Zn (which had a value of r = 0.30).
Exchangeable Cr showed its highest concentrations in the cultivated soils, especially at distances of 1.5 km (in the surface layer) and 3 km from the mine, with values between 0.2 and 0.5 mg kg−1. These levels were lower than those obtained by Iwegbue et al. (2010) [71] for soils near copper mine zones with similar pH levels and organic matter contents. In the dump studied in the current research, the levels were much lower (below 0.15 mg kg−1). In relation to the total, exchangeable Cr represented a rather low percentage (<0.05%), while the proportion of exchangeable Cr with respect to the available Cr had a wide range, being from 0% to 9% for the mine samples and from 4.5 % to 61% for the cultivated soils.
Exchangeable Ni showed the highest concentrations in the agricultural soils located 1.5 and 3 km away from the mine and in the E area of the dump, with values between 15 and 20 mg kg−1. Manyiwa et al. (2022) [69] also found similar levels of exchangeable Ni in soils around a Cu and Ni mine. In the current study, the lowest concentrations were observed in the N zone of the mine and in the soils located 0.5 and 6 km away (Figure 4). This exchangeable fraction represents between 0.1% and 34% of the total Ni, although in most samples, it was < 5%. With respect to the available fraction, exchangeable Ni represented up to 60% of it, with the highest percentages corresponding to the soils situated at a distance of 1 km from the dump. The correlation between both fractions was highly significant (r = 0.70, p < 0.01).
The exchangeable Cd values were extremely low (generally <0.02 mg kg−1), similar to those for the available Cd, with which it presented a high correlation (r = 0.78, p < 0.01).
Exchangeable Pb concentrations were clearly lower than those of the available Pb and were only detected in the CE and E zones of the mine (with levels between 1.0 and 0.2 mg kg−1). In contrast to the total and available Pb, exchangeable Pb was not detected in any of the crop soils.

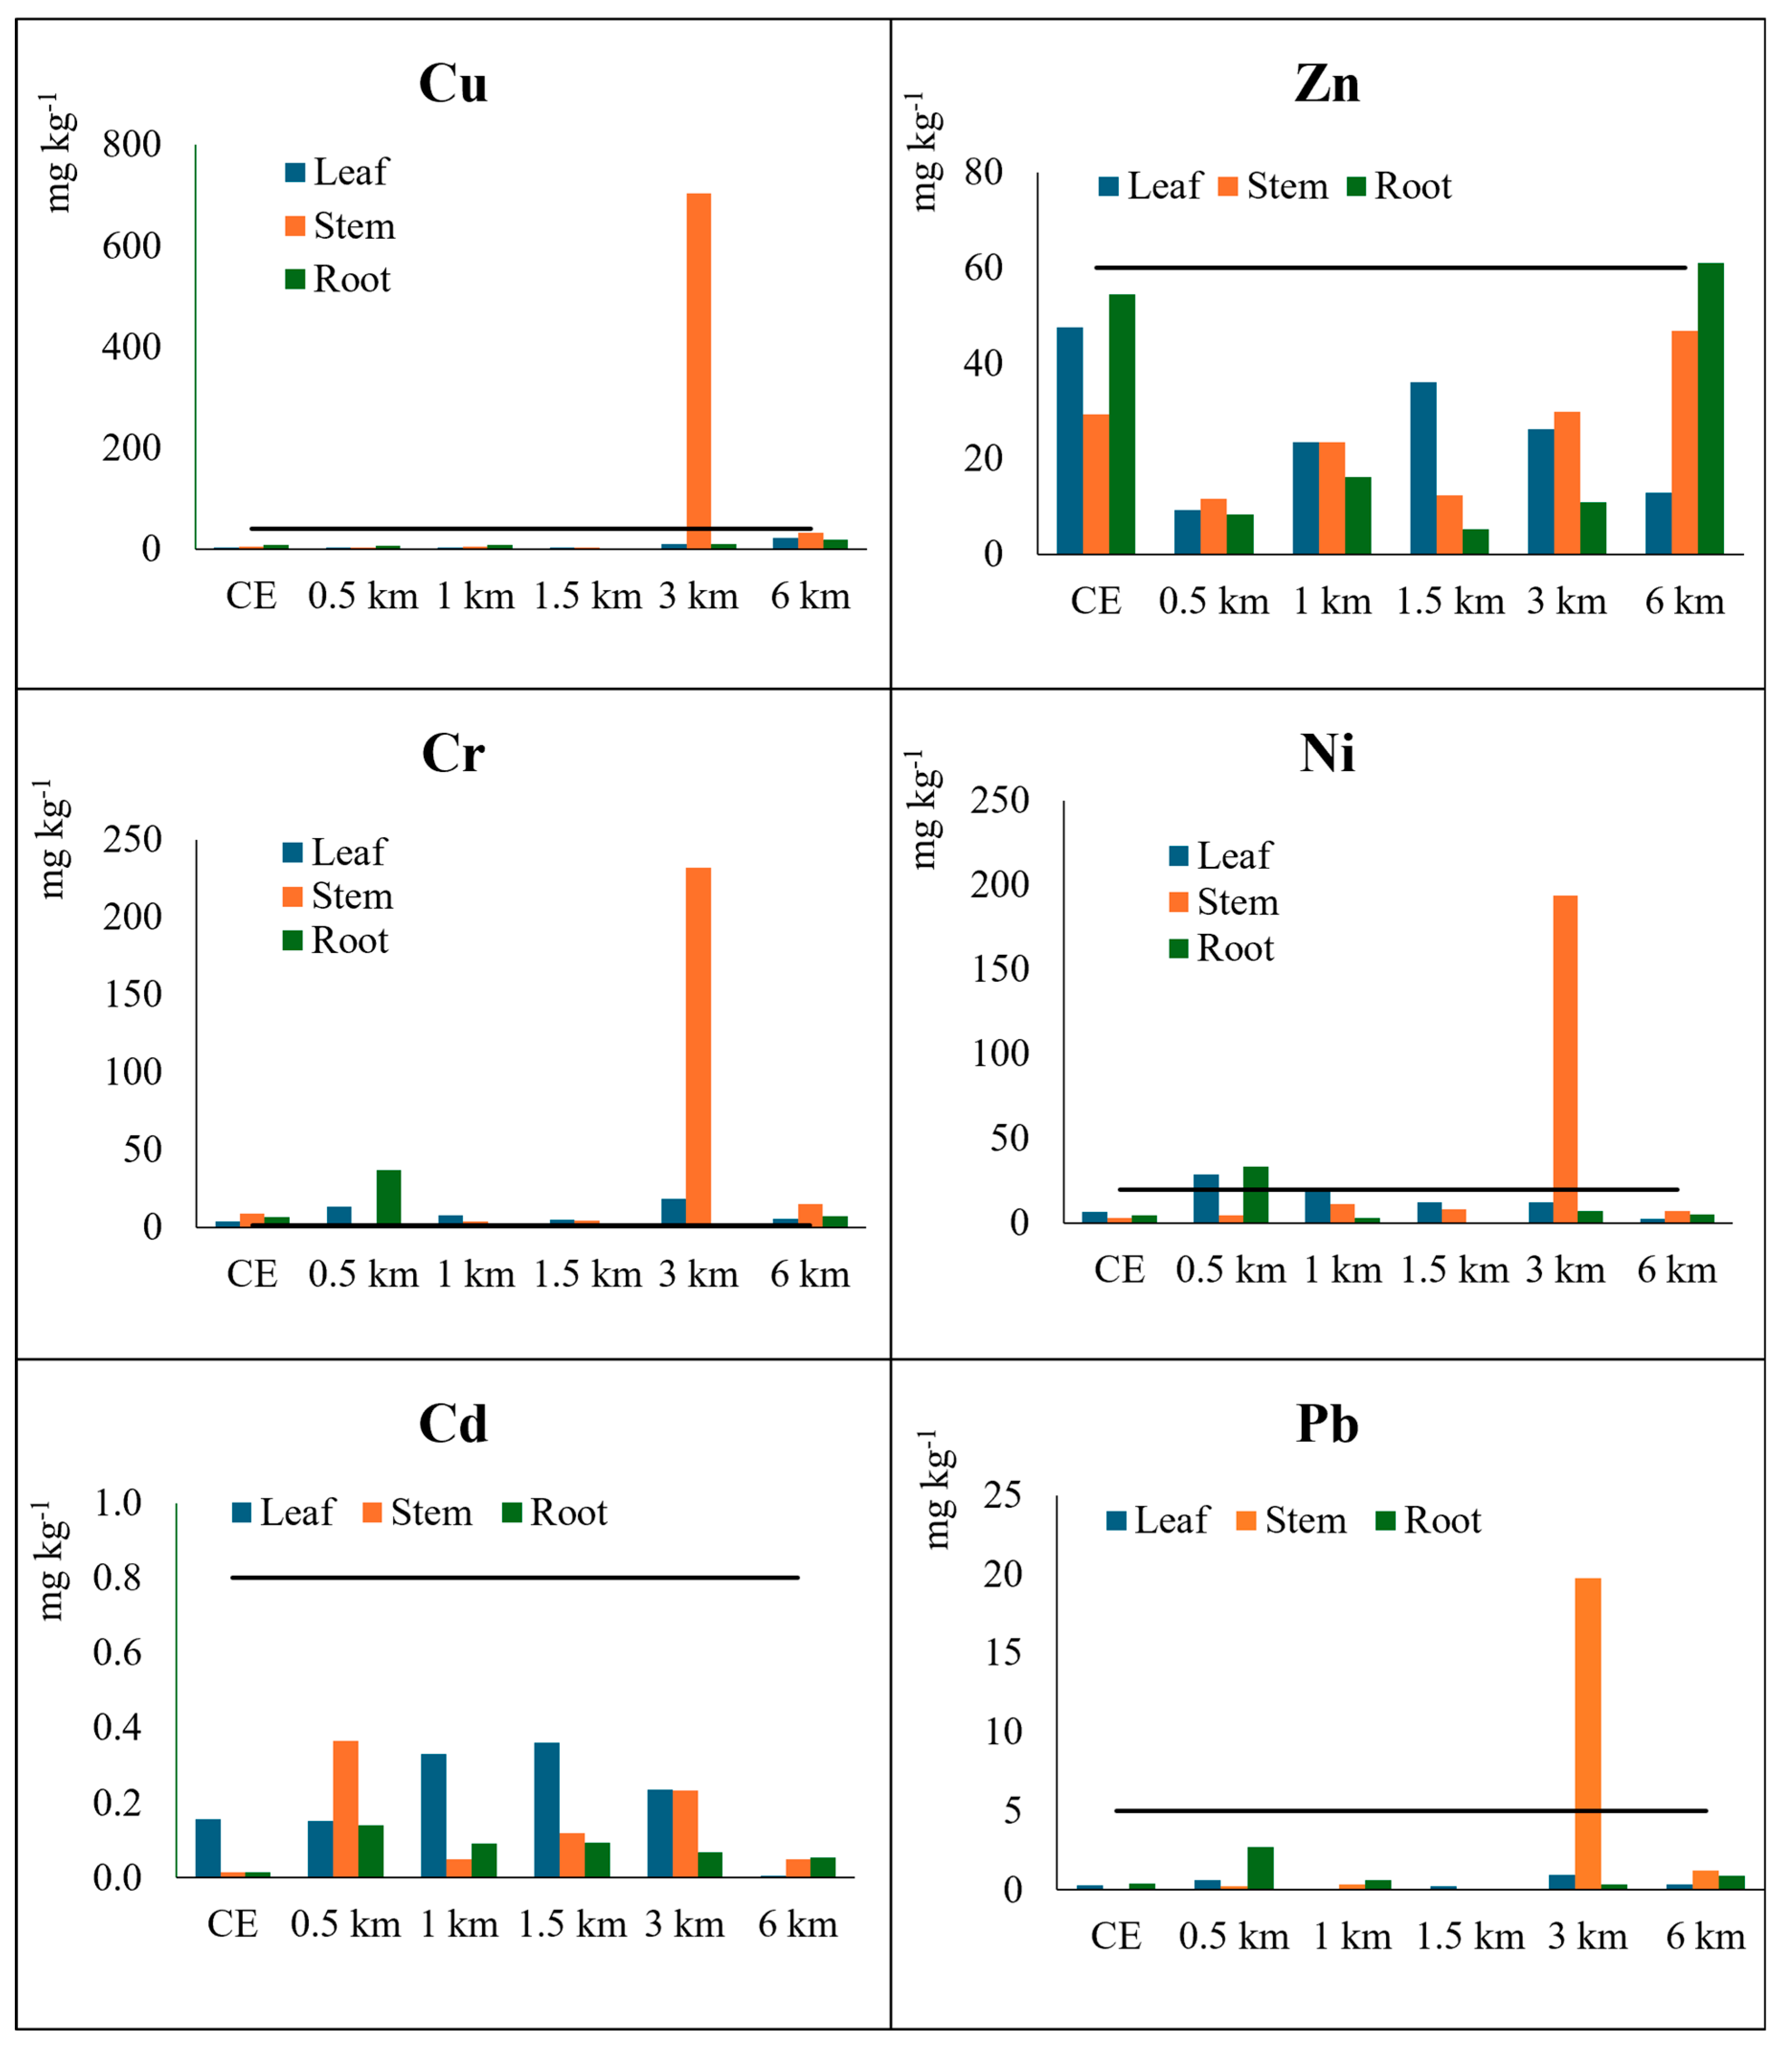
3.3. Heavy Metals in Vegetation Samples

Figure 5 shows the concentrations of heavy metals in different parts (root, stem and leaf) of the plants being sampled and analyzed. The concentrations of Cu, Cr, Ni and Pb in the plants which grow 3 km from the mine stood out, especially for the stems. Zn appeared in higher levels in the plants growing at the mine (CE zone) and 6 km away, especially in the roots and stems. The plants which grew in cultivated soils located between 0.5 and 3 km away were the ones with the highest Cd levels, especially in the leaves and stems.
Copper showed concentrations of up to 700 mg kg−1 in the stems of plants located 3 km away from the mine, while the rest of the samples had much lower values (generally <20 mg kg−1). Álvarez et al. (2003) [11] analyzed different tissues of different plants growing in mine soils, detecting Cu concentrations between 20 and 100 mg kg−1. Hao and Jiang (2015) [72] reported values between 1.96 and 53.4 mg kg−1 and indicated that the normal range for Cu in plants from uncontaminated soils would be 0.4–45.8 mg kg−1, while Macías and Calvo (2009) [47] suggested a range of 1–10 mg kg−1. The levels found for Cu in the present study were within the first range (0.4–45.8 mg kg−1), except for the concentration in the stems of plants growing 3 km away from the mine, which widely exceeded these values, and the plants growing 6 km away would also exceed the second range (1–10 mg kg−1). However, the values in practically all of the samples, for both the roots and stems, were below the maximum concentration recommended by the WHO [73], which is 40 mg kg−1.
For Zn, the values obtained were between 5.23 and 61.0 mg kg−1 in the different parts of the plant, with maxima inside the mine and 6 km away. These levels were much lower than those found by Farooq et al. (2008) [73] in different parts of plants growing in soils close to industrial areas (0.361–1893 mg kg−1) and by Álvarez et al. (2003) [11] in a tungsten mine dump (40–700 mg kg−1), while also being slightly lower than those indicated by Hao and Jiang (2015) [72] for plants from metal mining areas (0.77–137.71 mg kg−1). Macías and Calvo (2009) [47] indicated values of 10–100 mg kg−1 being usual in different plants. In the present study, the data obtained were within that range and lower than the maximum of 60 mg kg−1 recommended by the WHO [73].
Regarding Cr, most of the samples had levels between 3.5 and 15 mg kg−1, with the exception of the roots sampled 1.5 km from the heap, which did not reach 0.5 mg kg−1, and the stems sampled at 3 km, which exceeded 230 mg kg−1. These values were higher than those reported by Pehoiu et al. (2020) [74] for plants growing in contaminated soil (<5 mg kg−1). Various authors indicated normal concentrations for Cr in plants being levels below 0.1 mg kg−1 [47,75], clearly lower than the ones found in the present study both in the dump and in the agricultural soils. The safety level indicated by the WHO [73] is 1.30 mg kg−1, while Kastori et al. (1997) [76] indicated that concentrations above 2 mg kg−1 are phytotoxic. Considering these values, practically all of the samples in the present study would exceed the maximum levels recommended by the WHO and be above the reported phytotoxicity concentration, highlighting the extremely high scores in the stems of the plants located 3 km away from the dump.
Figure 5. Concentrations (mg kg−1) of heavy metals in vegetation samples from the center of the mine (CE) and at different distances from it (0.5, 1, 1.5, 3 and 6 km). Average values for triplicates shown. The horizontal lines indicate plant safety thresholds (mg kg−1) according to the WHO [73].
Processes 13 00902 g005
Ni concentrations were between 0.70 mg kg−1 in the roots at a distance of 1.5 km and 193.61 mg kg−1 in the stems at a distance of 3 km, although most values were lower than 15 mg kg−1. Pehoiu et al. (2020) [74] found similar levels (from 0.9 to 37 mg kg−1) in plants growing at mine dumps. The range of 0.1–10 mg kg−1 is considered normal for Ni values in plants [47,72], although in serpentinized areas, it is common to find concentrations of 20–100 mg kg−1. The safety limit according to the WHO [73] is 20 mg kg−1. With these data, in the present study, the highest hazard related to Ni contents in plants would be for those 0.5 km and 3 km away from the mine, while the rest of the samples were, in general, within the normal levels.
Regarding Cd, its concentrations varied between 0.01 mg kg−1 in the roots of the plants in the center of the mine and 0.36 mg kg−1 in the stems and leaves of the plants located 0.5 and 1.5 km away (Figure 5). Other authors found clearly higher values (1.7–219.5 mg kg−1) in plants located in areas affected by a metal mine [77] and also in industrial areas, reaching values in the range of 0.42–2.42 mg kg−1 [72]. Authors also suggested considering the phytotoxic level to be between 5 and 30 mg kg−1, whereas the normal range in plants would be 0.2–0.8 mg kg−1. None of the samples in the current study reached the above-mentioned toxicity range, remaining within the usual values for plants from uncontaminated areas.
For Pb, the detected concentrations were between 0.02 and 2.7 mg kg−1, except for those samples located 3 km away from the mine, where stem samples showed values of approximately 20 mg kg−1. These levels were lower than those reported by Farooq et al. (2008) [73] for industrial areas and the ones found by Hao and Jiang (2015) [72] for different plants collected in a Mn mine dump (with most concentrations between 18 and 22 mg kg−1). Macías and Calvo (2009) [47] indicated that the background level for grasses and legumes ranged between 2.1 and 2.5 mg kg−1, and the safety limit published by the WHO [73] was 5 mg kg−1. In the present study, practically all samples were within normal limits, being well below the safety threshold level, with the exception of those located 3 km away from the mine, as previously mentioned for Cu, Cr and Ni.

3.4. Assessment of Pollution Risks as a Function of Soil and Plant Parameters

Table 7 shows that regarding the total contents, all of the samples exceeded the Cr and Ni toxicity limits proposed by Kabata-Pendias (2011) [49], with the exception of the S area of the dump.
Specifically, the total Cu values were higher than the toxicity limit in all of the areas of the dump except the southern part, while in the cultivated soils, they exceeded the limits in those located 1.5 km away from the mine and were close to exceeding them in those located at 1, 3 and 6 km. Meanwhile, the concentrations were clearly below the limits for the soils located 0.5 km away from the mine. The Pb limit was only exceeded in the E part of the dump, while Cd and Zn were always below the toxicity limits.
Based on the limits proposed for the available contents in the soil [46,47], Cr exceeded the toxicity threshold in all of the samples, with lower values in the N zone. Regarding Ni, its levels were also above the toxicity limits, with the exception of the W area of the heap. Copper exceeded the limit values in the center, south and east areas of the dump and also in the cultivated soils located 6 km away from the mine, being extremely close to the limit for those located 1.5 km away. As for Pb, it exceeded the limit in the N and E areas of the dump, while Zn and Cd would once again not present toxicity problems (Table 7).
Therefore, there is evidence of pollution risks derived from high Cu contents in the CE and E areas of the dump and in the soil located 1.5 km away from the mine, as well as risks due to Cr in the soils located between 1 and 3 km away, in addition to hazards associated with Ni at 1, 1.5 and 6 km from the mine (Table 7).
Table 8 shows that when taking into account the safety limits proposed by the WHO [73] for heavy metal contents in plant tissues, the highest risks corresponded to the plants located 3 km away from the mine, as they had high Cr contents in the roots, stems and leaves, and also high contents of Cu, Ni and Pb in the stems. Individually, Cr concentrations were higher than the recommended limits in the roots, stems and leaves of all of the plants, both in samples from the dump and from the cultivated soils. As for Ni, its concentrations exceeded the limits in the roots and leaves of the plants closest to the dump and in the stems of those 3 km away from the mine, while Cu and Pb had extremely high concentrations in the plants situated 3 km away.
When comparing the parameters which indicate toxicity or contamination in soils (Table 7) with those that indicate excessive contents in plants (Table 8), there was only coincidence for Cr, for which the total contents in the soil agreed with the high levels found in the roots, stems and leaves of the plants at all sampling points. This agreement was not observed for the rest of the heavy metals. As an example, in the case of Cu, the plant contents indicated that there were only problems in those which were 3 km away from the mine, while the total concentrations in the soils indicated problems throughout the dumping site. The lack of consistency observed when comparing what the soil parameters showed and the concentrations found in the plants (especially those located 3 km from the mine), with high values for Cu, Cr, Cd and Pb in the plants, may have been due to the phytoextraction mechanism acting within these plants [78], and thus the metals would gradually accumulate in the aerial part, decreasing their levels in the soil. Alvarez et al. (2003) [11] also noted that certain plant species exerted a detoxifying effect on tailings from a tungsten mine.

4. Conclusions

The total and available heavy metal contents detected in the current study for samples corresponding to a mine dump and crop soils located at various distances from the mine indicated the existence of problematic areas. Specifically, those exposed to the highest hazards were situated within the dumping site and affected by high Cu contents, in addition to the soils located 1.5 km away from the mine, which showed high Cu, Cr and Ni contents, the soils situated 1 and 3 km away, which were affected by Cr and Ni pollution, and finally those located 6 km from the mine, which had high Ni levels. Regarding the total contents, the heavy metals showing the greatest concern for most samples were Cu, Ni and Cr. In the case of Cr and Ni, not just the total contents but also the available contents indicated risks of toxicity in practically all of the samples. According to the safety limits proposed for plant tissues, the highest hazards corresponded to plants situated 3 km away from the mine, due to the high Cr contents in their roots, stems and leaves and the Cu, Ni and Pb contents in their stems. All of the plants in the dump and those in the crop soils presented problems arising from Cr concentrations higher than the recommended value limits in roots, stems and leaves. The parameters indicating toxicity or pollution for soils only coincided with those corresponding to plants in the case of Cr, with no coincidence for the rest of the studied heavy metals, which could be due to these plants acting as phytoremediators, extracting metals from the soil and then being transported from the roots to the aerial parts. These results are within the first of this kind for the geographic area under study and can be seen as especially relevant in light of their environmental implications in a world where heavy metal pollution continues to be a global concern. In fact, additional work along this line would be interesting for other places affected by similar environmental risks in the region, as well as performing further future assessment of in situ remediation and restoration alternatives to solve these issues.

Author Contributions

Conceptualization, E.Á.-R. and M.J.F.-S.; methodology, E.Á.-R. and M.J.F.-S.; software, S.d.S.S. and A.B.; validation, A.B., A.N.-D., E.Á.-R., M.J.F.-S. and A.S.; investigation, S.d.S.S.; data curation, S.d.S.S. and A.B.; writing—original draft preparation, S.d.S.S., A.B., E.Á.-R. and M.J.F.-S.; writing—review and editing, A.N.-D.; visualization, S.d.S.S., A.N.-D., E.Á.-R., M.J.F.-S. and A.S.; supervision, A.B., A.N.-D., E.Á.-R., M.J.F.-S. and A.S. All authors have read and agreed to the published version of the manuscript.

Funding

This research received no external funding.

Data Availability Statement

The original contributions presented in this study are included in the article. Further inquiries can be directed to the corresponding author.

Acknowledgments

The authors acknowledge Pungue University—Mozambique for the scholarship and USC for the stay of Severino dos Santos Savaio.

Conflicts of Interest

The authors declare no conflicts of interest.

References

  1. Punia, A. Role of temperature wind and precipitation in heavy metal contamination at copper mines: A review. Environ. Sci. Pollut. Res. 2021, 28, 4056–4072. [Google Scholar] [CrossRef] [PubMed]
  2. Conesa, H.M.; Schulin, R. The Cartagena–La Unión mining district (SE Spain): A review of environmental problems and emerging phytoremediation solutions after fifteen years research. J. Environ. Monit. 2010, 12, 1225–1233. [Google Scholar] [CrossRef]
  3. Rivas-Pérez, I.M.; Fernández-Sanjurjo, M.J.; Núñez-Delgado, A.; Macías, F.; Monterroso, C.; Álvarez-Rodríguez, E. Aluminium fractionation and speciation in a coal mine dump: Twenty years of time-course evolution. Geoderma 2016, 273, 45–53. [Google Scholar] [CrossRef]
  4. Rivas-Pérez, I.M.; Fernández-Sanjurjo, M.J.; Núñez-Delgado, A.; Monterroso-Martínez, C.; Macías-Vázquez, F.; Álvarez-Rodríguez, E. Efficacy of two different reclamation strategies to improve chemical properties and to reduce Al toxicity in a lignite mine dump during a 20-year period. Land Degrad. Dev. 2019, 30, 658–669. [Google Scholar] [CrossRef]
  5. Asare, M.O.; Afriyie, J.O. Ancient mining and metallurgy as the origin of Cu, Ag, Pb, Hg, and Zn contamination in soils: A review. Water Air Soil Pollut. 2021, 232, 240. [Google Scholar] [CrossRef]
  6. Qin, C.; Luo, C.; Chen, Y.; Shen, Z. Spatial-based assessment of metal contamination in agricultural soils near an abandoned copper mine of eastern China. Bull. Environ. Contam. Toxicol. 2012, 89, 113–118. [Google Scholar] [CrossRef]
  7. Punia, A.; Siddaiah, N.S. Assessment of heavy metal contamination in groundwater of Khetri copper mine region, India and health risk assessment. Asian J. Water Environ. Pollut. 2017, 14, 9–19. [Google Scholar] [CrossRef]
  8. Palanivel, T.M.; Victor, R. Contamination assessment of heavy metals in the soils of an abandoned copper mine in Lasail, Northern Oman. Int. J. Environ. Stud. 2019, 77, 432–446. [Google Scholar] [CrossRef]
  9. Cutillas-Barreiro, L.; Pérez-Rodríguez, P.; Gómez-Armesto, A.; Fernández-Sanjurjo, M.J.; Álvarez-Rodríguez, E.; Núñez-Delgado, A.; Arias-Estévez, M.; Nóvoa-Muñoz, J.C. Lithological and land-use based assessment of heavy metal pollution in soils surrounding a cement plant in SW Europe. Sci. Total Environ. 2016, 562, 179–190. [Google Scholar] [CrossRef]
  10. Adamo, P.; Agrelli, D.; Zampella, M.; Caporale, A.G. Chapter 10—Chemical speciation to assess bioavailability, bioaccessibility, and geochemical forms of potentially toxic metals (PTMs) in polluted soils. In Environmental Geochemistry, 3rd ed.; De Vivo, B., Belkin, H.E., Lima, A., Eds.; Elsevier: Amsterdam, The Netherlands, 2024; pp. 211–269. [Google Scholar] [CrossRef]
  11. Álvarez, E.; Fernández Marcos, M.L.; Vaamonde, C.; Fernández-Sanjurjo, M.J. Heavy metals in the dump of an abandoned mine in Galicia (NW Spain) and in the spontaneously occurring vegetation. Sci. Total Environ. 2003, 313, 185–197. [Google Scholar] [CrossRef]
  12. Mapaure, I.; Chimwamurombe, P.M.; Mapani, B.S.; Kamona, F.A. Impacts of mine dump pollution on plant species diversity, composition and structure of a semiarid savanna in Namibia. Afr. J. Range Forage Sci. 2011, 28, 149–154. [Google Scholar] [CrossRef]
  13. Ale, T.O.; Ogunribido, T.H.; Ademila, O.; Akingboye, A.S. Soil pollution status due to potentially toxic elements in active open dumpsites: Insights from different Nigerian geological environments. Environ. Earth Sci. 2024, 83, 535. [Google Scholar] [CrossRef]
  14. Jung, H.; Kim, J.; Lee, J. Seasonal and spatial contributions of sulfate and trace elements in river water in mining districts: Insights from hydrogeochemical and isotopic analysis based on statistical models. J. Hazard. Mat. 2025, 488, 137246. [Google Scholar] [CrossRef] [PubMed]
  15. Lopes, T.O.M.; Silveira, C.R.D.; Araujo da Silva, J.; Guedes, T.; Tavella, R.A.; Rola, R.C.; Marques, J.A.; Vieira, C.E.D.; Bianchini, A.; Martins, C.D.M.G. A six-year ecotoxicological assessment of the Doce river and coastal marine areas impacted by the Fundão tailings dam failure, Brazil. Environ. Pollut. 2025, 371, 125897. [Google Scholar] [CrossRef]
  16. Chen, L.; Zhou, M.; Wang, J.; Zhang, Z.; Duan, C.; Wang, X.; Zhao, S.; Bai, X.; Li, Z.; Fang, L. A global meta-analysis of heavy metal(loid)s pollution in soils near copper mines: Evaluation of pollution level and probabilistic health risks. Sci. Total Environ. 2022, 835, 155441. [Google Scholar] [CrossRef] [PubMed]
  17. Perrotta, B.G.; Kidd, K.A.; Marcarelli, A.M.; Paterson, G.; Walters, D.M. Effects of chronic metal exposure and metamorphosis on the microbiomes of larval and adult insects and riparian spiders through the aquatic-riparian food web. Environ. Pollut. 2025, 371, 125867. [Google Scholar] [CrossRef]
  18. Schlesinger, M.E.; Sole, K.C.; Davenport, W.G.; Flores, G.R.A. Extractive Metallurgy of Copper; Elsevier: Amsterdam, The Netherlands, 2021. [Google Scholar]
  19. Monterroso, C.; Macías, F. Prediction of the acid generating potential of coal mining spoils. Int. J. Surf. Mining Reclam. Environ. 1998, 12, 5–9. [Google Scholar] [CrossRef]
  20. Vriens, B.; Peterson, H.; Laurenzi, L.; Smith, L.; Aranda, C.; Mayer, K.U.; Beckie, R.D. Long-term monitoring of waste-rock weathering at the Antamina mine, Peru. Chemosphere 2019, 215, 858–869. [Google Scholar] [CrossRef]
  21. Punia, A.; Siddaiah, N.S.; Singh, S.K. Source and assessment of heavy metal pollution at Khetri copper mine tailings and surrounding soil, Rajasthan, India. Bull. Environ. Contam. Toxicol. 2017, 99, 633–641. [Google Scholar] [CrossRef]
  22. Wu, F.; Liu, Y.; Xia, Y.; Shen, Z.; Chen, Y. Copper contamination of soils and vegetables in the vicinity of Jiuhuashan copper mine, China. Environ. Earth Sci. 2011, 64, 761–769. [Google Scholar] [CrossRef]
  23. Arroyo-Díaz, F.; Sarmiento-Villagrana, A.; Villegas-Torres, O.G.; Calderón-Segura, M.E.; Aguirre-Noyola, J.L.; Hernández-Castro, E.; Rodríguez-Alviso, C.; Rosas-Acevedo, J.L.; Talavera-Mendoza, O. Elemental partitioning, morpho-physiological effects, genotoxicity, and health risk assessment associated with tomato (Solanum lycopersicum L.) grown in soil contaminated with mining tailings. Environ. Res. 2025, 270, 120939. [Google Scholar] [CrossRef] [PubMed]
  24. Gitari, M.W.; Akinyemi, S.A.; Ramugondo, L.; Matidza, M.; Mhlongo, S.E. Geochemical fractionation of metals and metalloids in tailings and appraisal of environmental pollution in the abandoned Musina Copper Mine, South Africa. Environ. Geochem. Health 2018, 40, 2421–2439. [Google Scholar] [CrossRef]
  25. Marove, C.A.; Sotozono, R.; Tangviroon, P.; Tabelin, C.B.; Igarashi, T. Assessment of soil, sediment and water contaminations around open-pit coal mines in Moatize, Tete province, Mozambique. Environ. Adv. 2022, 8, 100215. [Google Scholar] [CrossRef]
  26. MAE (Ministry of State Administration). Profile of the District of Manica, Province of Manica; MAE: Maputo, Mozambique, 2005; pp. 2–18. [Google Scholar]
  27. Ruotoistenmäki, T. Geophysical maps and petrophysical data of Mozambique. Geol. Surv. Finl. Spec. Pap. 2008, 48, 65–80. [Google Scholar]
  28. Sumburane, E.I. Evolução Crustal dos Terrenos Granito Greenstone de Manica Região Centro—Oeste de Moçambique. Ph.D. Thesis, Universidade de São Paulo, São Paulo, Brazil, 2011. [Google Scholar]
  29. APHA. Standard Methods for the Examination of Water and Wastewater, 20th ed.; APHA/AWWA/WPCF, American Public Health Association, American Water Works Association and Water Environmental Federation: Washington, DC, USA, 1998; 1134p. [Google Scholar]
  30. Peech, L.; Alexander, L.T.; Dean, L.A. Methods of Soil Analysis for Fertility Investigations; U.S. Department of Agriculture: Washington, DC, USA, 1947; pp. 1–25. [Google Scholar]
  31. Olsen, S.R.; Sommers, L.E. Phosphorus. In Methods of Soil Analysis. Part 2. Chemical and Microbiological Properties; Page, A.L., Miller, R.H., Keeney, D.R., Eds.; EEUU: Madison, WI, USA, 1982; pp. 403–427. [Google Scholar]
  32. USEPA. Environmental Sampling and Analytical Methods (ESAM) Program. In Method 3051A: Microwave Assisted Acid Digestion of Sediments, Sludges, and Oils; United States Environmental Protection Agency: Washington, DC, USA, 2007; Revision 1. [Google Scholar]
  33. Mehlich, A. Mehlich 3 soil test extractant: A modification of Mehlich 2 extractant. Commun. Soil Sci. Plant Anal. 1985, 15, 1409–1416. [Google Scholar] [CrossRef]
  34. López Tabar, C. Efecto de la Eficiencia de Distintos Tipos de Manejo de la Cobertura Vegetal en la Retención de agua y la Calidad del Suelo en la Provincia de Cabo Delgado (Mozambique). Bachelor’s Thesis, Universidad de Navarra, Pamplona, Spain, 2011. [Google Scholar]
  35. Oshunsanya, S. Relevance of Soil pH to Agriculture. In Soil pH for Nutrient Availability and Crop Performance; Oshunsanya, S., Ed.; BoD–Books on Demand: Norderstedt, Germany, 2019. [Google Scholar]
  36. Covre, W.P.; Ramos, S.J.; Da Silveira Pereira, W.V.; De Souza, E.S.; Martins, G.C.; Teixeira, O.M.M.; Fernandes, A.R. Impact of copper mining wastes in the Amazon: Properties and risks to environment and human health. J. Hazard. Mater. 2022, 421, 126688. [Google Scholar] [CrossRef]
  37. Buol, S.W.; Sanchez, P.A.; Cate, R.B., Jr.; Granger, M.A. Soil fertility capability classification. In Soil Management in Tropical America: Proceedings of the Seminar, CIAT, Cali, Colombia, 10–14 February 1974; Soil Science Department, North Carolina State University: Raleigh, NC, USA, 1975; pp. 126–141. [Google Scholar]
  38. Álvarez, E.; Fernández-Sanjurjo, M.J.; Otero, X.L.; Macías, E. Aluminium geochemistry in the bulk and rhizospheric soil of the species colonising an abandoned copper mine in Galicia (NW Spain). J. Soils Sediments 2010, 10, 1236–1245. [Google Scholar] [CrossRef]
  39. Todorova, E.; Kostadinova, A. Risks of environmental pollution from mining waste from ore-containing copper processing. J. Environ. Prot. Ecol. 2019, 20, 397–403. [Google Scholar]
  40. Lopes, A.S. Fertilidade de Solo: Manual Internacional de Fertilidade de solo. Tradução e adaptação de Alfredo Scheid Lopes, 2nd ed.; Revisão Ampliada; Potafos: Piracicadas, Brazil, 1989; p. 153. [Google Scholar]
  41. Domínguez Vivancos, A. Tratado de Fertilización; Mundi Prensa: Madrid, Spain, 1997. [Google Scholar]
  42. Syers, J.K.; Johnston, A.E.; Curtin, D. Efficiency of soil and fertilizer phosphorus use. FAO Fertil. Plant Nutr. Bull. 2008, 18, 108. [Google Scholar]
  43. Galán, E.H.; Romero, A.B. Contaminación de suelos por metales pesados. Rev. Soc. Española Mineral. 2008, 10, 48–60. [Google Scholar]
  44. Manceau, A.; Matynia, A. The nature of Cu bonding to natural organic matter. Geochim. Cosmochim. Acta 2010, 74, 2556–2580. [Google Scholar] [CrossRef]
  45. Ramírez-Pérez, A.M.; Paradelo, M.; Nóvoa-Muñoz, J.C.; Arias-Estévez, M.; Fernández-Sanjurjo, M.J.; Álvarez-Rodríguez, E.; Núñez-Delgado, A. Heavy metal retention in copper mine soil treated with mussel shells: Batch and column experiments. J. Hazard. Mater. 2013, 248–249, 122–130. [Google Scholar] [CrossRef]
  46. Monterroso, C.; Álvarez, E.; Fernández-Marcos, M.L.; Macías, F. Evaluation of Mehlich 3 reagent as a multielement extractant in mine soils. Land Degrad. Dev. 1999, 10, 35–48. [Google Scholar] [CrossRef]
  47. Macías, F.; Calvo de Anta, R. Niveles Genéricos de Referencia de Metales Pesados y Otros Elementos Traza en Suelos de Galicia. Xunta de Galicia; Consellería de Medio Ambiente e Desenvolvemento Sostible: Santiago de Compostela, Spain, 2009; 232p. [Google Scholar]
  48. Dusengemungu, L.; Mubemba, B.; Gwanama, C. Evaluation of heavy metal contamination in copper mine tailing soils of Kitwe and Mufulira, Zambia, for reclamation prospects. Sci. Rep. 2022, 12, 11283. [Google Scholar] [CrossRef]
  49. Kabata-Pendias, A. Trace Elements in Soils and Plants, 4th ed.; Taylor and Francis: Boca Raton, FL, USA, 2011. [Google Scholar]
  50. Bowie, S.H.U.; Thornton, I. Environmental Geochemistry and Health; Kluwer Academic Publishers: Hingham, MA, USA, 1985. [Google Scholar]
  51. Belmonte Serrato, F.B.; Díaz, A.R.; Sarría, F.A.; Brotóns, J.M.; López, S.R. Afección de suelos agrícolas por metales pesados en áreas limítrofes a explotaciones mineras del sureste de España. Papeles Geogr. 2010, 51–52, 45–54. [Google Scholar]
  52. Saha, A.; Gupta, B.S.; Patidar, S.; Martínez-Villegas, N. Evaluation of potential ecological risk index of toxic metals contamination in the soils. Chem. Proc. 2022, 10, 59. [Google Scholar] [CrossRef]
  53. Tietjen, C. Principal problems of the use of city wastes for crop production and soil conservation. FAO Soils Bull. 1975, 27, 221–226. [Google Scholar]
  54. Lago-Vila, M.; Rodríguez-Seijo, A.; Arenas-Lago, D.; Andrade, L.; Vega, M.F.A. Heavy metal content and toxicity of mine and quarry soils. J. Soils Sediments 2017, 17, 1331–1348. [Google Scholar] [CrossRef]
  55. Kierczak, J.; Pietranik, A.; Pędziwiatr, A. Ultramafic geoecosystems as a natural source of Ni, Cr, and Co to the environment: A review. Sci. Total Environ. 2021, 755, 142620. [Google Scholar] [CrossRef]
  56. Alloway, B.J. (Ed.) Heavy Metals in Soils; John Wiley & Sons: New York, NY, USA, 1990; pp. 1–39. [Google Scholar]
  57. Brooks, R.R. Serpentine and Its Vegetation, a Multidisciplinary Approach; Croom Helm: London, UK, 1987. [Google Scholar]
  58. Ayers, R.S.; Westcot, D.W. Water Quality for Agriculture; FAO Irrigation and Drainage; Food and Agriculture and Organization: Rome, Italy, 1985; 29p. [Google Scholar]
  59. Malakar, A.; Snow, D.D.; Chittaranjan, R. Irrigation water quality—A contemporary perspective. Water 2019, 11, 1482–1504. [Google Scholar] [CrossRef]
  60. Woldetsadik, D.; Drechsel, P.; Keraita, B.; Itanna, F.; Gebrekidan, H. Heavy metal accumulation and health risk assessment in wastewater-irrigated urban vegetable farming sites of Addis Ababa, Ethiopia. Int. J. Food Contam. 2017, 4, 9. [Google Scholar] [CrossRef]
  61. Abii, T.A.; Okorie, D.O. Assessment of the level of heavy metals (Cu, Pb, Cd and Cr) contamination in four popular vegetables sold in urban and rural markets of Abia State Nigeria. J. Water Air Soil Pollut. 2011, 2, 42–47. [Google Scholar]
  62. Singh, S.; Kumar, M. Heavy metal load of soil, water and vegetables in peri-urban Delhi. Environ. Monit. Assess. 2006, 120, 79–91. [Google Scholar] [CrossRef]
  63. Otero, X.L.; Álvarez, E.; Fernández-Sanjurjo, M.J.; Macías, F. Micronutrients and toxic trace metals in the bulk and rhizospheric soil of the spontaneous vegetation at an abandoned copper mine in Galicia (NW Spain). J. Geochem. Explor. 2012, 112, 84–92. [Google Scholar] [CrossRef]
  64. Nielsen, M.T.; Scott-Fordsmand, J.J.; Murphy, M.W.; Kristiansen, S.M. Speciation and solubility of copper along a soil contamination gradient. J. Soils Sediments 2015, 15, 1558–1570. [Google Scholar] [CrossRef]
  65. Brunetto, G.; De Melo, G.W.B.; Terzano, R.; Del Buono, D.; Astolfi, S.; Tomasi, N.; Cesco, S. Copper accumulation in vineyard soils: Rhizosphere processes and agronomic practices to limit its toxicity. Chemosphere 2016, 162, 293–307. [Google Scholar] [CrossRef]
  66. Moreno-Lora, A.; Delgado, A. Factors determining Zn availability and uptake by plants in soils developed under Mediterranean climate. Geoderma 2020, 376, 114509. [Google Scholar] [CrossRef]
  67. Soares, M.R.; Casagrande, J.C.; Mouta, E.R. Nickel adsorption by variable charge soils: Effect of pH and ionic strength. Braz. Arch. Biol. Technol. 2011, 54, 207–220. [Google Scholar] [CrossRef]
  68. Cong, L.U.; Yaoguo, W.U.; Sihai, H.U.; Zhang, X.; Yilin, F.U. Distribution and transport of residual lead and copper along soil profiles in a mining region of North China. Pedosphere 2016, 26, 848–860. [Google Scholar]
  69. Manyiwa, T.; Ultra, V.U.; Rantong, G.; Opaletswe, K.A.; Gabankitse, G.; Taupedi, S.B.; Gajaje, K. Heavy metals in soil, plants, and associated risk on grazing ruminants in the vicinity of Cu–Ni mine in Selebi-Phikwe, Botswana. Environ. Geochem. Health 2022, 44, 1633–1648. [Google Scholar] [CrossRef]
  70. Ghaderian, S.M.; Ravandi, A.A.G. Accumulation of copper and other heavy metals by plants growing on Sarcheshmeh copper mining area, Iran. J. Geochem. Explor. 2012, 123, 25–32. [Google Scholar] [CrossRef]
  71. Iwegbue, C.M.A.; Nwajei, G.E.; Ogala, J.E.; Overahm, C.L. Determination of trace metal concentrations in soil profiles of municipal waste dumps in Nigeria. Environ. Geochem. Health 2010, 32, 415–430. [Google Scholar] [CrossRef] [PubMed]
  72. Hao, Q.; Jiang, C. Heavy metal concentrations in soils and plants in Rongxi Manganese Mine of Chongqing, Southwest of China. Acta Ecol. Sin. 2015, 35, 46–51. [Google Scholar] [CrossRef]
  73. Farooq, M.; Anwar, F.; Rashid, U. Appraisal of heavy metal contents in different vegetables grown in the vicinity of an industrial area. Pak. J. Bot. 2008, 40, 2099–2106. [Google Scholar]
  74. Pehoiu, G.; Murarescu, O.; Radulescu, C.; Dulama, I.D.; Teodorescu, S.; Stirbescu, R.M.; Stanescu, S.G. Heavy metals accumulation and translocation in native plants grown on tailing dumps and human health risk. Plant Soil 2020, 456, 405–424. [Google Scholar] [CrossRef]
  75. Kloke, A.; Sauerbeck, D.R.; Vetter, H. The contamination of plants and soils with heavy metals and the transport of metals in terrestrial food chains. In Changing Metal Cycles and Human Health: Report of the Dahlem Workshop on Changing Metal Cycles and Human Health; Nriagu, J.O., Ed.; Springer: Berlin, Germany, 1984. [Google Scholar]
  76. Kastori, R.; Petrović, N.; Arsenijević-Maksimović, I. Heavy Metals and Plants; Naučni Institut za Ratarstvo i Povrtarstvo: Novi Sad, Serbia, 1997; pp. 197–225. [Google Scholar]
  77. Zhu, G.; Xiao, H.; Guo, Q.; Song, B.; Zheng, G.; Zhang, Z.; Zhao, J.; Okoli, C.P. Heavy metal contents and enrichment characteristics of dominant plants in wasteland of the downstream of a lead-zinc mining area in Guangxi, Southwest China. Ecotoxicol. Environ. Saf. 2018, 151, 266–271. [Google Scholar] [CrossRef]
  78. Yoon, J.; Cao, X.; Zhou, Q.; Ma, L.Q. Accumulation of Pb, Cu, and Zn in native plants growing on a contaminated Florida site. Sci. Total Environ. 2006, 368, 456–464. [Google Scholar] [CrossRef]
Figure 1. Maps and images showing the location of the study area.
Processes 13 00902 g001
Figure 3. Available concentrations (mg kg−1) of heavy metals in the mine dump for center (CE), north (N), south (S), east (E) and west (W) and soils located 0.5, 1, 1.5, 3 and 6 km away at two depths (0–20 cm and 20–40 cm). Average values for quadruplicates shown with error bars. The horizontal lines indicate the toxicity thresholds [46,47].
Processes 13 00902 g003
Figure 4. Exchangeable concentrations (mg kg−1) of heavy metals in the mine dump’s center (CE), north (N), south (S), east (E) and west (W) zones and soils located 0.5, 1, 1.5, 3 and 6 km away at two depths (0–20 cm and 20–40 cm). Average values for quadruplicates shown with error bars.
Processes 13 00902 g004
Table 1. Lithological material and vegetation sampled in the different areas of the dump (center, north, south, east and west) and in cultivated soils located at various distances from the dump (0.5, 1, 1.5, 3 and 6 km).
Situation in the DumpLithological MaterialVegetation (Dominant Species)
CenterGneissBauhinia galpinii
NorthGneissBauhinia galpinii
SouthGneissBauhinia galpinii
EastGneissBauhinia galpinii
WestGneissBauhinia galpinii
0.5 kmGraniteZingiber officinale
1 kmGraniteBrassica oleracea
1.5 kmSerpentinitePsidium guajava
3 kmSchistPhaseolus vulgaris
6 kmSchistMangifera indica
Table 2. Methods of determination of the soil, plant and water physicochemical parameters.
SampleParameterMethodEquipment
SoilspH, waterH2O (ratio 1:2.5)2202 pH-meter (Crison, Barcelona, Spain)
pH, KCl KCl 0.1 mol L−1 (ratio 1:2.5)
Total C-Autoanalyzer TRUSPEC CHNS (LECO, St. Joseph, MI, USA)
Total N-
Texture Robison pipette
Exchangeable cations1 mol L−1 NH4Cl [30]-
Effective cation exchange capacity [30]-
Available phosphorus [31]-
Total Cd, Cr, Cu, Ni, Pb and ZnMicrowave acid digestion EPA method 3051A [32]ICP-MS 7900 (Agilent, Santa Clara, CA, USA). Detection limit:
Cu = 5.4 µg L−1; Zn = 1.8 µg L−1;
Ni = 10.0 µg L−1; Pb = 42.0 µg L−1; Cd = 2.7 µg L−1; Cr = 7.1 µg L−1
Bioavailable Cd, Cr, Cu, Ni, Pb and ZnMehlich 3 extracting solution
(0.015 mol L−1 NH4F, 0.25 mol L−1 NH4NO3,
0.2 mol L−1 CH3COOH, 0.013 mol L−1 HNO3,
0.001 mol L−1 EDTA) [33]
Exchangeable Cd, Cr, Cu, Ni, Pb and Zn1 mol L−1 NH4Cl
PlantsTotal Fe, Mn, Zn, Cu, Cr, Ni, Pb and Cd Acid digestionICP-MS (Agilent, Santa Clara, CA, USA).
WaterpH, water-2202 pH-meter (Crison, Barcelona, Spain)
Electrical conductivity -2202 conductimeter (Crison, Barcelona, Spain)
Total Al, Ca, Mg, Na, K Cu, Zn, Cr, Ni, Cd, Pb, Fe, Mn -Absorption and emission spectrometry, ICP-OES (Agilent, Santa Clara, CA, USA).
Table 3. Physicochemical characteristics of waste dump samples (CE = center, N = north, S = south, E = east, W = west) and soils located 0.5, 1, 1.5, 3 and 6 km from the site at two depths (0–20 and 20–40 cm). Average values for four replicates, with coefficients of variation <10%.
Depth
(cm)
Dump ZoneDistance of Soil Sampling Point from the Dump (km)
CENSEW0.511.536
Sand (%)0–2019.120.229.627.441.731.644.818.817.87.6
20–4016.118.926.325.142.119.852.824.822.77.7
Clay (%)0–207578.169.171.157.66253.181.481.990.4
20–4078.479.772.473.355.772.345.473.37490.4
OM (%)0–203.044.152.924.283.51.861.821.972.811.49
20–402.072.32.293.942.241.011.341.571.221.51
pH H2O0–205.45.45.26.25.56.26.2666.3
20–4065.36.56.46.36.16.46.25.65.9
pH KCl0–204.55.35.26.54.85.15.54.955.3
20–405.25.26.66.25.14.85.35.14.84.6
Ca0–205.096.974.725.963.760.661.381.241.311.04
20–404.256.645.615.622.590.30.920.620.41.04
Mg0–203.9212.784.323.526.11.430.832.451.230.72
20–403.4812.842.43.356.091.680.811.640.83
Na0–200.140.120.140.130.180.050.060.020.030.06
20–400.130.280.150.170.240.040.050.020.040.045
K0–200.440.371.080.280.210.090.20.080.130.11
20–400.280.230.150.150.130.040.10.070.070.06
Al0–200.000.000.020.000.000.000.000.000.000.00
20–400.000.000.000.000.000.010.000.000.130.02
eCEC0–2019.50.360.310.090.541.011.670.221.260.45
20–403.90.190.120.140.070.750.870.291.280.53
P0–2029.0920.610.69.9810.793.244.144.013.962.38
20–4012.0420.188.439.439.122.822.7423.562.52
OM = organic matter. Ca, Mg, Na, K, and Al are exchangeable cations (in cmol(+) kg−1). eCEC = effective cation exchange capacity (in cmol(+) kg−1); P = available P (in mg kg−1).
Table 4. Semi-quantitative mineralogical composition corresponding to the material in the dump and in the soils located at different distances from the mine.
In the DumpSemiquantitative (%)
Talc27
Kaolinite15
Microcline15
Clinochlore12
Hornblende11
Albite8
Quartz8
Biotite4
Distance: 1 km
Quartz42
Albite13
Talc12
Clinochlore7
Microcline7
Biotite7
Antigorite7
Hornblende5
Gibbsite2
Distance: 6 km
Quartz68
Kaolinite12
Albite8
Talc7
Biotite4
Table 5. Chemical characteristics corresponding to the analyzed irrigation water. Average values (n = 4), with coefficients of variation always lower than 10%. EC = electrical conductivity.
pH8.37
EC (dS m−1)299
Ca (mg L−1)12.09
Mg (mg L−1)35.90
Na (mg L−1)2.390
K (mg L−1)1.07
Al (µg L−1)77.10
Cu (µg L−1)186.88
Zn (µg L−1)7.10
Cr (µg L−1)8.21
Ni (µg L−1)116.55
Cd (µg L−1)0.11
Pb (µg L−1)0.07
Table 6. Stepwise correlation corresponding to available heavy metal concentrations and different soil parameters.
R2
CupH0.095
pH, eCEC0.225
ZneCEC0.152
eCEC, pH0.267
CrMO0.123
NiMO0.092
MO, eCEC0.189
MO, eCEC, pH0.318
PbClay0.159
Clay, MO0.214
Table 7. Toxicity for each of the heavy metals investigated, based on its total or available contents in the studied zones (CE, N, S, E and W) and for different distances from the mine (0.5, 1, 1.5, 3 and 6 km). Red color indicates the toxicity limit (total or available concentrations) being exceeded in some of the layers, while orange indicates being close to the toxicity limit (for total or available concentrations) and green indicates no toxicity.
CENSEW0.5 km1 km1.5 km3 km6 km
Total
Cu
Zn
Cr
Ni
Cd
Pb
Available
Cu
Zn
Cr
Ni
Cd
Pb
Table 8. Safety limits proposed by the WHO [73] for the various heavy metals investigated. Red color = values higher than the WHO safety limit (Cu = 40 mg kg−1; Zn = 60 mg kg−1; Cr = 1.30 mg kg−1; Ni = 20 mg kg−1; Pb = 5 mg kg−1). For Cd, 5 mg kg−1 is the phytotoxic value [67]. Green = below the toxicity limit.
CE0.5 km1 km1.5 km3 km6 km
Root
Cu
Zn
Cr
Ni
Cd
Pb
Stem
Cu
Zn
Cr
Ni
Cd
Pb
Leaf
Cu
Zn
Cr
Ni
Cd
Pb
Disclaimer/Publisher’s Note: The statements, opinions and data contained in all publications are solely those of the individual author(s) and contributor(s) and not of MDPI and/or the editor(s). MDPI and/or the editor(s) disclaim responsibility for any injury to people or property resulting from any ideas, methods, instructions or products referred to in the content.

