Article

Polymer Flooding Injectivity Maintaining and Enhancement Strategies: A Field Case Study of Chinese Offshore EOR Project

1
State Key Laboratory of Offshore Oil and Gas Exploitation, Beijing 100028, China
2
CNOOC Research Institute Ltd., Beijing 100000, China
3
CNOOC (China) Limited Tianjin Branch, Tianjin 300450, China
*
Author to whom correspondence should be addressed.
Processes 2025, 13(3), 903; https://doi.org/10.3390/pr13030903
Submission received: 27 February 2025 / Revised: 14 March 2025 / Accepted: 18 March 2025 / Published: 19 March 2025

Abstract

:
Polymer flooding has been gradually applied in Chinese offshore oilfields to enhance oil recovery (EOR). Injectivity loss during polymer flooding is a common issue that could cause lower displacement speed and efficiency, and eventually compromise the polymer flooding result. This paper presents a case study of a Chinese offshore field where injectivity loss issues were encountered in the polymer flooding project. A series of measures are applied to enhance the injectivity. The injectivity enhancement strategies are proposed and conducted from three main aspects, namely, (1) surface polymer fluid preparation; (2) downhole wellbore stimulation; and (3) reservoir–polymer compatibility, respectively. For the surface polymer fluid preparation, a series of sieve flow tests are conducted to obtain the optimal mesh size to improve the polymer fluid preparation quality and reduce the amount of “fish eyes”. The downhole wellbore stimulations involve oxidization-associated acidizing treatment and re-perforation. Polymer–reservoir compatibility tests are conducted to optimize the molecular weight (MW). Regarding the surface measures, the optimal filtration sieve mesh number is 200, which could reduce fish eyes to a desirable level without causing mesh plugging. After mesh refinement, the average injection pressure of the twelve injection wells decreases by 0.5 MPa. For the downhole stimulations, acidizing treatment are applied to six injection wells, which decreases the injection pressures by 6 to 7 MPa. For Well A, where acidizing does not work, the re-perforation measure is used and enhances the injectivity by 300%. Moreover, the laboratory and field polymer–reservoir compatibility tests show that the optimal polymer molecular weight (MW) is sixteen million. Proposed strategies applied from the surface, downhole, and reservoir aspects could be used to resolve different levels of injectivity loss, which could provide guidance for future offshore polymer projects.

1. Introduction

The efficient development of unconventional oil and gas resources, such as offshore oil and gas, inevitably requires the use of EOR methods such as polymer flooding [1,2]. Polymer flooding has been widely used around the world as an effective technique to enhance oil recovery [3,4,5,6]. In general, polymer flooding could enhance the oil recovery after waterflooding by 6 to 8% [7]. The mechanism for polymer flooding is increasing the sweep efficiency by injecting highly viscous polymer fluid [8]. Polymer flooding has been used for decades in Chinese onshore oilfields, such as Daing Oilfield, Shengli Oilfield, etc., [9,10,11,12,13,14,15]. Now, Chinese offshore oil companies are tempted to utilize polymer flooding techniques to enhance oil recovery. Offshore polymer flooding application faces a few key issues, like limited platform space, load-bearing capacity, and fast polymer preparation demand, making it more challenging than onshore applications [16,17,18,19,20].
Injectivity loss is a common issue in polymer flooding applications. There are a few key factors causing injectivity loss, including polymer adsorption, fish eyes, impurities, ionic conditions, etc. The polymer molecules tend to adsorb on the rock surface due to the negative charge property causing a reduction in permeability [21,22,23]. Fish eyes are commonly formed during the mother solution preparation process when the polymer powder is not uniformly dispersed and mixed with water [24]. The sizes of fish eyes vary from invisibly small to large. Figure 1 shows the large fish eyes captured by the filtration meshes. Water quality is another key factor affecting the injectivity. The processed water containing impurities such as oil droplets, and suspended particles could cause formation damage. Also, high valence metal ions, like calcium, magnesium, zinc, and iron could cross-link the polymer and form micro-gels [25], which could plug the pore throat.
Usually, acidizing is used by operators as an effective tool to enhance the injectivity for waterflooding. During waterflooding, scales are formed causing formation damage [26]. The acid could dissolve the scales and enhance the effective permeability. Tubing flushing is another method to maintain injectivity, which has been widely used by onshore operators [27,28]. Water is injected and circulated to clean the tubing. Polymer plugs can be cleaned out from the downhole and transported to the surface. However, the acidizing measure has short effective periods and sometimes could not effectively enhance the injectivity for the polymer flooding. Moreover, it is challenging to conduct tubing flushing in offshore operations due to complicated well-completion design. This paper presents a field case study of an offshore polymer flooding project, where different levels of injectivity loss issues occur. A comprehensive strategy is proposed to resolve the injectivity issues. Proposed methods to enhance injectivity could be utilized in future offshore polymer flooding projects.

2. Field Case Study

The Bohai Offshore Oilfield is the largest oilfield in China with around yearly forty million tons of oil production. However, the development of Bohai Offshore Oilfield has entered a high water cut stage, with an average water cut of 90.3% and an average recovery oil rate of 36%. Polymer flooding has been proposed as a potential EOR technique in Bohai Oilfield. In this study, a polymer flooding project is established in the Bohai Q oilfield. Q oilfield is located on the west side of Bohai. The average reservoir pressure is around 17 MPa. The reservoir temperature is 65 °C. The average permeability is around 1280 mD. The average porosity is around 0.29. The geological condition is a delta and fluvial sedimentation. Q oilfield has been developed by waterflooding for more than 20 years. The polymer flooding project started in 2023 and has operated for two years. Since the beginning of the polymer injection, all of the twelve injectors have shown injectivity problems. Various measures have been applied to enhance the injectivity.

3. Injectivity Enhancement Strategy and Onsite Testing

This section introduces the comprehensive injectivity enhancement strategy aiming at three main aspects, namely, (1) surface polymer fluid preparation; (2) downhole wellbore stimulation; and (3) reservoir–polymer compatibility, respectively. A series of tests are conducted to optimize and validate these enhancement measures.

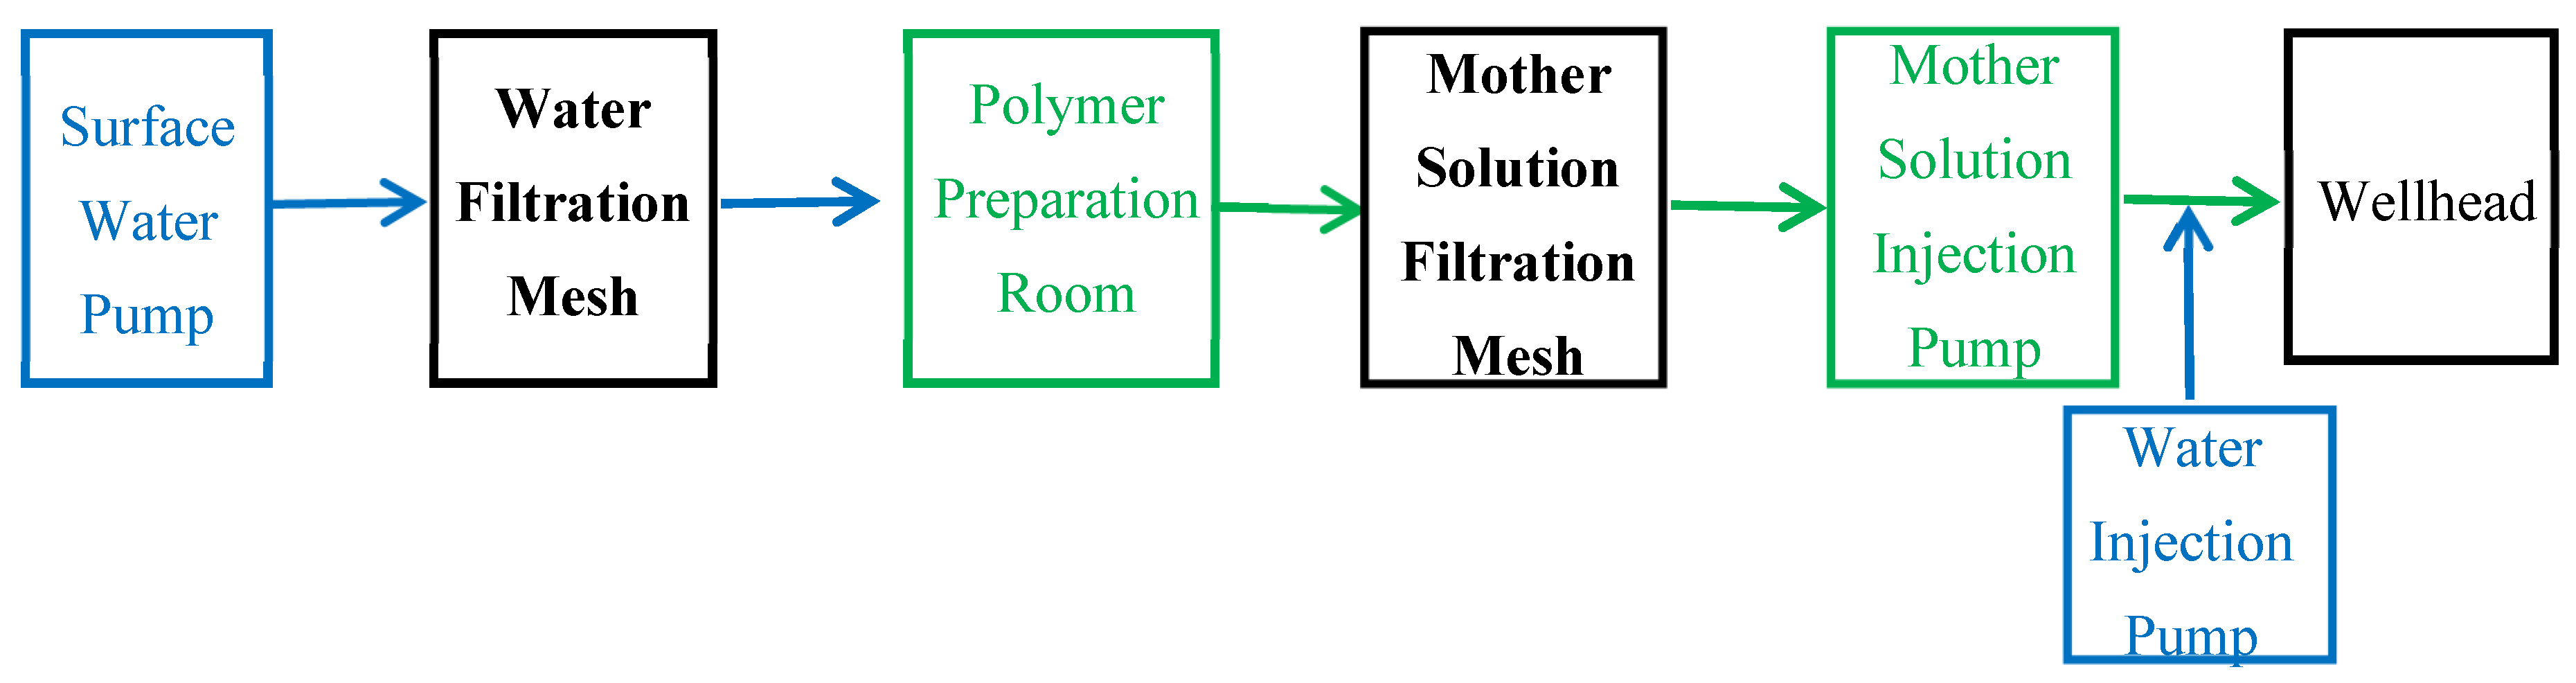
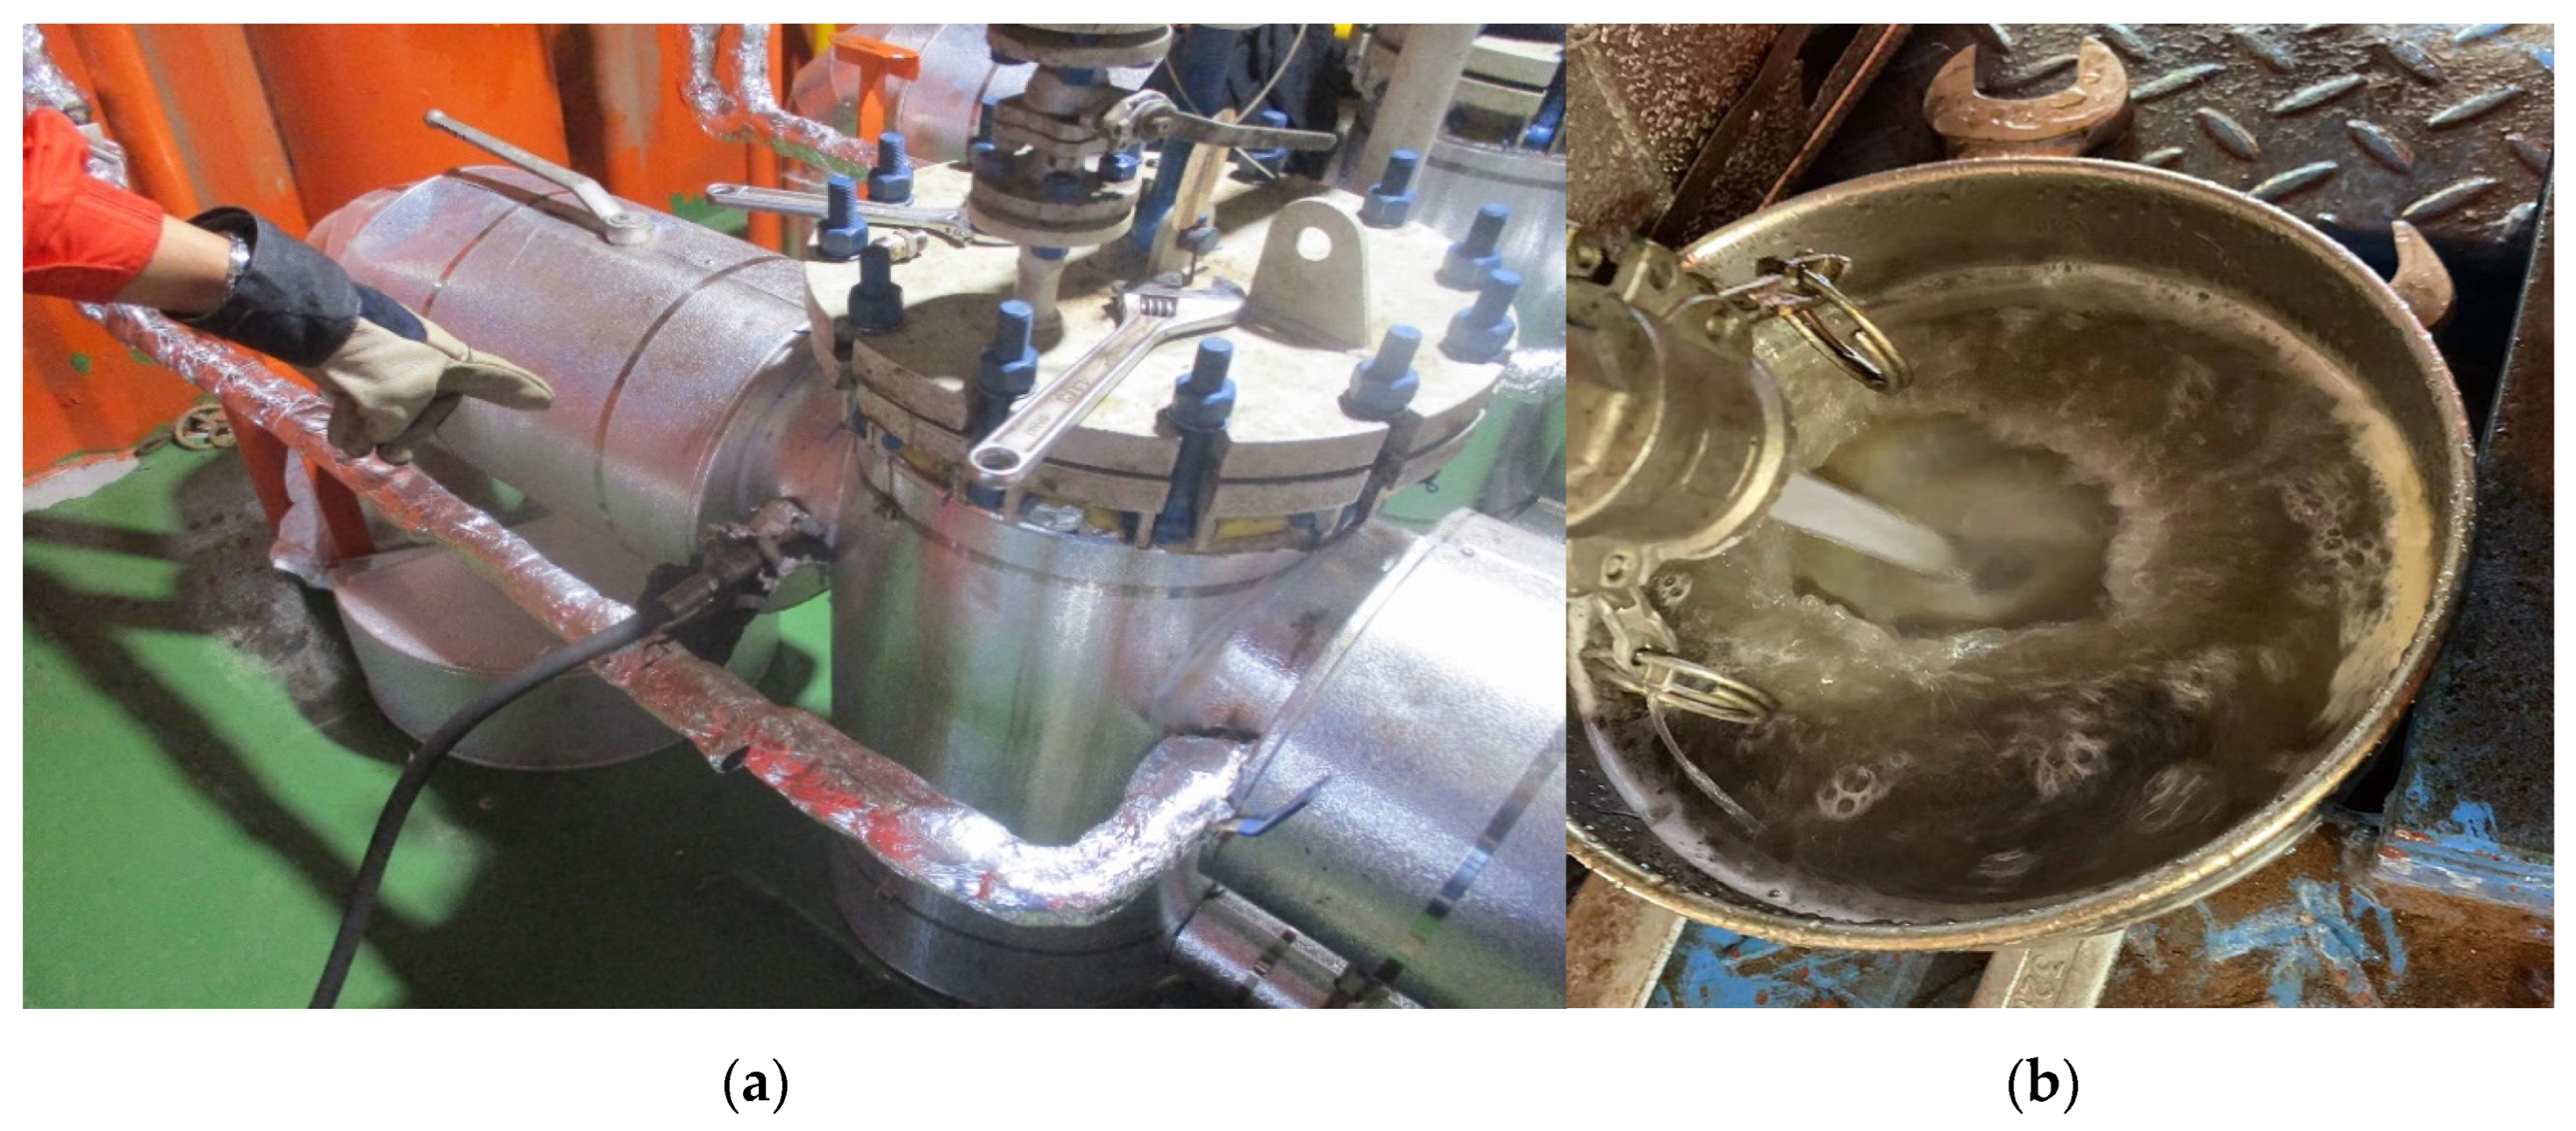
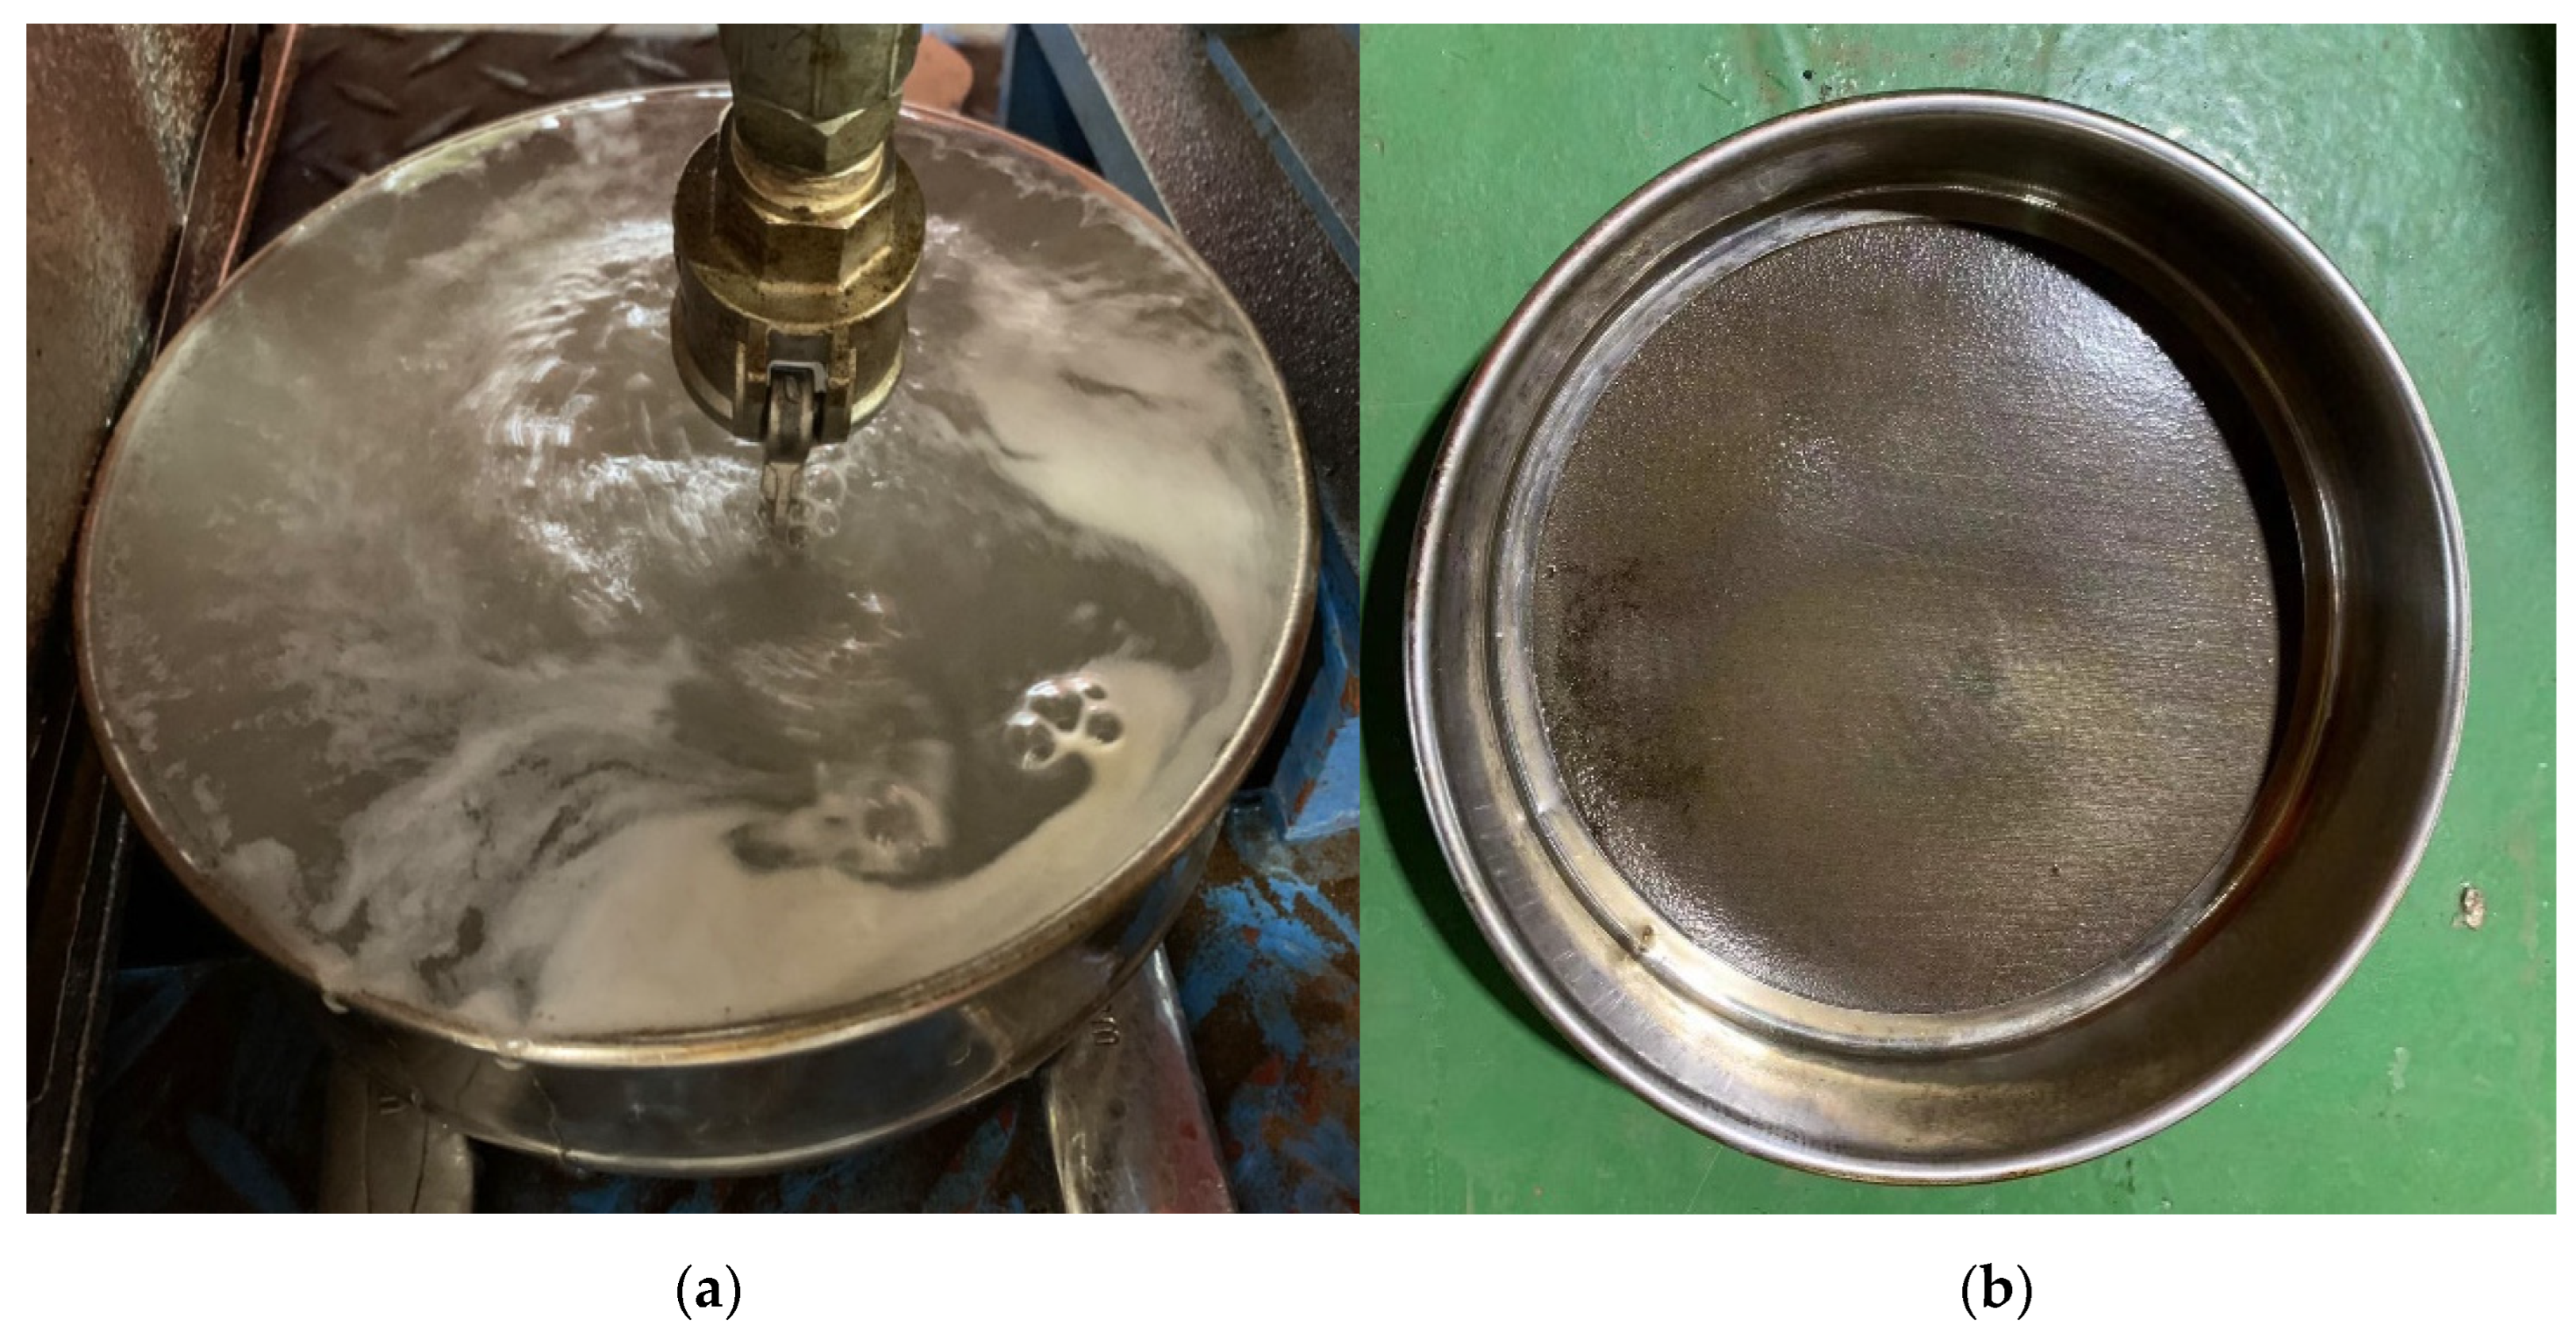
3.1. Surface Optimization for Polymer Preparation

Filtration meshes are used for the preparation water and mother solution preparation process to capture and filter the impurities in water and fish eyes in the mother solution, respectively. Figure 2 shows the flowchart of the surface polymer fluid preparation process. In this study, the optimization of the water filtration and mother solution mesh sizes is targeted. In the Q field case, Mesh 40 was designed for the mother solution process and Mesh 100 (38 μm) was designed for the preparation water process. After the injectivity issues, a series of sieve flow analyses are conducted to optimize the water filtration mesh size as shown in Figure 3. The water used in the sieve flow test is obtained from the water vessel. The flow rate is 0.6 m3/h.
Mesh number of 300 (48 μm), 400 (38 μm), and 500 (30 μm) are used in the flow test. A timer is used to measure how long the mesh is fully plugged. The water overflows the brim of the mesh is considered as the plugging time as shown in Figure 4. Table 1 shows the plugging time recorded for the three meshes. It is found that Mesh 500 shows a quick plugging result with 2.5 h. Impurities including fine sand particles and oil droplets are captured on Mesh 500. Mesh 400 and 300 show better flow ability. The plugging times are 12.5 and 25 h, respectively. With the mesh number increasing from 300 to 500, the plugging time decreases from 25 to 2.5 h. This is due to the opening size of the mesh reducing from 48 to 30 μm, causing the mesh to become plugged more easily by the impurities and oil droplets. After the flow tests, the meshes are cleaned with hot water and surfactant. However, it is found that all three meshes are permanently polluted due to the impurities plugged inside the meshes as shown in Figure 5, which indicates that these meshes could not be used repeatably.
After the mesh flow tests, a multi-sieve flow test is conducted by stacking meshes of 100, 200, 300, 400, and 500 as shown in Figure 6. The flow rate is 0.6 m3/h, and the flow time is nine hours. It is shown that there are some large sand particles remaining on Mesh 100 and fine sand particles remaining on Mesh 200 (Figure 7). For Mesh 300, some fine particles associated with oil droplets are captured, while Mesh 400 and 500 show mesh fully plugging. Table 2 presents the plugging percentage of the meshes.
Based on the sieve flow testing results, considering the reuse and cleaning of the filtration mesh in the field application, it is recommended to upgrade the existing Mesh 100 of the preparation water process to Mesh 200. Figure 8 shows the filtration results after changing the water filtration mesh from 100 to 200. It is found that Mesh 200 filters more impurities than Mesh 100, indicating the water quality is improved and fewer impurities are injected into the reservoir, thus enhancing the injectivity.
The same multi-sieve flow test is also conducted for the polymer mother solution process. Mesh 100, 200, and 300 are used in the test (Figure 9). The mother solution has a concentration of 4000 ppm HPAM. It shows that Mesh 100 retains most of the fish eyes. There are very few fish eyes retained by Mesh 200. There are almost no visible fish eyes filtered by Mesh 300. Moreover, due to the high-viscous characteristic of the mother solution, it could not easily flow through Mesh 300. Thus, considering both filtration and flow performance, it is recommended to use Mesh 200 for the mother solution process. Figure 10 compares the results of Mesh 40 and Mesh 200 in the mother solution process. It is shown that Mesh 200 retains more fish eyes and colloids than Mesh 40, indicating fewer fish eyes are injected into the wellbore and causing plugging.
After upgrading the filtration meshes (as shown by the black dash line in Figure 11) of the preparation process (100 to 200) and mother solution process (40 to 200), respectively, it is found that all twelve injectors show injection pressure decrease. The average decrease is around 0.5 MPa. Figure 11 shows the injectivity response after filtration mesh upgrading of one of the injection wells (Well A). It was found that, at first, the injection rate increased from 400 m3/d to 450 m3/d after changing filtration meshes. Then, after the injection rate reaches the target rate (450 m3/d), the injection pressure decreases from 12.6 MPa to 12.2 MPa. Thus, proposed measures from the surface polymer solution process enhance the injectivity of the entire injection wells.

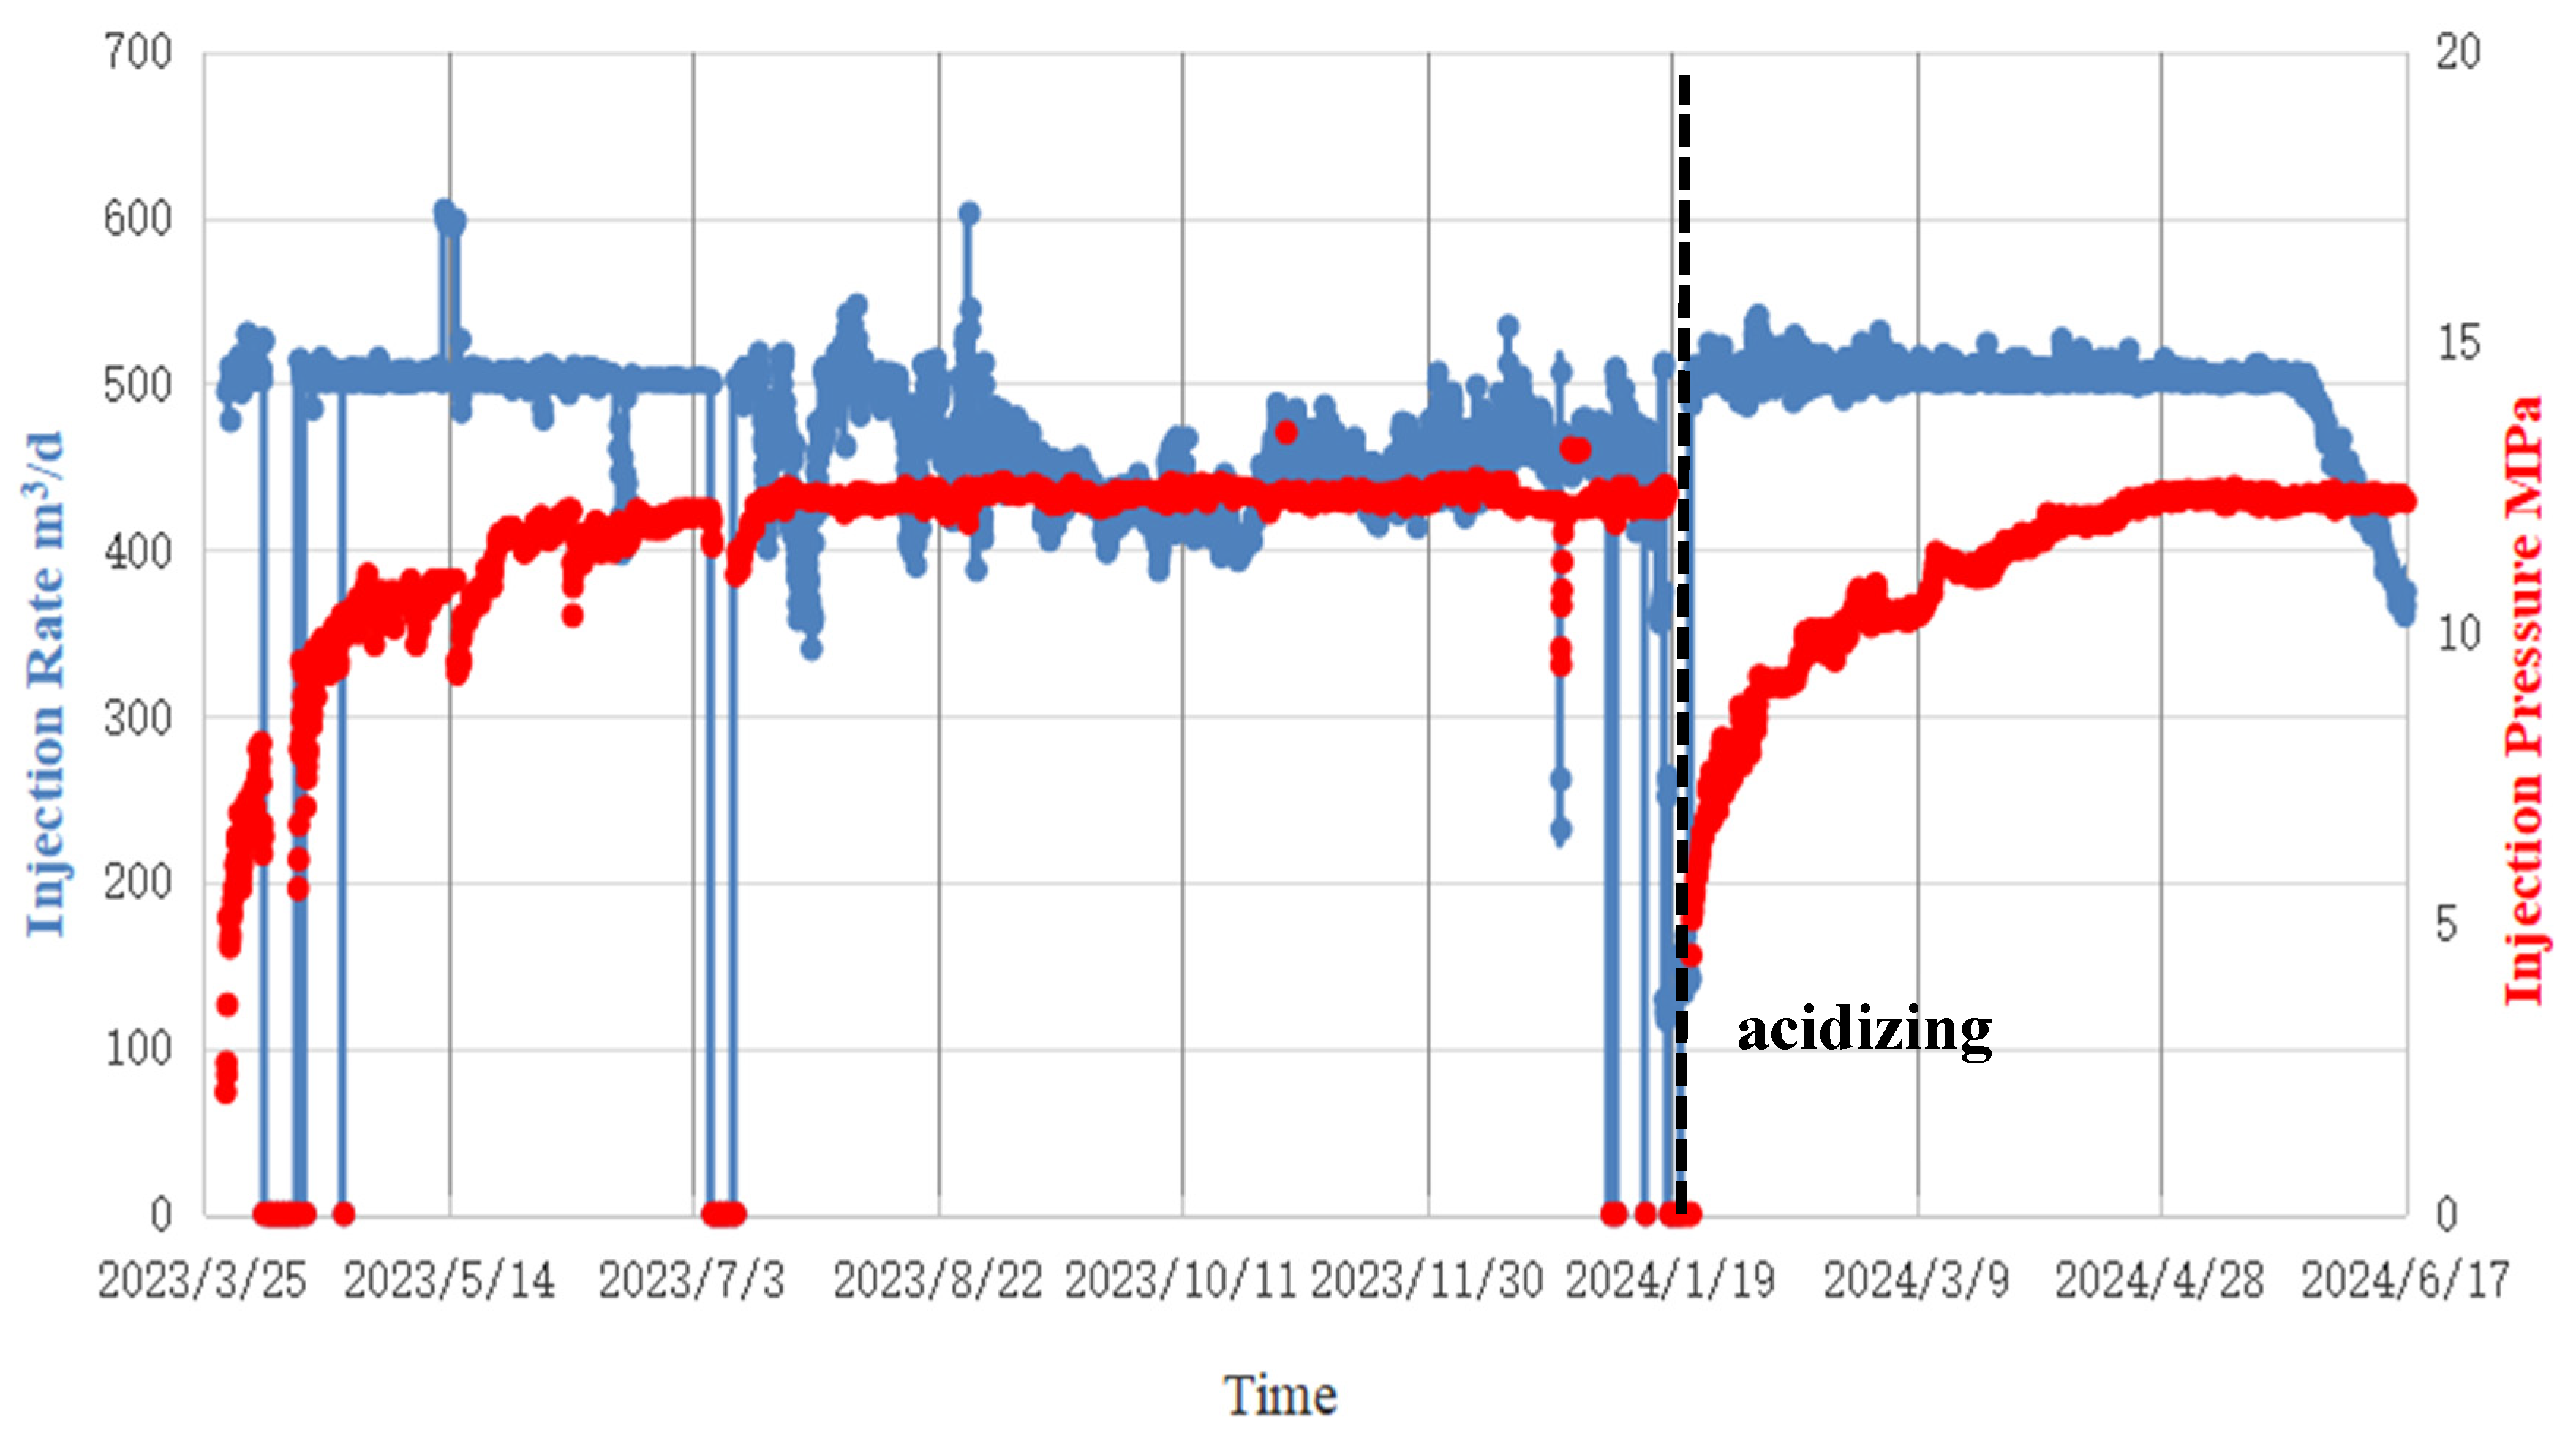
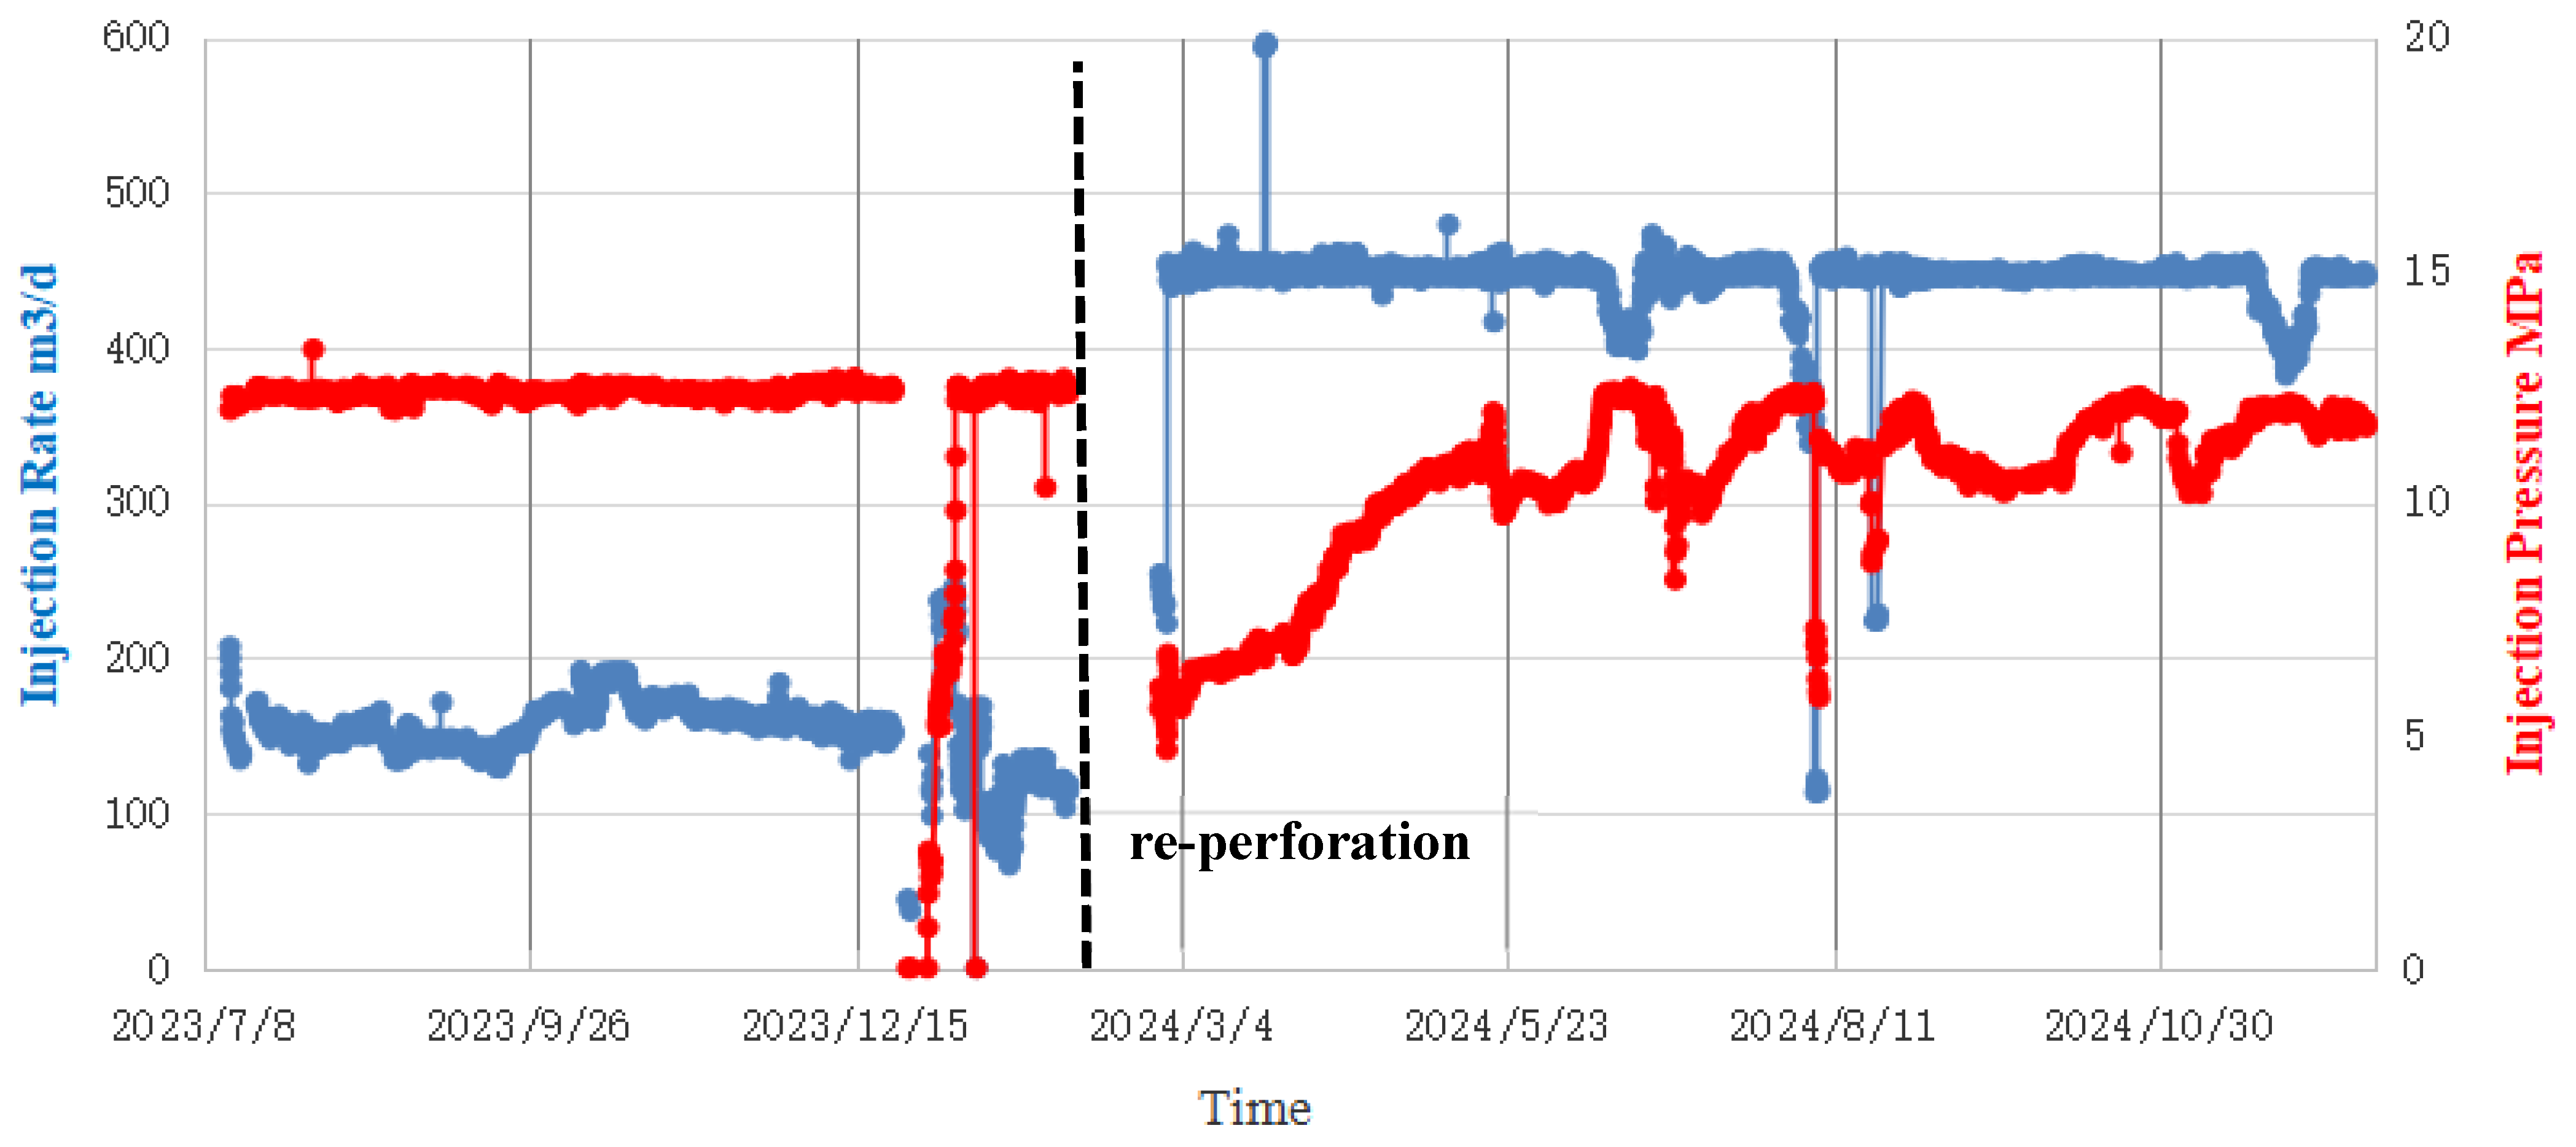
3.2. Downhole Wellbore Stimulation

Although the surface measures could mitigate the injectivity, the enhancement level is not quite evident. Still, the injectivity gradually decreases due to polymer adsorption and pore plugging. Usually, acidizing is used to treat the near-wellbore plugging and enhance the injectivity. In this case, oxidization-associated acidizing and re-perforation measures are conducted for a few injectors with severe injectivity issues.
Regarding the acidizing treatment, the oxidization-associated acidizing fluid is used and oriented for the polymer-induced plugging. The oxidization-associated acidizing fluid contains an oxidization component and acid. The oxidization component could break and degrade the polymer chains. The inorganic acid could dissolve the scales, like CaCO3, thus enhancing the effective permeability. Figure 12 shows the acidizing results of Well A (Table A1). It is found that after acidizing treatment, the injection pressure of Well A decreases from 12.5 MPa to 5 MPa, and the injection rate increases from 450 m3/d to 500 m3/d, indicating the acid fluid effectively dissolves the plugging polymer colloids near the wellbore. The pressure gradually builds up after acidizing. After around five months of injection, the injection rate starts to decline gradually, which is an indication of the injectivity loss.
Moreover, a re-perforation stimulation measure is conducted for Well B where acidizing treatment shows negligible injectivity enhancement. For the re-perforation application, longer and denser perforation channels are designed. Table 3 shows the perforation parameters before and after the re-perforation. The re-perforation creates a few additional flow channels, which favors the polymer injection. Figure 13 shows that after re-perforation, the injection pressure decreased from 12.5 MPa to 6 MPa, and the injection rate increased from 170 m3/d to 445 m3/d, indicating a remarkable enhancement of the injectivity. The injectivity increase could be attributed to the increase in the effective drainage area in the near-wellbore region after the re-perforation. Thus, the flow velocity per channel is reduced leading to less pressure drop. Also, for the longer and denser perforation channels, the flow velocities at the tip of the perforations are reduced, thus, the pressure drop due to flow convergence is reduced. Notably, the re-perforation operation not only increases the perforation channel length but also perforates through the sand control screen. The twelve injectors have been completed for over 20 years, the sand control screens are corroded and plugged reducing the effective open-flow-area of the apertures. The re-perforation operation creates a couple of holes on the screen, which favors the polymer fluid flow through the screen, thus, increasing the injectivity.

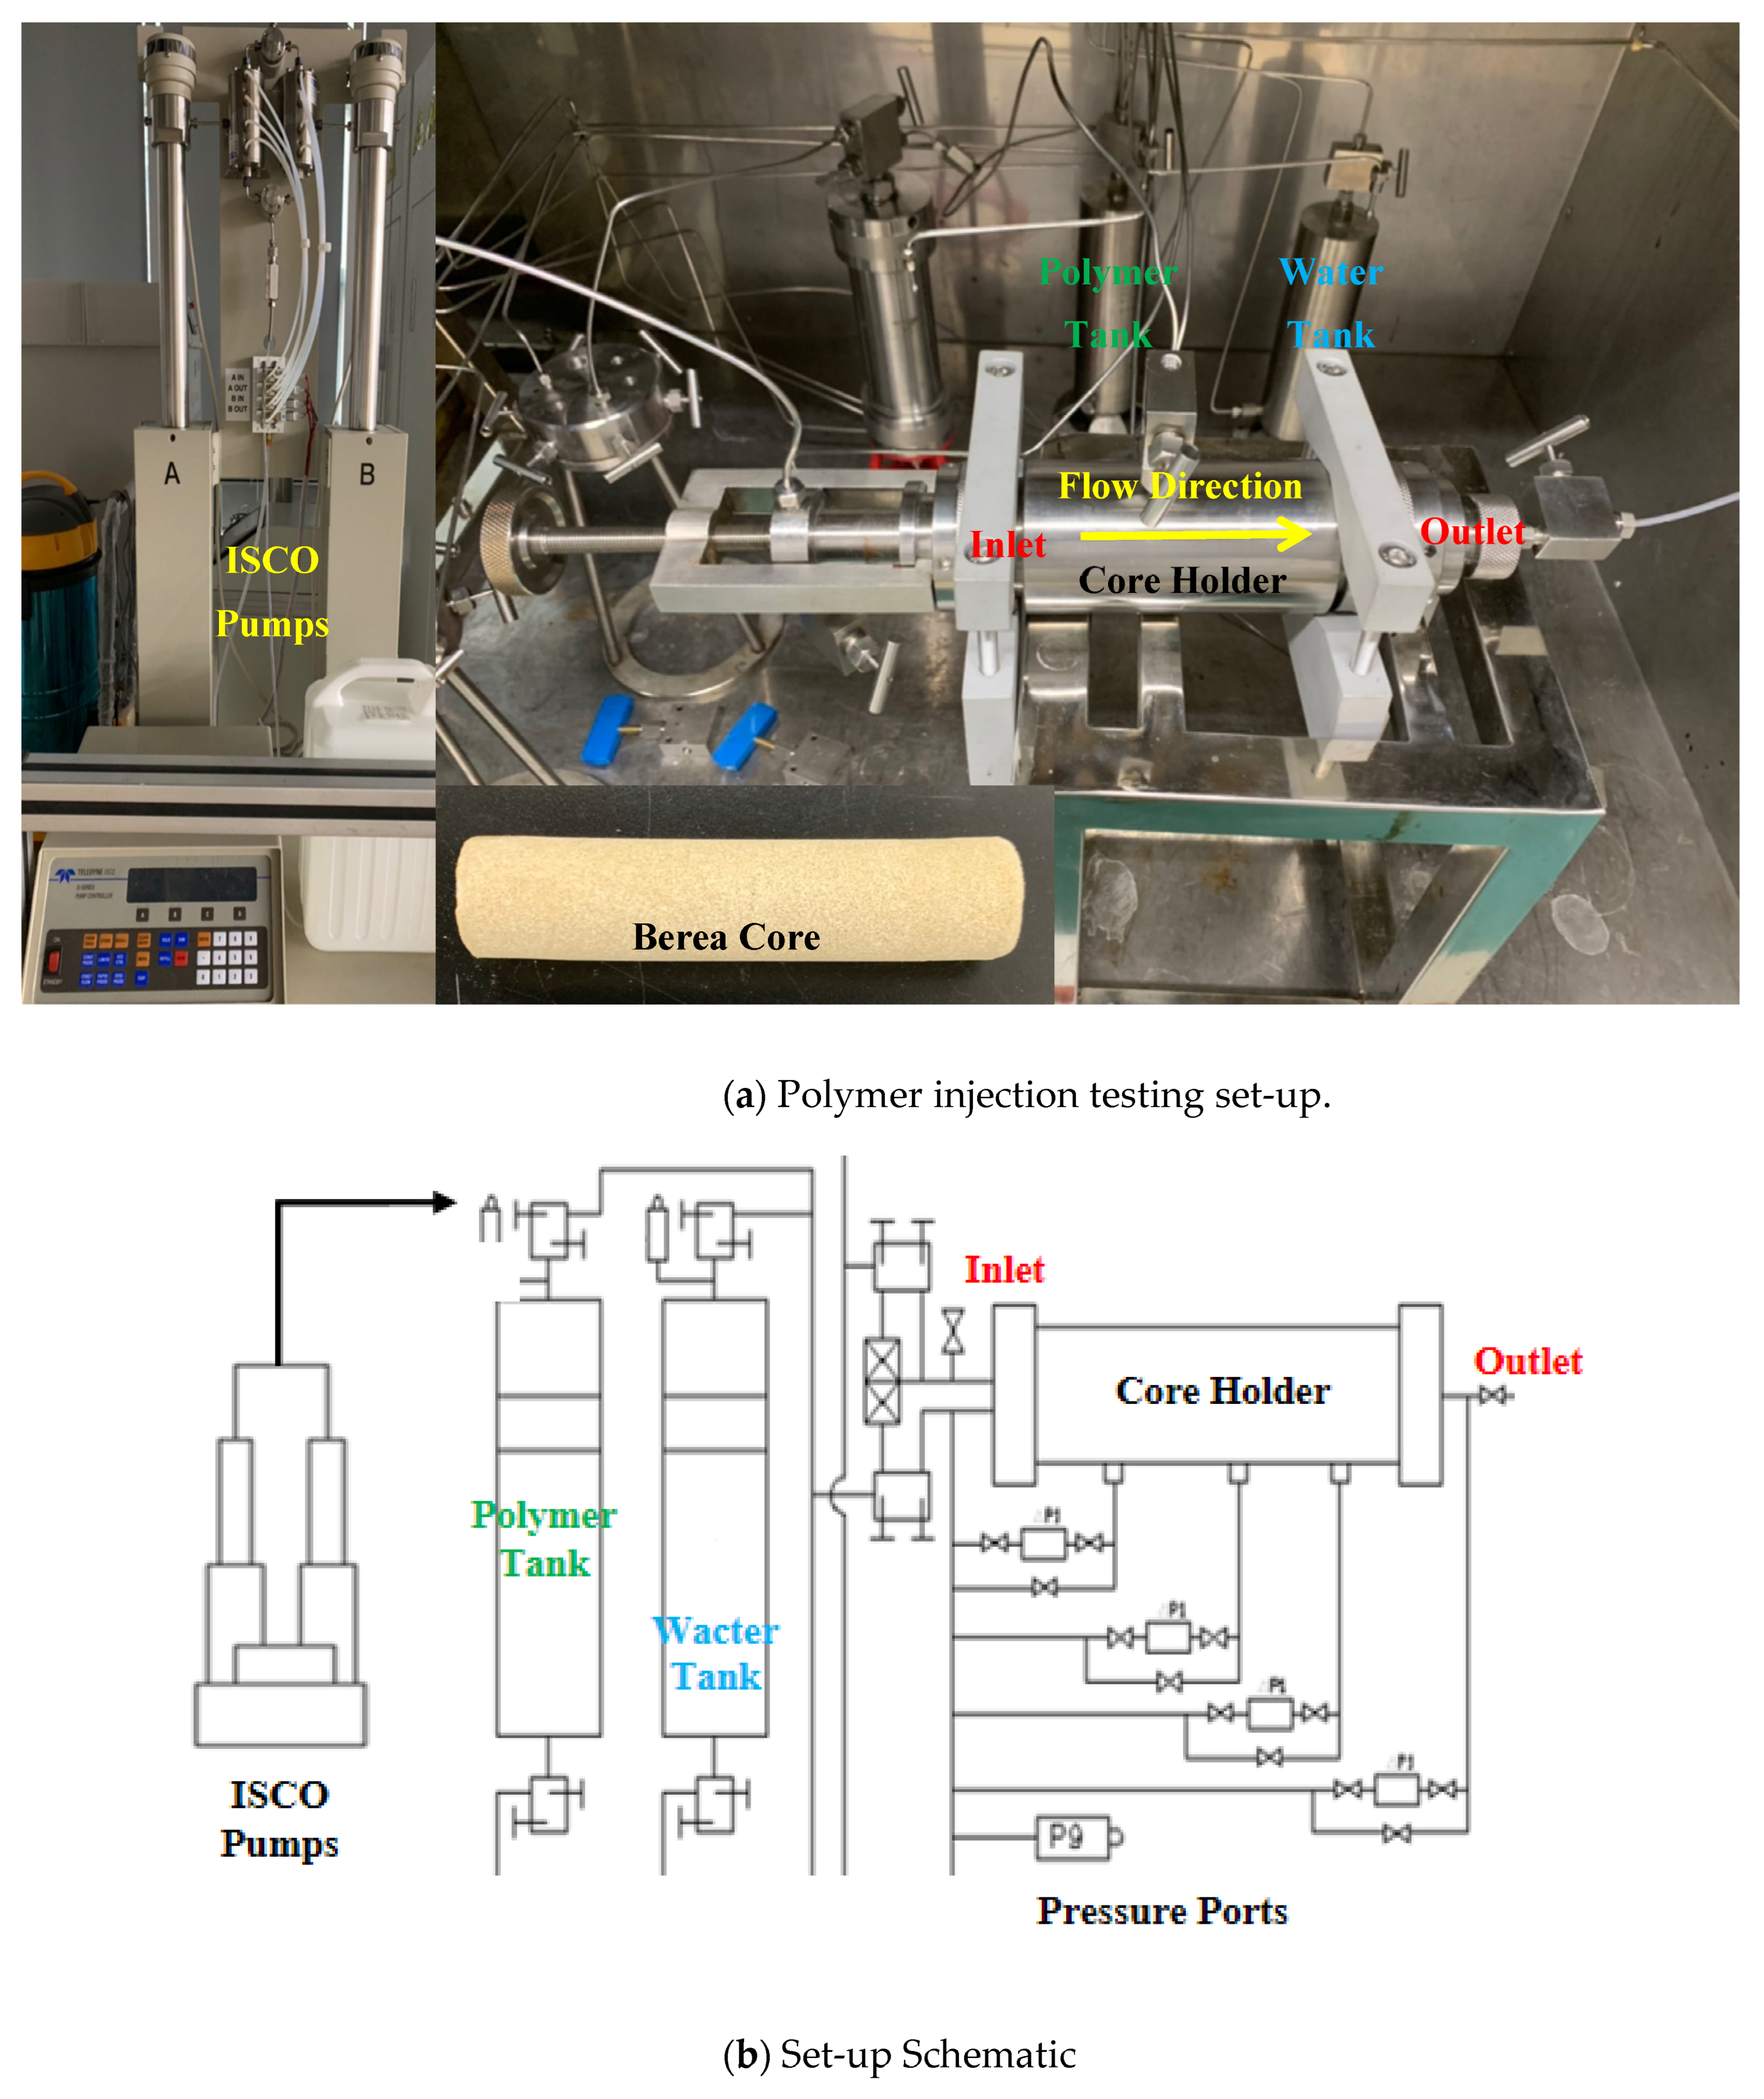
3.3. Reservoir–Polymer Compatibility

Proper polymer MW must be selected to ensure the compatibility between the polymer and the reservoir. In this section, the optimal polymer MW is obtained through laboratory testing to improve the reservoir–polymer compatibility. A polymer with a higher MW has a larger hydrodynamic radius. The average pore throat size of the formation should be more than five times the average size of the polymer aggregate to ensure.

3.3.1. Method and Material

Five polymers with different MW (8 million, 12 million, 16 million, and 2100 million) and concentrations (500, 800, 1000, 1200, 1600, and 2500 ppm) are tested. Table 4 shows the testing matrix and the concentration and viscosity relationship. Figure 14 shows the testing set-up and its schematic. Water and polymer stored in the tanks are used for injection. Berea core is used in the testing. The Berea core samples have a permeability of 1200 mD. The diameter of the core is 2.5 cm and the length is 10 cm. The testing temperature is 70 °C, which is consistent with the reservoir. Two ISCO pumps are used for water and polymer injection, respectively. The polymer injection rate is designed as 13 mL/min to emulate the high flow velocity near the wellbore region. First, the core sample is fully saturated with water. Then, the polymer is injected until stabilization and the stabilized pressure is recorded.

3.3.2. Laboratory Testing Results

Figure 15 compares the injection pressure testing results for the five polymers with different viscosities. It is found that polymers with MW less than 1600 have comparable injection pressure. However, when the MW reaches 12 million, the injection pressure is elevated, indicating the polymer aggregates could not easily flow through the core sample.

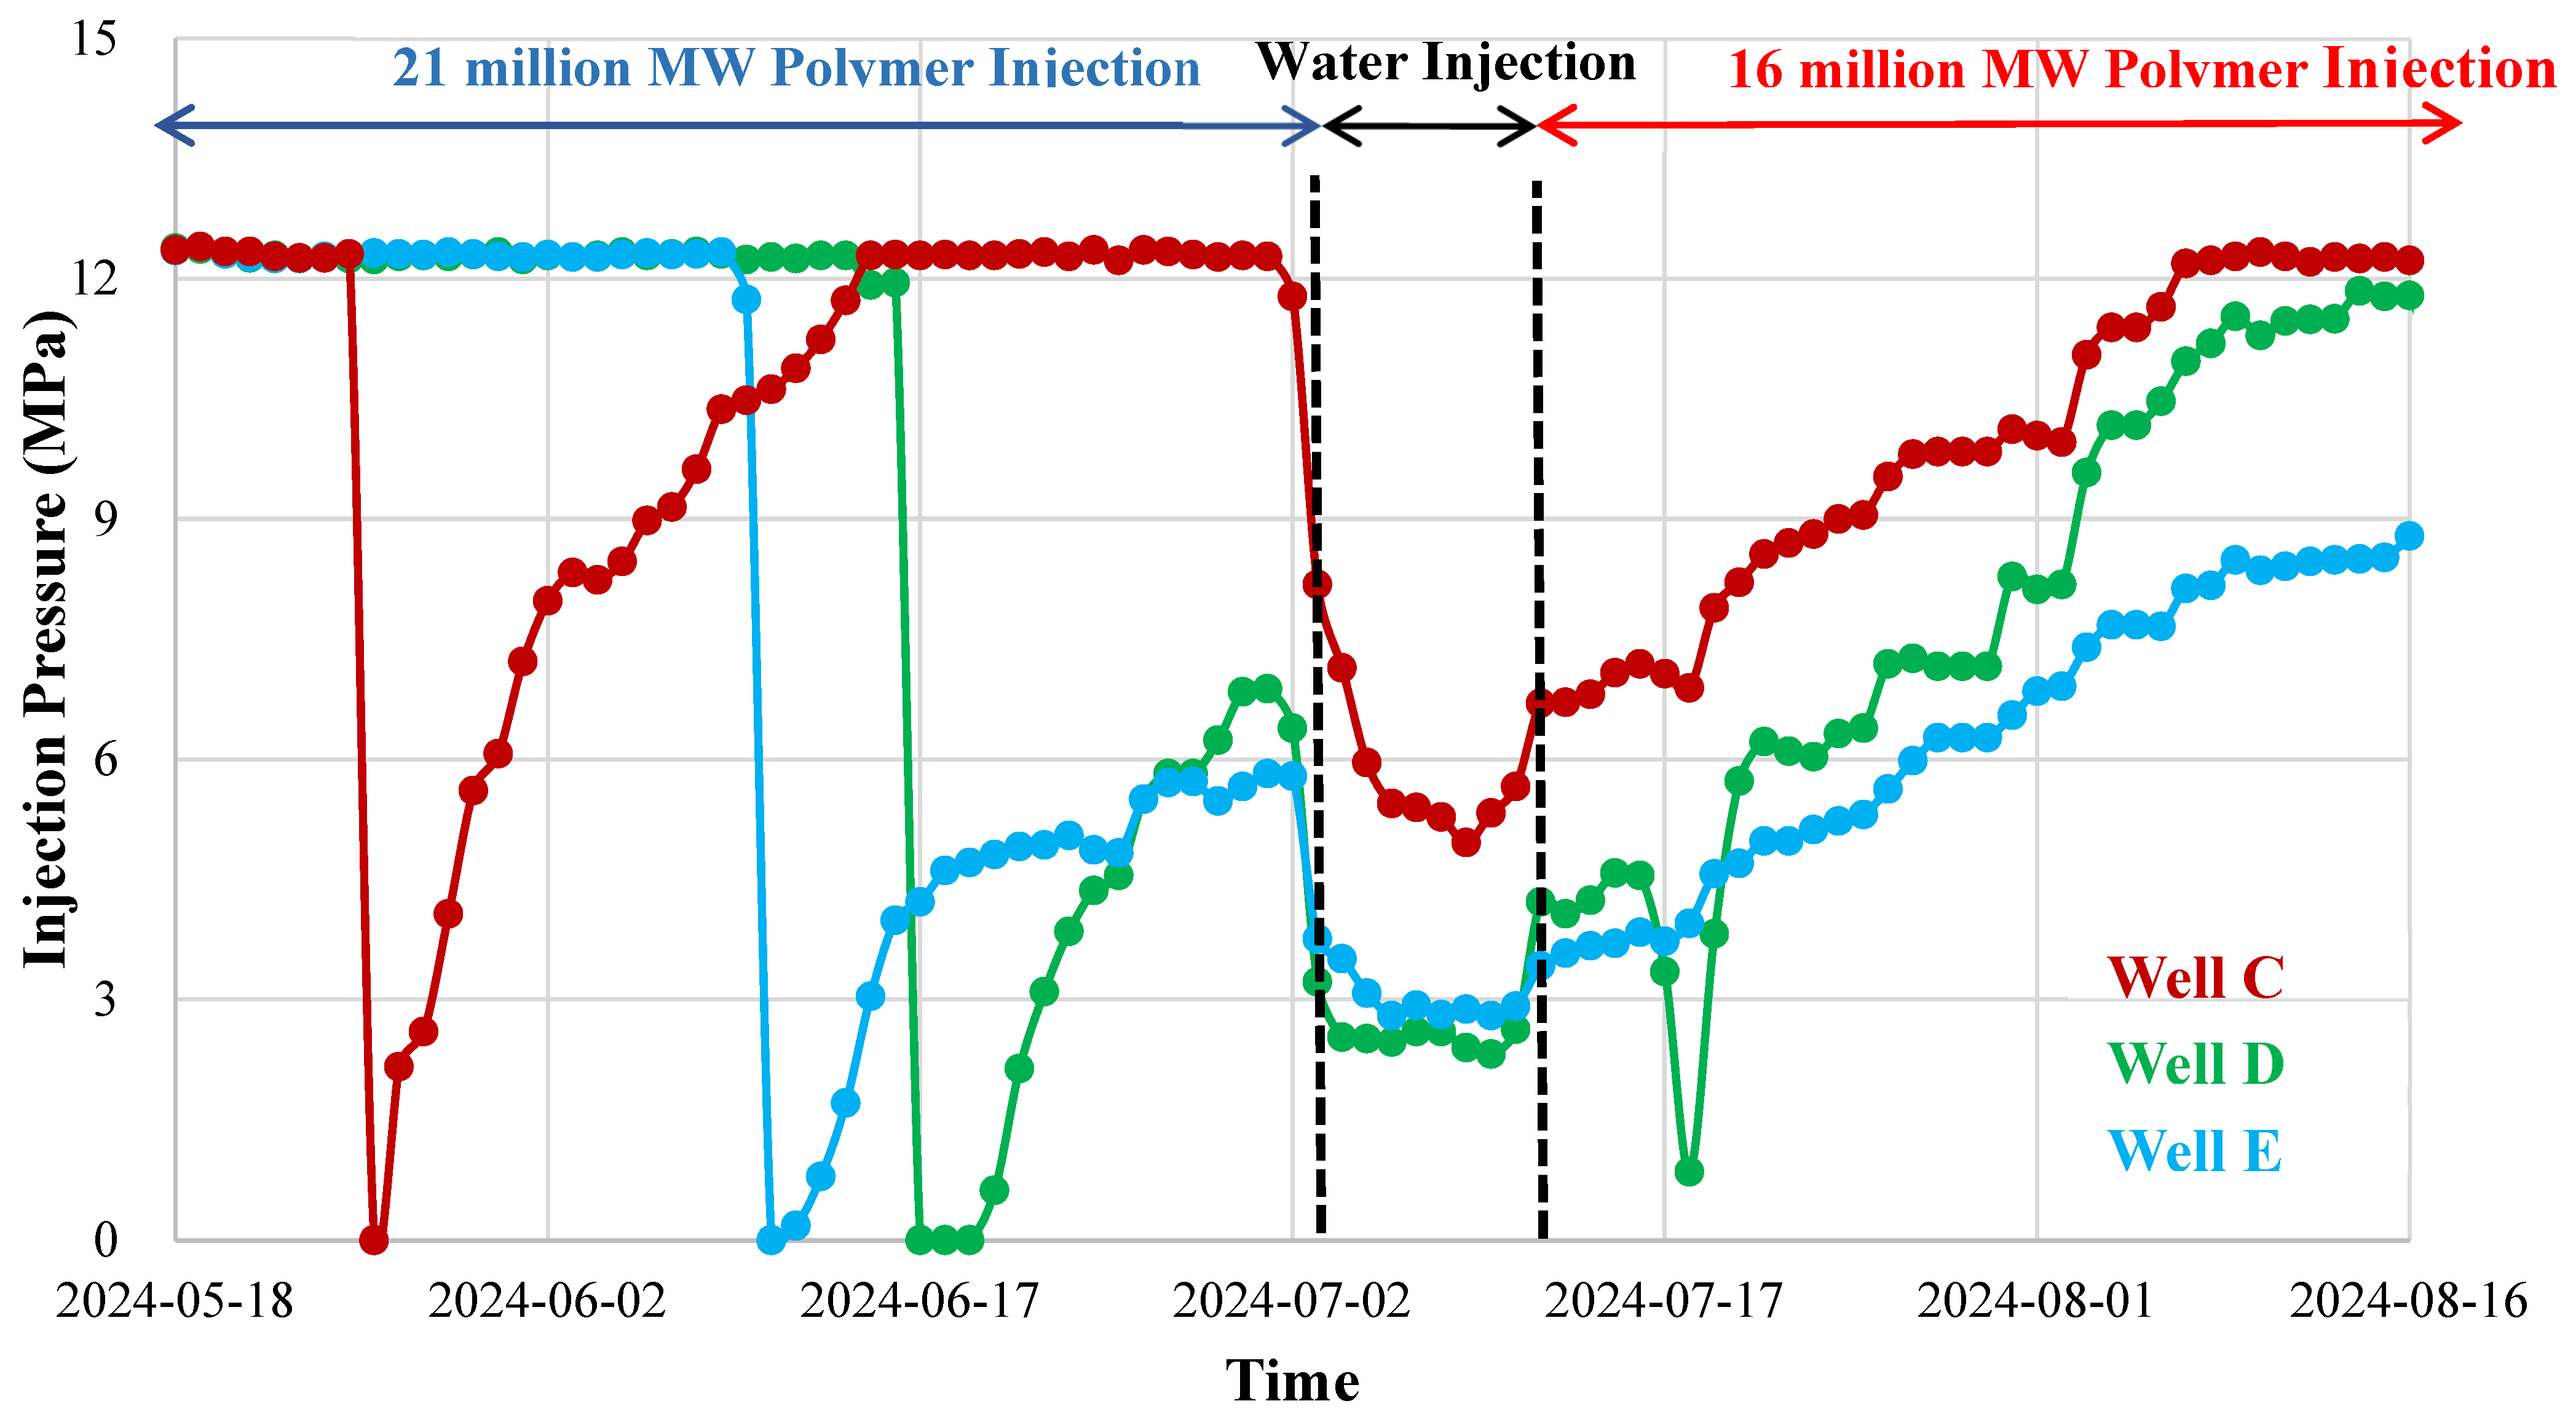
3.3.3. Field Validation

After laboratory testing, a polymer with 16 million MW is used to test the injectivity in the field application. Figure 16 shows the injectivity results for three representative wells (Well C, D, and E). Originally, a polymer with 21 million MW is used for the polymer flooding project. Then, water is injected for ten days. Next, the MW is reduced to 16 million for injection. The injection pressure profiles of the three injectors indicate that polymer with 16 million MW has better injectivity than polymer with 21 million. The injection pressure increase rates decrease from 0.43 to 0.23 MPa/day, 0.2 to 0.16 MPa/day, and 0.4 to 0.24 MPa/day, respectively, for Well C, D, and E. The slower injection pressure increase rate validates that 16 million MW polymer has better compatibility with the reservoir formation and could enhance the injectivity.

4. Discussion

Three different injectivity enhancement strategies have been proposed and conducted for the Bohai Q oilfield polymer flooding project from three main aspects: (1) surface polymer fluid preparation; (2) downhole wellbore stimulation; and (3) reservoir–polymer compatibility, respectively. For the surface polymer fluid preparation, onsite sieve flow tests optimize the mesh size for both the water preparation process and mother solution preparation process to improve the polymer solution quality and reduce the amount of fish eyes and other impurities. After mesh upgrading, the overall average injection pressure decreased by 0.5 MPa for all the injectors. The surface strategy is easy to implement; however, it only provides a minor enhancement for the injectivity. Regarding the downhole wellbore stimulation strategy, generally, the acidizing treatment could decrease the injection pressure by around 7 MPa, while the re-perforation measure could increase the injection rate by almost three times. The re-perforation measure creates extra flow channels for the injection. Also, screens with plugged apertures are penetrated, reducing the level of the flow restriction. Although the downhole wellbore stimulation measures are effective and powerful, the cost is high. Also, repetitive acidizing treatment introduces corrosion risk to the tubing. Considering the economy, it is recommended to use such measures for wells with severe injectivity loss. Based on the field data, the acidizing effective period lasts around six months. Usually, a polymer flooding project runs for a couple of years. Thus, polymer–reservoir compatibility analysis is conducted to ensure and maintain the injectivity for the long term. Polymers with lower MW have better injection performance than ones with higher MW. However, higher MW polymer has greater displacing efficiency and is beneficial for the economy. Thus, the optimal polymer MW must be selected considering the injectivity and economy. In this case, based on the laboratory and field tests, the optimal MW of 16 million is selected for the Q oilfield.
Based on the results, for future polymer flooding projects, it is recommended to first conduct laboratory and field tests to obtain the proper polymer MW to ensure the injectivity. Regarding the injectivity enhancement method, the surface method (upgrading the mesh and reducing fish eyes) is the easiest way to apply and favorable for maintaining long-term injectivity. Moreover, for those wells with severe injectivity issues, acidizing or re-perforation methods could be used to enhance the injectivity.

5. Conclusions

In this study, a field case of a Chinese offshore polymer flooding EOR project is presented, where an injectivity loss issue is encountered. The causes for the injectivity loss are analyzed, and a few measures are implemented to enhance the injectivity. The key conclusions of this study are summarized below:
(1)
A few strategies targeting from surface, wellbore, and reservoir are proposed and implemented to enhance the injectivity of the Q oilfield;
(2)
Proposed strategies are effective in improving the injectivity;
(3)
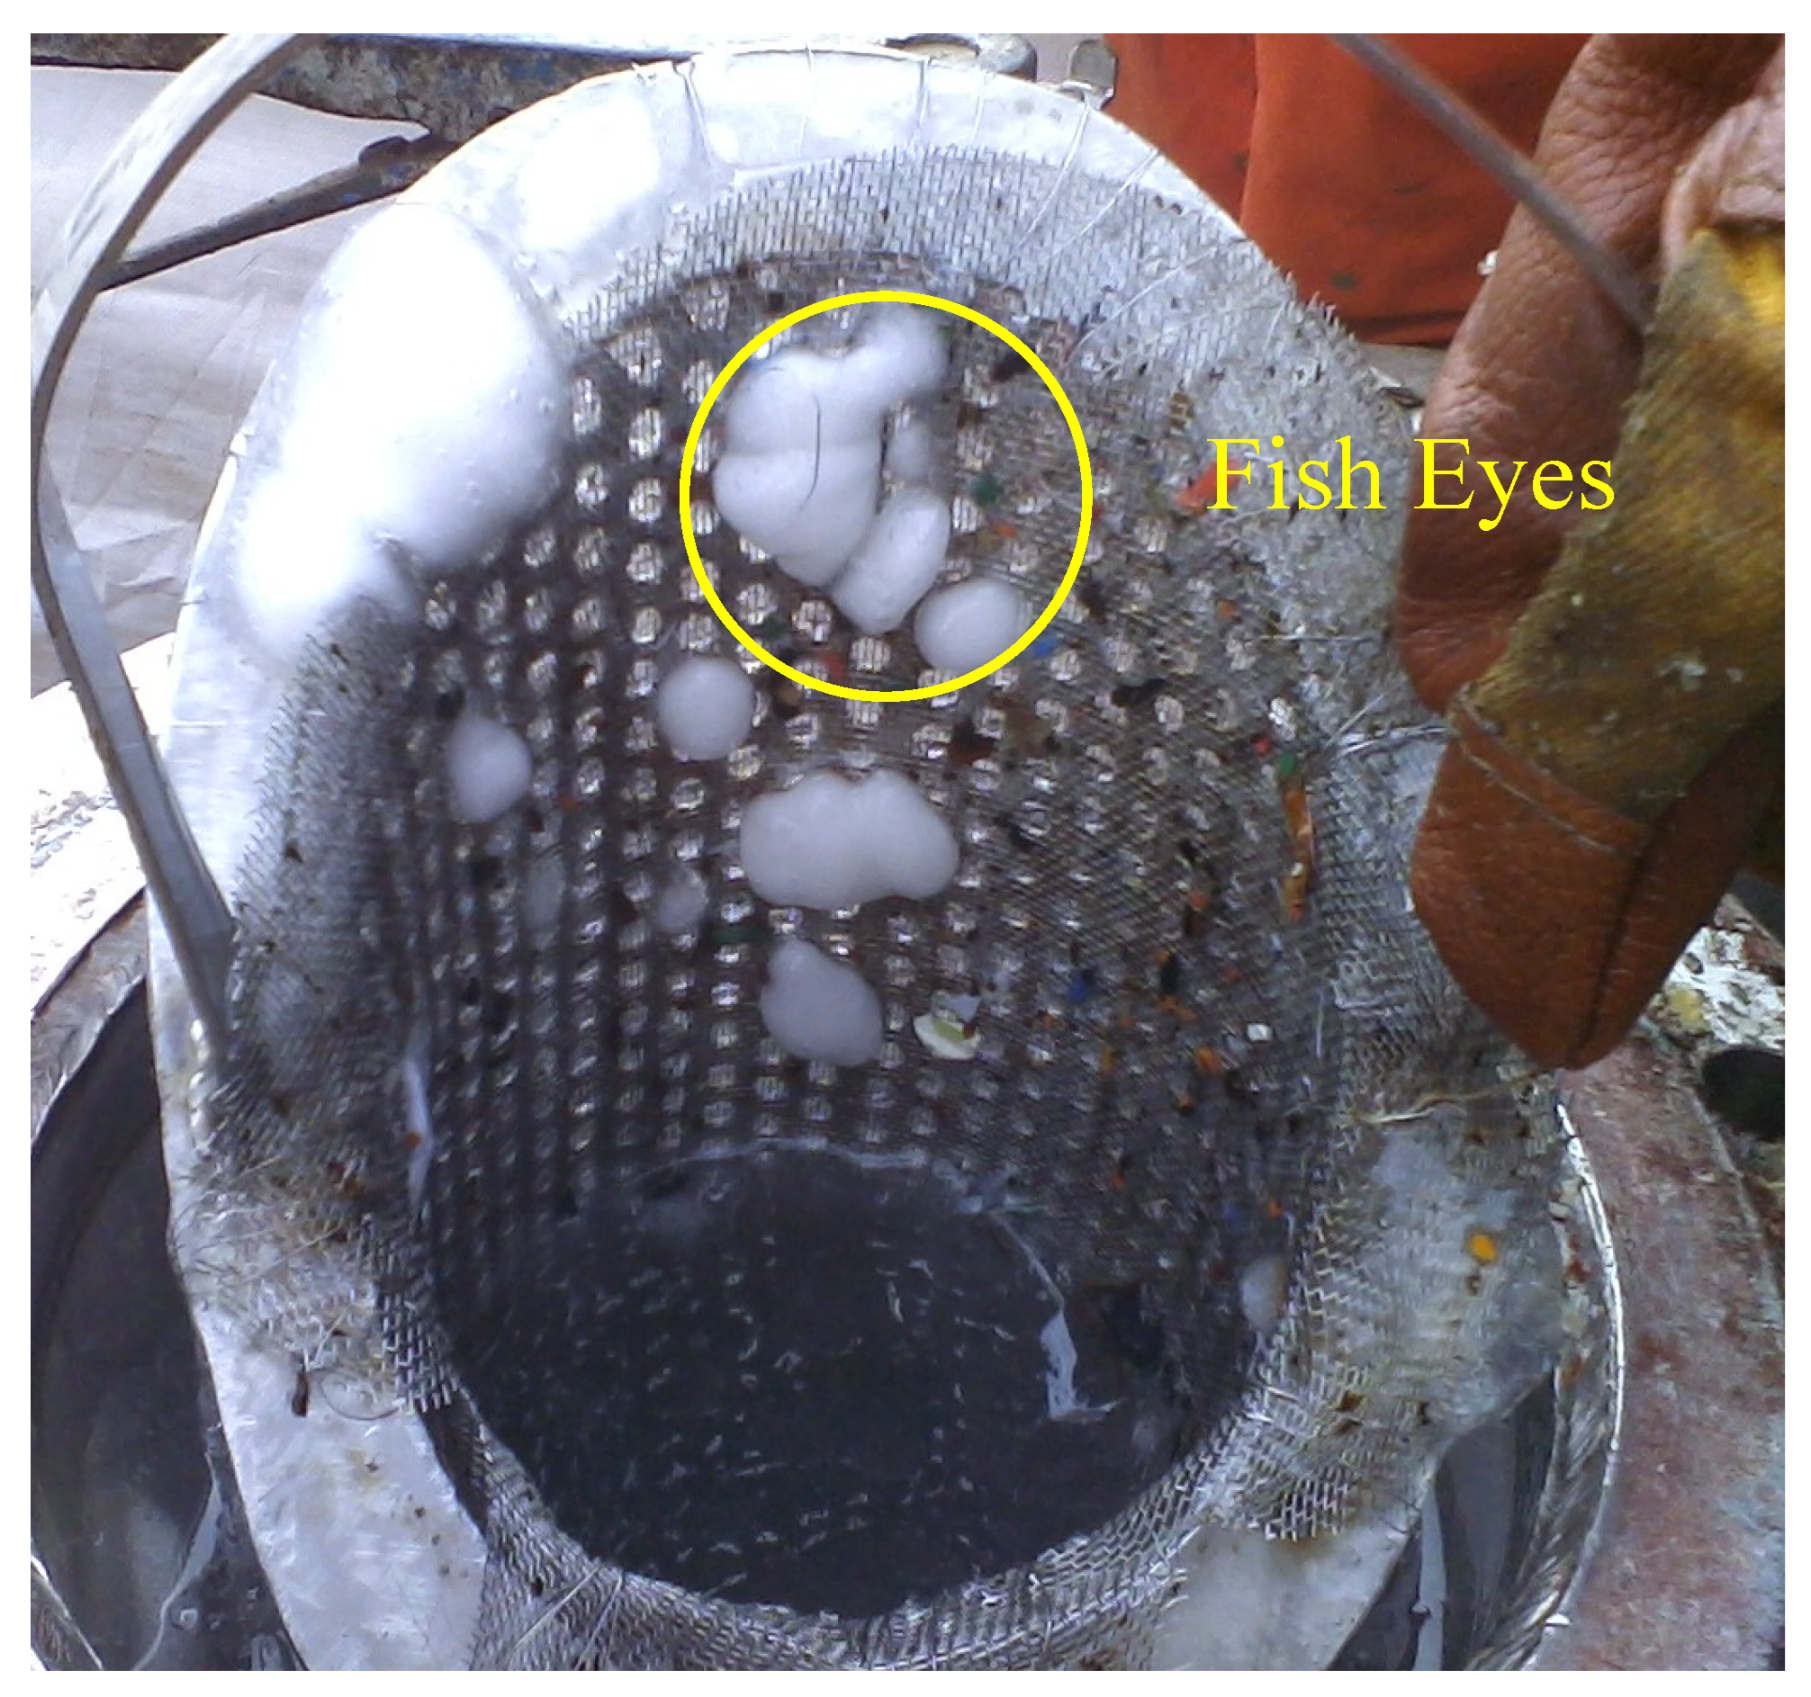
Polymer solution quality should be well controlled during the polymer fluid preparation process to avoid fish eyes entering the reservoir causing plugging;
(4)
Acidizing is an effective measure to clean the skin formed due to plugging, although the cost is high and may corrode the tubing;
(5)
The well completion parameters are critical for injectivity, longer perforation channels favor the polymer injection, and the plugged sand control screen is another key factor causing downhole plugging;
(6)
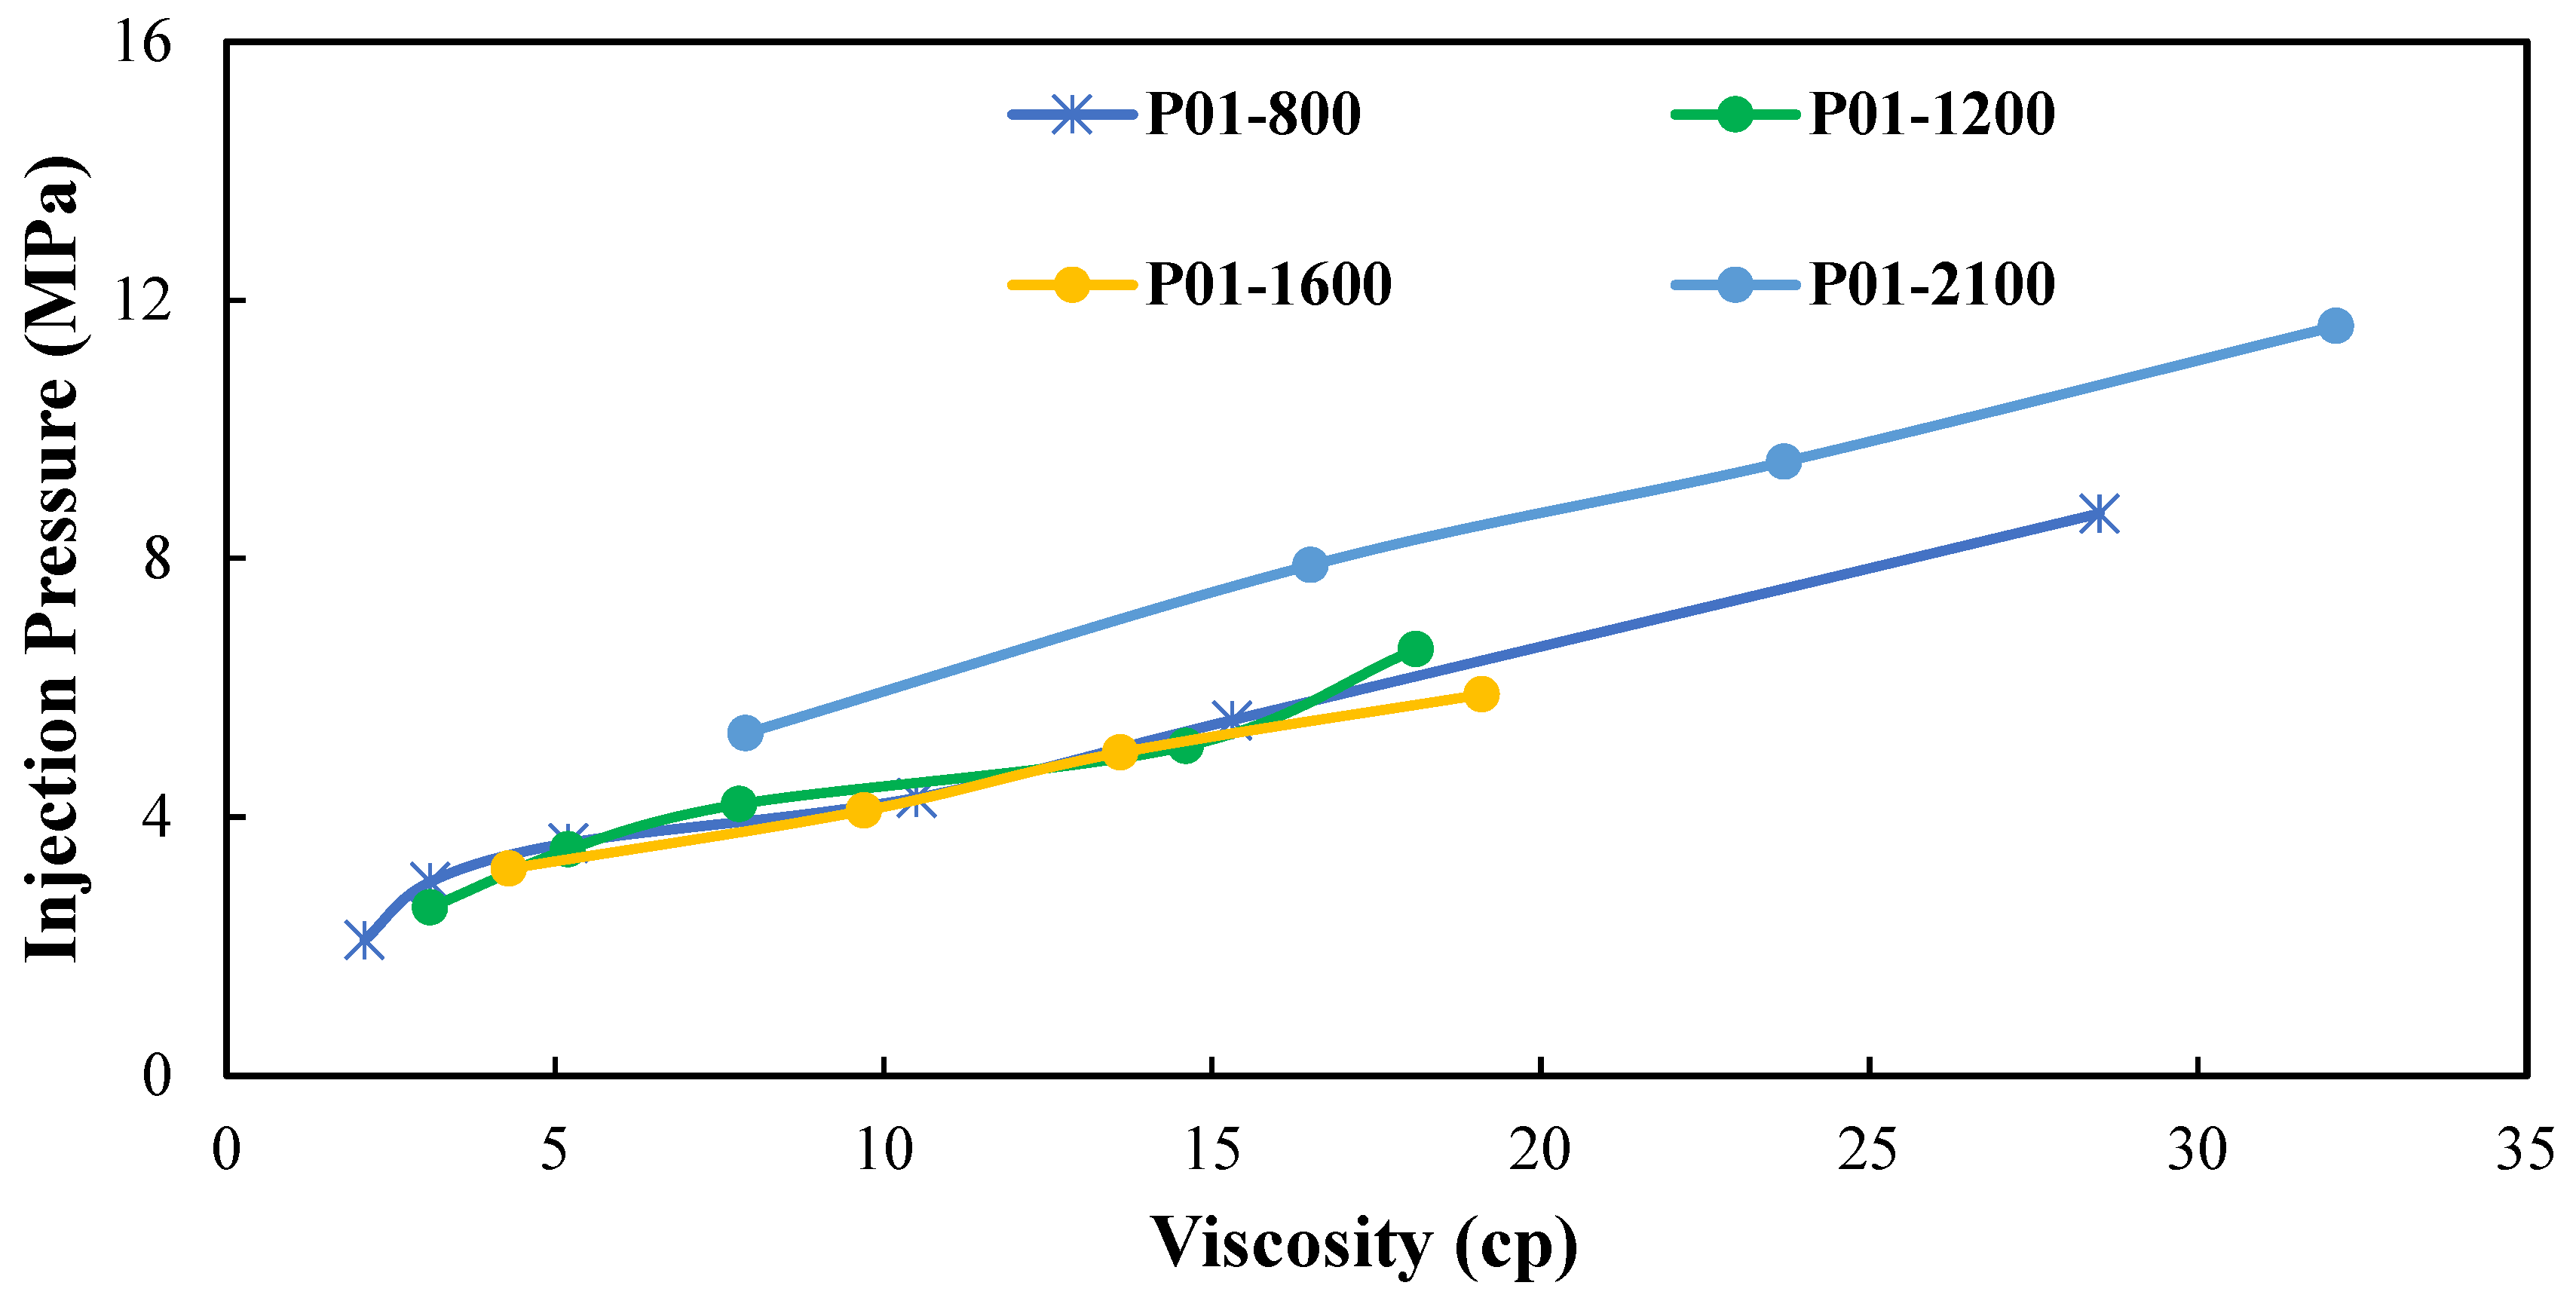
Proper polymer MW selection is the key to maintaining long-term desirable injectivity;
(7)
Proposed strategies provide insights into resolving the injectivity loss and could be useful for operators implementing offshore EOR projects.

Author Contributions

Writing—original draft, C.W.; Supervision, J.Z.; Methodology, B.H.; Visualization, H.D.; Resources, X.M.; Data Curation, X.L., X.X., Y.S., C.L. and H.G. All authors have read and agreed to the published version of the manuscript.

Funding

This research received no external funding.

Data Availability Statement

Data are contained within the article.

Acknowledgments

The authors would like to appreciate the technical supports from engineers in the Q oilfield.

Conflicts of Interest

Author Chenxi Wang, Jian Zhang, Bo Huang, Hong Du, Xianjie Li and Xinsheng Xue were employed by the company CNOOC Research Institute Ltd. Xianghai Meng, Yi Su, Chao Li and Haiping Guo were employed by the company CNOOC (China) Limited Tianjin Branch. The authors declare that the research was conducted in the absence of any commercial or financial relationships that could be construed as a potential conflict of interest.

Appendix A

The specific details for Wells A to E is given below.
Table A1. Wells A to E information.
WellsABCDE
Injection Rate (m3/d)500445605240260
Polymer Concentration (ppm)12001400140010001200
Well CompletionsPre-packed ScreenWire-wrapped Screen/Gravel Pack
Screen Size (μm)150150 + 20/40

References

  1. Li, Q.; Li, Q.; Cao, H.; Wu, J.; Wang, F.; Wang, Y. The Crack Propagation Behaviour of CO2 Fracturing Fluid in Unconventional Low Permeability Reservoirs: Factor Analysis and Mechanism Revelation. Processes 2025, 13, 159. [Google Scholar] [CrossRef]
  2. Li, Q.; Li, Q.; Wu, J.; Li, X.; Li, H.; Cheng, Y. Wellhead Stability During Development Process of Hydrate Reservoir in the Northern South China Sea: Evolution and Mechanism. Processes 2025, 13, 40. [Google Scholar] [CrossRef]
  3. Liu, H.; Li, J.; Yan, J.; Wang, W.; Zhang, Y.; Zhao, L. Successful Practices and Development of Polymer Flooding in Daqing Oilfield. In Proceedings of the Asia Pacific Oil and Gas Conference & Exhibition, Jakarta, Indonesia, 4–6 August 2009. [Google Scholar] [CrossRef]
  4. Jabri, R.; Mjeni, R.; Gharbi, M.; Alkindi, A. Optimizing Field Scale Polymer Development in Strong Aquifer Fields in the South of the Sultanate of Oman. In Proceedings of the SPE Middle East Oil and Gas Show and Conference, Manama, Bahrain, 18–21 March 2019. [Google Scholar] [CrossRef]
  5. Delamaide, E. Review of Canadian Field Cases of Chem ical Floods with Associative Polymer. In Proceedings of the SPE Improved Oil Recovery Conference, Virtual, 31 August–4 September 2020. [Google Scholar] [CrossRef]
  6. Shankar, V.; Sharma, G. Decoding the Impact of Injection-Induced Fractures on the Sweep Efficiency of a Mature Polymer Flood through Pressure Falloff Analysis. SPE Res. Eval. Eng. 2023, 26, 348–364. [Google Scholar] [CrossRef]
  7. Lu, X.; Li, W.; Wei, Y.; Xu, J. A Review on the Largest Polymer Flood Project in the World. In Proceedings of the SPE Annual Technical Conference and Exhibition, Houston, TX, USA, 3–5 October 2022. [Google Scholar] [CrossRef]
  8. Needham, R.B.; Doe, P.H. Polymer Flooding Review. J. Pet. Technol. 1987, 39, 1503–1507. [Google Scholar] [CrossRef]
  9. Wang, D.; Zhang, J.; Meng, F.; Liu, H.; Li, L.; Han, B.; Qi, L. Commercial Test of Polymer Flooding in Daqing Oil Field Daqing Petroleum Administrative Bureau. In Proceedings of the International Meeting on Petroleum Engineering, Beijing, China, 14–17 November 1995. [Google Scholar] [CrossRef]
  10. Song, W.; Zeng, X.; Yao, H.; Li, J.; Lv, X.; Tian, Y.; Guo, Y. Application of a New Crosslinked Polymer Displacement Technology at Bo-19 Block in Gudao Oilfield. In Proceedings of the SPE Asia Pacific Oil and Gas Conference and Exhibition, Melbourne, Australia, 8–10 October 2002. [Google Scholar] [CrossRef]
  11. Wang, Y.; He, L. Commercial Success of Polymer Flooding in Daqing Oilfield—Lessons Learned. In Proceedings of the SPE Asia Pacific Oil & Gas Conference and Exhibition, Adelaide, Australia, 11–13 September 2006. [Google Scholar] [CrossRef]
  12. Hongyan, W.; Xulong, C.; Jichao, Z.; Aimei, Z. Development and application of dilute surfactant–polymer flooding system for Shengli oilfield. J. Pet. Sci. Eng. 2009, 65, 45–50. [Google Scholar] [CrossRef]
  13. Caili, D.; Qing, Y.; Fulin, Z.; Hanqiao, J. Residual Polymer Reutilization for IOR after Polymer Flooding: From Laboratory to Field Application in Daqing Oilfield. Pet. Sci. Technol. 2011, 29, 2441–2449. [Google Scholar] [CrossRef]
  14. Gao, C.H. Experiences of Polymer Flooding Projects at Shengli Oilfield. In Proceedings of the SPE EOR Conference at Oil and Gas West Asia, Muscat, Oman, 31 March–2 April 2014. [Google Scholar] [CrossRef]
  15. Gao, S.; He, Y.; Zhu, Y.; Han, P.; Peng, S.; Liu, X. Associated Polymer ASP Flooding Scheme Optimization Design and Field Test after Polymer Flooding in Daqing Oilfield. In Proceedings of the SPE Improved Oil Recovery Conference, Virtual, 31 August–4 September 2020. [Google Scholar] [CrossRef]
  16. Zhu, Y.J.; Zhang, J.; Zhao, W.S.; Wang, S.S.; Jing, B.; Meng, F.X.; Zhang, H. Research on Efficient Polymer Dissolving Technology for Hydrophobically Associating Polymer Flooding on Offshore Platform. Appl. Mech. Mater. 2014, 670–671, 290–294. [Google Scholar] [CrossRef]
  17. Zhang, J.; Jing, B.; Fang, S.; Duan, M.; Ma, Y. Synthesis and performances for treating oily wastewater produced from polymer flooding of new demulsifiers based on polyoxyalkylated n,n-dimethylethanolamine. Polym. Adv. Technol. 2015, 26, 190–197. [Google Scholar] [CrossRef]
  18. Flavien, G.; Cao, X.; Ming, Y.; Yuan, F.; Gong, J.; Zhao, F.; Li, B.; Dorian, R.; Zhu, C.; Xie, K. Offshore Large Scale Polymer Flood Implementation at Chengdao Field. In Proceedings of the Offshore Technology Conference Asia, Virtual and Kuala Lumpur, Malaysia, 22–25 March 2022. [Google Scholar] [CrossRef]
  19. Wang, X.; Zhang, J.; Huang, B.; Duan, M. Degradable cationic clarifiers based on ester bonds for treating wastewater produced from polymer flooding. Can. J. Chem. Eng. 2023, 101, 2485–2492. [Google Scholar] [CrossRef]
  20. Zhang, J.; Du, H.; Wang, C.; Wang, X.; Li, X.; Bo, H. Developing an Instant Polymer Fluid Preparation Facility for Offshore Polymer Flooding Applications. In Proceedings of the APOGCE 2024, Perth, Australia, 15–17 October 2024. [Google Scholar] [CrossRef]
  21. Jennings, R.R.; Rogers, J.H.; West, T.J. Factors influencing mobility control by polymer solution. J. Pet. Technol. 1971, 23, 391–401. [Google Scholar] [CrossRef]
  22. Lee, K.S. Effects of Polymer Adsorption on the Oil Recovery during Polymer Flooding Processes. Pet. Sci. Technol. 2010, 28, 351–359. [Google Scholar] [CrossRef]
  23. Kamal, M.S.; Sultan, A.S.; Al-Mubaiyedh, U.A.; Hussein, I.A. Review on Polymer Flooding: Rheology, Adsorption, Stability, and Field Applications of Various Polymer Systems. Polym. Rev. 2015, 55, 491–530. [Google Scholar] [CrossRef]
  24. Glasbergen, G.; Wever, D.; Keijzer, E.; Farajzadeh, R. Injectivity Loss in Polymer Floods: Causes, Preventions and Mitigations. In Proceedings of the SPE Kuwait Oil and Gas Show and Conference, Mishref, Kuwait, 11–14 October 2015. [Google Scholar] [CrossRef]
  25. Nagai, D.; Isobe, N.; Maki, Y.; Okamoto, S. Gelation of Hydrophilic Polymer Bearing Metal-coordination Unit with Various Metal Ions. Chem. Lett. 2023, 52, 843–845. [Google Scholar] [CrossRef]
  26. Khormali, A.; Petrakov, D.G.; Farmanzade, A.R. Prediction and Inhibition of Inorganic Salt Formation under Static and Dynamic Conditions—Effect of Pressure, Temperature, and Mixing Ratio. Int. J. Technol. 2016, 7, 943–951. [Google Scholar] [CrossRef]
  27. Feng, D.; Huang, C.; Li, S.; Li, Y.; Cao, Z. Application and research of tubing cleaning technology. Duankuai Youqitian Fault-Block Oil Gas Field 2010, 17, 102–104. [Google Scholar]
  28. Penner, V.A.; Martemyanov, D.B.; Pshenichnikova, V.V.; Likholobov, V.A.; Yusha, V.L. Temperature control of thermal-gas-dynamical installation in cleaning oil-well tubes. AIP Conf. Proc. 2017, 1876, 020088. [Google Scholar]
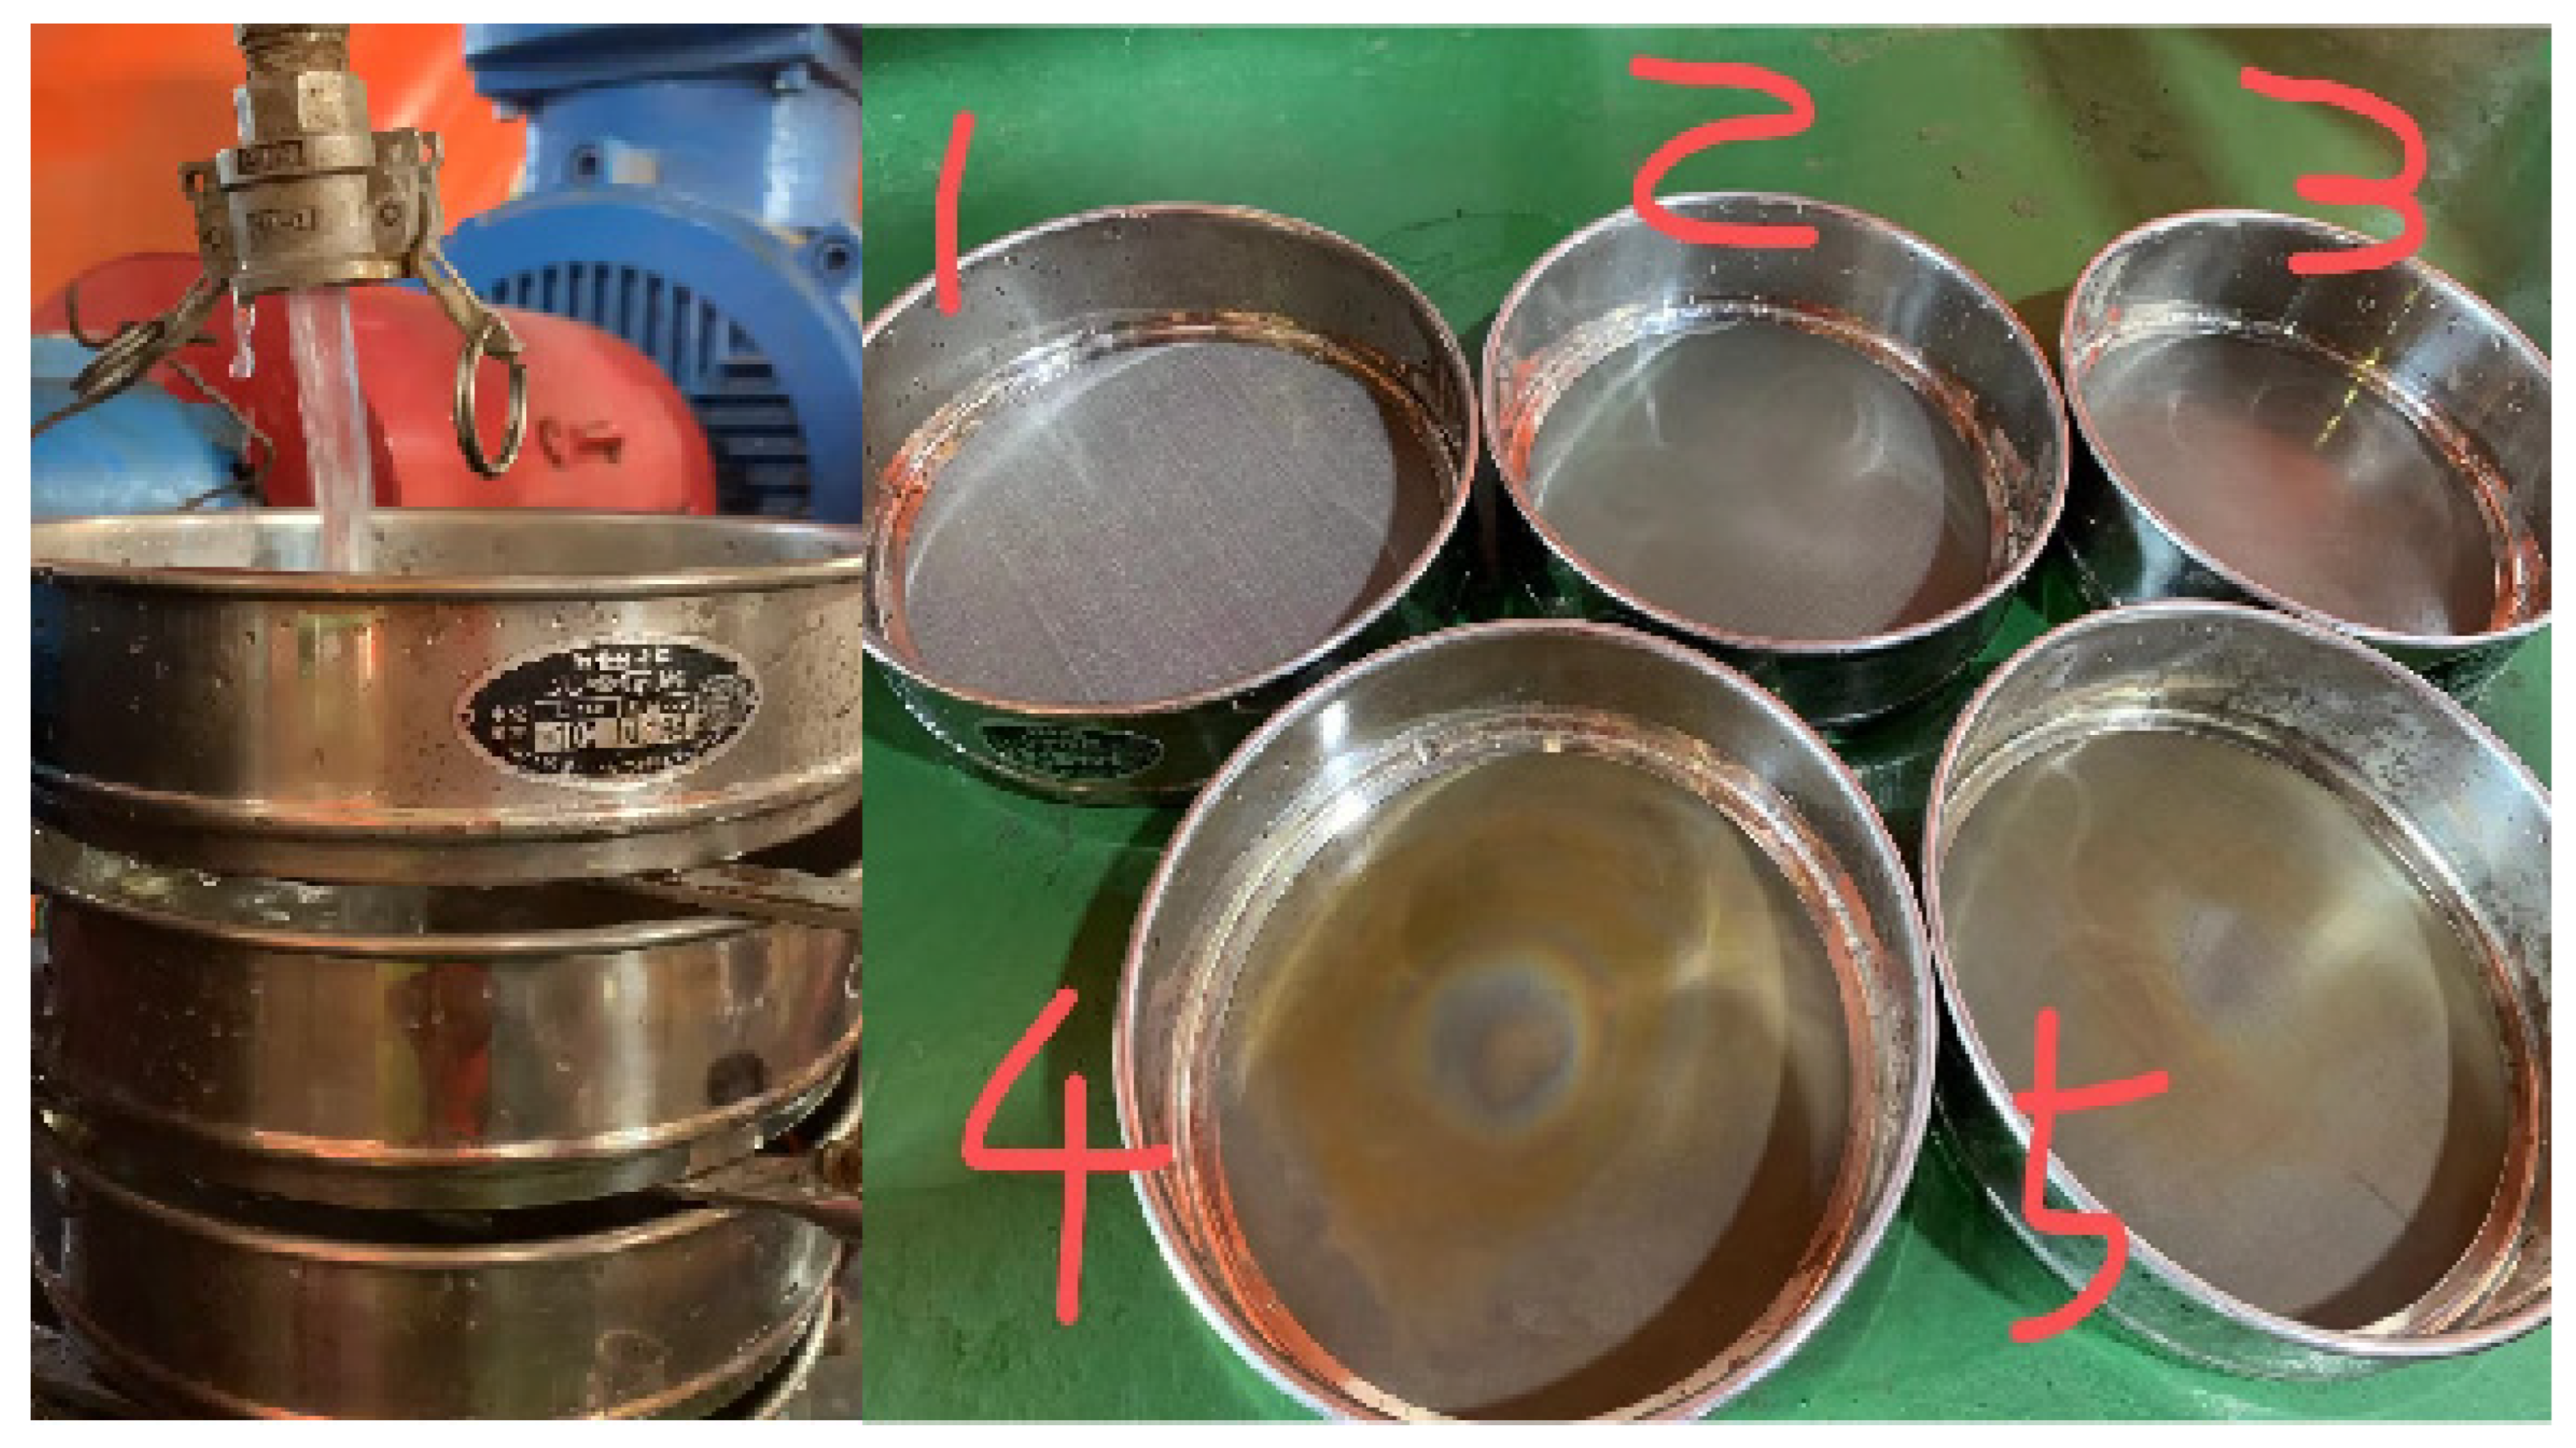
Figure 1. Fish eyes captured by filters.
Processes 13 00903 g001
Figure 2. Flowchart of the surface polymer fluid preparation process.
Processes 13 00903 g002
Figure 3. Water sampling location (a), and sieve flow test (b).
Processes 13 00903 g003
Figure 4. Sieve plugging (a), plugged sieve (mesh 500) after flow test (b).
Processes 13 00903 g004
Figure 5. Clean mesh (a), mesh 300 after cleaning (b), mesh 400 after cleaning (c), and mesh 500 after cleaning (d).
Processes 13 00903 g005
Figure 6. Multi-sieve flow test of preparation water (1–5 represent Meshes 100–500, respectively).
Processes 13 00903 g006
Figure 7. Multi-sieve flow test results (a) Mesh 100, (b) Mesh 200, (c) Mesh 300, (d) Mesh 400, (e) Mesh 500.
Processes 13 00903 g007
Figure 8. Filtration mesh flow results of the preparation water process (a) Mesh 100, (b) Mesh 200.
Processes 13 00903 g008
Figure 9. Multi-sieve flow test of mother solution (a), Flow testing results of Mesh 100, 200, and 300 (b).
Processes 13 00903 g009
Figure 10. Filtration meshes of the mother solution process (a), flow testing results of Mesh 40 and 200 (b).
Processes 13 00903 g010
Figure 11. Injectivity recovery results after mesh upgrading (Well A).
Processes 13 00903 g011
Figure 12. Acidizing results of Well A.
Processes 13 00903 g012
Figure 13. Re-perforation results of Well B.
Processes 13 00903 g013
Figure 14. Polymer injection testing set-up (a), and its schematic (b).
Processes 13 00903 g014
Figure 15. Testing results of polymers with different MW and viscosities.
Processes 13 00903 g015
Figure 16. Field validation tests for polymers with different MW.
Processes 13 00903 g016
Table 1. Plugging Time Results.
Mesh Number Time H
30025
40012.5
5002.5
Table 2. Plugging Percentage of the Meshes.
Plugging Percentage Mesh 100Mesh 200Mesh 300Mesh 400Mesh 500
20%40%80%90%100%
Table 3. Perforation Parameters.
Before Re-PerforationAfter Re-Perforation
Height m18.324.2
SPF1220
Perforation Diameter m0.01530.008
Perforation Length m0.1350.85
Phase 45/135°60/120°
Table 4. Concentration and viscosity relationship.
Polymer MWConcentration (ppm)Viscosity (cp)
P01-21005007.9
80016.5
100023.7
120032.1
P01-16005004.3
8009.7
100013.6
120019.1
P01-12005003.1
8005.2
10007.8
120014.6
160018.1
>P01-8005002.1
8003.1
10005.2
120010.5
160015.3
250028.5
Disclaimer/Publisher’s Note: The statements, opinions and data contained in all publications are solely those of the individual author(s) and contributor(s) and not of MDPI and/or the editor(s). MDPI and/or the editor(s) disclaim responsibility for any injury to people or property resulting from any ideas, methods, instructions or products referred to in the content.

