Article

Technological Challenges of Spirulina Powder as the Functional Ingredient in Gluten-Free Rice Crackers

1
Faculty of Technology Novi Sad, University of Novi Sad, Bulevar Cara Lazara 1, 21000 Novi Sad, Serbia
2
Institute of Food Technology in Novi Sad, University of Novi Sad, Bulevar Cara Lazara 1, 21000 Novi Sad, Serbia
*
Author to whom correspondence should be addressed.
Processes 2025, 13(3), 908; https://doi.org/10.3390/pr13030908
Submission received: 25 February 2025 / Revised: 6 March 2025 / Accepted: 13 March 2025 / Published: 19 March 2025
(This article belongs to the Special Issue Rheological Properties of Food Products)

Abstract

:
Technological issues with the production of gluten-free rice crackers with spirulina powder were examined in this work through their rheological, textural, color, sensory, and nutritional aspects. A part of gluten-free whole-grain rice flour was replaced with 5, 10, and 15% spirulina powder in an appropriate recipe for crackers. The rheological analysis presented obtained dough samples as viscoelastic systems with dominant elastic components (G′ > G″ and Tan δ = G″/G′ is less than 0). The addition of spirulina contributed to a softer dough consistency according to a statistically significant (p < 0.5) decrease of Newtonian viscosity during the creep phase for a maximum of 43.37%, compared to the control dough. The 10 and 15% quantities of spirulina powder led to a statistically significant (p < 0.5) increase in the viscoelastic parameter Jmax, which indicated a greater dough adaptability to stress. The textural determination of the dough pointed statistically significantly (p < 0.05) to decreased dough hardness and improved dough extensibility and confirmed all rheological measurements with high correlation coefficients, indicating good physical dough properties during processing. Spirulina certainly affected the change in the color of the dough from a yellow-white to intense green, which also had a significant impact on the sensory quality of the baked crackers. Many sensory properties of the crackers were improved by the addition of and increasing amounts of spirulina (appearance, brittleness, hardness, graininess, and stickiness). The results for the dough and for the final crackers pointed to very good technological aspects for the development of a gluten-free bakery product with high nutritional value, such as increased polyphenolic content (with the majority of catechins), protein, total dietary fibers, and mineral content compared to the control sample.

Graphical Abstract

1. Introduction

The growing demand for gluten-free foods is caused by a rising number of diagnosed celiac patients and consumers with protein allergies [1]. Celiac disease is an autoimmune disorder caused by a combination of environmental, genetic, and immunological factors which manifests as harmful effects from the protein in gluten, prolamin, which is associated with decreased digestion and absorption of nutrients, vitamins, and minerals in the gastrointestinal tract [2,3]. This protein causes inflammatory bowel disease and a variety of other side effects, such as malnutrition, diarrhea, growth retardation, anemia, and fatigue [1,2,3,4]. The European Union’s Commission Regulation mandates that food products intended for individuals with gluten intolerance must not contain more than 100 mg/kg (100 ppm) of gluten in their final form for consumers. Additionally, it specifies that products with a gluten content of up to 100 mg/kg can be labeled as “very low gluten”, while those containing no more than 20 mg/kg can be labeled as “gluten-free”. This regulation takes into account the varying degrees of gluten intolerance among individuals [4]. Celiac patients often struggle to find gluten-free meals outside the home. As a result, they rely on a diet consisting of packaged gluten-free products, such as snacks, biscuits, and crackers. There is a growing demand for an increased supply of gluten-free fine bakery products, which has led to the development of new bakery products with different alternative gluten-free raw materials, such as gluten-free flours (potato, rice, or corn flours) and starches, as well as different pseudocereals (amaranth, quinoa, and buckwheat) [5,6,7].
Crackers are a type of fine bakery product with flaky inner layers and low sugar content, moderate fat content, and low salt content [1,8]. The options for nutritional enrichment of crackers include the incorporation of different functional components such as dietary fiber or the application of different raw materials besides the usual wheat flour [9,10]. Different raw materials certainly may include rice flour because several significant properties of rice flour make it suitable for gluten-free products. It is nongluten flour, with a neutral taste, is colorless and hypoallergenic, and contains a high amount of easily digested carbohydrates [11].
An interesting functional food component is spirulina. Spirulina is a multicellular, filamentous cyanobacterium, i.e., a blue-green algae (Cyanobacteria) that belongs to the group of prokaryotic organisms [12], species Athrospira, commonly known as spirulina. The two most important types of spirulina are Spirulina maxima and Spirulina platensis [13]. As a nutritional food, spirulina contains significant amounts of micro and macronutrients. The species Spirulina (Arthrospira) platensis is cultivated worldwide and used as a dietary supplement. The chemical composition of spirulina includes 60–70% of protein, carbohydrates, vitamins E and C, and minerals such as iron, calcium, chromium, magnesium, sodium, zinc, manganese, phosphorus, potassium, and copper [14,15,16]. Spirulina biomass is a commercial source of various bioactive metabolites, including γ–linolenic acid and vitamin D. Essential fatty acids such as γ–linoleic acid (GLA) and pigments such as chlorophyll, phycocyanin, and β–carotene are present. With a protein content of up to 72% of dry biomass [17], the species S. platensis represents the richest source of protein in relation to all photosynthetic organisms [18]. The largest sources of plant proteins are about half of the amount contained in spirulina; for example, soy flour contains only about 36% of the protein content of spirulina. The nutritional value of protein is closely related to the quality of amino acids, their digestibility coefficient, and their biological value. Besides the significant amount of proteins, spirulina proteins are high-quality proteins [19,20]. Since all essential amino acids are present, which make up 47% of the total protein mass, spirulina proteins are complete from a qualitative point of view [14,15]. Most of the carbohydrates in spirulina are glycogen and rhamnose, two polysaccharides that are very easily absorbed. The vital substances in spirulina have high bioavailability, and they can be optimally absorbed without large losses [21,22,23,24]. Polyols such as glycerol, mannitol, and sorbitol also occur. It is characteristic that spirulina does not have cellulose in its cell wall, making it a suitable food for people with stomach problems (poor intestinal absorption) and geriatric patients. Spirulina has a high polyunsaturated fatty acids (PUFAs) content that makes up 1.5–2% of the total amount of lipids. In addition, it is rich in α–linoleic acid (36% of the total PUFAs), linoleic acid, stearidonic acid (ω–3 fatty acid, 18:4), arachidonic acid (ω–6 fatty acid, 20:4), eicosapentaenoic acid (ω–3 fatty acid, EPA, 20:5), and docosahexaenoic acid (ω–3 fatty acid, 22:6) [25]. Unlike other foods that are scarce sources of iron, spirulina contains a high level of iron, making it an important food against anemia, which is especially pronounced in pregnant women and the younger population. In comparison, cereals, which are ranked as one of the richest sources of iron, contain only 150–250 mg/kg, while spirulina contains up to five times more than that amount (580–1800 mg/kg) [19]. Spirulina has specific, relatively high concentrations of provitamin A, i.e., β–carotene [19,26]. Provitamin A consists of 80% of the carotenoids present in spirulina, while the rest are mainly fucoxanthin and cryptoxanthin [16,27]. The dry form of spirulina contains 50–190 mg/kg of vitamin E, a level which is comparable to wheat germ [16]. The most abundant photosynthetic pigment in spirulina is phycocyanin (blue pigment). This protein complex makes up about 14% of the total mass and is characterized by health benefits, including antioxidant, anti-inflammatory, anti-cancer, and hepatoprotective effects, etc. [28]. Chlorophyll (green pigment) and carotenoids (yellow, orange, or red pigment) are present in lower amounts. Chlorophyll is present in concentrations of about 6.0–20.0 mg/g of dry weight. This green pigment is not only used as a color but also as a raw material with potential health benefits. Its antimutagenic, chemo-preventive, anti-inflammatory, and antimicrobial properties, as well as the potential application of chlorophyll as a photosensitizer, have recently been reported [29,30]. The pigment phycocyanin has a dual function in food and biologically active supplements as a colorant and immunostimulatory. It is considered better than other natural blue colors (gardenia or indigo) because it gives products a lighter blue color [31].
Spirulina is often used for human nutrition in the form of powder, tablets, capsules, and extracts. The amount of spirulina that is usually incorporated into food products depends on the food matrix because the impact of microalgae addition to different food matrixes reflects their interactions with other food components such as biopolymers (proteins and polysaccharides) [32]. It is important to emphasize that high biomass concentrations can lead to technological limitations, such as a limited volume of dough after fermentation in the production of bakery products caused by high amounts of the spirulina proteins that compete with flour proteins for water [33] or a reduced expansion of extrudates enriched with spirulina because of increased protein content, since protein and starch compete for water and, in this case, starch gelatinization is diminished or delayed [34]. There may also be a low acceptance by consumers because of spirulina biomass’s intensive and specific earthy odor, flavor, and color [35]. Acceptance of food products by consumers may be a significant challenge during the development of food products fortified with spirulina. Despite the numerous benefits of spirulina consumption, resistance may occur to their acceptance, especially in diets that do not traditionally include algae [36,37]. The distinctive sensory attributes of spirulina, such as a green or blue color and an earthy, fishy taste, could impact consumer preference, particularly among children [38]. Therefore, when incorporating algae such as spirulina into food products, special attention must be given to sensory optimization, particularly if the food products are aimed at children [36]. Baked goods, such as bread and cookies, are promising materials for fortification with spirulina, mainly because they are consumed in a variety of colors, shapes, and flavors. Similarly, cookies are a popular and convenient baked product that all age groups enjoy, but particularly young people. The inclusion of ingredients like flour, sugar, and eggs in these baked goods helps to mask and balance the distinct flavor and color of spirulina. As a result, microalgae can be added in higher concentrations, maximizing their nutritional benefits. In contrast, incorporating spirulina, or algae generally, into dairy products such as yogurt and ice cream presents greater challenges. Sensory factors, including the greenish hue and fish-like taste, are more pronounced and noticeable in these products, making their acceptance more difficult [35,36,37,38,39].
Spirulina has a high potential for incorporation into food products such as beverages, emulsions [35], bakery products [20,33,40], milk and meat products, confectionery products, and others [16,18,41]. Some of the health benefits of using spirulina in the diet are antiviral, antioxidant, antibacterial, antidiabetic, anti-cancer, anti-inflammatory, and immunomodulatory effects, as well as detoxification of the organism [16,41].
The aim of this work was to perceive technological issues involved in the possible production of rice gluten-free crackers with spirulina powder by examining the rheological, textural, sensory, and nutritional aspects. A part of gluten-free whole-grain rice flour was replaced with different amounts of spirulina powder, and the resulting flour/spirulina blends were used in appropriate recipes for cracker production. The development of gluten-free dough was observed through the rheological and textural characteristics of the dough. Change in the color of the dough was also analyzed due to the specific green-blue color of the spirulina powder. Obtained crackers were examined by analyzing color, textural properties, sensory and nutritional features, the total polyphenolic content, and antioxidant capacity.

2. Materials and Methods

2.1. Materials

The materials for experimental work were: whole-grain rice flour obtained from a local producer and dried organic form of Spirulina spp., which is a commercial product (supplier “SuperFood”, Belgrade, Serbia, country of origin China, lot number O SP–JY–160427). Also, the tailor-made vegetable fat for fine bakery products was used, obtained from a local producer (“Dijamant”, Zrenjanin, Serbia). Powdered sugar (sugar beet powdered sugar, Dr. Oetker, Simanovci, Serbia), salt (NaCl, p.a. > 99.5%, Centrohem, Stara Pazova, Serbia), sodium bicarbonate (Na2CO3, p.a. > 99%, Centrohem, Serbia), and ammonium bicarbonate (NH4HCO3, p.a. > 99%, Centrohem, Stara Pazova, Serbia) were applied. Sunflower lecithin Topcithin SF (Cargill, Milan, Italy) was used in the role of emulsifier.

2.2. Plan of the Experiment

Control samples of the crackers were made of whole-grain rice flour as the basic material according to the appropriate recipe, using an adequate baking method.
Other samples of crackers were made by replacing part of the whole-grain rice flour with spirulina powder in different amounts of 5, 10, and 15%. The criteria for the applied spirulina amount were from the literature data according to references [42,43,44,45,46,47] and preliminary trial batches, which provided compact dough.
The dough for the crackers was analyzed with the aim of determining the influence of spirulina powder addition on the viscoelastic, textural, and color properties of the dough and its behavior during production. The properties of the crackers obtained after baking were analyzed using adequate physical, chemical, and sensory methods.
Obtained experimental data were analyzed by the ANOVA statistical method with a 5% level of significance, and average multiple comparisons were made by post-hoc Tukey’s range test using TIBCO Statistica 14.0.0 software (Santa Clara, CA, USA). Also, the linear relationship between individual variables was determined and expressed by the Pearson correlation coefficient, r, using the statistical method of linear correlation.

2.3. Analysis of Chemical Composition

The chemical composition of the raw materials used, the whole-grain rice flour (WGRF), and the spirulina powder (SP) were determined according to the AOAC methods [48,49]—moisture (No. 926.5), protein (No. 950.36), fat (No. 935.38), ash (No. 930.22), total dietary fiber (No. 958.29), and carbohydrates [50].

2.4. Baking Method

The crackers were baked using an adequate recipe [51,52]. The 300 g of dough for the crackers was prepared according the following formulation: 200 g of whole-grain rice flour or mixture of rice flour and spirulina powder, 50 g of vegetable fat, 6 g of powdered sugar, 1.2 g of sodium bicarbonate (NaHCO3), 0.8 g of ammonium bicarbonate (NH4HCO3), 7 g of sodium chloride (NaCl), and 0.3 g of lecithin. The amount of water was calculated in relation to the water content of the flour blends in order to obtain dough samples with 27% moisture content. The raw materials were mixed in a mixer (ZD2245, Stephan–Werke GmbH and Co., Hamelin, Germany). The total amount of flour/blends (200 g) was first mixed in a mixer for 0.5 min. Mixing was maintained for 5.5 min with the addition of vegetable fat and sugar. Then, the remaining powdered material (NaCl, NaHCO3, and NH4HCO3) previously dissolved in a calculated amount of distilled water was added, and mixing was extended for 15 min. The total mixing time was 20 min. After mixing, the dough sample was allowed to rest for 30 min in a covered bowl and then was sheeted between two cylinders of laminator (Marchand LA4–500, Materiel modern Marchand, Rueil—Malmaison, France). The gap settings between the cylinders were 15, 10, 7 and 4 mm, with a 15 s resting period between each passage. After sheeting, the dough was cut using a stainless mold for crackers and baked for 8 min at 195 °C in a laboratory oven. After baking, the crackers were cooled for 30 min on a baking sheet at ambient conditions.

2.5. Determination of Color

The color of the dough and obtained crackers was determined using a Minolta Chroma Meter CR–400 (Konica Minolta Inc., Osaka, Japan), with an 8 mm aperture on the measuring head, a 2° standard observer angle, and a standard CR–A33b measuring nozzle (Konica Minolta Inc., Osaka, Japan). The chroma meter was calibrated using a Minolta calibration plate (no. 11333090, Y = 92.9, x = 0.3159, y = 0.3322). The color parameters of the samples are expressed in the CIE L* a* b* system [53,54]. This system is based on three coordinates through which the color of the sample is defined: L* (color lightness), a* (amount of red color (+a*) or green color (−a*)), and b* (amount of yellow color (+b*) or blue color (−b*)).

2.6. Rheological Determination of the Dough

The rheological behavior of the dough samples was observed by dynamic oscillatory measurements and creep and recovery testing. The rotation viscometer HAAKE RheoStress RS600 (Thermo Electron Corporation, Karlsruhe, Germany) was used with parallel-plate accessories (PP35 Ti L, titanium serrated plate with 35 mm diameter, Thermo Electron Corporation, Karlsruhe, Germany) with a gap of 2 mm. The dough sample was placed between the plates, and after adjustment to the 2 mm gap, the excess dough was removed. The exposed sample surface was covered with paraffin oil to prevent moisture loss. All rheological measurements were performed at 25 °C after a resting period of 180 s [55,56].
Dynamic oscillatory measurements included a frequency sweep test conducted within the linear viscoelastic region (LVE). To define the LVE region, a strain sweep test was performed with a strain range of 1–100 Pa and a constant frequency of 1 Hz. A constant shear stress value defined within the LVE was 30 Pa and was used further during observation of the elastic (G′) and viscous modulus (G″) of the dough samples versus increased frequency from 1 to 10 Hz. The results were expressed as value Tan δ = G″/G′ [57].
A creep and recovery test was conducted in the LVE region in which the amplitude of deformation proportionally corresponds to the amplitude of the applied shear stress [58,59,60]. Constant stress (σ = 30 Pa) was applied to the sample, and the deformations over time were observed. The stress period was 150 s, then the stress was removed, and the system recovery period of 300 s was observed. During the recovery period, the dough sample should regain part of its original structure. The results of the creep and recovery analysis can be presented by the amount of deformation as a function of time, which is the value of the creep compliance (J), Equation (1).
J = f t = γ / σ
where γ is shear strain, and σ is shear stress. Obtained creep and recovery curves were analyzed using the four-element Burger’s model described by Equation (2) for the creep phase and Equation (3) for the recovery phase.
J t = J 0 + J 1 · 1 e x p t / λ + t / η 0
J t = J m a x J 0 J 1 · 1 e x p t / λ
where J0 (1/Pa) represents the instantaneous compliance, J1 (1/Pa) is the retarded elastic compliance or viscoelastic compliance, Jmax (1/Pa) is maximum compliance, λ (s) is the mean retardation time, and η0 (Pas) is Newtonian viscosity. The recovery of the system is also described by the contribution of elastic (Je) and viscous (Jv) deformations to the maximum compliance (Jmax). The amount of relative elastic deformation Je/Jmax (%) is a part of the structure that is recovered after removing the stress, and the amount of relative viscous deformation Jv/Jmax (%) is the part of the structure that was not recovered after removing the stress, the amount of lost deformation [57,58,59,60].

2.7. Textural Determination

The extensibility of dough samples was determined by micro-method Kieffer Dough and Gluten Extensibility using the TA.HD plus Texture Analyzer (Stable Micro Systems, Godalming, Surrey, UK) [61]. During these measurements, a hook stretches the dough, and the stretching is performed until the elastic limit for the selected magnitude of force is reached, when the dough breaks. The capacity of the measuring cell used was 5 kg [62,63].
Other textural parameters, such as the hardness of the dough samples, were also determined by the textural method Measurement of the hardness of biscuit dough by penetrating with a cylinder probe [54,61,64]. Measuring accessory P/6, a cylinder with a diameter of 6 mm, penetrates up to 2 mm into the dough placed on a solid metal platform (Heavy Duty Platform HDP/90, Stable Micro Systems, Godalming, Surrey, UK). The maximum force is registered at a depth of 2 mm and represents the hardness of the dough.
The hardness of the obtained crackers was determined by Texture Analyzer TA.HD Plus (Stable Micro systems, Godalming, UK), also using textural method Hardness measurement of biscuits by cutting, provided by manufacturer [54,60,61]. The measurements were performed in three replicates using a knife edge with a slotted insert (HDP/BS) and a 25 kg load cell.

2.8. Sensory Analysis of Crackers

Sensory evaluation of the obtained crackers was performed according to quantitative descriptive analysis (QDA) 24 h after the preparation of samples. In the sensory evaluation, detailed information about the panel of trained panelists who volunteered to participate in the evaluation was included. All panelists were fully informed of the study’s objectives, procedures, potential hazards, and benefits, and they were aware of their right to withdraw at any time. Panelists with allergies or other dietary restrictions were excluded to avoid potential health risks, and their personal information was kept confidential.
The conducted experiments complied with the Helsinki Declaration of 1975, as revised in 2013.
Adequate conditions for the product’s evaluation were provided based on ISO standards. Coded samples were evaluated in an appropriate ambiance [65] by a panel of 10 trained experts: four men and six women, all food technologists [66]. The evaluators developed and adopted a final list of 10 significant sensory attributes to be used in the examination [67]. The intensity of each attribute was indicated on a seven-point intensity scale [67]. The evaluated attributes were color (color intensity on the surface: from 1—extremely light to 7—extremely dark), surface appearance (number of cracks on the surface of the crackers: from 1—many to 7—none), shape (from 1–vary deformed to 7–perfect), hardness (the ease of breaking the sample into two parts: from 1—extremely soft to 7—extremely hard), brittleness (after the first bite, the product remains in large pieces or crumbs: from 1—extremely crumbled to 7—not crumbled), granularity (the proportion of small solids between the teeth during chewing: from 1—many to 7—none), stickiness (the product sticks to the teeth during chewing: 1–very sticky to 7–non-sticky); taste and smell (from 1—bad, foreign to 7—fine, characteristic), and overall acceptability (1–extremely bad to 7–extremely good). Each evaluator assessed five samples per session.

2.9. Total Polyphenolic Contents

The total polyphenolic contents were determined spectrophotometrically by the Folin–Ciocalteau method adapted to the microscale [68,69]. Each well contained a mixture of 15 μL of sample, 170 μL of distilled water, 12 μL of the Folin–Ciocalteu’s reagent, and 30 μL of 20% (w/v) sodium carbonate. The prepared microplate was incubated for 1 h, and the absorbances were measured at 750 nm. Distilled water was used as the blank. Results were expressed as mg gallic acid equivalents (GAE) per 100 g [68,69,70].

2.10. HPLC Analysis of Phenolic Compounds

Chromatograms were recorded using different wavelengths for individual compounds: 280 nm for hydroxybenzoic acids, ellagic acid, catechin, and epicatechin; 320 nm for hydroxycinnamic acids; and 360 nm for flavonoids. Separation was performed on a Luna C-18 RP column, 5 μm, 250 mm × 4.6 mm, with a C18 guard column, 4 mm × 30 mm (both from Phenomenex, Torrance, CA, USA). The column was operated at 30 °C. Two mobile phases, A (acetonitrile) and B (1% formic acid), were used at flow rates of 1 mL min−1 with the following gradient profile: 0–10 min from 10 to 25% B, 10–20 min linear rise up to 60% B, and 20–30 min linear rise up to 70% B, followed by a 10 min reverse to initial 10% B with an additional 5 min of equilibration time.

2.11. Antioxidant Capacity Tests

2.11.1. DPPH Assay

The assay was performed spectrophotometrically in a 96-well microplate reader, according to [71]. Briefly, a 250 μL DPPH solution in methanol (0.89 mM) was mixed with 10 μL of extract in a microplate well. Absorbance was measured at 515 nm after 50 min incubation in the dark at an ambient temperature. Methanol was used as a blank. DPPH radical scavenging activity values were calculated using the following equation: DPPH = [(Acontrol − Asample)/Acontrol] × 100, where Acontrol is the absorbance of the blank, and Asample is the absorbance of the extract sample. The calibration curve was made with Trolox, and results were expressed as μmol of Trolox equivalents per 100 g (μmolTE/100 g) [71].

2.11.2. Reducing Power (RP)

Reducing power was determined spectrophotometrically by the method of Oyaizu [72], adapted for a 96-well microplate. In brief, a 25 μL sample or 25 μL water (blank test), 25 μL sodium phosphate buffer (pH = 6.6), and 25 μL of 1% potassium iron(III) cyanide were mixed and incubated in a water bath for 20 min at 50 °C. After cooling, 25 μL of 10% trichloroacetic acid was added, and solutions were centrifuged at 2470× g for 10 min. After centrifugation, 50 μL of supernatant was mixed with 50 μL of distilled water and 10 μL of 0.1% iron(III) chloride in the microplate. Absorbances were measured immediately at 700 nm. The calibration curve was made with Trolox, and results were expressed as μmol of Trolox equivalents per 100 g (μmolTE/100 g) [72].

2.11.3. ABTS●+ Method

Antioxidant capacity was evaluated spectrophotometrically employing the modified ABTS●+ in a 96-well microplate reader, according to the method of Mena et al. [73]. The absorbances of 250 μL activated ABTS●+ (with MnO2), before and 35 min (incubated at 25 °C) after the addition of 2 μL of extract, were measured at 414 nm. Water was used as a blank. The calibration curve was made with Trolox and results were expressed as μmol of Trolox equivalents per 100 g (μmolTE/100 g) [73].

3. Results and Discussion

3.1. Chemical Composition of Raw Materials

The obtained chemical composition of whole-grain rice flour, presented in Table 1, is in accordance with the literature data [74,75,76], and it shows that the carbohydrate content is highest, which is predominantly rice starch [77]. Rice flour compositions generally rely on rice varieties [76,78]. The contents of ash, crude protein, crude fat, and crude fibers in whole-grain rice flour are relatively high because of the greater amount of outer layers compared to white rice flour. Moreover, higher values of those components contribute to a lower carbohydrate content [76,77]. Likewise, the proximate composition of rice flour could be affected by the conditions of the processing [74]. The protein content of 6.44 ± 0.01% is also noticeable.
Spirulina powder has a specifically high protein content (66.77 ± 1.05%) and thus is generally a very significant source of protein [79]. Qualitatively, spirulina provides complete proteins as it contains the full range of essential amino acids which is 47% of total protein weight [14,79]. Also, spirulina powder has a slightly higher content of total dietary fibers than whole-grain rice flour; thus both can significantly contribute to the total dietary fiber content of the final product. Based on such chemical composition, both ingredients, whole-grain rice flour and spirulina powder, are suitable raw materials for the production of nutritionally enriched crackers.

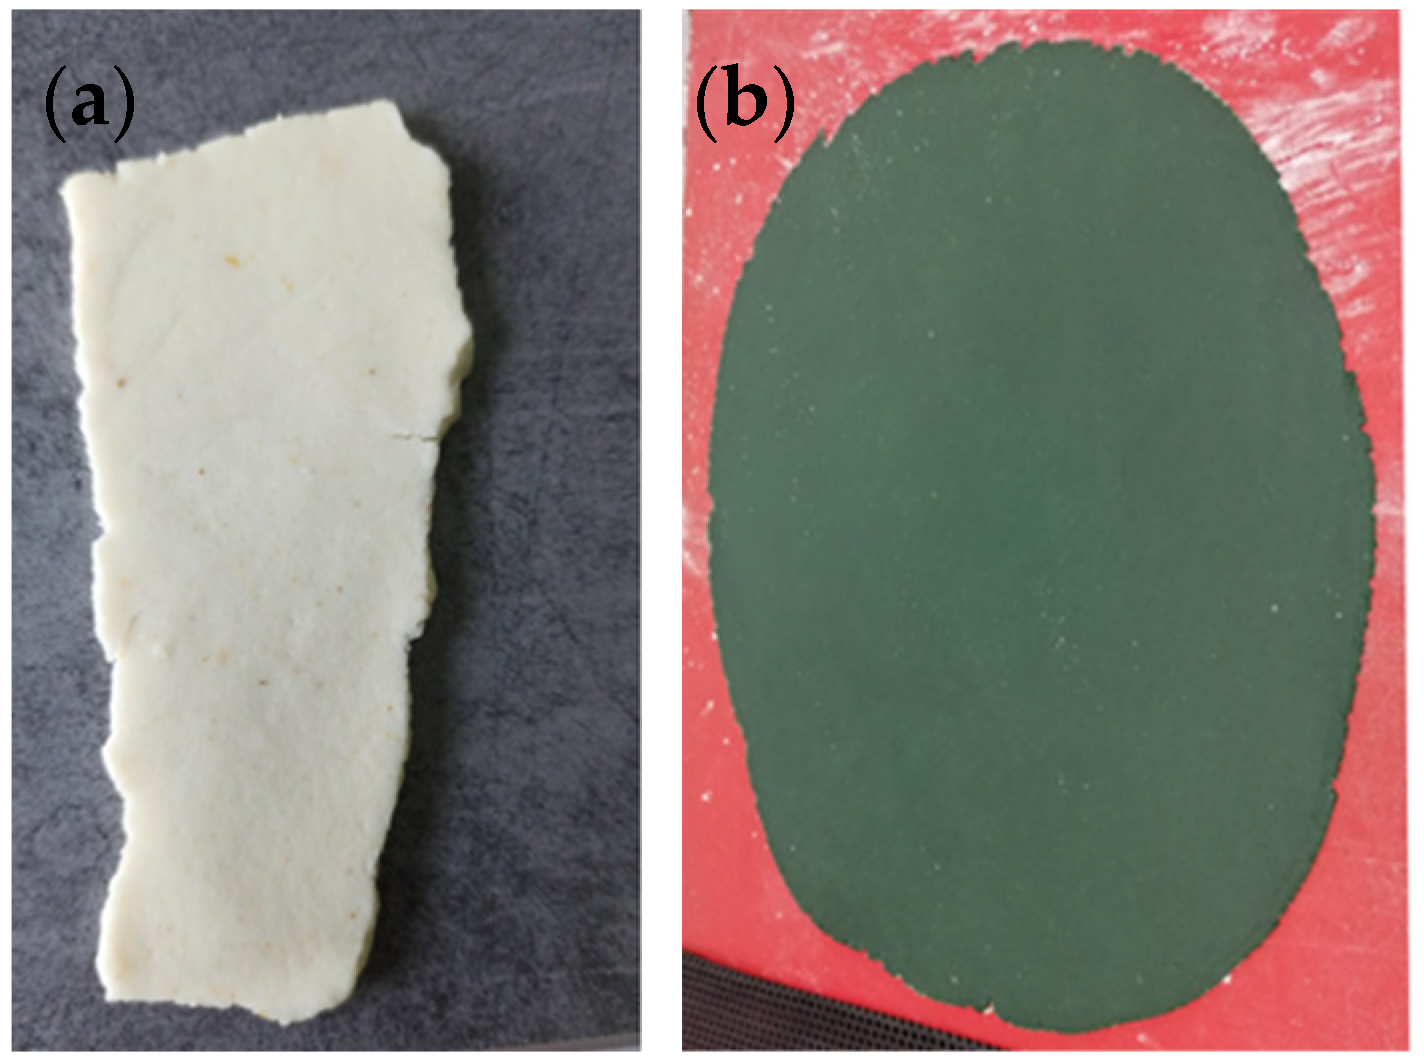
3.2. Color of Dough for Crackers

The colors of the dough samples were measured after mixing and are shown in Table 2.
Based on the presented results of color determination, a clear difference in the color of the dough without and with added spirulina can be seen (Figure 1). The color of rice flour dough is dominantly white. Also, a small amount of red tone and a larger amount of yellow color are present, as expected in relation to the applied whole-grain rice flour. However, due to the green-blue color of the spirulina powder, the color parameters for dough samples with spirulina changed significantly. The negative sign of the color parameters a* and b* indicate the presence of green and blue in the dough.
The color lightness of the control rice dough is significantly higher than the color of other samples with spirulina. Also, the color lightness of the dough samples with spirulina decreased with an increase in spirulina content. The same changes were observed for color parameters a* and b*. A similar observation was reported by Onacik-Gür et al. [80] for cookie dough with an increasing content of microalgae powder. They showed that the dough, as well as baked products, were becoming more green-blue with an increasing content of spirulina in the recipe.

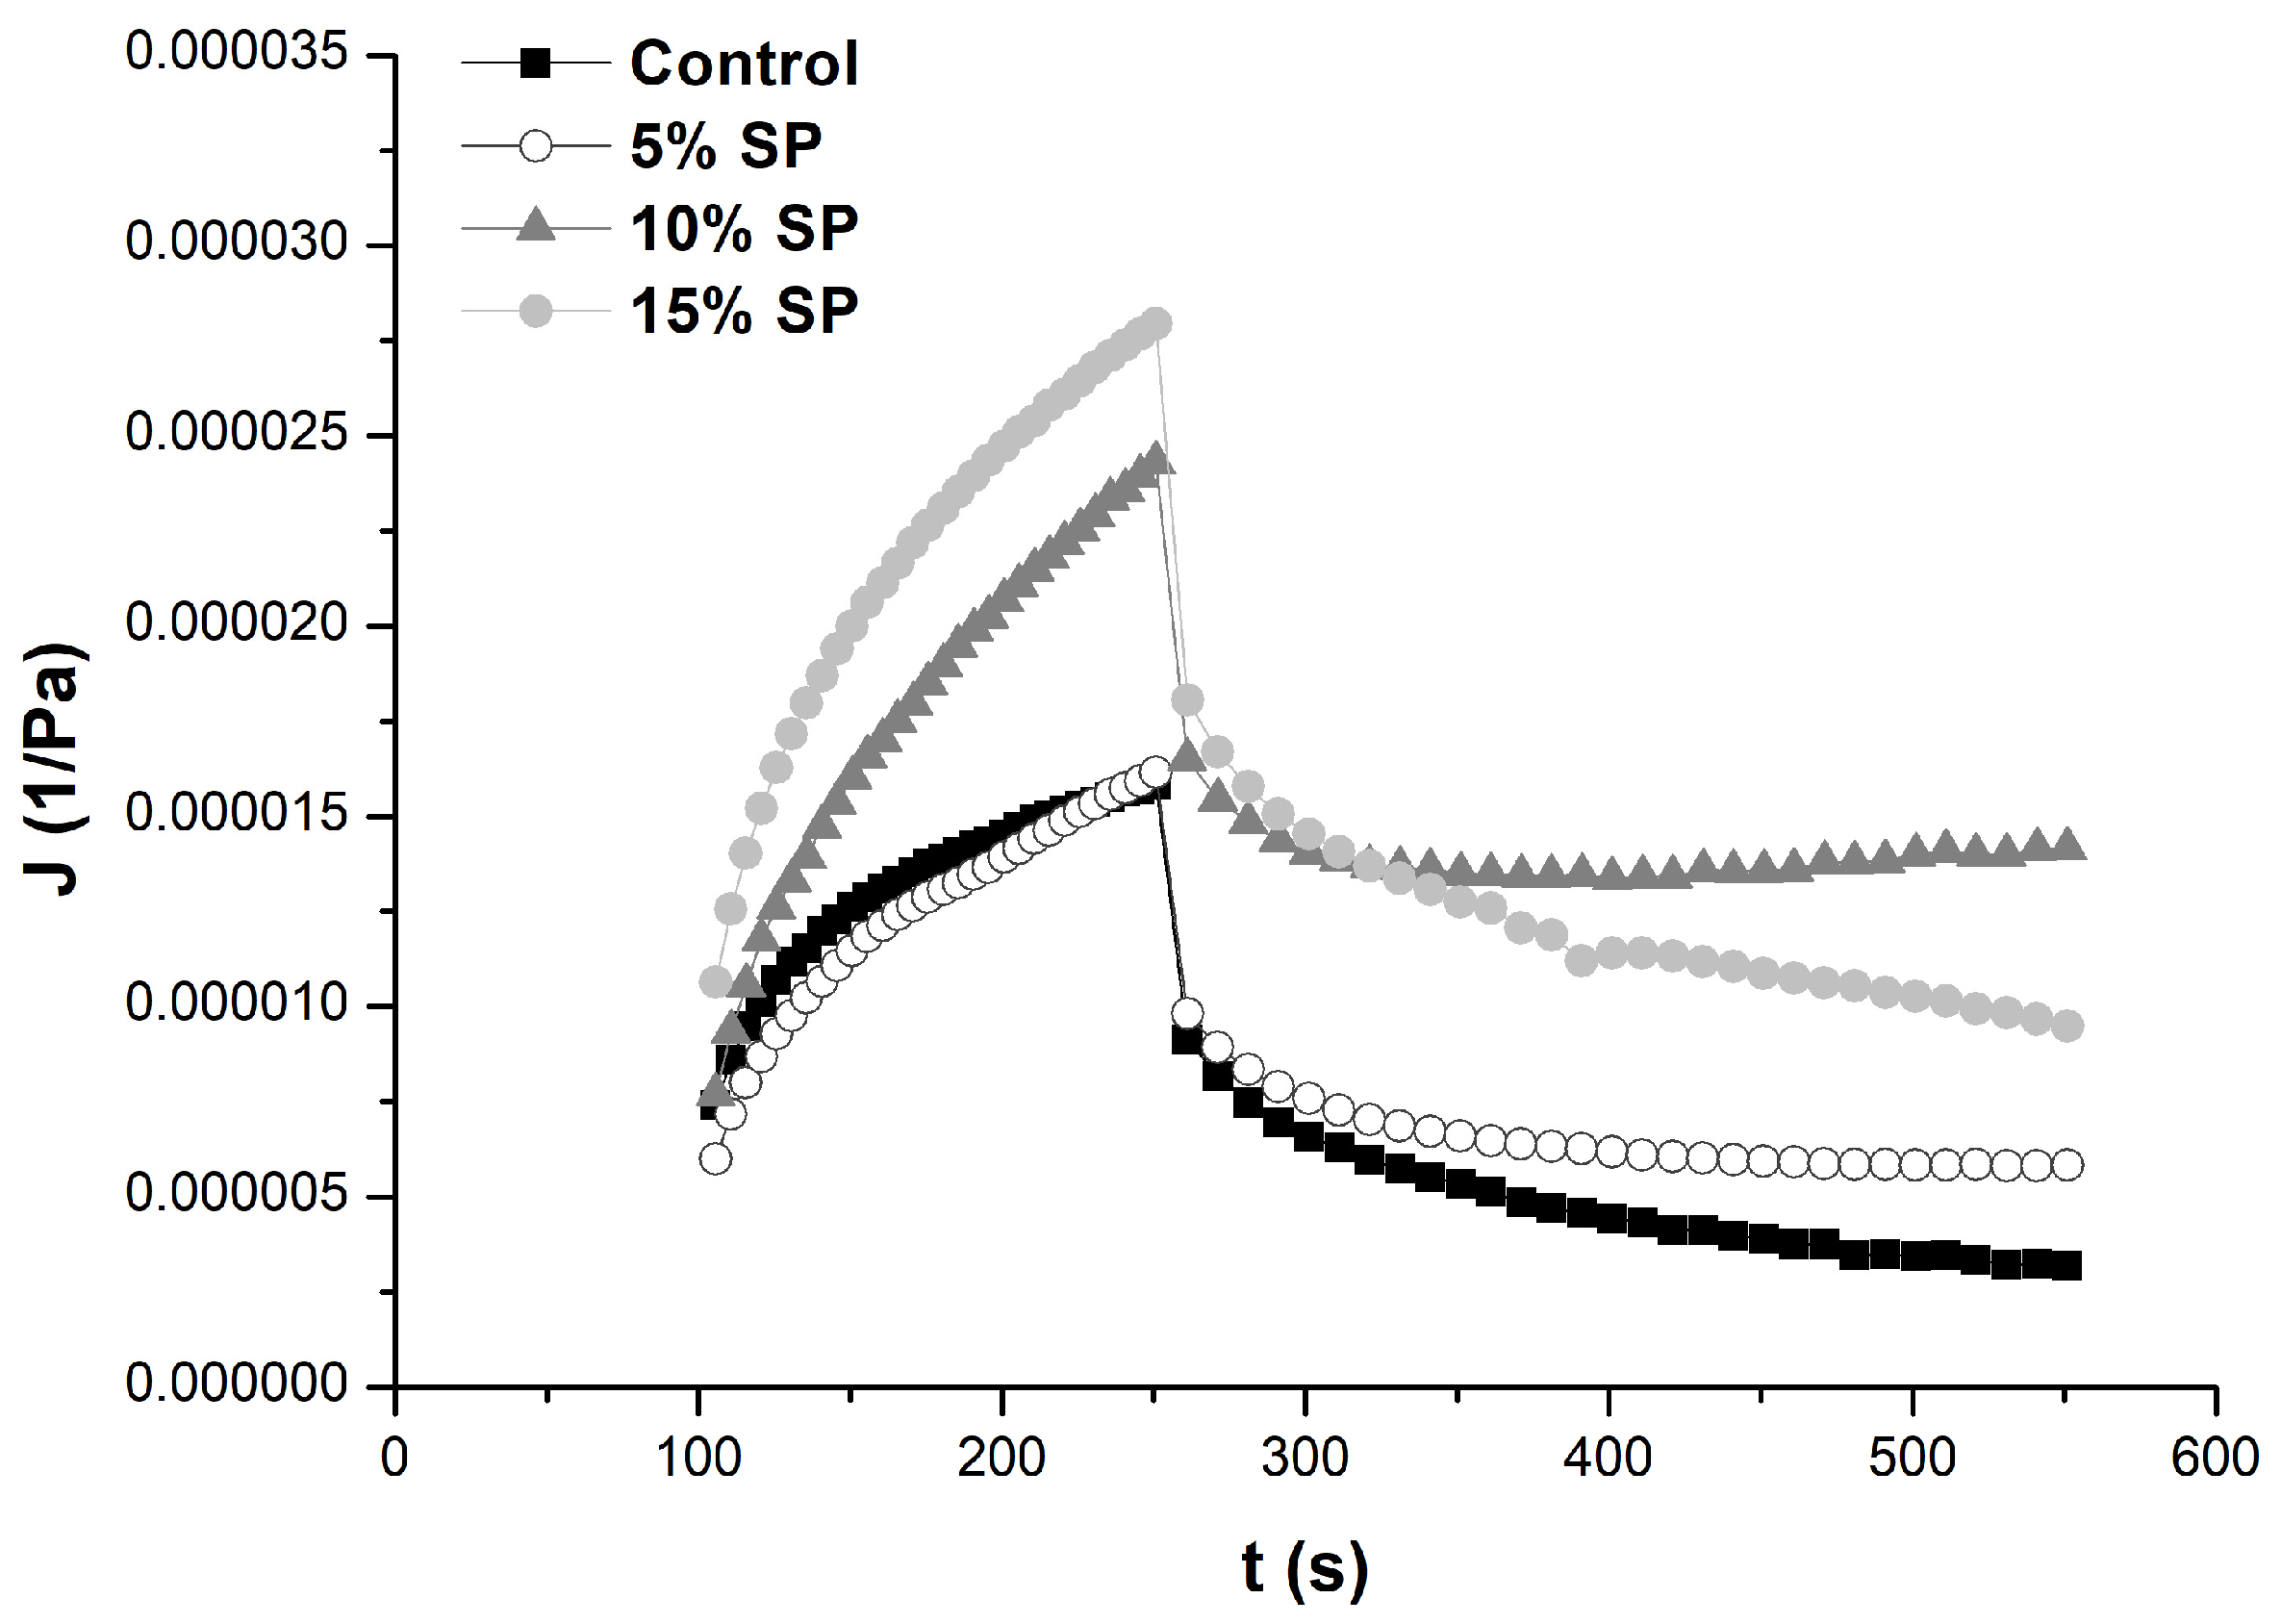
3.3. Rheological Properties of Dough

The rheological studies on raw dough offer valuable insights into the relationship among its composition, structure, and rheological properties. By analyzing the ratio of elastic to viscous characteristics, pastry and baking technologists can accurately model dough behavior and achieve optimal results during reformulation and new product development [81].
Dynamic oscillatory measurements showed that all observed dough samples are viscoelastic systems from the aspect of rheological observation. An increase in elastic modulus and viscous modulus with increasing frequency was observed for all dough samples (Figure 2a). Also, the elastic modulus is dominant over the viscous one, which indicates the pronounced elastic nature of the dough, which is a common and desirable rheological property of the dough for further processing and manipulation of the dough [82,83]. A similar observation was made for the dough of cereal-based snacks enriched with microalgae (chlorella and spirulina) [84]. A frequency sweep test for these dough samples showed that the elastic modulus (G′) was higher than the viscous modulus (G″) for all the frequency ranges studied in the dough with spirulina and chlorella biomass addition. This indicated a solid, elastic-like behavior of all studied dough samples, which is an important rheological parameter. Also, both G′ and G″ modulus progressively increased with the increasing angle frequency in all samples [84], as with the samples observed in this work.
The ratio between viscous elastic modules, the value of viscoelastic parameter Tan δ = G″/G′ is less than zero and ranges from 0.216 to 0.304 (Figure 2b). Compared to the control dough sample, a slight increase in the value of the parameter Tan δ is noticeable with the addition of spirulina powder corresponding with the increase in its amount in the dough. Thus, the difference between the modulus of elasticity and the modulus of viscosity was lower with the increased amount of spirulina powder, which is a consequence of a slight softening of the dough consistency. Spirulina is known to influence the starch gelatinization process due to its composition, which consists of polysaccharides, considering its origin and quantity [85]. Additionally, factors such as particle size, distribution, morphology, and hardness also play a role in this process [42].
Presented creep and recovery curves in Figure 3 were fitted to equations of Burger’s model. The high agreement with the theoretical creep and recovery model was confirmed by the high values of the coefficients of determination R2, which ranged from 0.9463 to 0.9993 (Table 3).
The influence of the addition of different amounts of spirulina powder on the viscoelastic behavior of the dough samples was observed by creep and recovery parameters, such as the maximum creep compliance Jmax and Newtonian viscosity η0, as presented in Figure 4a,b. The quantities of 10 and 15% spirulina powder led to a statistically significant (p < 0.5) increase in viscoelastic parameter Jmax compared to the control dough. The values of this rheological parameter increased with an increase in the proportion of spirulina in the dough composition (Figure 4a). This indicates a decrease in the stiffness of the dough system with the addition of spirulina and an increase in its proportion in the dough. Thus, the compliance of the dough to the applied stress was enhanced.
On the other hand, the influence of spirulina was confirmed by decreasing the Newtonian viscosity. A statistically significant (p < 0.5) decrease in Newtonian viscosity during the creep phase (applied stress period) was observed with the addition of 10 and 15% of spirulina powder. Viscosity was reduced to 34.91% and 43.37% compared to the control dough. Decreases in Newtonian viscosity among dough samples ranged from 2.083 to 33.53% with increasing quantities of spirulina (Figure 4b).
Dough for crackers is considered a solid mixture of hydrated flour and lipids as the main components. Depending on flour composition, proteins and starches determine its structure, texture, and rheology behavior. The main factors affecting the rheology properties of the dough are the moisture content and water mobility, which are greatly influenced by the interaction with hydroxyl groups present in the dough matrix [86]. Batista et al. [32] noted that large particles of spirulina microalgae could discontinue dough networks, resulting in a softer structure. Spirulina is a cyanobacterium with a lack of rigid cell walls, which increases its water absorption ability, mainly by its proteinaceous cellular components [86,87,88]. The protein molecules of spirulina, which are dominant in spirulina’s structure (Table 1), have a hydrophilic property and they may compete for water binding sites with starch in rice flour [32,86]. That influence on the dough network leads to a softer, more gel-like structure [83,86]. That influence is not necessarily a negative influence on dough’s physical properties, especially for very strong and low-flexibility dough.
The amount of residual deformations in the dough after the recovery period, which enables partial recovery of the dough, is also relatively high. The amount of the elastic component ranges from 43.95 to 59.94% (Table 3). This means that all dough samples have a moderate ability to return to their original state, which indicates a high degree of dough flexibility and adaptability to applied stress without cracking or tearing during formation, lamination, and processing [87,88,89]. The contribution of spirulina to more flexible rheological properties of dough for crackers is welcome considering the non-gluten nature of whole-grain rice flour, which does not have the ability to network like the gluten in wheat flour [90,91,92].

3.4. Textural Properties of Dough

Textural analysis of the dough samples provided textural parameters such as dough hardness, resistance determined during dough stretching, and dough extensibility, which are shown in Table 4.
Observing the hardness of the dough, there was a noticeable statistically significant (p < 0.05) decrease compared to the control dough. With an increase in the amount of spirulina, this effect was additionally expressed. A statistically significant (p < 0.05) decrease in dough hardness was from 5.50 to 6.52% between dough samples with spirulina. This contribution of spirulina to dough hardness was in accordance with the results of the rheological analysis and confirmed that the addition of spirulina to the dough composition contributed to the softness of the dough consistency.
The dough extensibility was statistically significantly (p < 0.05) increased with the addition of spirulina compared to the control, in the amount of two to three times more than the extensibility of the control dough. A rising quantity of spirulina, from 5 to 15%, also statistically significant (p < 0.05), contributed to this effect. The extensibility between samples with spirulina increased by 36.53% and 16.99%, respectively. Marzec et al. [81] claim that the combination of microalgae with whole-grain flour (i.e., spelt flour) creates a dough with enhanced stability, elasticity, and extensibility compared to a wheat flour dough with microalgae.
Correlation analysis confirmed a strong relation between rheological and textural parameters according to relatively high correlation coefficients, as presented in Table 5. A higher ratio of viscous and elastic modulus, value of Tan δ, was in high negative correlation (r = −0.9213) with lower dough hardness because the dough had low viscosity η0 during applied stress (r = −0.8445). The increased resistance to applied stress and the extensibility of the dough pointed to increased and desired compliance of the dough during applied stress (r = 0.7813; r = 0.7610), which indicates good physical properties of dough during processing.

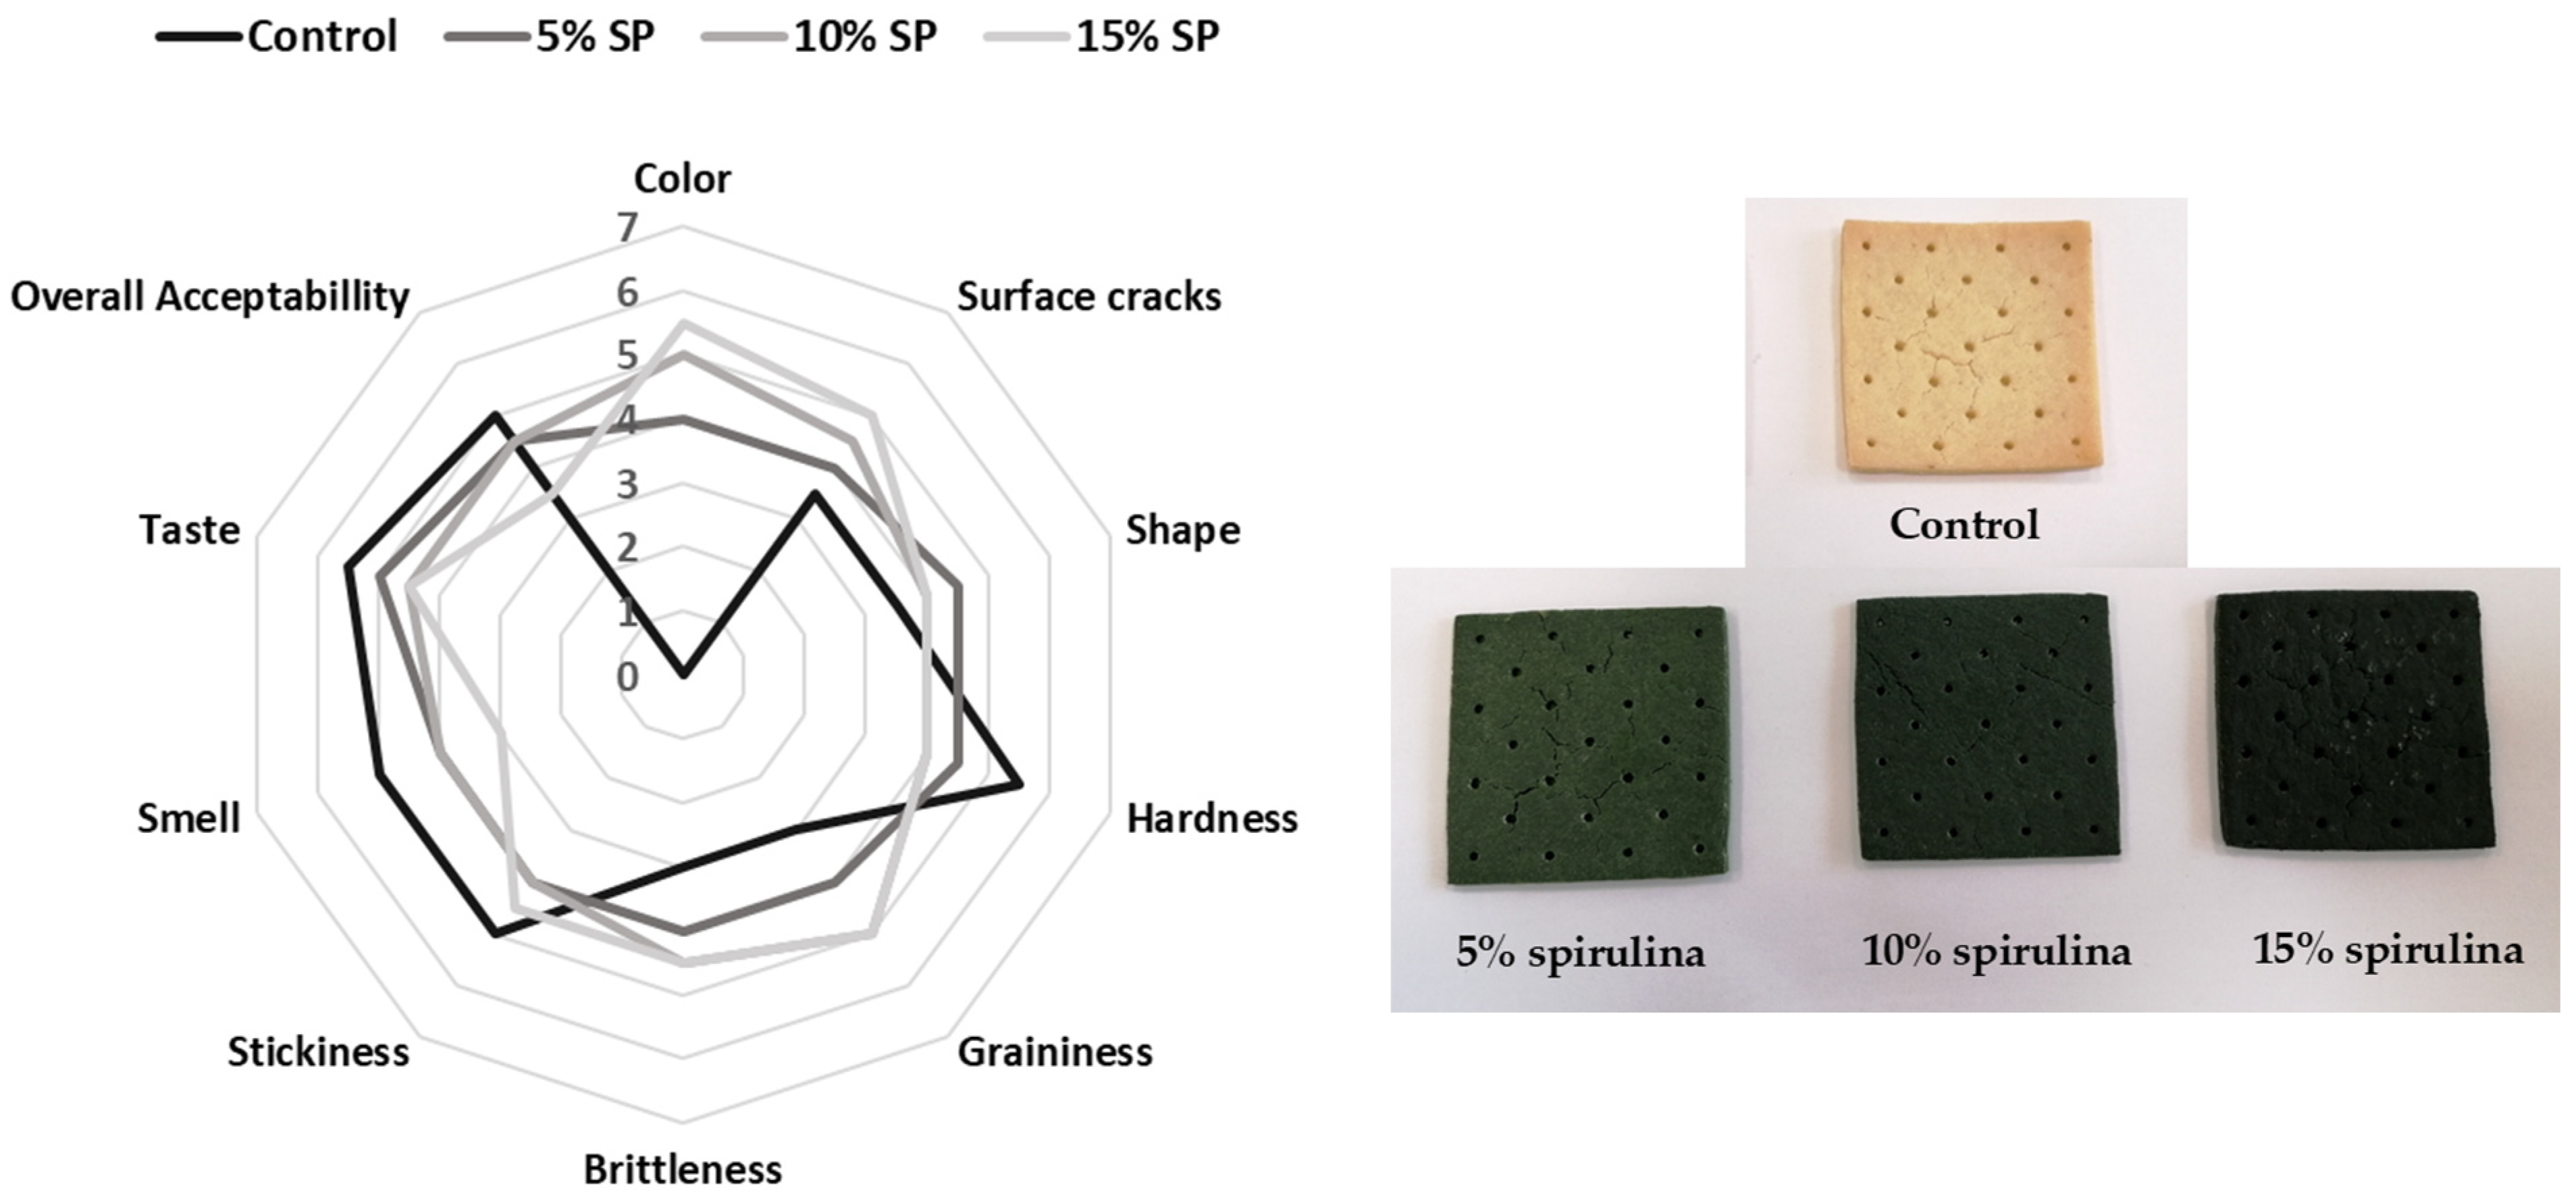
3.5. Sensory Evaluation of Crackers

Based on the sensory evaluation of the obtained crackers, the control samples had high overall acceptability, thanks to the good specific taste of whole-grain rice flour. Also, rice flour led to brittleness and glassy fracture of crackers. The samples were also characterized by expressed graininess and stickiness during consumption. The main sensory differentiation between crackers samples was certainly their color. Specifically, the dark blue-green color of the spirulina powder contributed to the dark green color of the crackers. Generally, the increase in the dough’s and final bakery products’ coloration depends on the presence of pigments in microalgal biomass, particularly the chlorophyll content that characterizes green microalgae. The darkening that was observed in gluten-free bakery products with microalgae biomass [92] and that was accentuated by the degradation of microalgae pigments can be considered a positive impact, since gluten-free bakery products are generally characterized by a poor color compared with gluten-containing goods [92].
The instrumentally determined color of the obtained crackers is presented in Table 6.
The control sample of crackers had a pronounced amount of yellow color and a slight amount of red color (positive values of a* and b* color parameters), while the samples of crackers with spirulina had very close amounts of green and blue color (negative values of these color parameters). The lightness of the cracker samples was statistically significantly reduced (p < 0.05), as expected according to the color parameters of the dough. Increased amounts of spirulina also statistically significantly (p < 0.05) contributed to this influence. It is interesting that amounts of green and blue color were reduced with a higher proportion of spirulina in the cracker composition, but because of the simultaneous reduction of the lightness, observed samples seemed to be more black. This observation is in accordance with other investigations of cookies with added spirulina up to 4%, in which pigments (phycocyanin and chlorophyll) cause a green-blue color and a noticeable reduction in lightness, making the cookies appear darker [93]. Generally, the color of crackers is strongly and significantly dependent on the spirulina content in the recipe [80]. Increasing the incorporation of Arthrospira platensis decreased the lightness of the crackers (dark green) [94], which is in agreement with other previous studies [95,96]. The statistical correlation of instrumentally determined color parameters and the visually evaluated color of the crackers showed high correlation coefficients, as seen in Table 7.
The visually evaluated color of the crackers had a high negative correlation with instrumentally determined lightness and the amount of blue color. The color of the crackers was more intensive and darker with a reduction in lightness and the amount of blue color, which was contributed by an increase in the proportion of spirulina in the crackers.
The addition of spirulina powder also added more softness to the crackers, according to the reduced hardness of the cracker samples compared to the control sample. The increased amount of spirulina in the crackers’ composition contributed to the softness of the final product. A similar observation was reported for the cookies from whole-wheat flour and the addition of 5, 10, and 15% of S. platensis [43]. The cookies with 5% of S. platensis biomass showed greater hardness compared with the other samples with spirulina since they required more force for compression, cutting, and penetration [43]. Sanjari et al. [97] found that the use of spirulina microalgae in bread formulation influenced significantly the textural characteristics of the bread in comparison with the control sample. The addition of the spirulina decreased the hardness of the bread compared to the control sample [97]. This evaluation was also confirmed by a high statistically significant (p < 0.05) positive coefficient of correlation (r = 0.8557) between the sensory evaluated and instrumentally determined firmness of the obtained crackers by textural method, presented also in Table 6.
The deformation of samples during baking was also reduced compared to the control sample, because the samples with spirulina had a more regular shape and fewer surface cracks. Also, the brittleness and graininess of crackers with spirulina were reduced, as well as stickiness during chewing. Thus, many sensory properties of the crackers were improved by the addition of spirulina powder. The smell and taste of crackers with spirulina were strongly influenced by the specific smell and taste of spirulina powder. The spirulina powder contributed to a grassy smell and a specific, intense taste. Also, the addition of spirulina reduced the saltiness of the crackers compared to the control sample. The marks for these sensory properties were reduced with an increase in the spirulina content of the crackers (Figure 5). The specific and intense taste of spirulina may be a limiting factor for an adequate amount of spirulina in the crackers’ composition because, at an amount of 15% spirulina, this taste prevails. Thus, 15% spirulina in the cracker composition was the maximum application limit. The overall acceptability of cracker samples also singled out the samples with 5 and 10% spirulina with relatively high marks. For the wider consumer population, the specific green color and intensive flavor of spirulina in the final crackers may be the main barriers. The study of Sofia et al. [36] demonstrated that children and adults have a similar perception and liking of crackers with added different micro and macroalgae at a concentration of 5%. The study suggests that algae can be an excellent ingredient for beneficial nutrients to this sensitive target population, but that green color and intense flavor are the main barriers to the pediatric population [36].

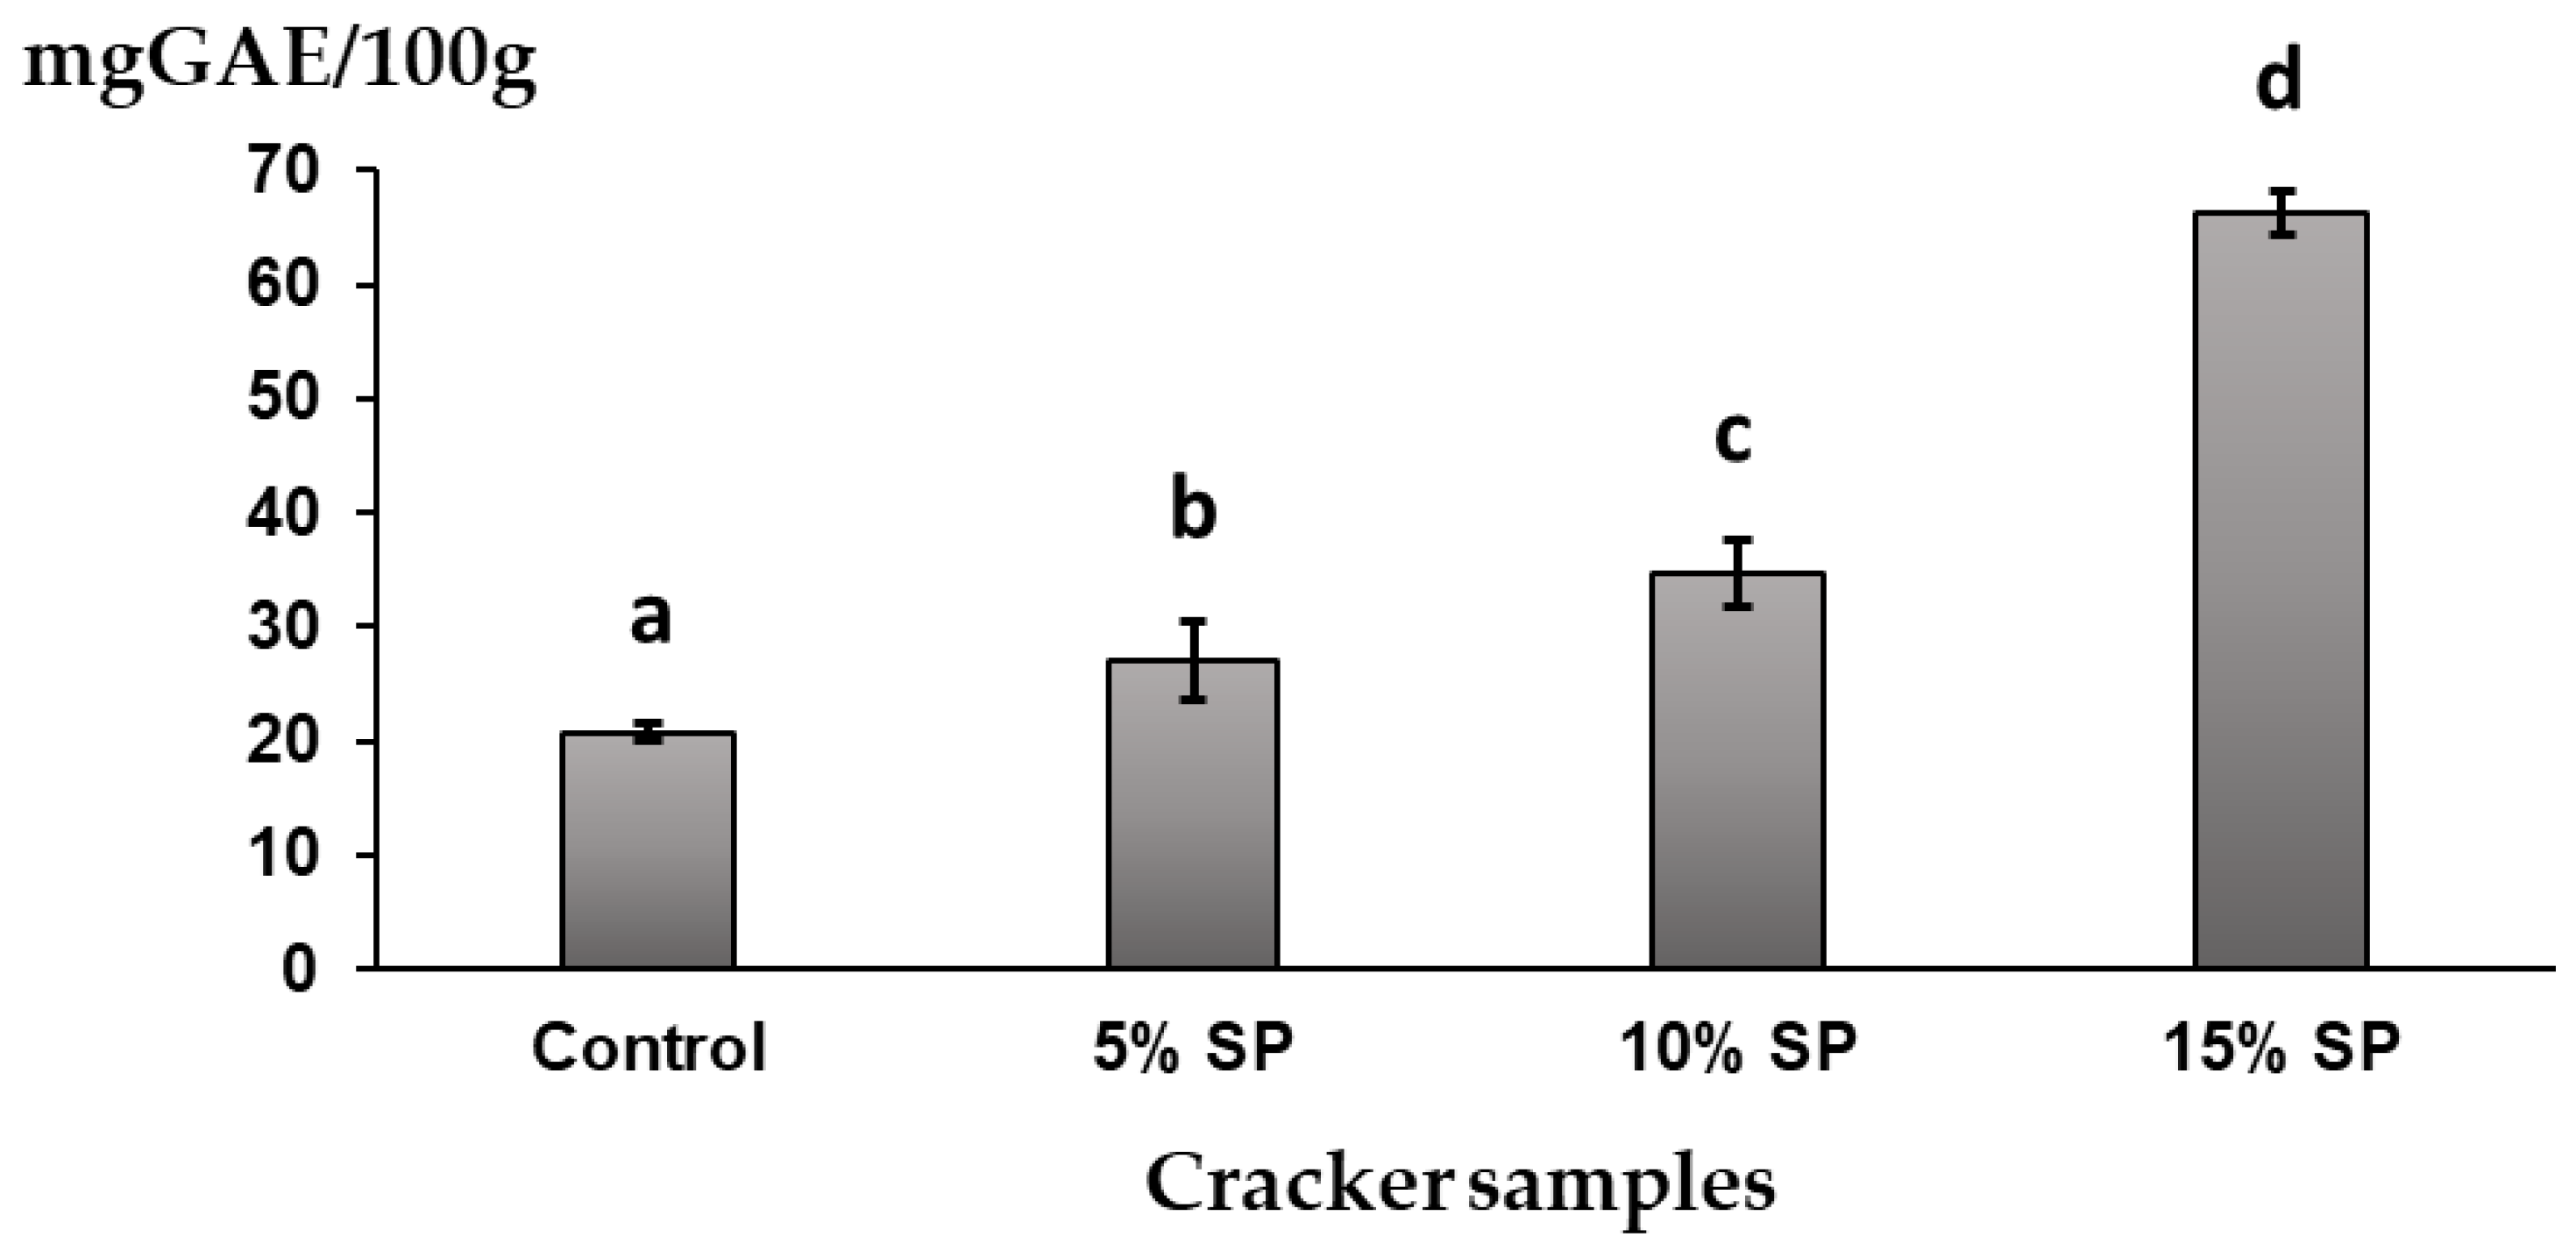
3.6. Polyphenolics and Antioxidant Capacity of the Crackers

Free radicals produced in the body contribute to several health disorders in humans, including atherosclerosis, arthritis, ischemia, central nervous system injury, gastritis, and cancer [98,99]. Due to their scavenging activity, antioxidant phytochemicals are able to reduce the risk of many chronic diseases [99,100]. A widely used assay to determine the antioxidant activity of various antioxidant phytochemicals is the DPPH radical scavenging assay, which is based on the capacity of stable DPPH free radicals to react with hydrogen donors. Reducing the power of bioactive compounds was associated with antioxidant activity since it is related to their ability to transfer electrons [68,71]. The principle of the reducing power assay is based on the reduction potential for a compound to react with potassium ferricyanide (Fe3+) to form potassium ferrocyanide (Fe2+), which further reacts with ferric chloride to form a ferric-ferrous complex with an absorption maximum at 700 nm. In addition, one of the most commonly used organic radicals for the evaluation of the antioxidant efficiency of pure compounds and complex mixtures is 2,2′-azinobis-3-ethylbenzothiazoline-6-sulfonic acid radical cation (ABTS•+) [71,72,73].
The total polyphenolic content of the obtained crackers is shown in Figure 6, and the phenolic compounds obtained by HPLC method are shown in Table 8. The antioxidant activity of samples obtained through DPPH, ABTS•+, and reducing power (RP) analysis is presented in Table 9.
The addition of spirulina significantly increased the total polyphenolic content of the observed crackers compared to the control sample. The most obvious enhancement by polyphenolic components was using 15% spirulina as a replacement for rice flour. The application of 10% spirulina powder increased the total polyphenolic content to 67.26% compared to the control cracker, while 15% spirulina caused a three-times-higher total polyphenolic content in comparison to the control. These results are in accordance with many other investigations of different bakery products enriched with microalgae or specifically spirulina [101,102]. Generally, microalgae species (Spirulina platensis, Chlorella vulgaris, Tetraselmis suecica, and Phaeodactylum tricornutum) enhance the functional properties of cookies incorporated into the formulations at concentrations of 2% and 6%, according to the investigation of Batista et al. [103]. Among observed microalgae biomass, Arthrospira platensis biomass presented the highest total phenolic content of cookies fortified with microalgae, followed by T. suecica, P. tricornutum, and C. vulgaris [103].
The identification of phenolic active compounds in crackers with spirulina powder presented in Table 8 indicates that the most present phenolic compound was catechin for all cracker samples. Certainly, its content was increased with a higher quantity of spirulina in the cracker composition. The quantity of catechin increased two times with the application of 10% spirulina and four times with the addition of 15% spirulina compared to the control cracker. Other noticeable values of phenolic compounds were for gallic acid and protocatechuic acid. There are many other phenolic compounds present in lower quantities. Vanillic acid was not recorded. A similar observation of phenolic composition was reported for biscuits and cakes fortified with spirulina (Arthrospira platensis) powder [104].
The values of parameters for the antioxidant activity of obtained crackers followed the trend of increasing by the rising amount of applied spirulina powder in cracker composition. According to the authors Batista et al. [103], the crackers with spirulina showed the highest antioxidant capacity among crackers with other microalgae. Also, snacks with spirulina powder showed a significantly higher antioxidant activity than those with Chlorella or the control snack, according to the results obtained by Letras et al. [102]. Thus, many researchers confirm the high antioxidative activity of products fortified with spirulina powder [105].
In addition to their rich polyphenolic content and high antioxidative activity, analyzed crackers with spirulina powder showed rich nutritive composition, according to the pronounced content of compounds presented in Table 10.
The presented chemical composition of crackers with different quantities of spirulina highlights the fact that the addition of spirulina and increasing its amount significantly contributes to increasing amounts of protein and total dietary fiber content, as well as increasing the content of minerals in crackers. The 15% of spirulina in the cracker’s composition contributed to 2.12 times higher content of proteins, 3.91 times higher content of total dietary fibers, and 7.54 times higher content of minerals compared to the control sample. These findings are in accordance with many other similar investigations of bakery products with spirulina [95,96,104,105]. For example, pasta supplemented with spirulina powder has higher nutritional values compared to typical pasta, and the improvements are significant increases in protein (77.5%), flavonoids (162.9%), phenolics (76.6%), calcium (57.3%), and iron (297.0%) content when pasta is fortified with 15% (w/w) spirulina powder [42,108]. The application of moringa and spirulina powder to the formula of cookies as fiber-rich ingredients increases the fiber content in cookie samples to 5.73, 6.54, and 7.65%, respectively, at 5, 10, and 15% replacement levels [109]. Among other microalgae biomasses that have the potential to be incorporated into the composition of the cookies, such as Chlorella vulgaris, Tetraselmis suecica, and Phaeodactylum tricornutum, the Arthrospira platensis or spirulina contribute the most to the high level of protein content [103].
The proteins of spirulina have been analyzed by many authors [14,103], confirming its valuable composition, which includes many essential amino acids such as leucine, isoleucine, lysine, methionine, phenylalanine, threonine, tryptophan, and valine, although the heat treatment during the baking could cause a decrease in the amount of leucine, proline, and methionine [14,96]. The increased mineral content of crackers with spirulina includes significant minerals, mainly iron. Snacks with 5% spirulina contain higher iron values compared to the control and even compared to snacks with other microalgae biomass, like 5% Chlorella [102]. Other significant minerals provided by the incorporation of spirulina in crackers are potassium, calcium, zinc, natrium, and magnesium. Generally, the inclusion of microalgae in gluten-free products can be crucial for enhancing the mineral content of snacks and bakery products, as celiac patients struggle with mineral absorption [14,102]. Different bakery products enriched with Spirulina platensis biomass demonstrated enhanced nutritional quality [42], including improved protein, mineral, fiber, and lipid composition, while maintaining good consumer acceptance.

4. Conclusions

According to the results obtained in this work and observing all technological challenges, the application of spirulina powder as raw material can significantly contribute to the production of non-gluten crackers with high nutritional value based on whole-grain rice flour.
Of the analyzed raw materials in this work, whole-grain rice flour and spirulina powder showed valuable chemical composition for the production of gluten-free bakery products such as crackers. During the rheological analysis, the obtained samples of dough for crackers were viscoelastic systems with a dominant elastic component (G′ > G″ for all dough samples). The viscoelastic parameter Tan δ = G″/G′ is less than 0 with a slight increase accompanying the increase in spirulina amount in the dough. All dough samples fitted well with Burger’s model of compliance and showed typical viscoelastic behavior during applied stress. The maximum creep compliance Jmax, during the stress phase, increased with the addition of 10% and 15% spirulina to the dough structure, while the Newtonian viscosity η0 decreased. Thus, the addition of spirulina powder and an increase in its quantity contributed to a softer dough consistency. The amount of the elastic component of residual deformations in the dough after the recovery period was relatively high, from 43.95 to 59.94%, which means that the dough withstood the applied stress well within non-destructive limits and could be easily manipulated with it.
The textural determination of dough samples with the high correlation coefficients, r, statistically significantly confirmed all rheological measurements. The dough hardness and extensibility indicated very good physical properties of dough with spirulina throughout processing.
The addition of spirulina certainly affected the change in the color of the dough from yellow-white to intense green. A high amount of spirulina (15%) significantly reduced the dough’s lightness (L*), thus the observed samples seemed to be more black.
Many sensory properties of crackers were improved by the addition of spirulina powder and by increasing its amount, such as appearance, brittleness, hardness, graininess, and stickiness. The high level of spirulina incorporation at 15% caused a very intense flavor in the obtained crackers. Thus, the higher level of 15% may be the main barrier for spirulina application.
From the nutritional aspect, the addition of spirulina significantly contributed to increasing the polyphenolic content (with the majority of catechins), protein, total dietary fibers, and mineral content.

Author Contributions

Conceptualization, I.N., J.P. and I.L.; methodology, I.N. and J.P.; software, I.L.; validation, S.R. and I.C; formal analysis, J.V.; investigation, I.N., J.P., I.L. and J.V.; resources, S.R. and I.Č.; data curation, A.T.; writing—original draft preparation, I.N., J.P. and I.L.; writing—review and editing, S.R., I.Č. and I.N.; visualization, A.T.; supervision, A.T. All authors have read and agreed to the published version of the manuscript.

Funding

This research received no external funding.

Data Availability Statement

The original contributions presented in this study are included in the article. Further inquiries can be directed to the corresponding author.

Acknowledgments

This research was supported by the Ministry of Science, Technological Development and Innovation Republic of Serbia, Program (number: 451-03-137/2025-03/ 200134 and 451-03-136/2025-03/ 200134) and Ministry of Science, Technological Development and Innovation, Republic of Serbia, Program (number: 451-03-136/2025-03/200222).

Conflicts of Interest

The authors declare no conflicts of interest.

References

  1. El–Hadidy, G.S.; Shaban, H.H.; Mospah, W.M. Gluten-Free Crackers Preparation. J. Food Res. 2022, 11, 47–56. [Google Scholar] [CrossRef]
  2. Aaron, L.; Torsten, M.; Patricia, W. Autoimmunity in celiac disease: Extra–intestinal manifestations. Autoimmun. Rev. 2019, 18, 241–246. [Google Scholar] [CrossRef] [PubMed]
  3. Alzahrani, H.A. Celiac Disease Review: Background and Emphasis on the Important Role of Health Education in the Prevention and Control of Symptom. Sch. J. Appl. Med. Sci. 2024, 4, 431–442. [Google Scholar] [CrossRef]
  4. Xu, J.; Zhang, Y.; Wang, W.; Li, Y. Advanced properties of gluten–free cookies, cakes, and crackers: A review. Trends Food Sci. Technol. 2020, 103, 200–213. [Google Scholar] [CrossRef]
  5. Turk Aslan, S.; Isik, F. Effects of pseudocereal flours addition on chemical and physical properties of gluten–free crackers. Food Sci. Technol. 2022, 42, e52521. [Google Scholar] [CrossRef]
  6. Gómez, M. Gluten–free bakery products: Ingredients and processes. In Advances in Food and Nutrition Research; Academic Press: Cambridge, MA, USA, 2022; Volume 99, pp. 189–238. [Google Scholar] [CrossRef]
  7. Khairuddin MA, N.; Lasekan, O. Gluten–free cereal products and beverages: A review of their health benefits in the last five years. Foods 2021, 10, 2523. [Google Scholar] [CrossRef]
  8. Sedej, I.; Sakač, M.; Mandić, A.; Mišan, A.; Pestorić, M.; Šimurina, O.; Čanadanović–Brunet, J. Quality assessment of gluten-free crackers based on buckwheat flour. LWT–Food Sci. Technol. 2011, 44, 694–699. [Google Scholar] [CrossRef]
  9. Tomić, J.; Škrobot, D.; Popović, L.; Dapčević-Hadnađev, T.; Čakarević, J.; Maravić, N.; Hadnađev, M. Gluten–Free crackers based on chickpea and pumpkin seed press cake flour: Nutritional, functional and sensory properties. Food Technol. Biotechnol. 2022, 60, 488–498. [Google Scholar] [CrossRef]
  10. Ren, Y.; Yakubov, G.E.; Linter, B.R.; Foster, T.J. Development of a separated–dough method and flour/starch replacement in gluten free crackers by cellulose and fibrillated cellulose. Food Funct. 2021, 12, 8425–8439. [Google Scholar] [CrossRef]
  11. Hosseini, S.M.; Soltanizadeh, N.; Mirmoghtadaee, P.; Banavand, P.; Mirmoghtadaie, L.; Shojaee-Aliabadi, S. Gluten–free products in celiac disease: Nutritional and technological challenges and solutions. J. Res. Med. Sci. 2018, 23, 109. [Google Scholar] [CrossRef]
  12. Schirrmeister, B.E.; Antonelli, A.; Bagheri, H.C. The origin of multicellularity in cyanobacteria. BMC Evol. Biol. 2011, 11, 45. [Google Scholar] [CrossRef] [PubMed]
  13. Soni, R.A.; Sudhakar, K.; Rana, R.S. Spirulina–From growth to nutritional product: A review. Trends Food Sci. Technol. 2017, 69, 157–171. [Google Scholar] [CrossRef]
  14. Čabarkapa, I.; Rakita, S.; Popović, S.; Tomičić, Z.; Spasevski, N.; Vulić, J.; Đuragić, O. Characterization of organic Spirulina spp. and Chlorella vulgaris as one of the most nutrient–dense food. J. Food Saf. Food Qual. 2022, 73, 75–108. [Google Scholar] [CrossRef]
  15. Ali, A. Bioactive properties of spirulina: A review. Microb. Bioact. 2021, 4, 134–142. [Google Scholar] [CrossRef]
  16. Bortolini, D.G.; Maciel, G.M.; Fernandes ID, A.A.; Pedro, A.C.; Rubio FT, V.; Branco, I.G.; Haminiuk, C.W.I. Functional properties of bioactive compounds from Spirulina spp.: Current status and future trends. Food Chem. Mol. Sci. 2022, 5, 100134. [Google Scholar] [CrossRef]
  17. Çelekli, A.; Alslibi, Z.A.; Üseyin Bozkurt, H. Influence of incorporated Spirulina platensis on the growth of microflora and physicochemical properties of ayran as a functional food. Algal Res. 2019, 44, 101710. [Google Scholar] [CrossRef]
  18. Lafarga, T.; Fernández–Sevilla, J.M.; González–López, C.; Acién–Fernández, F.G. Spirulina for the food and functional food industries. Food Res. Int. 2020, 137, 109356. [Google Scholar] [CrossRef]
  19. AlFadhly, N.K.; Alhelfi, N.; Altemimi, A.B.; Verma, D.K.; Cacciola, F.; Narayanankutty, A. Trends and technological advancements in the possible food applications of Spirulina and their health benefits: A Review. Molecules 2022, 27, 5584. [Google Scholar] [CrossRef]
  20. Ramírez–Rodrigues, M.M.; Estrada–Beristain, C.; Metri–Ojeda, J.; Pérez–Alva, A.; Baigts–Allende, D.K. Spirulina platensis protein as sustainable ingredient for nutritional food products development. Sustainability 2021, 13, 6849. [Google Scholar] [CrossRef]
  21. Jung, F.; Krüger-Genge, A.; Waldeck, P.; Küpper, J.H. Spirulina platensis, a super food? J. Cell Biotechnol. 2019, 5, 43–54. [Google Scholar] [CrossRef]
  22. Marjanović, B.; Benković, M.; Jurina, T.; Sokač Cvetnić, T.; Valinger, D.; Gajdoš Kljusurić, J.; Jurinjak Tušek, A. Bioactive Compounds from Spirulina spp.—Nutritional Value, Extraction, and Application in Food Industry. Separations 2024, 11, 257. [Google Scholar] [CrossRef]
  23. Spínola, M.P.; Mendes, A.R.; Prates, J.A. Chemical composition, bioactivities, and applications of Spirulina (Limnospira platensis) in food, feed, and medicine. Foods 2024, 13, 3656. [Google Scholar] [CrossRef] [PubMed]
  24. Khan, Z.; Bhadouria, P.; Bisen, P.S. Nutritional and therapeutic potential of Spirulina. Curr. Pharm. Biotechnol. 2005, 6, 373–379. [Google Scholar] [CrossRef] [PubMed]
  25. Grosshagauer, S.; Kraemer, K.; Somoza, V. The true value of Spirulina. J. Agricult. Food Chem. 2020, 68, 4109–4115. [Google Scholar] [CrossRef]
  26. Andrade, L.M.; Andrade, C.J.; Dias, M.; Nascimento, C.; Mendes, M.A. Chlorella and spirulina microalgae as sources of functional foods. Nutraceut Food Suppl. 2018, 6, 45–58. [Google Scholar] [CrossRef]
  27. Ghaeni, M.; Roomiani, L.; Moradi, Y. Evaluation of Carotenoids and Chlorophyll as Natural Resources for Food in Spirulina Microalgae. Appl. Food Biotechnol. 2015, 2, 39–44. [Google Scholar] [CrossRef]
  28. Gantar, M.; Simović, D.; Djilas, S.; Gonzalez, W.W.; Miksovska, J. Isolation, characterization and antioxidative activity of C–phycocyanin from Limnothrix sp. strain 37–2–1. J. Biotechnol. 2012, 159, 21–26. [Google Scholar] [CrossRef]
  29. Zepka, L.Q.; Jacob-Lopes, E.; Roca, M. Catabolism and bioactive properties of chlorophylls. Curr. Opin. Food Sci. 2019, 26, 94–100. [Google Scholar] [CrossRef]
  30. Gouveia, L.; Raymundo, A.; Batista, A.P.; Sousa, I.; Empis, J. Chlorella vulgaris and Haematococcus pluvialis biomass as colouring and antioxidant in food emulsions. Eur. Food Res. Technol. 2006, 222, 362–367. [Google Scholar] [CrossRef]
  31. O’Shea, N.; Gallagher, E. Evaluation of novel–extruding ingredients to improve the physicochemical and expansion characteristics of a corn–puffed snack–containing pearled barley. Eur. Food Res. Technol. 2019, 245, 1293–1305. [Google Scholar] [CrossRef]
  32. Batista, A.P.; Nunes, M.C.; Raymundo, A.; Gouveia, L.; Sousa, I.; Cordobés, F.; Guerrero, A.; Franco, J.M. Microalgae biomass interaction in biopolymer gelled systems. Food Hydrocolloid 2011, 25, 817–825. [Google Scholar] [CrossRef]
  33. Niccolai, A.; Venturi, M.; Galli, V.; Pini, N.; Rodolfi, L.; Biondi, N.; D’Ottavio, M.; Batista, A.P.; Raymundo, A.; Granchi, L.; et al. Development of new microalgae-based sourdough “crostini”: Functional effects of Arthrospira platensis (spirulina) addition. Sci. Rep. 2019, 9, 19433. [Google Scholar] [CrossRef] [PubMed]
  34. Tańska, M.; Konopka, I.; Ruszkowska, M. Sensory, physico–chemical and water sorption properties of corn extrudates enriched with spirulina. Plant Food Hum. Nutr. 2017, 72, 250–257. [Google Scholar] [CrossRef]
  35. Almeida, L.M.; da Silva Cruz, L.F.; Machado, B.A.; Nunes, I.L.; Costa, J.A.; de Souza Ferreira, E.; Lemos, P.V.; Druzian, J.I.; de Souza, C.O. Effect of the addition of Spirulina sp. biomass on the development and characterization of functional food. Algal Res. 2021, 58, 102387. [Google Scholar] [CrossRef]
  36. Sofia, R.N.; Pernilla, S.; Susanne, N.; Jietse, S.J.; Monica, L. Green color drives rejection of crackers added with algae in children but not in adults. Food Qual. Prefer. 2025, 127, 105461. [Google Scholar] [CrossRef]
  37. Van den Burg, S.W.; Dagevos, H.; Helmes RJ, K. Towards sustainable European seaweed value chains: A triple P perspective. ICES J. Mar. Sci. 2021, 78, 443–450. [Google Scholar] [CrossRef]
  38. Hosseinkhani, N.; McCauley, J.I.; Ralph, P.J. Key challenges for the commercial expansion of ingredients from algae into human food products. Algal Res. 2022, 64, 102696. [Google Scholar] [CrossRef]
  39. Lafarga, T. Effect of microalgal biomass incorporation into foods: Nutritional and sensorial attributes of the end products. Algal Res. 2019, 41, 101566. [Google Scholar] [CrossRef]
  40. Fradinho, P.; Niccolai, A.; Soares, R.; Rodolfi, L.; Biondi, N.; Tredici, M.R.; Sousa, I.; Raymundo, A. Effect of Arthrospira platensis (spirulina) incorporation on the rheological and bioactive properties of gluten–free fresh pasta. Alg. Res. 2020, 45, 101743. [Google Scholar] [CrossRef]
  41. Villaró–Cos, S.; Sánchez JL, G.; Acién, G.; Lafarga, T. Research trends and current requirements and challenges in the industrial production of spirulina as a food source. Trend Food Sci. Technol. 2024, 143, 104280. [Google Scholar] [CrossRef]
  42. Nejatian, M.; Yazdi, A.P.G.; Saberian, H.; Bazsefidpar, N.; Karimi, A.; Soltani, A.; Assadpour, E.; Toker, O.S.; Jafari, S.M. Application of Spirulina as an innovative ingredient in pasta and bakery products. Food Biosci. 2024, 62, 105170. [Google Scholar] [CrossRef]
  43. Donato, N.R.; de Melo Queiroz, A.J.; Feitosa, R.M.; de Figueirêdo RM, F.; dos Santos Moreira, I.; de Lima, J.F. Production of cookies enriched with Spirulina platensis biomass. Agricult. Eng. 2019, 7, 323–342. [Google Scholar] [CrossRef]
  44. El Nakib, D.M.; Ibrahim, M.M.; Mahmoud, N.S.; Abd El Rahman, E.N.; Ghaly, A.E. Incorporation of Spirulina (Athrospira platensis) in traditional Egyptian cookies as a source of natural bioactive molecules and functional ingredients: Preparation and sensory evaluation of nutrition snack for school children. Eur. J. Nutr. Food Saf. 2019, 9, 372–397. [Google Scholar] [CrossRef]
  45. Ak, B.; Avsaroglu, E.; Isik, O.; Özyurt, G.; Kafkas, E.; Etyemez, M. Nutritional and physicochemical characteristics of bread enriched with microalgae Spirulina platensis. Int. J. Eng. Res. Appl. 2016, 6, 30–38. [Google Scholar]
  46. Rabitti, N.S.; Bayudan, S.; Laureati, M.; Neugart, S.; Schouteten, J.J.; Apelman, L.; Dahlstedt, S.; Sandvik, P. Snacks from the sea: A cross-national comparison of consumer acceptance for crackers added with algae. Eur. Food Res. Technol. 2024, 250, 2193–2209. [Google Scholar] [CrossRef]
  47. Hussein, A.M.; Mostafa, S.; Ata, S.M.; Hegazy, N.A.; Abu-Reidah, I.M.; Zaky, A.A. Effect of Spirulina Microalgae Powder in Gluten-Free Biscuits and Snacks Formulated with Quinoa Flour. Processes 2025, 13, 625. [Google Scholar] [CrossRef]
  48. AOAC (Association of Official Analytical Chemists). International, Official Methods of Analysis of the Association of Official Analytical Chemists International, 17th ed.; Association of Official Analytical Communities: Gaithersburg, MD, USA, 2000. [Google Scholar]
  49. Da Silva Gorgônio, C.M.; Aranda DA, G.; Couri, S. Morphological and chemical aspects of Chlorella pyrenoidosa, Dunaliella tertiolecta, Isochrysis galbana and Tetraselmis gracilis microalgae. Nat. Sci. 2013, 5, 783–791. [Google Scholar] [CrossRef]
  50. Agrawal, N.; Hidame, P.; Gurla, S. Estimation of total carbohydrate in flour of different types of grain. Int. J. Res. Biosci. Technol. 2011, 3, 36–40. [Google Scholar]
  51. Petrović, J.; Rakić, D.; Fišteš, A.; Pajin, B.; Lončarević, I.; Tomović, V.; Zarić, D. Defatted wheat germ application: Influence on cookies’ properties with regard to its particle size and dough moisture content. Food Sci. Technol. Int. 2017, 23, 597–607. [Google Scholar] [CrossRef]
  52. Simić, S.; Petrović, J.; Rakić, D.; Pajin, B.; Lončarević, I.; Jozinović, A.; Fišteš, A.; Nikolić, S.; Blažić, M.; Miličević, B. The influence of extruded sugar beet pulp on cookies’ nutritional, physical and sensory characteristics. Sustainability 2021, 13, 5317. [Google Scholar] [CrossRef]
  53. CIE. International Commission on Illumination, Colorimetry: Official Recommendation of the International Commission on Illumination Publication CIE No. (E–1.31); Bureau Central de la CIE: Paris, France, 1976. [Google Scholar]
  54. Meriles, S.P.; Piloni, R.; Cáceres, G.V.; Penci, M.C.; Marín, M.A.; Ribotta, P.; Martínez, M.L. Compositional characteristics, texture, shelf–life and sensory quality of snack crackers produced from non–traditional ingredients. Int. J. Food Sci. Technol. 2022, 57, 4689–4696. [Google Scholar] [CrossRef]
  55. Mezger, T. The Rheology Handbook: For Users of Rotational and Oscillation Rheometers; Vincentz Verlag: Hannover, Germany, 2002. [Google Scholar]
  56. Steffe, F.J. Rheological Methods in Food Process Engineering, 2nd ed.; Freeman Press: Dallas, TX, USA, 1996. [Google Scholar]
  57. Sozer, N. Rheological properties of rice pasta dough supplemented with proteins and gums. Food Hydrocolloid 2009, 23, 849–855. [Google Scholar] [CrossRef]
  58. Lazaridou, A.; Biliaderis, C. Gluten–free doughs: Rheological properties, testing procedures–methods and potential problems. In Gluten–Free Food Science and Technology; Gallagher, E., Ed.; Blackwell Publishing Ltd.: Oxford, UK, 2009; pp. 52–83. [Google Scholar]
  59. Nikolić, I.; Pajin, B.; Lončarević, I.; Šubarić, D.; Jozinović, A.; Lončarić, A.; Petrović, J.; Šereš, Z.; Dokić, L.; Šoronja-Simović, D. Technological Characteristics of Wheat–Fiber–Based Fat Mimetics in Combination with Food Additives. Sustainability 2023, 15, 1887. [Google Scholar] [CrossRef]
  60. Bourne, M.C. Texture, Viscosity and Food. In Food Texture and Viscosity: Concept and Measurement; Elsevier Science & Technology Books: Amsterdam, The Netherlands, 2002; Chapter 1. [Google Scholar]
  61. TA.HD. Texture Analyser Product Specification; Stable Micro Systems, Ltd.: Godalming Surrey, UK; Vienna, Austria, 2004. [Google Scholar]
  62. Choudhury, M.; Badwaik, L.S.; Borah, P.K.; Sit, N.; Deka, S.C. Influence of bamboo shoot powder fortification on physico-chemical, textural and organoleptic characteristics of biscuits. J. Food Sci. Technol. 2015, 52, 6742–6748. [Google Scholar] [CrossRef]
  63. Bhattacharjee, A.; Kumar, D.; Badwaik, L.S. Rheological and textural properties of dough made out of de-oiled soya flour with application of different binding agents. J. Food Process. Eng. 2022, 45, e14027. [Google Scholar] [CrossRef]
  64. Dokić, L.; Nikolić, I.; Šoronja–Simović, D.; Šereš, Z.; Pajin, B.; Juul, N.; Maravić, N. Rheological properties of dough and sensory quality of crackers with dietary fibers. Int. J. Nutr. Food Eng. 2015, 9, 985–989. [Google Scholar]
  65. ISO 8589; Sensory Analysis–General Guidance for the Design of Test Rooms. International Organization for Standardization: Geneva, Switzerland, 2007.
  66. ISO 8586–2; Sensory Analysis–General Guidance for the Selection, Training and Monitoring of Assessors–Part 2: Expert Sensory Assessors. International Organization for Standardization: Geneva, Switzerland, 2008.
  67. ISO 4121; Sensory Analysis–Guidelines for the Use of Quantitative Response Scales. International Organization for Standardization: Geneva, Switzerland, 2003.
  68. Tumbas Šaponjac, V.; Čanadanović–Brunet, J.; Ćetković, G.; Jakišić, M.; Djilas, S.; Vulić, J.; Stajčić, S. Encapsulation of beetroot pomace extract: RSM optimization, storage and gastrointestinal stability. Molecules 2016, 21, 584. [Google Scholar] [CrossRef]
  69. Šaponjac, V.T.; Ćetković, G.; Čanadanović-Brunet, J.; Pajin, B.; Djilas, S.; Petrović, J.; Lončarević, I.; Stajčić, S.; Vulić, J. Sour cherry pomace extract encapsulated in whey and soy proteins: Incorporation in cookies. Food Chem. 2016, 207, 27–33. [Google Scholar] [CrossRef]
  70. Torres, P.; Osaki, S.; Silveira, E.; dos Santos, D.Y.; Chow, F. Comprehensive evaluation of Folin–Ciocalteu assay for total phenolic quantification in algae (Chlorophyta, Phaeophyceae, and Rhodophyta). Algal Res. 2024, 80, 103503. [Google Scholar] [CrossRef]
  71. Gironés–Vilaplana, A.; Mena, P.; Moreno, D.A.; García–Viguera, C. Evaluation of sensorial, phytochemical and biological properties of new isotonic beverages enriched with lemon and berries during shelf life. J. Sci. Food Agric. 2014, 94, 1090–1100. [Google Scholar] [CrossRef]
  72. Šaponjac, V.T.; Gironés-Vilaplana, A.; Djilas, S.; Mena, P.; Ćetković, G.; Moreno, D.A.; Čanadanović-Brunet, J.; Vulić, J.; Stajčić, S.; Vinčić, M. Chemical composition and potential bioactivity of strawberry pomace. RSC Adv. 2015, 5, 5397–5405. [Google Scholar] [CrossRef]
  73. Mena, P.; García–Viguera, C.; Navarro–Rico, J.; Moreno, D.A.; Bartual, J.; Saura, D.; Martí, N. Phytochemical characterisation for industrial use of pomegranate (Punica granatum L.) cultivars grown in Spain. J. Sci. Food Agric. 2011, 91, 1893–1906. [Google Scholar] [CrossRef] [PubMed]
  74. Kraithong, S.; Lee, S.; Rawdkuen, S. Physicochemical and functional properties of Thai organic rice flour. J. Cereal Sci. 2018, 79, 259–266. [Google Scholar] [CrossRef]
  75. Paz, G.M.; King, J.M.; Prinyawiwatkul, W.; Tyus, C.M.; Aleman, R.J. High–protein rice flour in the development of gluten–free muffins. J. Food Sci. 2020, 85, 1397–1402. [Google Scholar] [CrossRef]
  76. Ronie, M.E.; Abdul Aziz, A.H.; Mohd Noor NQ, I.; Yahya, F.; Mamat, H. Characterisation of Bario rice flour varieties: Nutritional compositions and physicochemical properties. Appl. Sci. 2022, 12, 9064. [Google Scholar] [CrossRef]
  77. Bao, J.; Bergman, C.J. Rice flour and starch functionality. In Starch in Food; Woodhead Publishing: Sawston, UK, 2024; pp. 275–307. [Google Scholar] [CrossRef]
  78. Rathna Priya, T.S.; Eliazer Nelson, A.R.L.; Ravichandran, K.; Antony, U. Nutritional and functional properties of coloured rice varieties of South India: A review. J. Ethnic Food 2019, 6, 11. [Google Scholar] [CrossRef]
  79. Hussein, A.S.; Mostafa, S.; Fouad, S.; Hegazy, N.A.; Zaky, A.A. Production and evaluation of gluten–free pasta and pan bread from spirulina algae powder and quinoa flour. Processes 2023, 11, 2899. [Google Scholar] [CrossRef]
  80. Onacik–Gür, S.; Żbikowska, A.; Majewska, B. Effect of Spirulina (Spirulina platensis) addition on textural and quality properties of cookies. Ital. J. Food Sci. 2018, 30, 1–12. [Google Scholar] [CrossRef]
  81. Marzec, A.; Kramarczuk, P.; Kowalska, H.; Kowalska, J. Effect of type of flour and microalgae (Chlorella vulgaris) on the rheological, microstructural, textural, and sensory properties of vegan muffins. Appl. Sci. 2023, 13, 7632. [Google Scholar] [CrossRef]
  82. Lopes–Da–Silva, J.A.; Santos, D.M.; Freitas, A.; Brites, C.; Gil, A.M. Rheological and nuclear magnetic resonance (NMR) study of the hydration and heating of undeveloped wheat doughs. J. Agric. Food Chem. 2007, 55, 5636–5644. [Google Scholar] [CrossRef]
  83. Singh, S.; Singh, N. Relationship of polymeric proteins and empirical dough rheology with dynamic rheology of dough and gluten from different wheat varieties. Food Hydrocolloid 2013, 33, 342–348. [Google Scholar] [CrossRef]
  84. Uribe–Wandurraga, Z.N.; Zhang, L.; Noort, M.W.; Schutyser, M.A.; García-Segovia, P.; Martínez-Monzó, J. Printability and physicochemical properties of microalgae–enriched 3D–printed snacks. Food Bioprocess Technol. 2020, 13, 2029–2042. [Google Scholar] [CrossRef]
  85. Amoriello, T.; Mellara, F.; Amoriello, M.; Ceccarelli, D.; Ciccoritti, R. Powdered seaweeds as a valuable ingredient for functional breads. Eur. Food Res. Technol. 2021, 247, 2431–2443. [Google Scholar] [CrossRef]
  86. Shahbazizadeh, S.; Khosravi-Darani, K.; Sohrabvandi, S. Fortification of Iranian traditional cookies with Spirulina platensis. Annu. Res. Rev. Biol. 2015, 7, 144–154. [Google Scholar] [CrossRef]
  87. Sanchez, M.; Bernal–Castillo, J.; Rozo, C.; Rodríguez, I. Spirulina (Arthrospira): An edible microorganism: A review. Univ. Sci. 2003, 8, 7–24. [Google Scholar]
  88. Wang, M.; Yin, Z.; Sun, W.; Zhong, Q.; Zhang, Y.; Zeng, M. Microalgae play a structuring role in food: Effect of Spirulina platensis on the rheological, gelling characteristics, and mechanical properties of soy protein isolate hydrogel. Food Hydrocolloid 2023, 136, 108244. [Google Scholar] [CrossRef]
  89. Filipčev, B.; Šimurina, O.; Bodroža–Solarov, M.; Brkljača, J. Dough rheological properties in relation to cracker–making performance of organically grown spelt cultivars. Int. J. Food Sci. Technol. 2013, 48, 2356–2362. [Google Scholar] [CrossRef]
  90. Dapčević–Hadnađev, T.; Tomić, J.; Škrobot, D.; Šarić, B.; Hadnađev, M. Processing strategies to improve the breadmaking potential of whole–grain wheat and non–wheat flours. Discov. Food 2022, 2, 11. [Google Scholar] [CrossRef]
  91. Duodu, K.G.; Taylor, J.R.N. The Quality of Breads Made with Non–Wheat Flours. In Breadmaking; Duodu, K.G., Taylor, J.R.N., Eds.; Woodhead Publishing: Sawston, UK, 2012; pp. 754–782. [Google Scholar] [CrossRef]
  92. Khemiri, S.; Khelifi, N.; Nunes, M.C.; Ferreira, A.; Gouveia, L.; Smaali, I.; Raymundo, A. Microalgae biomass as an additional ingredient of gluten–free bread: Dough rheology, texture quality and nutritional properties. Algal Res. 2020, 50, 101998. [Google Scholar] [CrossRef]
  93. Putra HB, P.; Anandini, D.R.; Amani, Z.N.; Arifin, M.H. The Addition Effect of Spirulina platensis on the Physco-chemical and Hedonic Properties of Gluten–Free Cookies Based on Mocaf and Sorghum Composite Flour. Int. J. Res. Public. Rev. 2024, 5, 1070–1076. [Google Scholar] [CrossRef]
  94. Gün, D.; Çelekli, A.; Bozkurt, H. Nutritional and Sensory Optimization of Functional Crackers with the Incorporation of Arthrospira platensis. Preprints 2024. [Google Scholar] [CrossRef]
  95. Gün, D.; Çelekli, A.; Bozkurt, H.; Kaya, S. Optimization of biscuit enrichment with the incorporation of Arthrospira platensis: Nutritional and sensory approach. J. Appl. Phycol. 2022, 34, 1555–1563. [Google Scholar] [CrossRef]
  96. Hernández–López, I.; Abadias, M.; Prieto–Santiago, V.; Chic–Blanco, Á.; Ortiz–Solà, J.; Aguiló–Aguayo, I. Exploring the Nutritional Potential of Microalgae in the Formulation of Bakery Products. Foods 2023, 13, 84. [Google Scholar] [CrossRef] [PubMed]
  97. Sanjari, S.; Sarhadi, H.; Shahdadi, F. Investigating the effect of Spirulina platensis microalgae on textural and sensory properties of baguette bread. J. Nutrit. Food Secur. 2018, 3, 218–225. [Google Scholar] [CrossRef]
  98. Engwa, G.A. Free radicals and the role of plant phytochemicals as antioxidants against oxidative stress-related diseases. In Phytochemicals: Source of Antioxidants and Role in Disease Prevention; Asao, T., Asaduzzaman, M., Eds.; BoD–Books on Demand: Norderstedt, Germany, 2018; Volume 7, pp. 49–74. [Google Scholar]
  99. Zhang, Y.J.; Gan, R.Y.; Li, S.; Zhou, Y.; Li, A.N.; Xu, D.P.; Li, H.B. Antioxidant phytochemicals for the prevention and treatment of chronic diseases. Molecules 2015, 20, 21138–21156. [Google Scholar] [CrossRef]
  100. Muscolo, A.; Mariateresa, O.; Giulio, T.; Mariateresa, R. Oxidative stress: The role of antioxidant phytochemicals in the prevention and treatment of diseases. Inter. J. Mol. Sci. 2024, 25, 3264. [Google Scholar] [CrossRef]
  101. Khemiri, S.; Khelifi, N.; Nunes, M.C.; Ferreira, A.; Gouveia, L.; Smaali, I.; Raymundo, A. Microalgae biomass as an alternative ingredient in cookies: Sensory, physical and chemical properties, antioxidant activity and in vitro digestibility. Algal Res. 2017, 26, 161–171. [Google Scholar] [CrossRef]
  102. Letras, P.; Oliveira, S.; Varela, J.; Nunes, M.C.; Raymundo, A. 3D printed gluten–free cereal snack with incorporation of Spirulina (Arthrospira platensis) and/or Chlorella vulgaris. Algal Res. 2022, 68, 102863. [Google Scholar] [CrossRef]
  103. Batista, A.P.; Niccolai, A.; Bursic, I.; Sousa, I.; Raymundo, A.; Rodolfi, L.; Biondi, N.; Tredici, M.R. Microalgae as functional ingredients in savory food products: Application to wheat crackers. Foods 2019, 8, 611. [Google Scholar] [CrossRef]
  104. Ali, H. Nutritional value, amino acids of biscuits and cakes fortified with spirulina (Arthrospira platensis) powder. J. Home Econom. 2022, 23, 141–158. [Google Scholar]
  105. Rathnayake, H.A.; Navaratne, S.B.; Navaratne, C.M. Formulation of a Biologically–leavened Composite Cracker with Functional Properties. J. Culinar Sci. Technol. 2024, 22, 1025–1043. [Google Scholar] [CrossRef]
  106. Youssef, H.M. Assessment of gross chemical composition, mineral composition, vitamin composition and amino acids composition of wheat biscuits and wheat germ fortified biscuits. Food Nutr. Sci. 2015, 6, 845–853. [Google Scholar] [CrossRef]
  107. Seleet, R. The Analysis of Nutrients in Foods; Academic Press, Inc.: London, UK, 2010. [Google Scholar]
  108. Koli, D.K.; Rudra, S.G.; Bhowmik, A.; Pabbi, S. Nutritional, functional, textural and sensory evaluation of Spirulina enriched green pasta: A potential dietary and health supplement. Foods 2022, 11, 979. [Google Scholar] [CrossRef] [PubMed]
  109. Ashoush, I.S.; Mahdy, S.M. Nutritional evaluation of cookies enriched with different blends of Spirulina platensis and Moringa oleifera leaves powder. J. Food Dairy. Sci. 2019, 10, 53–60. [Google Scholar] [CrossRef]
Figure 1. Dough samples (a) without spirulina powder and (b) with 10% of spirulina powder.
Processes 13 00908 g001
Figure 2. The changes in elastic and viscous modulus over frequency (a) and their ratio, Tan δ (b), dependent upon the amount of spirulina in the dough. a–d Values followed by different letters at (b) are statistically significantly different (p < 0.05) according to post-hoc Tukey’s range test.
Processes 13 00908 g002
Figure 3. Creep and recovery curves for dough with different amounts of spirulina powder.
Processes 13 00908 g003
Figure 4. The changes in creep and recovery parameters (a) Jmax and (b) Newtonian viscosity, dependent on the amount of spirulina in the dough samples. a–c Values followed by different letters are statistically significantly different (p < 0.05) according to post-hoc Tukey’s range test.
Processes 13 00908 g004
Figure 5. Sensory marks for crackers.
Processes 13 00908 g005
Figure 6. Total polyphenolic content (expressed as gallic acid equivalents mgGAE/100 g) of crackers enriched with different amounts of spirulina powder; results are expressed as mean values (n = 3) ± standard deviation. a–d Values followed by different letters are statistically significantly different (p < 0.05) according to post-hoc Tukey’s range test.
Processes 13 00908 g006
Table 1. Chemical composition of whole-grain rice flour and spirulina powder.
ComponentsWGRF ± SD
(%)
SP ± SD
(%)
Moisture9.50 ± 0.177.42 ± 0.14
Carbohydrates76.25 ± 0.3012.68 ± 0.15
Proteins6.44 ± 0.1466.77 ± 1.05
Fat2.91 ± 0.241.35 ± 0.60
Ash1.05 ± 0.056.22 ± 0.01
Total dietary fibers3.80 ± 0.095.13 ± 0.07
Values are presented as the mean value of three measurements ± standard deviation.
Table 2. Color parameters of the dough for crackers.
Dough SamplesColor Parameters
L* ± SDa* ± SDb* ± SD
Control sample84.58 ± 0.27 d2.31 ± 0.14 c14.08 ± 0.29 c
5% SP30.57 ± 0.49 c−4.76 ± 0.07 d−2.67 ± 0.03 b
10% SP28.01 ± 0.07 b−1.47 ± 0.10 b−1.35 ± 0.06 a
15% SP26.93 ± 0.39 a−0.77 ± 0.06 a−1.10 ± 0.07 a
Values are presented as the mean value of three measurements ± standard deviation. a–d Values followed by different letters within the same column are statistically significantly different (p < 0.05) according to post-hoc Tukey’s range test.
Table 3. The values of creep and recovery parameters obtained by Burger’s model.
Dough SamplesCreep Phase
J0·10−6 ± SD
(1/Pa)
J0·10−6 ± SD
(1/Pa)
η0·107 ± SD
(Pas)
λ ± SD (s)Jmax·10−5 ± SD (1/Pa)R2
Control sample7.41 ± 0.015.22 ± 0.341.58 ± 0.19109.00 ± 0.001.58 ± 0.190.9909
5% SP8.01 ± 0.115.33 ± 0.571.55 ± 0.18109.03 ± 0.061.62 ± 0.180.9979
10% SP7.70 ± 0.628.02 ± 0.731.03 ± 0.16109.07 ± 0.062.43 ± 0.220.9993
10% SP10.63 ± 0.489.22 ± 0.620.90 ± 0.17109.00 ± 0.002.79 ± 0.210.9993
Recovery Phase
J0·10−6 ± SD
(1/Pa)
J0·10−6 ± SD
(1/Pa)
η0·107 ± SD
(Pas)
λ ± SD(s)Je/Jmax
(%)
Jv/Jmax
(%)
R2
Control sample9.16 ± 0.161.05 ± 0.051.72 ± 0.26239.57 ± 0.0659.94 ± 0.9040.06 ± 0.190.9596
5% SP9.80 ± 0.061.93 ± 0.089.45 ± 0.08239.60 ± 0.0046.09 ± 0.8853.91 ± 0.100.8573
10% SP16.48 ± 0.054.67 ± 0.173.89 ± 0.18239.50 ± 0.0058.21 ± 0.7341.79 ± 0.750.9629
10% SP18.05 ± 0.133.13 ± 0.095.81 ± 0.25239.57 ± 0.0643.95 ± 0.3356.05 ± 0.090.9463
Values are presented as the mean value of three measurements ± standard deviation.
Table 4. Texture parameters of the dough for crackers.
Dough SampleHardness ± SD
(g)
Resistance ± SD
(g)
Extensibility ± SD
(mm)
Control sample182.919 ± 2.827 c7.861 ± 0.454 a1.047 ± 0.203 a
5% SP169.336 ± 5.143 b9.360 ± 0.905 b2.354 ± 0.362 b
10% SP160.019 ± 3.466 ab10.619 ± 0.138 c3.214 ± 0.121 c
15% SP158.293 ± 5.993 a12.163 ± 0.472 d3.760 ± 0.181 d
Values are presented as the mean value of three measurements ± standard deviation. a–d Values followed by different letters within the same column are statistically significantly different (p < 0.05) according to post-hoc Tukey’s range test.
Table 5. Correlation analysis between the rheological and textural parameters of the dough for crackers.
VariablesTan δη0JmaxJe/JmaxJv/JmaxHardnessResistanceExtensibility
Tan δ1.0000−0.84450.7526−0.57930.5841−0.92130.93240.9866
p = 0.001p = 0.005p = 0.048p = 0.046p = 0.000p = 0.000p = 0.000
η0 1.0000−0.73060.2580−0.26050.7834−0.9017−0.8440
p = 0.007p = 0.418p = 0.414p = 0.003p = 0.000p = 0.001
Jmax 1.0000−0.26500.2794−0.62430.78130.7610
p = 0.405p = 0.379p = 0.030p = 0.003p = 0.004
Je/Jmax 1.0000−0.99530.6031−0.5719−0.5595
p = 0.000p = 0.038p = 0.052p = 0.059
Jv/Jmax 1.0000−0.62010.57660.5577
p = 0.031p = 0.050p = 0.060
Hardness 1.0000−0.8687−0.8623
p = 0.000p = 0.000
Resistance 1.00000.9187
p = 0.000
Extensibility 1.0000
The red-marked correlation coefficients between the variables are statistically significant (p < 0.05).
Table 6. Color and textural parameters of the crackers.
Cracker SamplesColor Parameters
L* ± SDa* ± SDb* ± SDFirmness
(g)
Control sample75.41 ± 0.13 d1.61 ± 0.12 b25.92 ± 0.11 d232.20 ± 1.42 d
5% SP30.77 ± 0.16 c−6.05 ± 0.19 d−7.39 ± 0.28 c199.09 ± 5.62 c
10% SP27.64 ± 0.26 b−3.18 ± 0.06 c−3.91 ± 0.12 b166.62 ± 5.22 b
15% SP24.90 ± 0.74 a−1.05 ± 0.12 a−2.31 ± 0.46 a114.67 ± 10.16 a
Values are presented as the mean value of three measurements ± standard deviation. a–d Values followed by different letters within the same column are statistically significantly different (p < 0.05) according to post-hoc Tukey’s range test.
Table 7. Correlation analysis between color parameters of crackers determined by instrumental and sensory evaluation.
VariablesL*a*b*Color
L*1.0000−0.31150.9945−0.9842
p = 0.324p = 0.000p = 0.000
a* 1.0000−0.22130.1426
p = 0.489p = 0.658
b* 1.0000−0.9940
p = 0.000
Color 1.0000
The red-marked correlation coefficients between the variables are statistically significant (p < 0.05).
Table 8. Phenolic compound content obtained by the HPLC method.
Cracker SamplesControl ± SD5% SP ± SD10% SP ± SD15% SP± SD
Gallic acid2.13 ± 0.10 a3.65 ± 0.21 b4.59 ± 0.25 c7.43 ± 0.34 d
Protocatechuic acid0.62 ± 0.02 a1.19 ± 0.98 b1.64 ± 0.92 b2.70 ± 1.02 c
Catechin9.61 ± 0.34 a14.40 ± 0.45 b18.27 ± 0.51 c39.79 ± 0.94 d
Epicatechin0.80 ± 0.11 a0.21 ± 0.00 b0.27 ± 0.00 b0.96 ± 0.02 a
Vanillic acid0000
Chlorogenic acid01.36 ± 0.05 a2.65 ± 0.09 b3.56 ± 0.14 c
Ferulic acid0.45 ± 0.02 b0.28 ± 0.01 a00
Sinapic acid0.29 ± 0.01 a0.23 ± 0.01 a0.41 ± 0.02 b1.28 ± 0.04 c
Rutin0.11 ± 0.04 a0.07 ± 0.03 a0.38 ± 0.02 b1.29 ± 0.05 c
Quercetin0.01 ± 0.00 a0.48 ± 0.05 b0.69 ± 0.04 c1.92 ± 0.05 d
Apigenin0.08 ± 0.02 a0.28 ± 0.02 b0.26 ± 0.00 b1.88 ± 0.04 c
Total14.1222.1429.1660.80
Results are expressed as mg/100 g of crackers enriched with different amounts of spirulina powder and as mean values (n = 3) ± standard deviation. a–d Values followed by different letters within the same row are statistically significantly different (p < 0.05) according to post-hoc Tukey’s range test.
Table 9. Antioxidant activity of the samples.
SampleDPPH ± SDRP ± SDABTS●+ ± SD
Control sample0.46 ± 0.04 a2.97 ± 0.81 a2.47 ± 1.43 a
5% SP0.65 ± 0.05 b6.41 ± 0.92 b3.99 ± 0.15 b
10% SP0.72 ± 0.02 b6.98 ± 0.42 b5.69 ± 0.68 c
15% SP1.24 ± 0.07 c17.52 ± 0.51 c6.23 ± 0.64 d
Data present mean value (n = 3) ± SD; results are expressed as μmol (TE)/100 g. a–d Values followed by different letters within the same column are statistically significantly different (p < 0.05) according to post-hoc Tukey’s range test.
Table 10. Chemical composition of crackers with different quantities of spirulina powder.
ComponentsControl Cracker
(%)
5% SP
(%)
10% SP
(%)
15% SP
(%)
Moisture4.95 ± 0.19 a4.80 ± 0.19 a4.62 ± 0.13 a4.56 ± 0.08 a
Carbohydrates66.45 ± 0.05 b61.11 ± 0.55 b55.50 ± 0.20 a48.58 ± 0.17 a
Proteins6.41 ± 0.01 a8.81 ± 0.95 b11.16 ± 0.22 c13.59 ± 0.40 d
Fat19.52 ± 0.43 a19.97 ± 0.60 a20.17 ± 1.20 a20.94 ± 0.25 a
Ash0.54 ± 0.05 a2.59 ± 0.11 b2.91 ± 0.10 b4.07 ± 0.09 c
Total dietary fibers2.05 ± 0.02 a2.61 ± 0.17 a5.58 ± 0.04 b8.01 ± 0.80 c
Energy value
(kcal/100 g dw)
467.12459.41448.17437.14
Values are presented as the mean value of three measurements ± standard deviation. The energy value is calculated [106,107]. a–d Values followed by different letters within the same row are statistically significantly different (p < 0.05) according to post-hoc Tukey’s range test.
Disclaimer/Publisher’s Note: The statements, opinions and data contained in all publications are solely those of the individual author(s) and contributor(s) and not of MDPI and/or the editor(s). MDPI and/or the editor(s) disclaim responsibility for any injury to people or property resulting from any ideas, methods, instructions or products referred to in the content.

