Article

Origin and Hydrocarbon Generation of γ-Alkylbutyrolactones in Permian Shales

1
Key Laboratory of Petroleum Resources Exploration and Evaluation, Northwest Institute of Eco-Environment and Resources, Chinese Academy of Sciences, Lanzhou 730000, China
2
University of Chinese Academy of Sciences, Beijing 100049, China
3
State Key Laboratory of Continental Dynamics, Department of Geology, Northwest University, Xi’an 710069, China
*
Authors to whom correspondence should be addressed.
Processes 2025, 13(4), 1011; https://doi.org/10.3390/pr13041011
Submission received: 23 February 2025 / Revised: 21 March 2025 / Accepted: 25 March 2025 / Published: 28 March 2025
(This article belongs to the Section Energy Systems)

Abstract

:
The Lucaogou Formation in the Santanghu Basin is notable for its abundance of oxygen-containing compounds, especially the γ-alkylbutyrolactone series (GBLs), which were detected for the first time in the shales. However, the origin and geological significance of these compounds in sediment are unclear. In this study, source rock samples from the Lucaogou Formation in the Santanghu Basin were collected and classified into two categories (high-GBL content (Group H); low-GBL content (Group L)) based on gas chromatography–mass spectrometry. The biomarker results indicate that the medium-chain n-alkanes in Group H are more enriched. In addition, the source rocks of both Group H and Group L were formed in a reducing and salinized sedimentary environment. The Rock-Eval pyrolysis results indicate that Group H has high organic matter abundance and organic matter types of I–II1, illustrating the contribution of submerged algae, whereas Group L has low organic matter abundance and organic matter types II2–III. Based on the above results, the GBLs exhibit typical biogenic characteristics and is likely to originate from specific submerged algae. Thermal simulation experiments further confirm that Group H has a greater hydrocarbon generation. Combined with gas isotope evidence, these findings show that the high abundance of GBLs compounds is effectively preserved during the formation of excellent source rocks and promotes the formation of petroleum.

1. Introduction

The Santanghu Basin is a vital continental oil-bearing basin in China [1,2], and many oil and gas reservoirs have been developed in the basin, including tight oil, shale oil, and shale gas [3]. Among them, the Lucaogou Formation corresponds to the most important potential target zones for shale oil exploration in the Santanghu Basin, and several large-scale reservoirs have been discovered in the Malang and Tiaohu sags, demonstrating excellent exploration and development prospects for shale oil [4]. Interestingly, the source rocks of the Lucaogou Formation contain abundant oxygen-containing compounds, including the methylketone series, fatty acid series, δ-alkylvalerolactone series, and γ-alkylbutyrolactones series (GBLs). GBLs are the most abundant, implying a unique source of organic matter and a special depositional environment for shales [5,6,7]. However, due to the low distribution of GBLs in geological carriers, their origin, formation environment, and indicative significance have been controversial in the international organic geochemical community [6]. Hertz et al. [8] first successfully detected GBLs with a carbon number distribution ranging from C7 to C15 in the asphaltene of the Aleksinac shale from the Miocene epoch (about 26 million years ago). Meanwhile, this study also discovered a large number of straight-chain monocarboxylic fatty acids, and they proposed that the cyclization of unsaturated fatty acids might be one of the formation pathways of GBLs. Subsequently, Shimoyama et al. [9] also detected abundant GBLs in the sediments from the Miocene to Pliocene epochs in the Shinji Basin. They further confirmed through thermal simulation experiments that unsaturated fatty acids are the precursors for the formation of GBLs. Modern industry has shown that GBLs are also widely present in fermented products, such as dairy products, beer, and rice wine [10,11]. In addition, studies have shown that GBLs are predominantly found in angiosperm fruits; however, angiosperms appeared in the Early Cretaceous [12]. The detection of these particular oxygenated compounds in Permian shales, where angiosperms have not yet appeared, suggests that the formation of these compounds may have a complex geological or biological background. All of the above evidence collectively indicates that the origin of GBLs remains unclear at present. Therefore, a deep study of the GBLs can contribute to a precise understanding of the organic matter sources and environmental characteristics associated with the development of the Lucaogou Formation and help to identify the parent material sources, depositional environments, and hydrocarbon generation of the GBLs.
Biomarkers are important tools for source rock analyses because they can preserve and record the molecular structure information of the original parent carbon skeleton during evolution. Thus, the distribution characteristics and parameters of biomarkers can be used to determine the organic matter source and depositional environment of source rocks [13,14]. Common biomarkers include n-alkanes, isoprenoid alkanes, terpenes, and steranes [15,16]. The GBLs are similar to the aforementioned compounds and may have originated from a specific biological precursor or from the cyclization of unsaturated fatty acids [17]. Biomarkers can provide insights into the origin and formation environment of GBLs. In addition, the individual hydrocarbon carbon isotopes are able to reflect the origin of individual compounds at the molecular level, and the late depositional and secondary modification processes have little influence on them [18,19], so we can use the individual carbon isotope compositions of the GBLs to further clarify their origins.
The Lucaogou Formation is a critical source rock layer in northern Xinjiang; however, the effect of GBL formation on the source rock quality of the Lucaogou Formation remains uncertain. Rock-Eval pyrolysis provides a comprehensive evaluation of source rock quality [20,21], while focusing on three aspects: organic matter abundance, type, and thermal maturity [22]. Organic matter abundance is an essential index for source rock evaluation, and it is mainly based on total organic carbon (TOC) and the hydrocarbon potential index (PI, i.e., S1 + S2, where S1 and S2 are the amounts of free and pyrolyzed hydrocarbons in the pyrolysis process of source rocks, respectively). Higher values of TOC and S1 + S2 indicate higher organic matter abundance. The organic matter type is an important indicator for determining the hydrocarbon production potential of source rocks and is commonly analyzed on the basis of the hydrogen index (HI), oxygen index (OI), and type index (S2/S3) [23]. Organic matter thermal maturity can be used to measure the degree of organic matter conversion to hydrocarbons based on the maximum pyrolysis temperature (Tmax), vitrinite reflectance (Ro), and biomarker parameters [20]. In short, studies of organic matter abundance, type, and maturity can provide a basis for understanding the amount and degree of thermal evolution of organic matter molecules in hydrocarbon source rocks, which may help to facilitate the study of the GBLs.
In addition, thermal simulation experiments (e.g., hydrocarbon source rock thermal simulation and pyrolysis gas chromatography mass spectrometry) are useful techniques for investigating the hydrocarbon production process and petroleum and gas resource potential of source rocks. Typically, they are used to analyze the hydrocarbon generation characteristics and patterns of source rocks [24,25,26]. Currently, they are widely used in the hydrocarbon generation of source rocks and the evaluation of resource potential [27]. Consequently, thermal simulation experiments can directly investigate the hydrocarbon generation process of the source rocks of the Lucaogou Formation and subsequently reflect the hydrocarbon generation of the GBLs.
This study investigates the parent material source, depositional environment, and hydrocarbon potential of GBLs through organic carbon content, Rock-Eval pyrolysis, molecular geochemistry, individual hydrocarbon carbon isotope, and thermal simulation experiments. The findings improve our understanding of the parent material source and depositional environment of the source rocks of the Lucaogou Formation and their hydrocarbon generation potential. The results also facilitate further assessment of the hydrocarbon generation potential of the source rocks of the Lucaogou Formation and the exploration and development of shale oil.

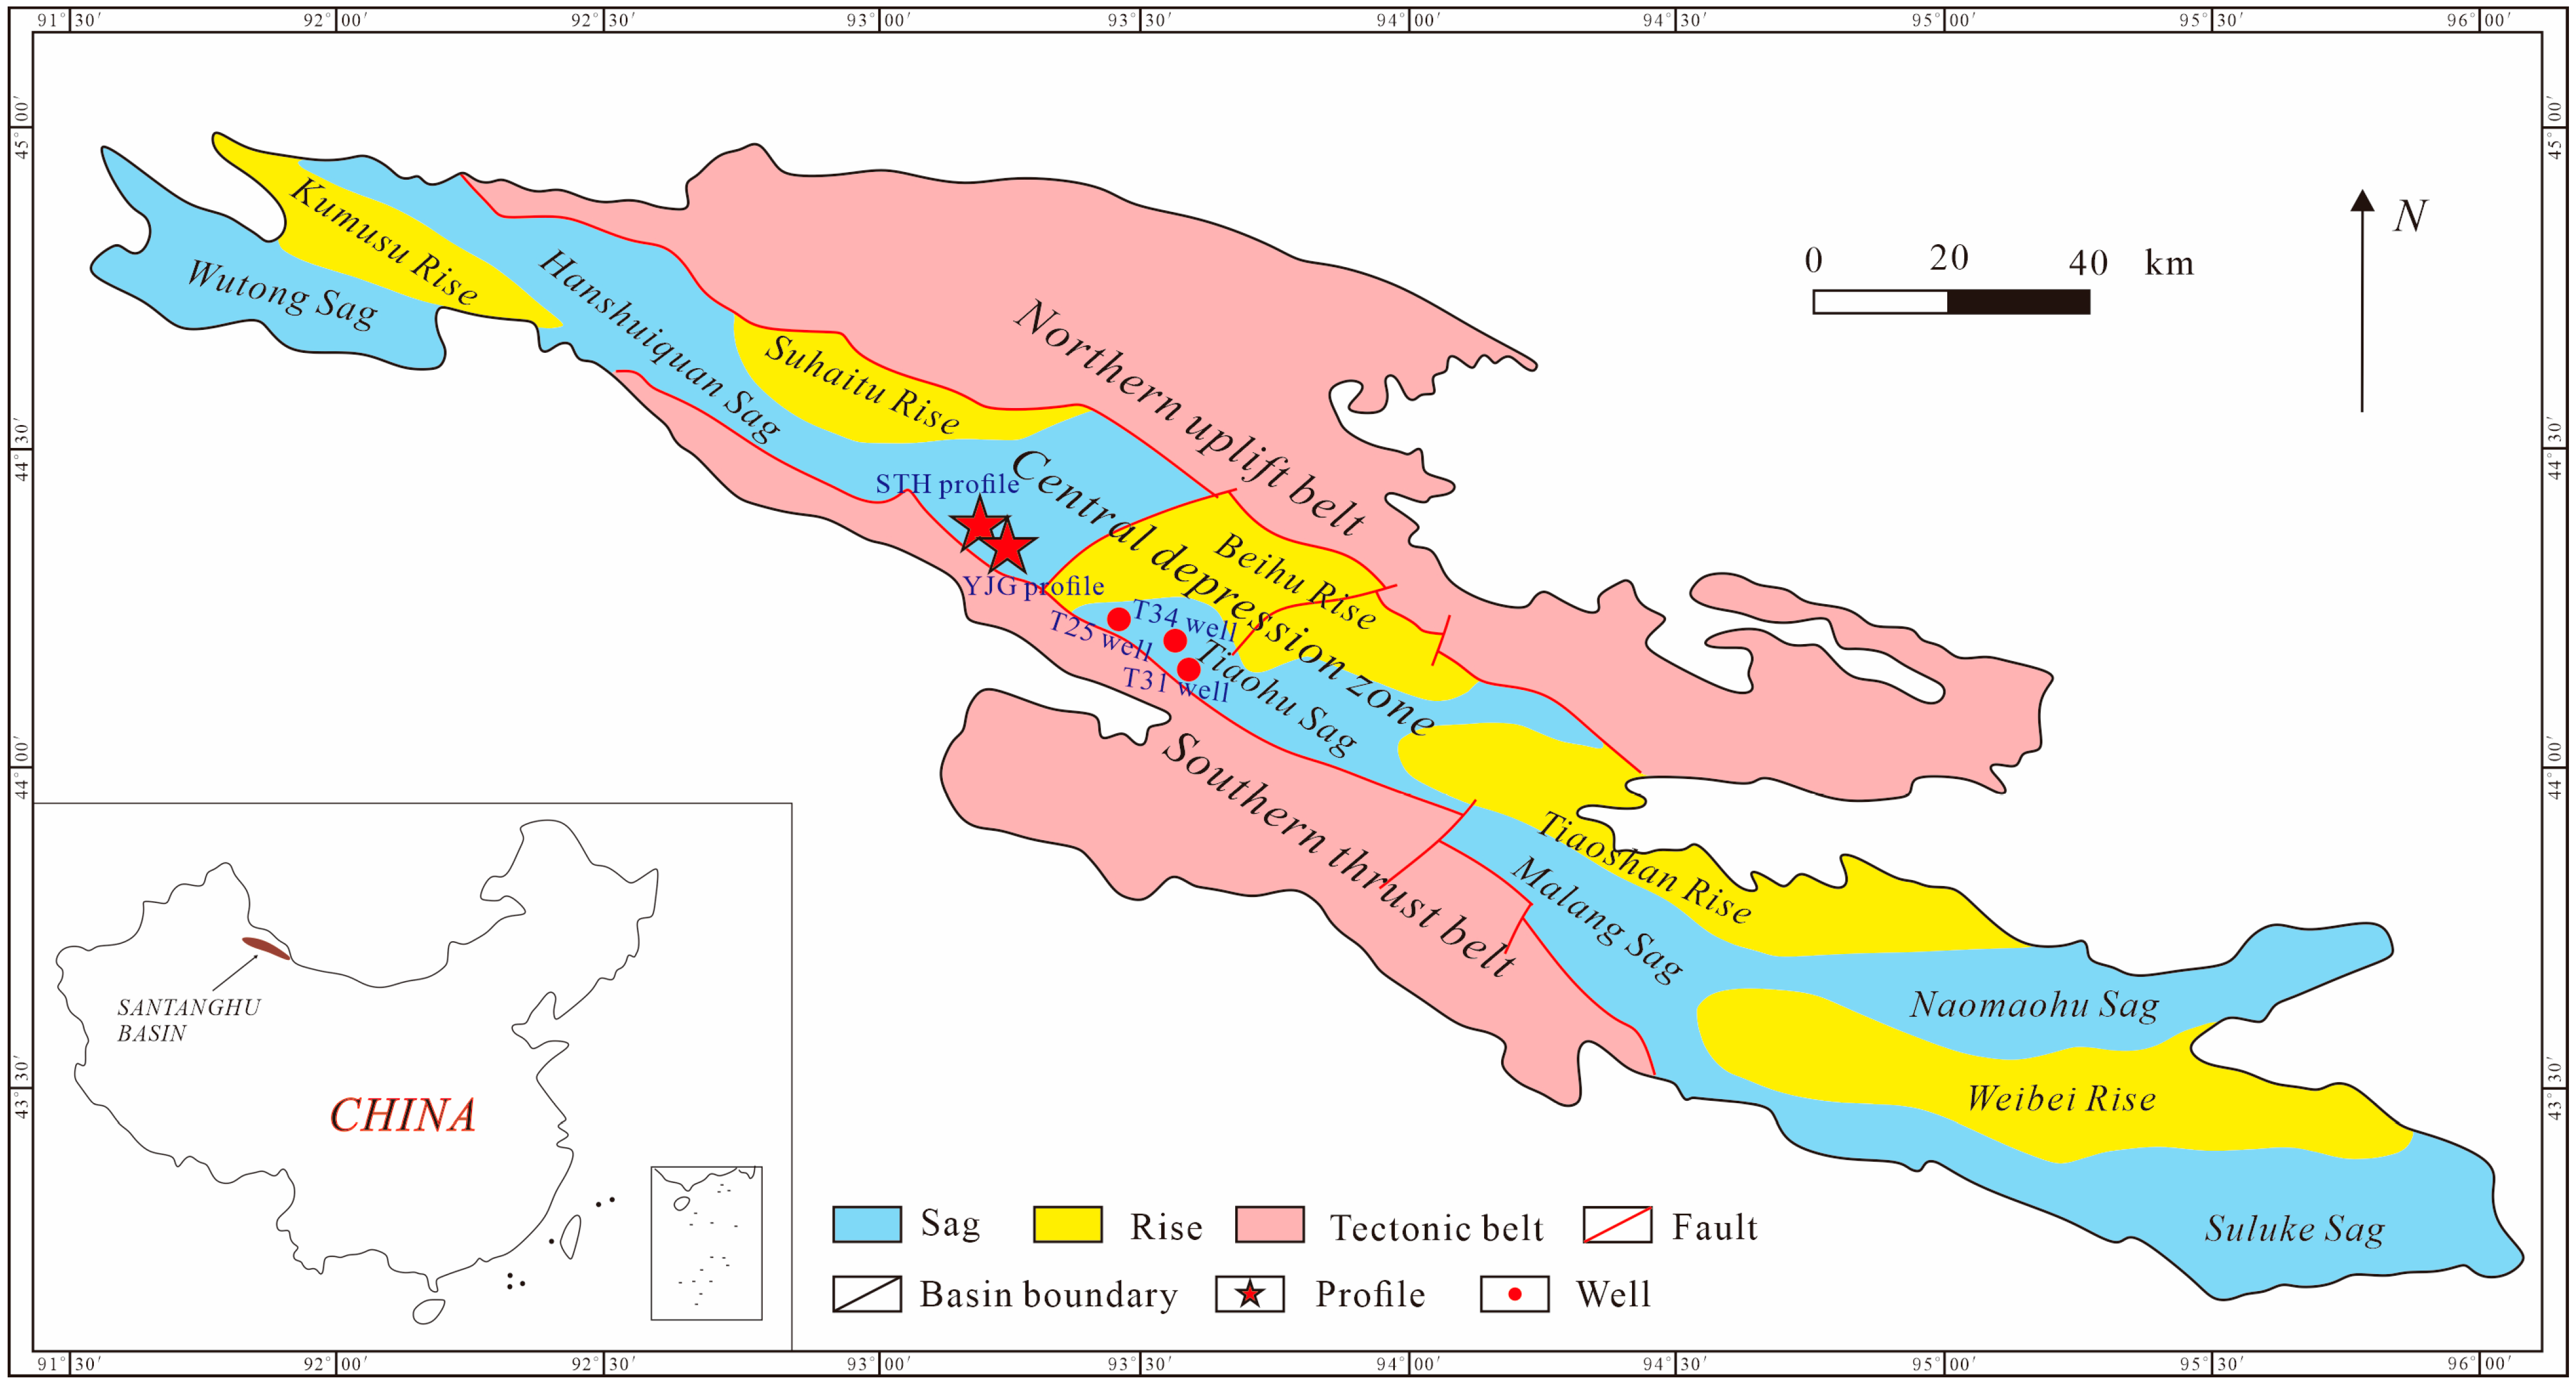
2. Geological Setting

The Santanghu Basin is located in the northeastern region of Xinjiang, China, and spreads along a northwest–southeast trend, with an east–west length of approximately 500 km, a north–south width of approximately 40–70 km, and an area of approximately 2300 km2 [28]. The basin is situated at the collisional junction between the Kazakhstan Plate and the Siberian Plate in terms of its regional tectonic setting, with the Altai Fold Belt to the north and the Tianshan Fold Belt to the south [29]. Based on the Paleozoic orogenic folds, the Santanghu Basin has developed eight sets of sedimentary strata since the Late Carboniferous: Carboniferous, Permian, Triassic, Jurassic, Cretaceous, Paleoproterozoic, Neoproterozoic, and Quaternary. In particular, the Permian is divided into the Lower, Middle, and Upper units, and the Middle Permian is further divided into the Wulapo, Jingjingzigou, Lucaogou, and Tiaohu formations [30]. The Middle Permian Lucaogou Formation is the main source rock interval in the region. The lithology is dominated by tuffaceous dolomite, dolomicrite, cloudy mudstone, and tuffaceous shale.
Tectonic activities in multiple periods and different manners have shaped the current tectonic state of the Santanghu Basin. Based on data such as geological structures, seismic data, and sedimentary cover, the basin can be divided into different tectonic units, as shown in Figure 1, with the following main characteristics: The first-order tectonic units of the basin exhibit a “one depression sandwiched between two uplifts” pattern distributed in a northwest direction. That is, the northeast thrust faulted uplift zone, the southwest thrust nappe uplift zone, and the central depression zone in between [31]. According to the tectonic characteristics of the central depression zone, it can be further divided into 11 secondary tectonic units from the northwest to the southeast, namely the Wutong Sag, the Kumusu Rise, the Hanshuiquan Sag, the Suhaitu Rise, the Tiaohu Sag, the Beihu Rise, the Malang Sag, the Tiaoshan Rise, the Naomaohu Sag, the Weibei Rise, and the Suluke Sag [1], of which the Tiaohu and Malang sags are the main areas for shale oil exploration in the Permian Lucaogou Formation.

3. Samples and Analytical Methods

3.1. Samples

In total, 15 outcrop samples were collected from the Santanghu (STH) profile in the Hanshuiquan Sag, and 9 outcrop samples were collected from the Yuejingou (YJG) profile. Furthermore, six core samples were collected from three wells (T25, T31, and T34) in the Tiaohu sag. Among them, the depth range of the core from Well T25 is 3056.00–3058.00 m, the depth range of the core from Well T34 is 3286.00–3290.75 m, while the depth range of the core from Well T31 is relatively shallower, mainly distributed between 640.39 m and 1000.58 m. The detailed sampling information is presented in Figure 1 and Table S1.

3.2. Organic Carbon Content, Rock-Eval Pyrolysis, and Vitrinite Reflectance

The organic carbon content was measured using a LECO CS900 high-frequency infrared carbon and sulfur analyzer. The testing method was based on the Chinese national standard GB/T 19145-2022 [32]. Before the tests, the source rock samples were pulverized to less than 80 mesh and weighed in a crucible at approximately 0.2 g, and their mass values were recorded. A sufficient amount of a 5% hydrochloric acid solution was added along the wall of the crucible to ensure that the sample was uniformly dissolved in the acid solution. After 24 h of reaction, the acid solution was evaporated to one-third of its volume and cooled to about 25 °C (taking care not to dry it out, as this would affect the results). The sample in the crucible was washed to neutrality and placed in an incubator to dry at a constant temperature (25 °C). Subsequently, the analysis of the total organic carbon content was carried out. Each sample was analyzed at least twice, and the average value was calculated as the final result.
The Rock-Eval pyrolysis instrument used in this study was Rock-Eval 6. This method involves heating rock samples containing organic matter with a programmed temperature rise in an inert gas atmosphere. Then, a hydrogen flame ionization detector and a thermal conductivity detector are respectively used to quantitatively detect and analyze the hydrocarbons and carbon dioxide released from the organic matter in the rock samples. First, crush the source rock samples to less than 200 mesh, dry them at a low temperature, and then weigh approximately 100 mg for pyrolysis analysis. The temperature was increased according to the Chinese national standard GB/T 19145-2022 [32] to obtain the free hydrocarbon content S1 per unit mass of source rock detected at 100 °C–300 °C; the cracked hydrocarbon content S2 per unit mass of source rock was detected at 300 °C–550 °C, and the temperature corresponding to the maximum point of the S2 peak (Tmax). Each sample was analyzed three times to ensure the accuracy of the data.
The vitrinite reflectance (Ro) testing instrument used in this study was a German Zeiss microphotometer (Axio Scope A1 and J M). This method uses a petrographic microscope to observe the surface of highly polished rock powder under reflected light. It is the percentage of the intensity of the reflected light from the polished surface of the vitrinite group at a wavelength of 546 nm to the intensity of the vertically incident light. The testing method was carried out in accordance with the Chinese national standard SY/T 5214-2012 [33]. First, the extracted solid residues were dried under vacuum at 40 °C for 6 h. Subsequently, random Ro measurements were performed under a microscope using the oil immersion objective method. The average Ro values for each sample were calculated using a dataset of 20 measurement points with a standard deviation range of 0.07–0.23 at a laboratory temperature of 23 °C.

3.3. Molecular Geochemistry

The pulverized samples (about 200 g) were extracted for 72 h using the Soxhlet extraction method [34,35]. After asphaltene precipitation, the extracts were separated by column chromatography (silica gel:basic alumina = 3:1, V:V), and the saturated, aromatic, and polar fractions were eluted with n-hexane, benzene, and dichloromethane, respectively. Subsequently, the three fractions were analyzed by gas chromatography–mass spectrometry (GC–MS).
The GC–MS instrument used in this study was a 6890N–GC/5973N–MSD (Agilent Technologies, Santa Clara, CA, USA). The testing method was carried out in accordance with the Chinese national standard GB/T 18606-2017 [36]. The chromatographic column was KD-5 (30 m × 0.32 mm × 0.25 μm), and the column was manufactured by the Research and Development Center of Chromatography Technology, Lanzhou Institute of Chemical Physics, Chinese Academy of Sciences. The oven heating procedure was at a constant temperature of 80 °C for 1 min, then from 80 °C to 290 °C at a rate of 4 °C/min, and finally a constant temperature of 290 °C for 30 min. The temperature of the chromatographic inlet was 280 °C, and the carrier gas was high-purity helium, with the flow rate being 1.2 mL/min. The mass spectrometry ion source was electron ionization, and the ionization energy was 70 eV. The ion source temperature was 230 °C, and the quadrupole-rod temperature was 150 °C. Full scans were adopted, and the mass scanning range was 10–650 amu. The saturated, aromatic, and polar fractions were tested using the above analytical methods. The NIST02L spectral library was used for the qualitative analysis of the compounds, and the peak areas were applied to calculate the relevant biomarker compound parameters.

3.4. Carbon Isotope Analysis of Individual Hydrocarbons

The saturated and polar fractions were used for carbon isotope testing of n-alkanes and GBLs individuals, respectively. GC-IRMS analysis was performed on an Agilent 7890 gas chromatograph (Agilent Technologies, Santa Clara, CA, USA) equipped with an HP-Pona column (50 m × 0.20 mm × 0.50 μm) and connected to a Thermo Scientific Delta Plus V isotope ratio monitoring mass spectrometer (Thermo Fisher Scientific, Waltham, MA, USA). The testing method was carried out in accordance with the Chinese national standard GB/T 18340.2-2010 [37]. The GC oven was ramped up from 80 °C to 290 °C at a rate of 2 °C/min (constant temperature maintained for 15 min). The carrier gas was high-purity helium gas, and the flow rate was set at 0.8 mL/min. The temperature of the injector was set at 280 °C to ensure that the sample could be rapidly vaporized and effectively enter the chromatographic column for separation and analysis. The temperature of the oxidation furnace was 350 °C, the furnace temperature was 850 °C, and the temperature of the vaporization chamber was 220 °C. Each sample was tested at least three times, and the results are shown as average values. The reproducibility of GC-IRMS data was better than 1‰.

3.5. Thermal Simulation Experiment

The thermal simulation experimental device used in this study comprised a reaction kettle (a tube furnace with an adjustable heating rate) and a gas chromatograph (GC 9720 Plus, Foley Instruments, Wenling, China). The experimental samples were pulverized to 100 mesh and then placed in the middle of a 60-cm-long quartz tube, which was filled with quartz rods that did not extend beyond the length of the tube, and the free space at each end was filled with quartz wool. The quartz tube was fixed in the tube furnace heating kettle to position the sample in the center heating section of the tube furnace. Subsequently, the quartz tube was purged of air using argon gas and checked for air tightness.
The temperature of the tube furnace heating kettle in the experiment was increased from ambient temperature to 150 °C in 20 min, and pyrolysis was then performed at a heating rate of 1 °C/min. The temperature points used for this experiment were 150–990 °C at 60 °C intervals. Gas chromatography was used to detect gas products at each temperature point, and the generated gas was collected at each temperature section using the water displacement gas collection method.

3.6. Carbon Isotope Analysis of Carbon Dioxide (CO2)

Carbon isotope analyses were performed on CO2 of the thermal simulation collection gases using a Thermo Scientific MAT 253 Plus mass spectrometer (GC-IRMS) equipped with a Trace GC 1310 gas chromatograph (Thermo Fisher Scientific, Waltham, MA, USA). The analysis conditions were as follows: the column was HP-PLOT/Q (30 m × 0.32 mm × 20 μm); the carrier gas was high-purity helium (flow rate 1.2 mL/min); the split ratio was 10:1; the beginning temperature of the column chamber was 40 °C. After 3 min of constant temperature, the temperature was increased to 200 °C at a rate of 16 °C/min and maintained for 2 min; the temperature of the inlet port was 200 °C; the temperature of the oxidizing furnace was 1000 °C; the temperature of the cracking furnace was 1420 °C. Carbon isotope values were calibrated against the reference gas and analyzed using the V-PDB standard with an accuracy of ±0.3‰. The results are presented as δ, in units of ‰.

3.7. Pyrolysis Gas Chromatography Mass Spectrometry (Py–GC–MS)

The analysis was performed using an Agilent 7890/7000B GC (Agilent Technologies, Santa Clara, CA, USA) triple quadrupole mass spectrometer equipped with a Py3030D pyrolyzer (Frontier Laboratories Ltd., Koriyama, Japan). The corresponding pyrolysis temperature, heating rate and constant temperature time are set in the control software of the pyrolyzer, and the alloy sample cup containing the sample is put into the pyrolysis furnace. After the pyrolysis started, the volatile products generated during the pyrolysis process entered the column directly and were trapped by the high purity nitrogen cooled all the way through the liquid nitrogen in the alloy column at −190 °C. At the end of pyrolysis, the nitrogen gas cooled by liquid nitrogen was turned off, and the pyrolysis products trapped in the alloy column began to be analyzed and identified by gas chromatography-mass spectrometry (GC–MS).
In the low-temperature range of 100 °C–300 °C, light hydrocarbons with weak adsorption and strong volatility in the source rock are preferentially released. This is crucial for understanding the composition of hydrocarbons generated in the early stage of the source rock. The range of 300 °C–500 °C is the main pyrolysis interval for a large number of hydrocarbon-generating parent materials in the source rock. Macromolecular organic substances such as GBLs begin to undergo significant thermal cracking reactions, generating a series of hydrocarbon compounds with medium molecular weights. Under high-temperature conditions (500 °C–700 °C), the more difficult-to-decompose parts continue to pyrolyze. This process helps to understand the hydrocarbon-generating capacity of the source rock at the high maturity stage. Therefore, the pyrolyzer heating program was 100 °C–300 °C, 300 °C–500 °C, and 500 °C–700 °C, respectively, with a heating rate of 50 °C/min, and the final temperature was retained for 5 min at the end of each temperature section, and continuous pyrolysis experiments were carried out on the polar fractions in three temperature sections.
The chromatographic column was UA5-30M-0.25F (30 m × 0.25 mm × 0.25 μm), and the initial temperature of the column oven was 40 °C (constant temperature for 1 min), which was increased to 100 °C at 2 °C/min, and then increased to 290 °C at 6 °C/min (constant temperature for 30 min). An enhanced EI source (70 eV) was used, with an ion source temperature of 230 °C and a quadrupole temperature of 150 °C, and in full scan mode (scanning range 10–650 amu). During the process of compound identification, the NIST 14 spectral library was used as the reference standard.

4. Results and Discussions

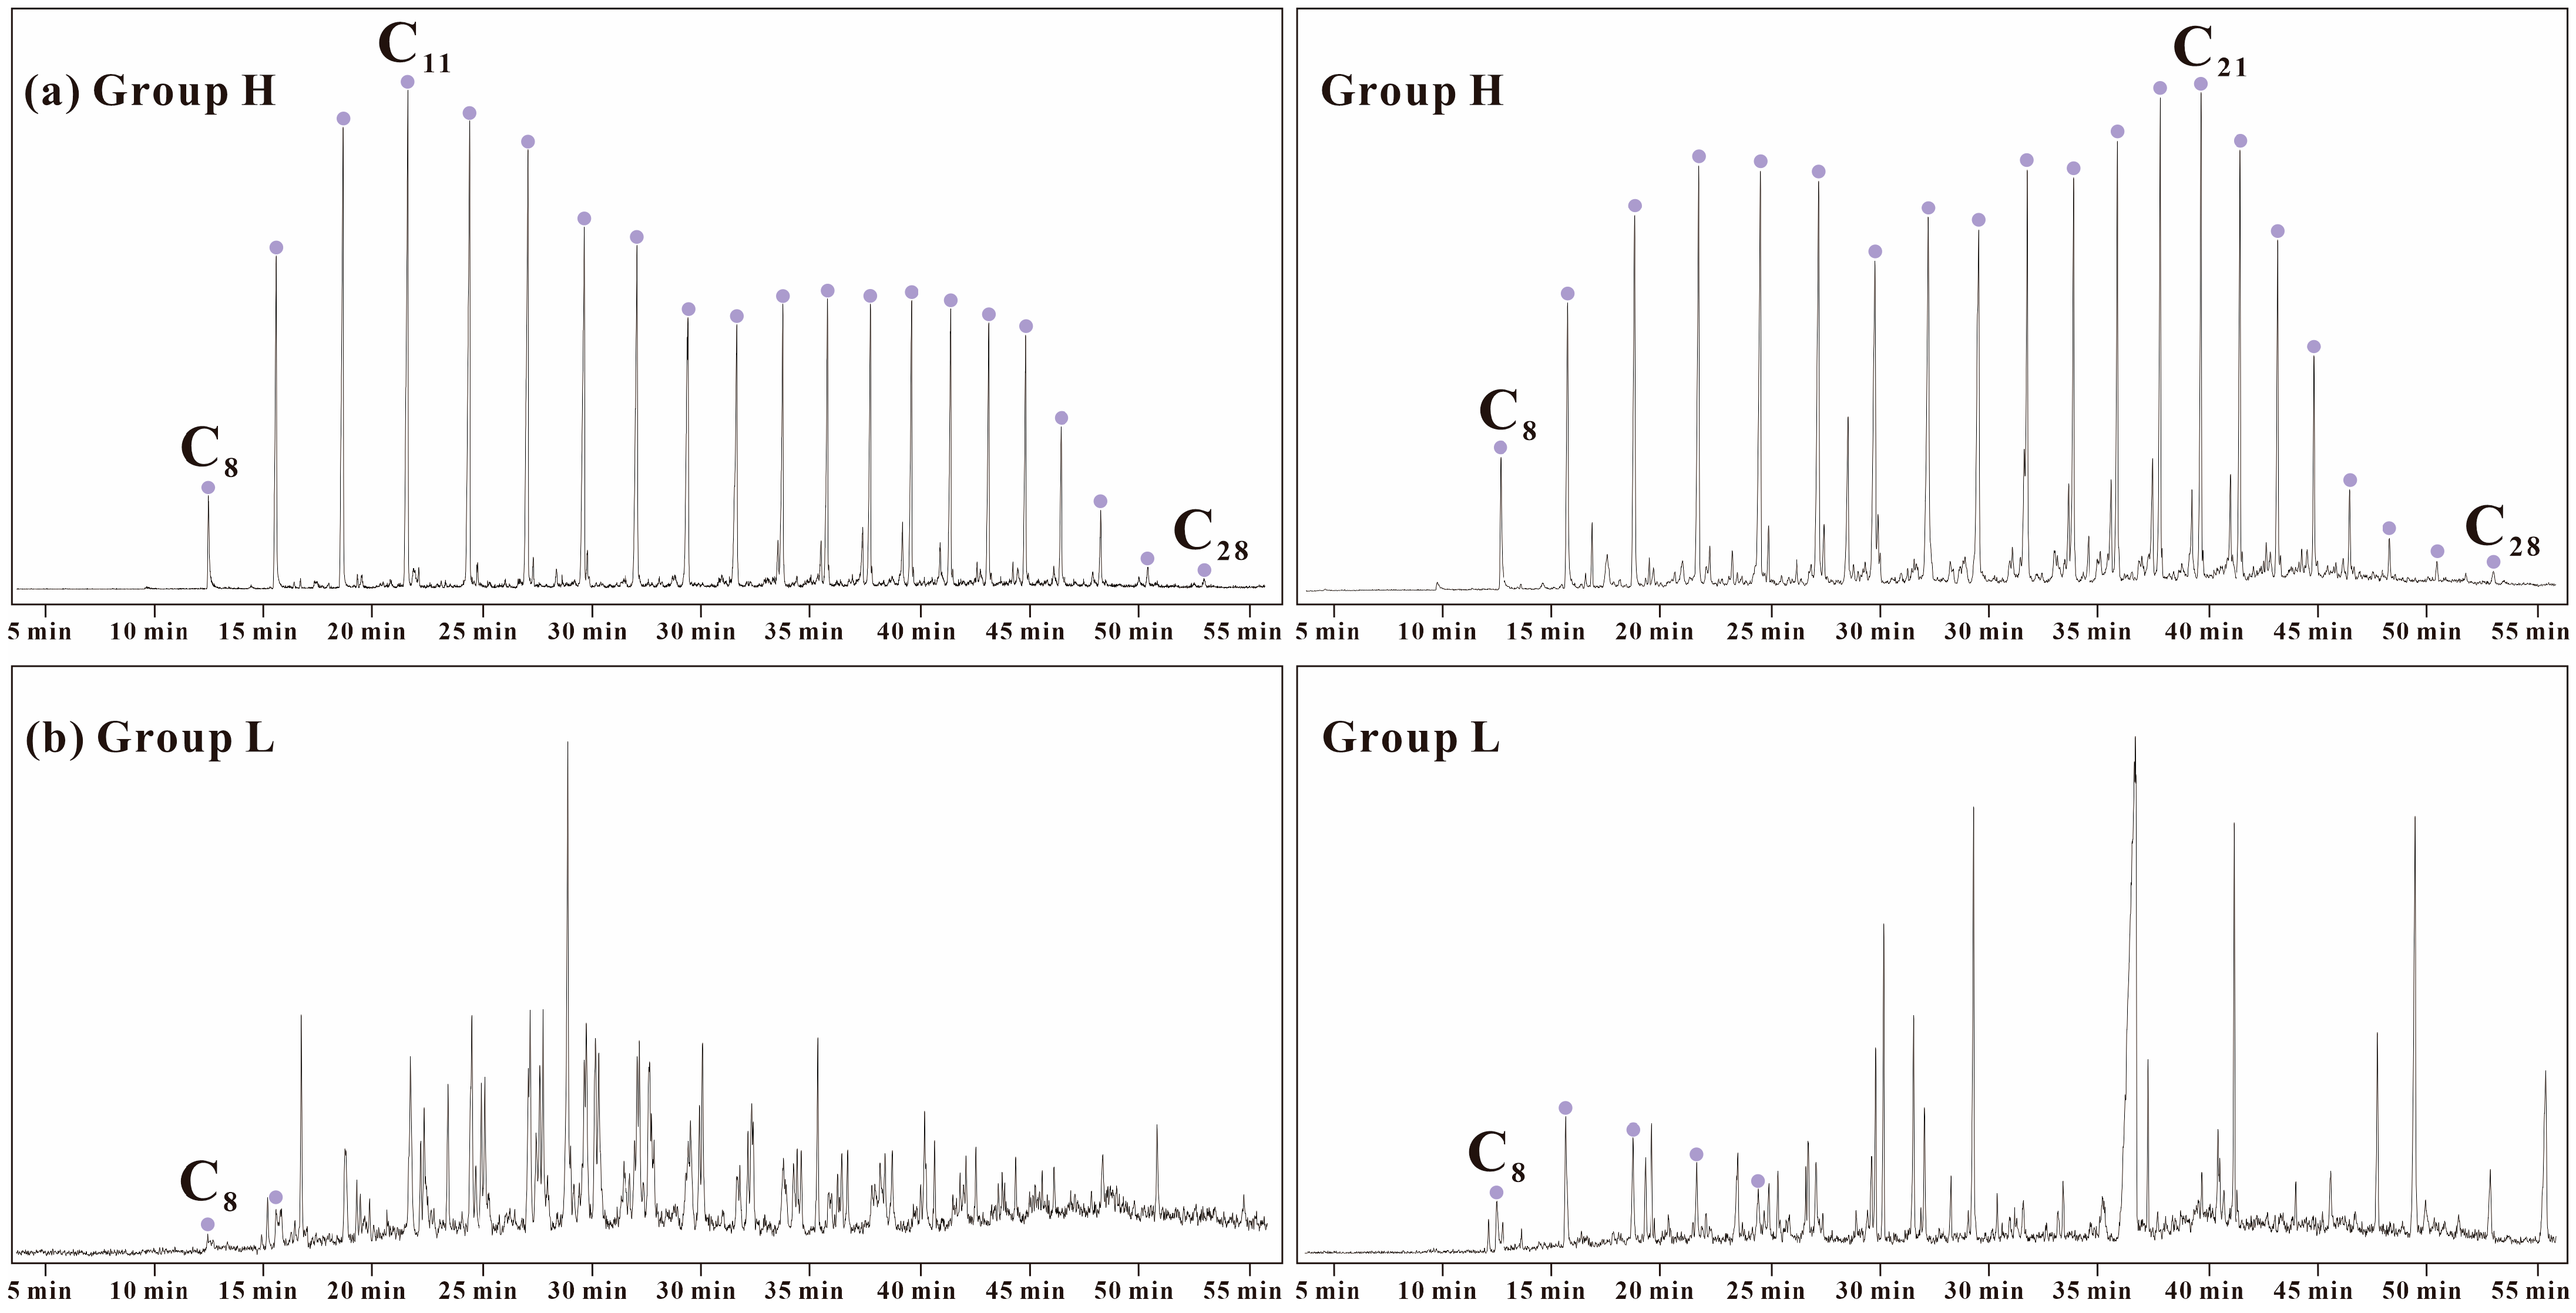
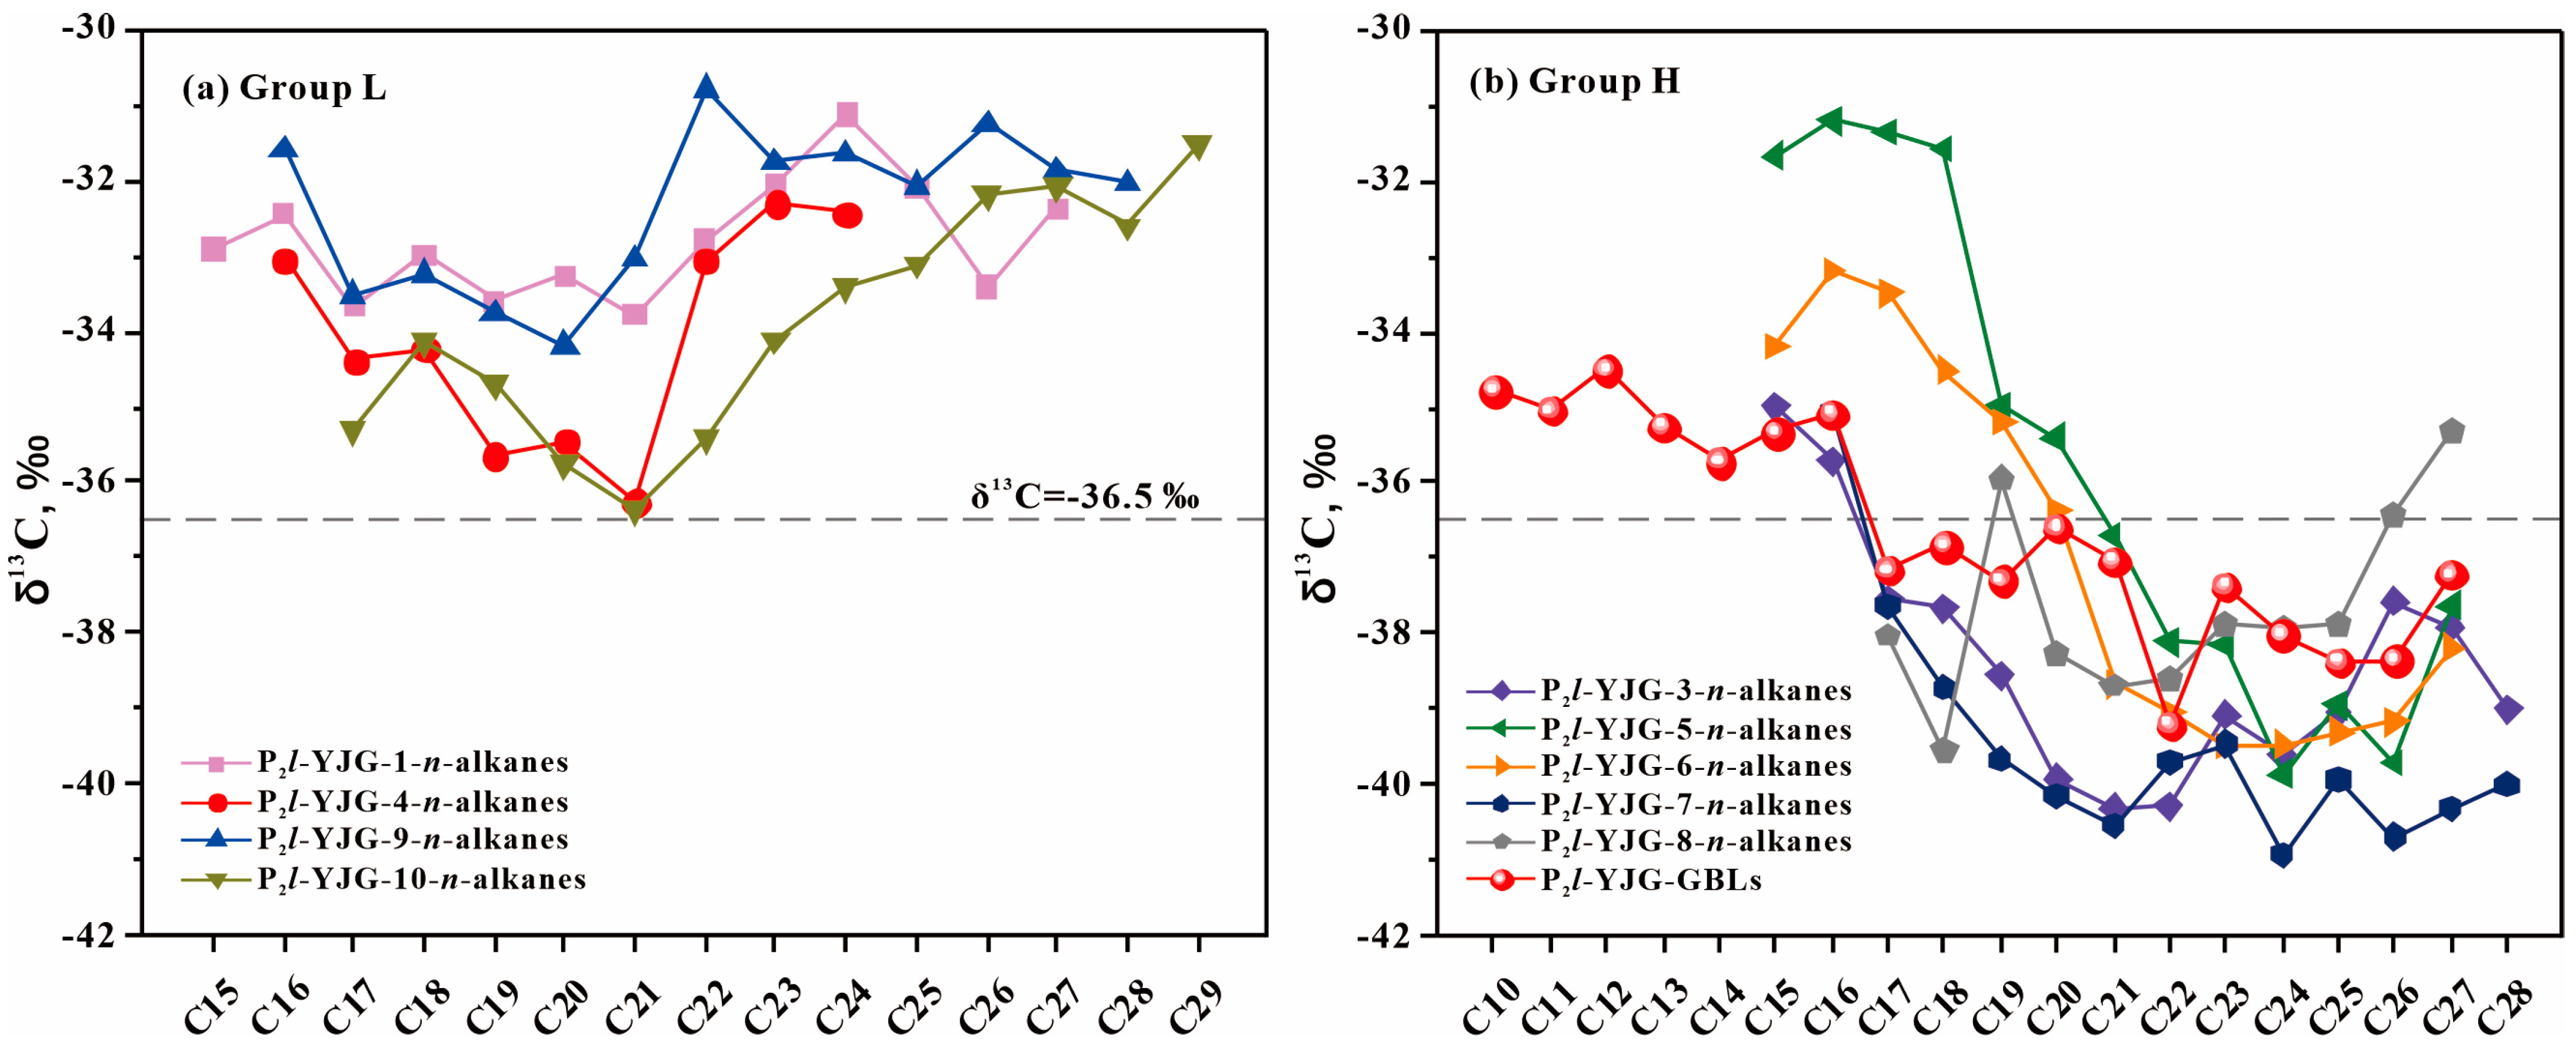
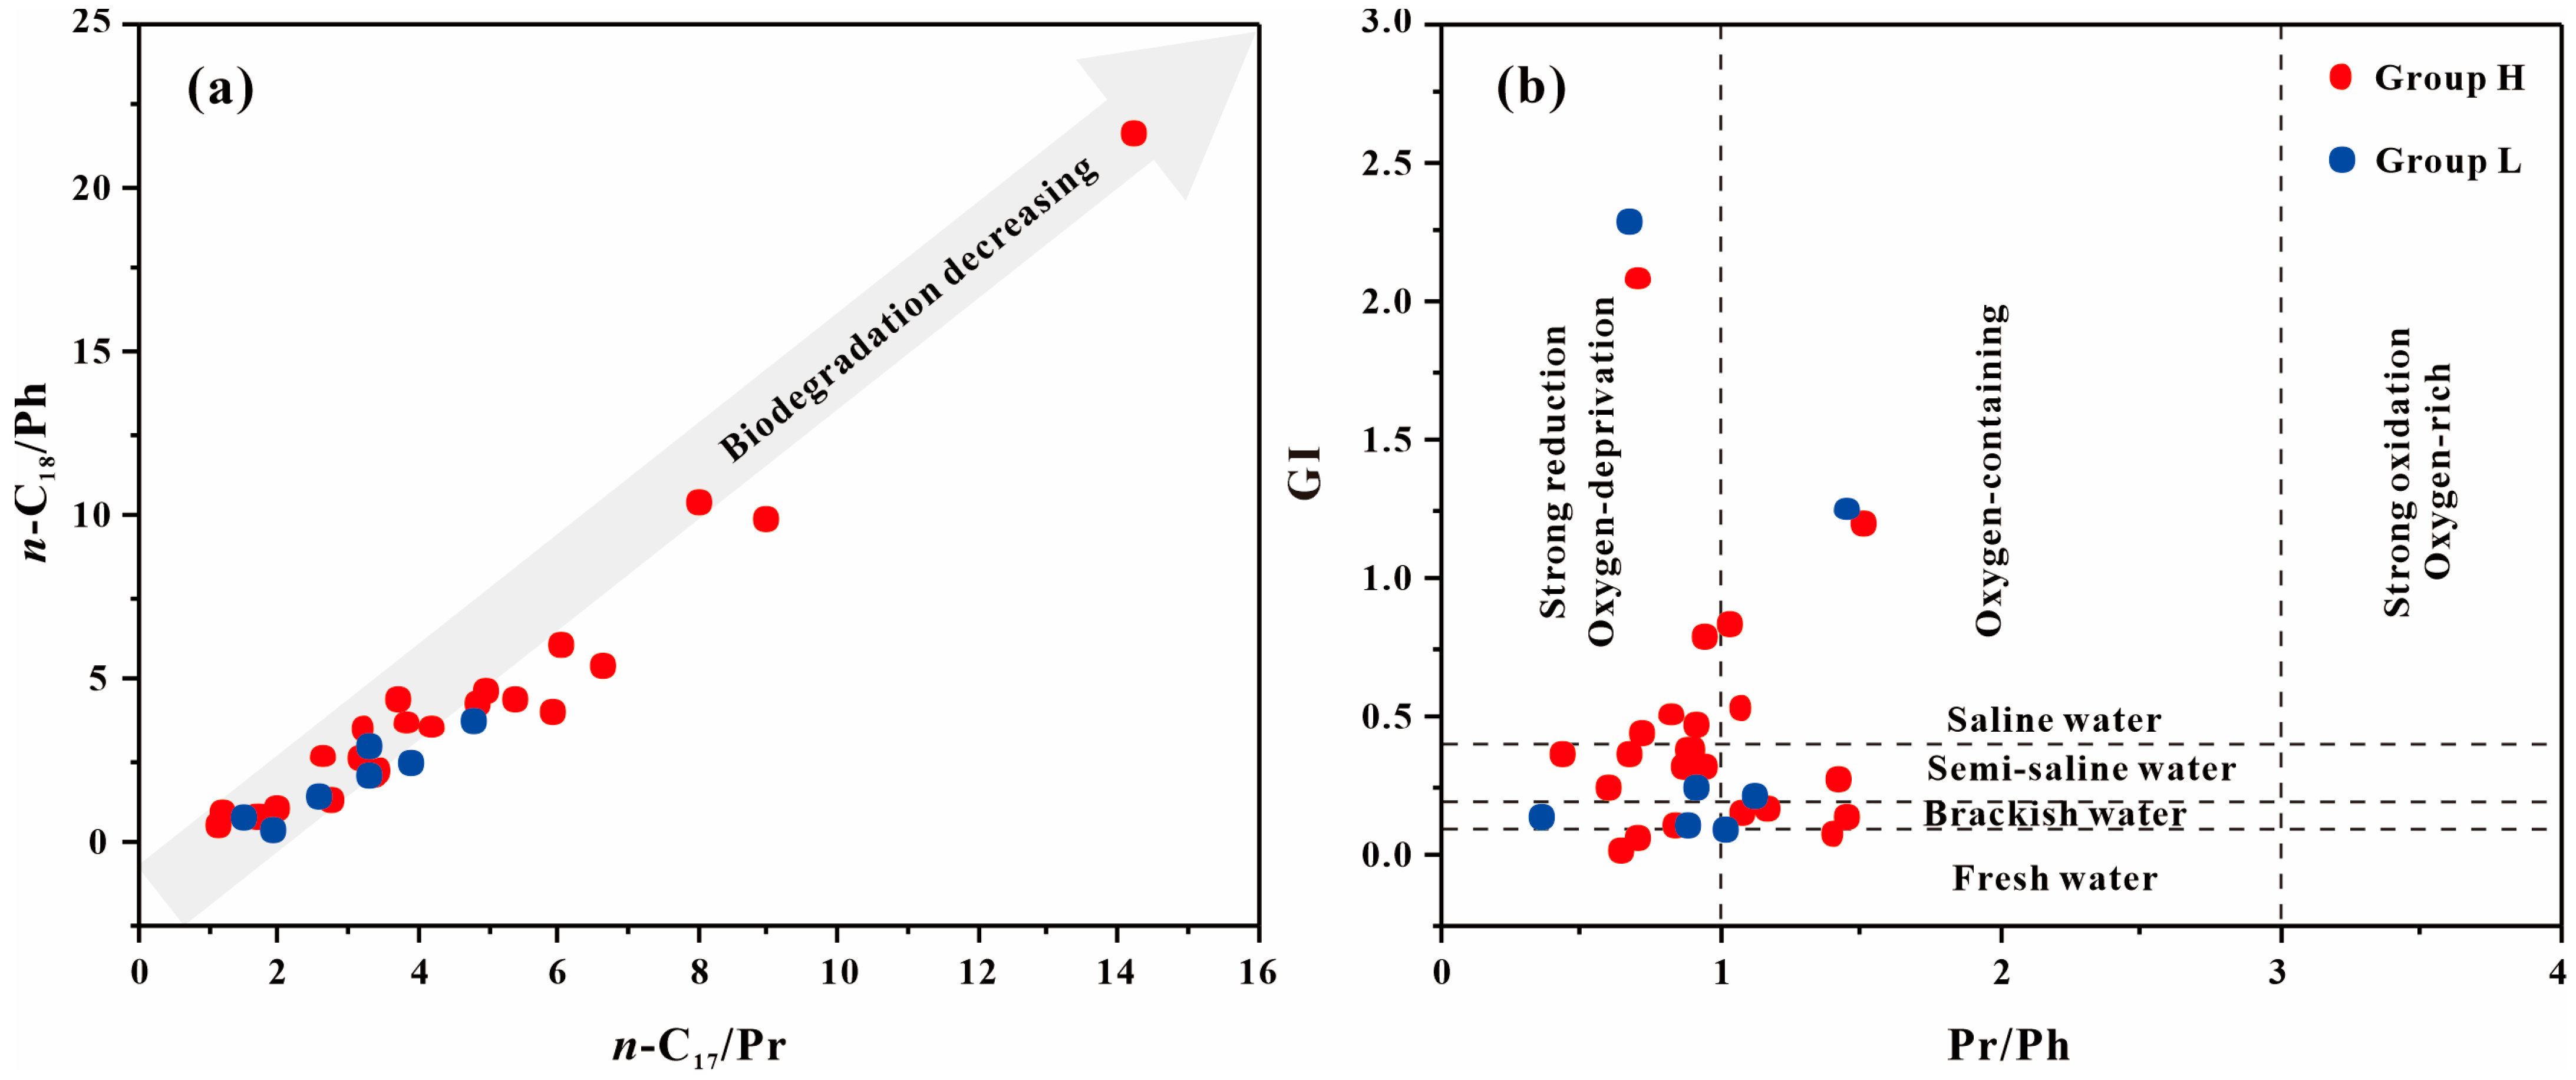
4.1. Source and Depositional Environment of GBLs

The polar fractions in the source rock extracts of the Lucaogou Formation in the Santanghu Basin comprise the largest proportion (Table 1), primarily including GBL series compounds, with carbon numbers ranging from C6 to C28 (Figure 2). Given that GBLs are fingerprint information inherited from the evolution of organic matter at the molecular level, biomarkers can be used to explore their parent material sources and formation environments. According to differences in GBL content, the source rock samples were classified into two groups: high-GBL content (Group H, Figure 2a) and low-GBL content (Group L, Figure 2b).
The distribution of n-alkanes is closely related to the parent material source and sedimentary environment [38,39,40]. The distribution of n-alkane in the samples ranges from n-C14 to n-C31, of which the main peak carbon number is n-C17, and a few are n-C23. The aquatic plant contribution ratio (Paq; the Paq index is calculated as (n-C23 + n-C25)/(n-C23 + n-C25 + n-C29 + n-C31)) is commonly used to indicate the relative abundance of aquatic plants to terrestrial higher plants [41], with Paq values greater than 0.4 reflecting a greater proportion of aquatic plants [42]. In Group H, the Paq values vary from 0.77 to 1.00, whereas, in Group L, they vary from 0.57 to 0.96 (Table 1), indicating a significant contribution from aquatic plants in both source rock groups. High-carbon number n-alkanes (n-C27n-C33) may indicate organic matter inputs from terrestrial sources [43], medium-chain n-alkanes (n-C21n-C25) are mainly from submerged plants [44], and short-chain n-alkanes (<n-C20) suggest lower aquatic organism sources [45]. Group H is characterized on a molecular level by the dominance of medium-chain n-alkanes (n-C21n-C25), whereas Group L is predominantly composed of short-chain n-alkanes (n-C14n-C20, Figure 3a), indicating that the organic matter in Group L is predominantly composed of bacteria and algae and that Group H may have been derived from submerged plants. Therefore, the GBLs may have originated from submerged algae species. In addition, steranes originate mainly from algae and higher land plants, and a strong contribution from C27 steranes is characteristic of algal input, whereas the dominance of C29 steranes is associated with terrestrial higher plants [46]. As shown in Figure 3b, the organic matter sources of the two source rock groups are primarily dominated by aquatic algae, combining evidence of the predominance of medium-chain n-alkanes in Group H, which further illustrates that GBLs are possibly derived from algae in submerged plants [47].
In addition to biomarkers, individual hydrocarbon carbon isotopes also contain rich geochemical information, which is mainly influenced by the organic matter source, and the late depositional and secondary modification processes have little influence on the molecular individual carbon isotope composition, which can solve the problem of the compound source [19]. The distribution of carbon isotope values of n-alkane individual carbon isotopes in Group H ranges from −40.9‰ to −31.2‰ (Figure 4a), that of n-alkane individual carbon isotopes in Group L ranges from −36.4‰ to −30.8‰, and that of GBLs individual carbon isotope values ranges from −39.2‰ to −34.5‰ (Figure 4b). Compared to Group L, carbon isotope values of n-alkane individual carbon isotopes of Group H with carbon numbers greater than C18 are significantly negative. With the increase of carbon number, the individual isotope values of n-alkanes in Group L show a tendency of decreasing, then increasing, and leveling off, while Group H has the characteristic of decreasing and leveling off, which is similar to the trend of individual carbon isotope values of GBLs. Previous studies have shown that the carbon isotope compositions of compounds from the same source are similar, while the carbon isotope compositions of compounds from different sources are slightly different [48]. The distribution range of individual carbon isotope values of n-alkanes in Group H and GBLs is more consistent, and with the increase of carbon number, they have the pattern of decreasing and leveling off, which indicates that GBLs and n-alkanes have the same parent material source, and further suggests that n-alkanes can be formed by the decarboxylation of GBLs and also proves that GBLs have hydrocarbon generation.
Organic matter molecules vary in their resistance to biodegradation [49]. Isoprenoid alkanes are more resistant to biodegradation than n-alkanes. Thus, the n-C17/Pr and n-C18/Ph ratios can be used to identify the degree of biodegradation of organic molecules in source rocks. With increasing biodegradation, the n-C17/Pr and n-C18/Ph ratios decrease progressively [50]. In Group H, n-C17/Pr and n-C18/Ph values are in the range of 1.09–14.20 and 0.64–21.74, respectively, whereas, in Group L, they are in the range of 1.48–4.78 and 0.44–3.84, respectively (Table 1). As illustrated in the Pr/n-C17 vs. Ph/n-C18 diagram (Figure 5a), some Group H samples exhibit significantly less biodegradation than Group L samples. Compared with the source rocks in Group L, those in Group H are more enriched in the GBLs. This indicates that the increase in the degree of biodegradation does not affect the formation of GBLs.
The chlorophyll a or b phytol side chains in photosynthetic organisms are considered the sources of pristane (Pr) and phytane (Ph), and different redox conditions cause phytol side chains to convert in various ways, with oxidizing conditions producing Pr and reducing conditions producing Ph [51]. In general, the Pr/Ph ratio is closely related to oxidation–reduction conditions [52]; a high Pr/Ph value indicates a more oxidizing depositional environment (Pr/Ph > 3.0), whereas a low Pr/Ph value indicates a more reducing environment (Pr/Ph < 0.8). In Group H, the Pr/Ph values vary from 0.42 to 1.50, whereas, in Group L, they vary from 0.35 to 1.45 (Figure 5b; Table 1), suggesting that the redox conditions of source rock development are not a significant factor causing differences in GBL contents and that both groups are formed in reduced sedimentary environments.
Gammacerane is derived from tetrahymanol synthesized by bacterivorous ciliates under stratified water conditions, and water stratification is typically caused by salinity differences. Thus, gammacerane enrichment can represent high-salinity sedimentary environments and water stratification [53]. In the study area, the GI values range from 0.03 to 2.09 for Group H and 0.11 to 2.29 for Group L (Figure 5b; Table 1), suggesting no difference in the degree of salinity of the water bodies between the two source rock groups, which are both formed in semi-saline to saline sedimentary environments.
In summary, the biomarker results suggest that GBL formation is mainly related to the parent material source, which may have been derived from submerged algae species. In addition, GBLs are primarily formed in reducing and saline lacustrine environments, whereas biodegradation slightly affects GBL formation.

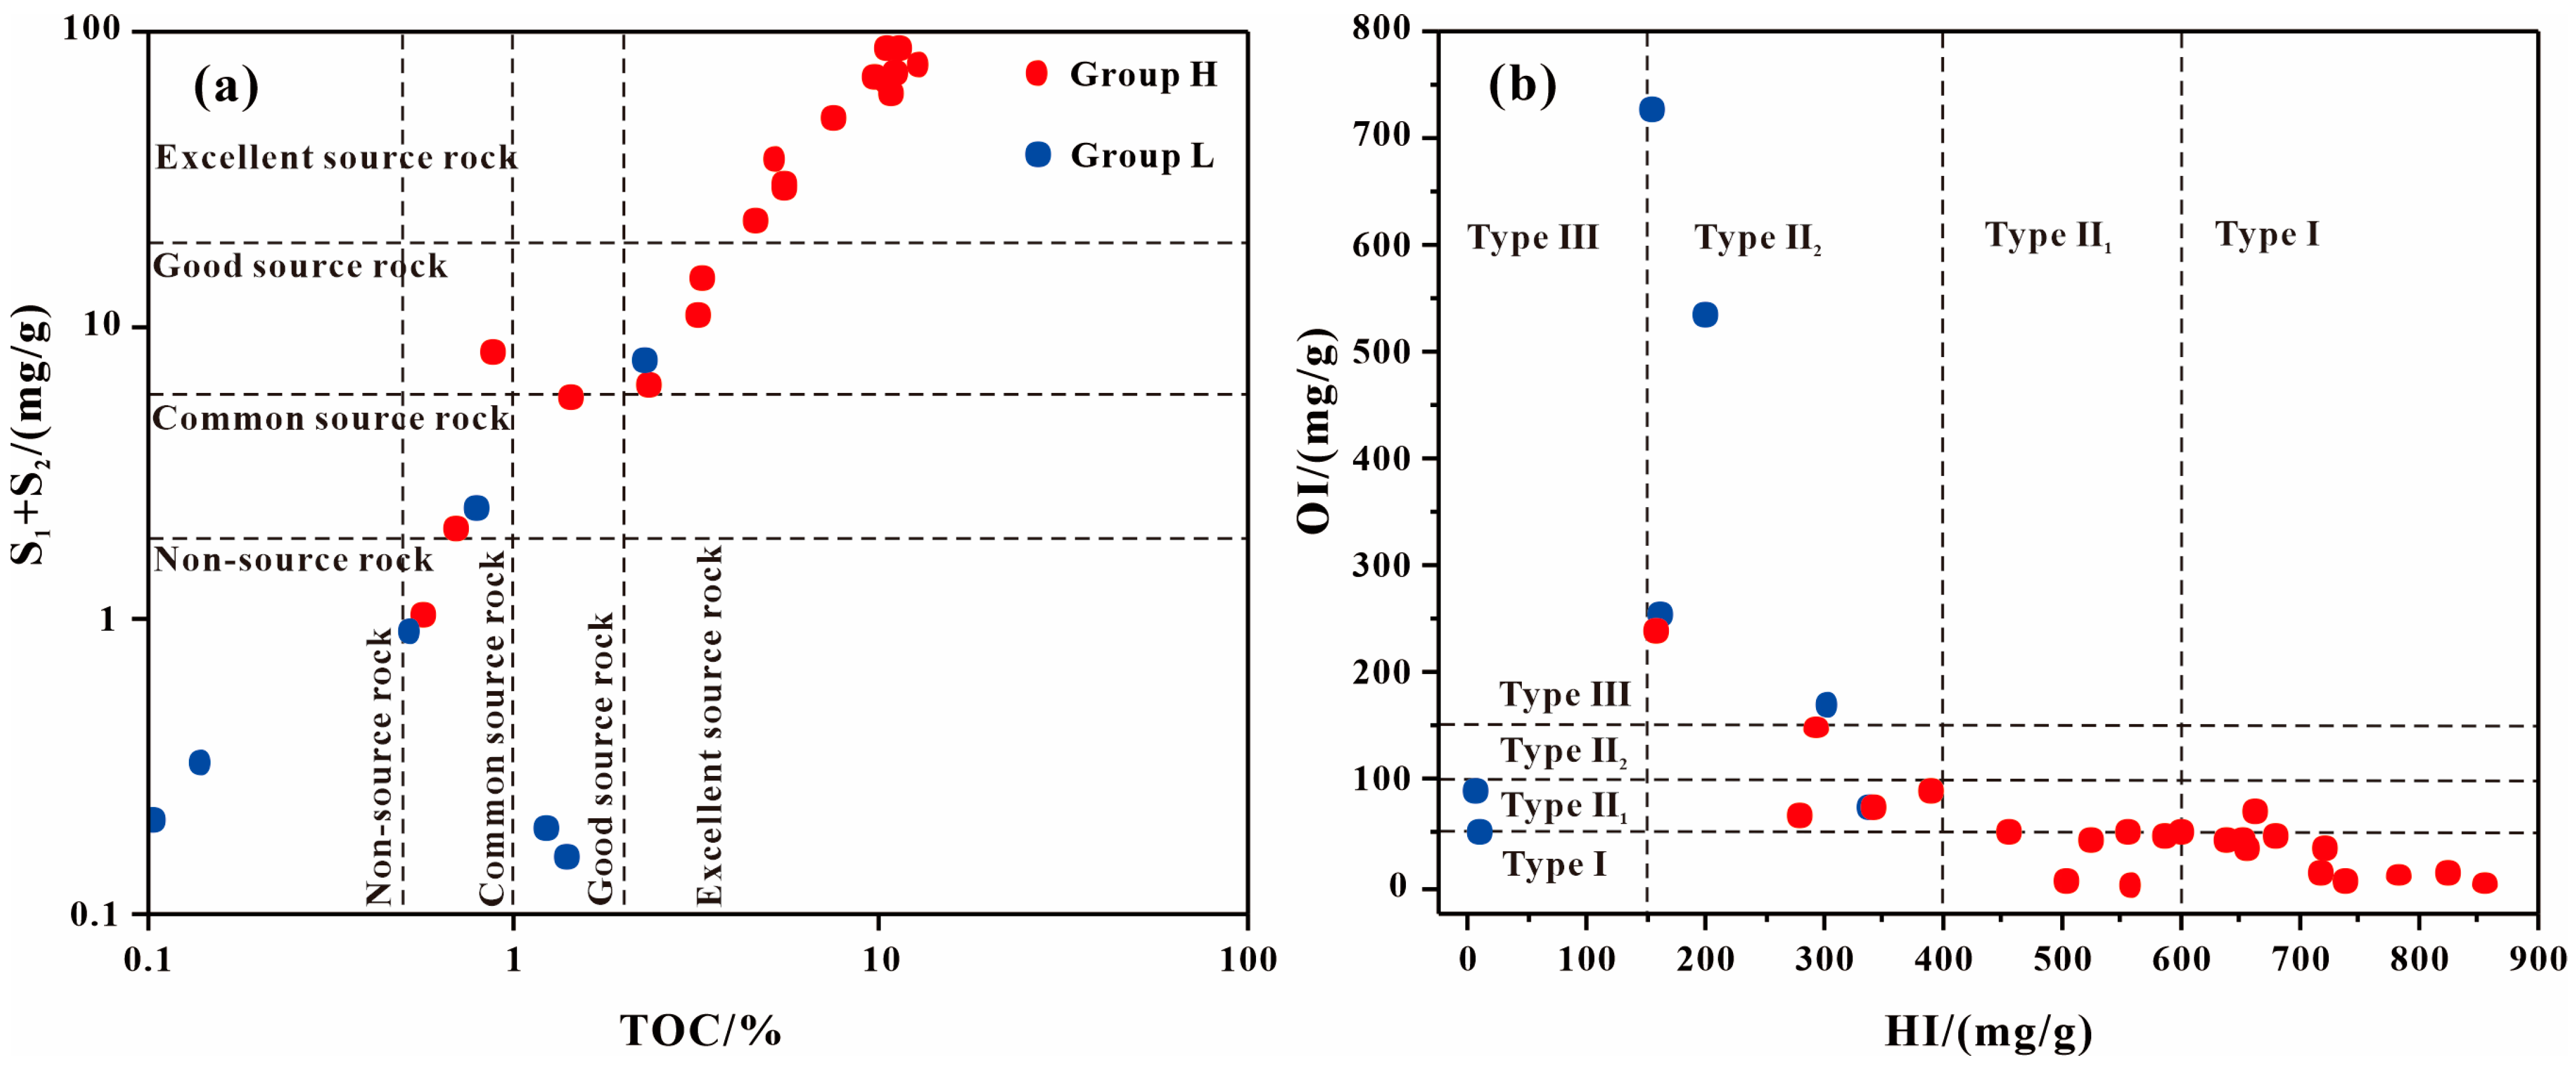
4.2. Contribution of GBLs to Source Rock Quality

Organic matter abundance is the material basis for hydrocarbon production and is evaluated by indicators such as TOC and S1 + S2 [20,21]. For Group H, the TOC and S1 + S2 values range from 0.56% to 19.35% and 1.07 mg/g to 160.61 mg/g, respectively, whereas for Group L, they range from 0.10% to 2.23% and 0.16 mg/g to 7.82 mg/g, respectively (Table 1). In the TOC vs. S1 + S2 diagram (Figure 6a), TOC has a favorable linear relationship with S1 + S2, indicating that the samples are not affected by transported hydrocarbons. In addition, the organic matter abundance of Group H is primarily high, and the major samples are excellent source rocks, whereas the Group L samples are largely common source rocks. Compared to Group L, Group H has diverse GBL series, combined with the results of source rock evaluations, suggesting that Group H may have good hydrocarbon generation, but the specific characteristics need to be further studied.
The organic matter type is important for determining the hydrocarbon generation potential of source rocks [14,54]. It is mainly classified into four types: type I is sapropelic organic matter; type II can be further subdivided into types II1 and II2 for nonmarine source rocks, namely, humic-sapropelic and sapropelic-humic organic matter, respectively; type III organic matter is humic organic matter [55,56,57]. Among them, Type I organic matter is mainly derived from lacustrine algae; Type II is primarily from a mixture of zooplankton and microorganisms; and Type III organic matter mainly comes from terrestrial plants [55,57]. In this study, Group H and Group L showed significant differences in the organic matter type. The HI values of Group H range from 156.28 mg/g to 854.63 mg/g, whereas those of Group L range from 5.81 mg/g to 335.89 mg/g. The OI values of Group H range from 5.16 mg/g to 242.50 mg/g, whereas those of Group L range from 51.93 mg/g to 726.71 mg/g. The HI vs. OI diagram shows that the organic matter of Group H is primarily a mixture of types I and II1, indicating algal dominance and high hydrocarbon generation potential, whereas that of Group L is mainly types II2–III (Figure 6b). In addition, the S2/S3 parameter can be used to identify the organic matter type. In Group H, the S2/S3 values range from 0.64 to 150.59, and most are greater than 5, demonstrating that the organic matter type is primarily I–II1. However, those of Group L range from 0.06 to 4.45, indicating that the organic matter type is primarily II2–III, which is consistent with the conclusions drawn from the HI vs. OI diagram. The GBLs-rich source rocks have better organic matter types, which suggests that the GBLs may be related to the formation of high-quality organic matter and react to the great hydrocarbon generation of the Group H.
Combined with the biomarker and pyrolysis parameter analysis results, these results indicate that the GBLs originate from submerged algae [44]. The high Paq values indicate that organic matter sources mainly comprised submerged algae; with the Paq vs. S2/S3 diagram (Figure 7), there was a significant difference in the parent material types of Group H and Group L. This further suggests that Group H has better hydrocarbon generation parent material types with a prominent contribution of submerged algae in the organic matter sources. In addition, Liu et al. [58,59] found that large amounts of submerged plants, such as kawamata, are widely distributed in the Qinghai Lake and Dai Sea and that the n-alkane distribution is characterized by the predominance of medium-chain n-alkanes, which is similar to Group H in this study. The Lucaogou Formation was deposited in a saline lake basin; the Qinghai Lake and Dai Sea are modern salinized lakes that may have similarities with the environment during the deposition of the Lucaogou Formation; thus, this further suggests that the formation of GBLs may be related to submerged algae.
Organic matter thermal maturity is an important component in source rock evaluation, and it has successfully been reflected by the Ro, Tmax, and biomarker parameters [20]. For Group H, the Ro values range from 0.53% to 1.01%, whereas for Group L, the Ro values range from 0.96% to 1.05% (Table 1). The Tmax values of Group H range from 424 °C to 449 °C, whereas those of Group L vary from 310 °C to 441 °C (Table 1). According to Figure 8a, there is no obvious difference in the maturity of the two source rock groups, and the majority of the samples are distributed in the low-mature and mature regions, implying that the source rocks of the Lucaogou Formation are in the low-mature to mature stages. In addition, the biomarker parameters C29 sterane αββ/(αααα + αββ) and C29 sterane 20S/(20S + 20R) can be used to describe source rock maturity. Their values increase with maturity, with equilibrium values in the range of 0.67–0.71 and 0.52–0.55, respectively, beyond which both parameters are ineffective in characterizing source rock maturity [51,60]. For Group H, the C29 sterane αββ/(αααα + αββ) and C29 sterane 20S/(20S + 20R) ratios range from 0.14 to 0.45 and 0.11 to 0.49, respectively, whereas for Group L, the ratios vary from 0.19 to 0.35 and 0.17 to 0.46, respectively (Table 1). As shown in Figure 8b, the two ratios are below the equilibrium values, indicating that the samples have reached the low-mature to mature stages, which is consistent with the previous results. Therefore, thermal maturity is not the primary cause of the distribution differences among the GBL samples in this study.
The organic matter abundance, type, and thermal maturity of the two source rock groups were analyzed using pyrolysis and biomarker parameters. The results show that the Group H samples are excellent source rocks and have good organic matter types, demonstrating greater potential to generate hydrocarbons, whereas the Group L samples exhibit lower organic matter abundance and inferior organic matter types (Figure 6). Furthermore, both groups exhibit no significant difference in thermal maturity, and both are immature to mature source rocks (Figure 8). Therefore, Group H source rocks with a high abundance of GBLs may have higher hydrocarbon generation, although this requires further discussion.

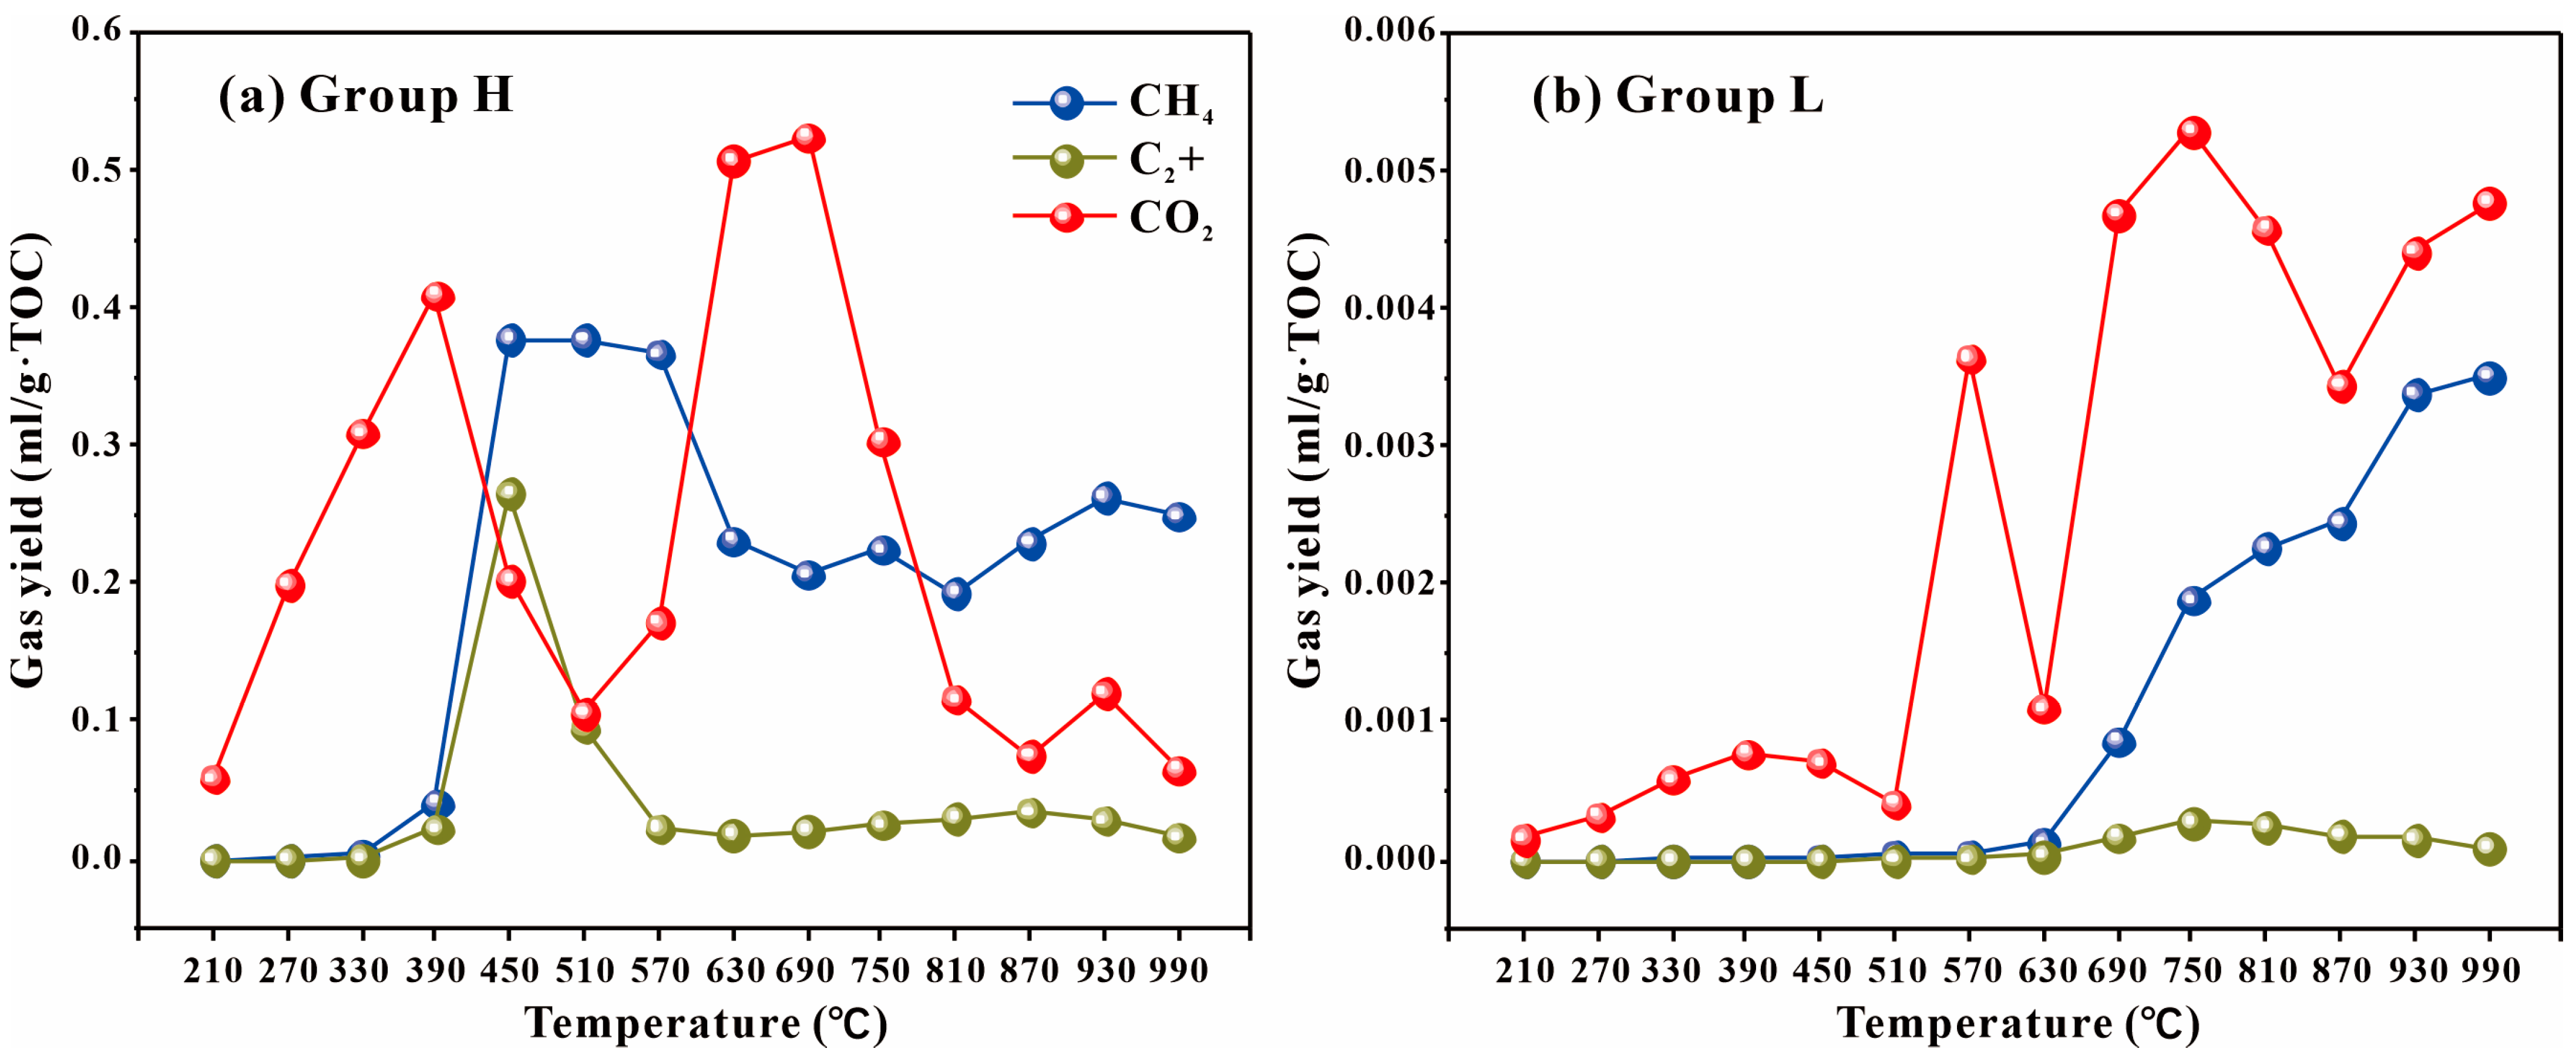
4.3. Evaluation of Hydrocarbon Generation Capacity of GBLs

In chemical terms, the GBLs are able to decarboxylate to form hydrocarbon compounds. Bailey et al. [61] used lactone series compounds with more than six-membered rings cleaved at temperatures as high as 520 °C to generate alkenes and unsaturated acids and lactones with four-membered rings to produce alkenes by removing CO2 at lower temperatures (40 °C–160 °C). Moldoveanu [62] also indicated that GBLs react at temperatures greater than 500 °C with decarboxylation to form CO2 and propylene. Bond et al. [63,64,65] concluded that because of the ring-opening reaction that occurs in lactones, an intermediate alkene acid is produced, which promotes the decarboxylation reaction in the presence of a C=C bond, leading to the production of CO2 and alkenes from lactones at approximately 300 °C. Theoretically, the GBL series in the Lucaogou Formation can produce hydrocarbons as the parent material for hydrocarbon production. Therefore, the two source rock groups (Groups H and L) with similar thermal maturity and significant differences in GBL contents are selected to conduct thermal simulation experiments in a semi-open system to reveal the characteristics and differences in hydrocarbon production and evolution between the two groups.
The fraction data of the semi-open thermal simulation experiments are presented in Table S2. The hydrocarbon gases produced are primarily methane (CH4) and heavy hydrocarbon gases (C2+), and the non-hydrocarbon gases are primarily CO2. By comparing the hydrocarbon gases of Groups H and L, Group H produced approximately 190 times more total CH4 than Group L, and Group H produced 495 times more total C2+ gases than Group L. The phenomenon of high yields of hydrocarbon compounds in the source rocks of Group H may be closely related to the fact that these source rocks are rich in the GBLs. In addition, the maximum methane production temperature of Group H is significantly lower than that of Group L (Figure 9), suggesting that GBL-rich source rocks are capable of producing hydrocarbons at low thermal maturity.
The non-hydrocarbon gas results show (Table S2) that Group H produces approximately 90 times more total CO2 than Group L. The CO2 source in the simulated experiments may have two pathways: first, CO2 is generated by the thermal degradation of carboxyl-dominated oxygen-containing functional groups in the structure of kerogen [63,64,65]; second, it is generated by the thermal decomposition of carbonatite minerals; however, the decomposition temperature of carbonates is approximately 700 °C. Notably, Group H exhibits an extremely high CO2 yield (Figure 9a) at a low temperature (390 °C), which is likely related to the decarboxylation reaction of the GBLs. Conversely, compounds from the same source have similar carbon isotopic compositions, whereas compounds from different sources have varying carbon isotopic compositions [66]. In the thermal simulation experiment, the CO2 isotopic compositions (below 390 °C) are significantly lower than those of the high-temperature phase (Figure 10), suggesting that CO2 at low temperatures originates from organic genesis, i.e., CO2 potentially originates from GBL decarboxylation. These analyses indicate that the GBL series compounds in the Lucaogou Formation source rocks contribute to hydrocarbon generation.
In order to explore the key evidence of GBLs compounds in the hydrocarbon generation process of the Lucaogou formation, the polar fractions (mainly GBLs) extracted from the source rocks were analyzed by Py-GC-MS in this study. In terms of the design of the temperature increase program, it was finely set to three consecutive temperature intervals, i.e., 100 °C–300 °C, 300 °C–500 °C, and 500 °C–700 °C, and the corresponding analytical results are presented in detail in Figure 11. During the temperature rise from 100 °C to 300 °C, GBLs and diketones were detected, which are the main constituents of the polar fraction. When the heating stage reaches the 300 °C–500 °C interval, the analytical results show that the main detected compounds include n-alkanes, diketones, and GBLs compounds. It is noteworthy that a large number of n-alkanes were formed in this stage, in contrast to the sharp decrease in the abundance of GBLs compounds. This significant variation strongly suggests that the GBL compounds play a specific role in the complex geochemical process of hydrocarbon generation and most likely belong to a class of important hydrocarbon-generating parent material with hydrocarbon generation. As for the high-temperature ramp-up stage at 500 °C–700 °C, the main types of compounds detected include n-alkanes, straight-chain alkenes, GBLs, and diketones. In addition, a series of compounds that are commonly and significantly present in crude oil systems were detected, such as C31 hopane, C31 morane, benzene, methylbenzene, ethylbenzene, dimethylbenzene, and a small amount of light hydrocarbons (1,3-butadiene, cyclopentadiene, and methyl cyclopentadiene, etc.). This series of test results further proves the hydrocarbon generation capacity of GBL compounds, which provides a crucial and firm experimental basis and theoretical support for an in-depth understanding of the hydrocarbon generation mechanism of the source rocks of the Lucaogou formation, as well as the formation process of the petroleum resources.

5. Conclusions

This study presents new data on organic geochemistry, individual hydrocarbon carbon isotopes, organic carbon content, Rock-Eval pyrolysis, and thermal simulation of the Lucaogou Formation of the Santanghu Basin. This study explores the origin, depositional environment, and hydrocarbon potential of the unusual GBL series. The main conclusions are as follows:
Based on the biomarkers and isotopes results, GBLs may have originated from submerged algae in salinity-reduced lacustrine environments. In addition, Group H has higher organic matter abundance, and its organic matter types are primarily I–II1, which illustrates the contribution of algae. Conversely, Group L has low organic matter abundance, and its organic matter types are primarily II2–III. The Rock-Eval pyrolysis and thermal simulation experimental results indicate that GBLs have hydrocarbon generation capability and that source rocks with high GBL contents have large amounts of hydrocarbon production. The above experimental results jointly indicate that the GBLs are highly likely to be an important type of parent material with hydrocarbon generation capacity. It has the ability to undergo complex chemical reactions and generate hydrocarbon compounds. During the formation process of petroleum, it may play a positive promoting role.
Although this study has conducted a detailed investigation into the parent material sources of the GBLs, currently, only a speculative conclusion has been drawn based on the existing evidence and analysis results, and the internal mechanism of its formation process has not been precisely resolved. In the future, the research area can be further expanded to compare the distribution, sources, and hydrocarbon generation characteristics of GBLs under different geological backgrounds so as to improve the global geochemical database of GBLs. In terms of experimental techniques, more advanced and accurate analytical methods should be explored to deeply study the molecular reaction mechanisms in the formation process of GBLs. Meanwhile, numerical simulation and other means should be combined to predict the hydrocarbon generation processes and resource potential of GBLs under different geological conditions, providing more powerful theoretical support for energy exploration.

Supplementary Materials

The following supporting information can be downloaded at: https://www.mdpi.com/article/10.3390/pr13041011/s1, Table S1. Samples information of Lucaogou formation in Santanghu Basin. Table S2. Gas yields and stable carbon isotopic values of CO2 of Group H and Group L.

Author Contributions

Conceptualization, W.W.; Methodology, W.W., T.Z. and Z.W.; Investigation, W.W., T.Z., L.L., Y.F. and X.L.; Resources, L.L. and X.W.; Writing—original draft, W.W.; Writing—review & editing, T.Z. and Z.W.; Supervision, Z.W. All authors have read and agreed to the published version of the manuscript.

Funding

This research was funded by the National Natural Science Foundation of China grant number 42272187 and the National Natural Science Foundation of China grant number 42102195. And the APC was funded by 42272187.

Data Availability Statement

The original contributions presented in this study are included in the article/Supplementary Material. Further inquiries can be directed to the corresponding authors.

Conflicts of Interest

The authors declare no conflicts of interest.

References

  1. Pan, Y.S.; Huang, Z.L.; Li, T.J.; Guo, X.B.; Xu, X.F.; Chen, X. Environmental response to volcanic activity and its effect on organic matter enrichment in the Permian Lucaogou Formation of the Malang Sag, Santanghu Basin, Northwest China. Palaeogeogr. Palaeoclim. Palaeoecol. 2020, 560, 110024. [Google Scholar] [CrossRef]
  2. Xiao, D.S.; Xu, X.F.; Kang, J.L.; Zhang, Y.T. Characteristics and genesis of tuffaceous shale oil lithofacies: A case study of Lucaogou Formation in Santanghu Basin. Pet. Res. 2024, 9, 37–47. [Google Scholar]
  3. Liu, B.; Song, Y.; Zhu, K.; Su, P.; Ye, X.; Zhao, W.C. Mineralogy and element geochemistry of salinized lacustrine organic-rich shale in the middle Permian Santanghu Basin: Implications for paleoenvironment, provenance, tectonic setting and shale oil potential. Mar. Pet. Geol. 2020, 120, 104569. [Google Scholar]
  4. Wei, D.F. Potential resources and exploration direction of shale oil and gas in Xinjiang. Geophys. Prospect. Pet. 2024, 63, 1087–1099. [Google Scholar]
  5. Wang, Z.D.; Liang, M.L.; Qian, Y.; Wang, Z.Y.; Li, X.B.; Li, Z.P. The oxygen-bearing geolipids in the Lucaogou shale of Upper Permian, Santanghu Basin, China. Org. Geochem. 2016, 102, 59–66. [Google Scholar]
  6. Cheng, B.; Xu, J.B.; Liang, Y.G.; Deng, Q.; Tian, Y.K.; Liao, Z.W. Determination and geochemical implication of multiple series of long-chain oxygen-bearing compounds trapped in kerogen in the Lucaogou Formation, Santanghu Basin, NW China. Org. Geochem. 2018, 121, 68–79. [Google Scholar]
  7. Zhang, T.; Wang, Z.D.; Wang, X.F.; Liu, P.; Wang, Y.L.; Wu, Y.D. Characterization of oxygen-bearing geolipids in the Upper Permian Lucaogou shale, Santanghu Basin, NE China, using stepwise pyrolysis and hydrous pyrolysis. Mar. Pet. Geol. 2021, 126, 104926. [Google Scholar]
  8. Hertz, H.S.; Andresen, B.D.; Djujricic, M.V.; Biemann, K.; Saban, M.; Vitorovic, D. The isolation and identification of gamma-lactones in the acidic fraction in Aleksinac (Yugoslavia) shale bitumen. Geochim. Cosmochim. Acta 1973, 37, 1687–1695. [Google Scholar]
  9. Shimoyama, A.; Komiya, M.; Harada, K. Low molecular weight monocarboxylic acid and γ-lactones in Neogene sediments of the Shinjo Basin. Geochem. J. 1991, 25, 421–428. [Google Scholar]
  10. Lyu, J.; Nam, P.W.; Lee, S.J.; Lee, K.G. Volatile compounds isolated from rice beers brewed with three medicinal plants. J. Inst. Brew. 2013, 119, 271–279. [Google Scholar] [CrossRef]
  11. Schütt, J.; Schieberle, P. Quantitation of nine lactones in dairy cream by stable isotope dilution assays based on novel syntheses of carbon-13 labeled γ-lactones and deuterium labeled δ-lactones in combination with GC-GC-TOF-MS. J. Agric. Food Chem. 2017, 65, 10534–10541. [Google Scholar] [CrossRef] [PubMed]
  12. Sun, B.G.; Zheng, F.P.; Liu, Y.P. Flavours and Fragrances; China Petrochemical Press: Beijing, China, 2000; pp. 100–104. [Google Scholar]
  13. Sachse, V.F.; Heim, S.; Jabour, H.; Kluth, O.; Schumann, T.; Aquit, M.; Littke, R. Organic geochemical characterization of Santonian to Early Campanian organic matter-rich marls (Sondage No. 1 cores) as related to OAE3 from the Tarfaya Basin, Morocco. Mar. Pet. Geol. 2014, 56, 290–304. [Google Scholar] [CrossRef]
  14. Zhou, J.Q.; Li, C.; Song, Z.Y.; Zhang, X.L. Organic Geochemical Characteristics and Hydrocarbon Significance of the Permian System Around the Bogda Mountain, Junggar Basin, Northwest China. Sustainability 2025, 17, 347. [Google Scholar] [CrossRef]
  15. Li, Z.; Ma, X.Q.; Li, A.F.; Zhang, C.W. A novel potential source of β-carotene: Eustigmatos cf. polyphem (Eustigmatophyceae) and pilot β-carotene production in bubble column and flat panel photobioreactors. Bioresour. Technol. 2012, 117, 257–263. [Google Scholar] [CrossRef] [PubMed]
  16. Ari, M.A.I.; Nton, M.E.; Harouna, M. Biomarker geochemistry and oil-oil correlation from reservoir unit oils of the Sokor-1 Formation, Fana low uplift, Termit Basin, southeastern Niger. J. Afr. Earth Sci. 2025, 223, 105522. [Google Scholar] [CrossRef]
  17. Lee, S.M.; Lim, H.J.; Chang, J.W.; Hurh, B.S.; Kim, Y.S. Investigation on the formations of volatile compounds, fatty acids, and γ-lactones in white and brown rice during fermentation. Food. Chem. 2018, 269, 347–354. [Google Scholar] [CrossRef] [PubMed]
  18. Li, E.T.; Jin, J.; Chen, J.; Wang, M.; Mi, J.L.; Gao, X.W. Study on biomarkers and carbon isotopic compositions of monomer hydrocarbons in asphaltene pyrolysis products from biodegraded heavy oil. Geochimica 2019, 48, 284–292. [Google Scholar]
  19. Zhang, Y.D.; Sun, Y.G.; Liu, Q. Distribution and carbon isotope composition of pregnane in carbonate-evaporitic rocks from the Bonan Sag, Bohai Bay Basin, Eastern China: Insights into sources and associated lake environments. Org. Geochem. 2021, 151, 104127. [Google Scholar] [CrossRef]
  20. Kosakowski, P.; Kotarba, M.J.; Piestrzyński, A.; Shogenova, A. Petroleum source rock evaluation of the Alum and Dictyonema Shales (Upper Cambrian-Lower Ordovician) in the Baltic Basin and Podlasie Depression (eastern Poland). Int. J. Earth Sci. 2016, 106, 1–19. [Google Scholar] [CrossRef]
  21. Ahoure, N.D.; Egoran, B.A.; Kouadio, G.R.N.; Sehi, Z.S.; Oura, E.L.; Digbehi, Z.B. Geochemical Analysis of Albian-Maastrichtian Formations in the Offshore Basin of the Abidjan Margin: Rock-Eval Pyrolysis Study. Open J. Geol. 2024, 14, 805–822. [Google Scholar] [CrossRef]
  22. Grundman, G.; Behar, F.; Malo, M.; Baudin, F.; Lorant, F. Evaluation of hydrocarbon potential of the Paleozoic (Cambrian–Devonian) source rocks of the Gaspé Peninsula, Québec, Canada: Geochemical characterization, expulsion efficiency, and erosion scenario. Am. Assoc. Pet. Geol. Bull. 2012, 96, 729–751. [Google Scholar] [CrossRef]
  23. Ercegovac, M.; Kostic, A. Organic facies and palynofacies: Nomenclature, classification and applicability for petroleum source rock evaluation. Int. J. Coal. Geol. 2006, 68, 70–78. [Google Scholar]
  24. Jiang, H.; Pang, X.; Shi, H.; Yu, Q.; Cao, Z.; Yu, R.; Chen, D.; Long, Z.; Jiang, F. Source rock characteristics and hydrocarbon expulsion potential of the Middle Eocene Wenchang formation in the Huizhou depression, Pearl River Mouth basin, south China sea. Mar. Pet. Geol. 2015, 67, 635–652. [Google Scholar]
  25. Hakimi, M.H.; Abdullah, W.H. Thermal maturity history and petroleum generation modelling for the Upper Jurassic Madbi source rocks in the Marib-Shabowah Basin, western Yemen. Mar. Pet. Geol. 2015, 59, 202–216. [Google Scholar] [CrossRef]
  26. Guo, X.B.; Zhou, L.F.; Shi, B.H.; Li, Y.; Lin, S.Y.; Li, Y.X.; Sun, J.B.; Liu, G.; Yin, J.T.; Zhang, C.L. Pyrolytic hydrocarbon generation characteristics of the Chang 7 shale based on different experimental methods: Implications for shale oil and gas in the Ordos Basin. Geol. J. 2024, 59, 2175–2189. [Google Scholar] [CrossRef]
  27. Li, C.M.; Zeng, J.H.; Liu, S.N.; Dong, Y.Y.; Wang, M.Y. How did submarine volcanic eruptions interact with organic matter to favour hydrocarbon generation in the Bohai Bay Basin, China? Int. Geol. Rev. 2024, 66, 2345–2364. [Google Scholar]
  28. Liu, P.; Wang, X.F.; Liu, C.J.; Lin, Y.; Guo, R.L.; Liu, W.H. Intramolecular carbon isotopic rollover in propane from natural gas reservoirs of the Santanghu Basin: Insights into chemical structure of kerogen. Org. Geochem. 2024, 188, 104740. [Google Scholar]
  29. Sun, Z.M.; Xiong, B.X.; Li, Y.L.; He, H.Q. An assessment of hydrocarbon potential of Mesozoic–Cenozoic basins in the north part of Kashen depression of Tarim basin. Pet. Geol. Exp. 2001, 23, 23–26. [Google Scholar]
  30. Jiao, X.; Liu, Y.Q.; Yang, W.; Li, H.; Meng, Z.Y.; Zhao, M.R.; Li, Z.X. Microcrystalline dolomite in a middle Permian volcanic lake: Insights on primary dolomite formation in a non-evaporitic environment. Sedimentology 2023, 70, 48–77. [Google Scholar]
  31. Liu, X.W.; Zhen, J.J.; Yang, X.; Liu, Y.H. Paleozoic structural evolution Santanghu basin and its surrounding and prototype basin recovery. Nat. Gas Geosci. 2010, 21, 947–954. [Google Scholar]
  32. GB/T 19145-2022; Determination for Total Organic Carbon in Sedimentary Rock. China Standards Press: Beijing, China, 2022.
  33. SY/T 5214-2012; Determination Method of Vitrinite Reflectance in Sedimentary Rocks. Petroleum Industry Press: Beijing, China, 2012.
  34. Si, W.X.; Zhang, S.B. The Soxhlet extraction method is often used to extract soluble organic matter from source rocks. Its principle is to extract the organic matter from the samples through solvent reflux. Inn. Mong. Petrochem. Ind. 2010, 36, 112–113. [Google Scholar]
  35. Liao, J.; Wang, J.; Lu, H.; Sheng, G.Y.; Peng, P.A.; Hsu, C.S. Solvent effect in Soxhlet extraction of source rocks. Org. Geochem. 2025, 200, 104917. [Google Scholar]
  36. GB/T 18606-2017; The Test Method for Biomarkers in Sediment and Crude Oil by GC-MS. China Standards Press: Beijing, China, 2017.
  37. GB/T 18340.2-2010; Organic Geochemical Analysis Method for Geological Samples—Part 2: Determination of Organic Carbon Stable Isotopic Component—Isotopic Mass Spectrometry. China Standards Press: Beijing, China, 2010.
  38. Guenther, F.; Aichner, B.; Siegwolf, R.; Xu, B.Q.; Yao, T.D.; Gleixner, G. A synthesis of hydrogen isotope variability and its hydrological significance at the Qinghai–Tibetan Plateau. Quat. Int. 2013, 313, 3–6. [Google Scholar]
  39. Rodrigues, B.; Duarte, L.V.; Filho, J.G.M.; Santos, L.G.; de Oliveira, A.D. Evidence of terrestrial organic matter deposition across the early Toarcian recorded in the northern Lusitanian Basin, Portugal. Int. J. Coal Geol. 2016, 168, 35–45. [Google Scholar]
  40. Wang, Z.; Zhong, W.; Wang, X.J.; Du, Y.Y.; Li, T.H.; Xue, J.B.; Quan, M.Y. Organic Matter Source Traced by n-Alkane Records Derived from Sediments of Barkol Lake in Eastern Xinjiang (NW China) and Its Response to Moisture Variability in the Past 8800 Years. Geochem. Int. 2024, 62, 419–433. [Google Scholar]
  41. Qiao, J.Q.; Baniasad, A.; Zieger, L.; Zhang, C.; Luo, Q.; Littke, R. Paleo-depositional environment, origin and characteristics of organic matter of the Triassic Chang 7 Member of the Yanchang Formation throughout the mid-western part of the Ordos Basin, China. Int. J. Coal Geol. 2021, 237, 103636. [Google Scholar]
  42. Sikes, E.L.; Uhle, M.E.; Nodder, S.D.; Howard, M.E. Sources of organic matter in a coastal marine environment: Evidence from n-alkanes and their δ13C distributions in the Hauraki Gulf, New Zealand. Mar. Chem. 2009, 113, 149–163. [Google Scholar]
  43. Hu, X.; Zhu, L.; Wang, Y.; Wang, J.; Peng, P.; Ma, Q.; Hu, J.; Lin, X. Climatic significance of n-alkanes and their compound-specific δD values from lake surface sediments on the Southwestern Tibetan Plateau. Chin. Sci. Bull. 2014, 59, 3022–3033. [Google Scholar]
  44. Ficken, K.J.; Li, B.; Swain, D.L.; Eglinton, G. An n-alkane proxy for the sedimentary input of submerged/floating freshwater aquatic macrophytes. Org. Geochem. 2000, 31, 745–749. [Google Scholar]
  45. Barham, A.; Ismail, M.; Hermana, M.; Abidin, N.S. Biomarker characteristics of Montney source rock, British Columbia, Canada. Heliyon 2021, 7, 83–95. [Google Scholar]
  46. Sohail, J.; Mehmood, S.; Jahandad, S.; Ehsan, M.; Abdelrahman, K.; Ali, A.; Qadri, S.M.T.; Fnais, M. Geochemical Evaluation of Paleocene Source Rocks in the Kohat Sub-Basin, Pakistan. ACS Omega 2024, 9, 14123–14141. [Google Scholar] [CrossRef]
  47. Gao, G.; Yang, S.R.; Zhang, W.W.; Wang, Y.; Gang, W.Z.; Lou, G.Q. Organic geochemistry of the lacustrine shales from the Cretaceous Taizhou Formation in the Gaoyou Sag, Northern Jiangsu Basin. Mar. Pet. Geol. 2018, 89, 594–603. [Google Scholar] [CrossRef]
  48. Liu, X.; Tian, J.Q.; Hao, F.; Zhang, Z.; Yang, X.Z.; Chen, Y.Q.; Zhang, K.; Wang, X.X.; Cong, F.Y. The generation mechanism of deep natural gas in Tabei uplift, Tarim Basin, Northwest China: Insights from instantaneous and accumulative effects. Pet. Sci. 2024, 21, 3804–3814. [Google Scholar] [CrossRef]
  49. Wenger, L.M.; Davis, C.L.; Isaksen, G.H. Multiple Controls on Petroleum Biodegradation and Impact on Oil Quality. SPE Annu. Tech. Conf. Exhib. 2002, 5, 375–383. [Google Scholar] [CrossRef]
  50. Head, I.M.; Jones, D.M.; Larter, S.R. Biological activity in the deep subsurface and the origin of heavy oil. Nature 2003, 426, 344–352. [Google Scholar] [CrossRef]
  51. Onojake, M.C.; Nkanta, N.E.; Osakwe, J.O.; Akpuluma, D.A.; Ohenhen, I.; Osuji, L.C. Organic geochemical evaluation of crude oils from some producing fields in the Niger Delta basin, Nigeria. J. Pet. Explor. Prod. Technol. 2024, 14, 1799–1811. [Google Scholar] [CrossRef]
  52. Lai, H.F.; Lu, Q.P.; Yang, Z. Origin and microbial degradation of thermogenic hydrocarbons within the sandy gas hydrate reservoirs in the Qiongdongnan Basin, northern South China Sea. Mar. Pet. Geol. 2024, 165, 106871. [Google Scholar] [CrossRef]
  53. Liu, S.J.; Gao, G.; Shi, X.Y.; Gang, W.Z.; Xiang, B.L.; Wang, M.; Zhao, W.Z. Geochemical constraints on the hydrocarbon generation and expulsion in source rocks with different primary organic matter compositions: A case study on the Lucaogou Formation in the Jimusaer Sag, Junggar Basin, Northwest China. Org. Geochem. 2025, 202, 104952. [Google Scholar] [CrossRef]
  54. Sachsenhofer, R.F.; Hentschke, J.; Bechtel, A.; Coric, S.; Gross, D.; Horsfield, B.; Rachetti, A.; Soliman, A. Hydrocarbon potential and depositional environments. of Oligo-Miocene rocks in the Eastern Carpathians (Vrancea Nappe, Romania). Mar. Pet. Geol. 2015, 68, 269–290. [Google Scholar] [CrossRef]
  55. Mani, D.; Patil, D.J.; Dayal, A.M.; Prasad, B.N. Thermal maturity, source rock potential and kinetics of hydrocarbon generation in Permian shales from the Damodar valley basin, eastern India. Mar. Pet. Geol. 2015, 66, 1056–1072. [Google Scholar] [CrossRef]
  56. Elyasi, S. Petroleum source-rock potential of the Piranj oil field, Zagros basin. Mar. Pet. Geol. 2016, 78, 448–454. [Google Scholar]
  57. Mahbobipour, H.; Kamali, M.R.; Solgi, A. Organic geochemistry and petroleum potential of Early Cretaceous Garau Formation in central part of Lurestan zone, northwest of Zagros, Iran. Mar. Pet. Geol. 2016, 77, 991–1009. [Google Scholar] [CrossRef]
  58. Liu, H.; Liu, W.G. n-Alkane distributions and concentrations in algae, submerged plants and terrestrial plants from the Qinghai-Tibetan Plateau. Org. Geochem. 2016, 99, 10–22. [Google Scholar]
  59. Liu, H.; Liu, Z.H.; Zhao, C.; Liu, W.G. n-alkyl lipid concentrations and distributions in aquatic plants and their individual δD variations. Sci. China Earth Sci. 2019, 62, 1441–1452. [Google Scholar]
  60. Bobrovskiy, I.; Poulton, S.W.; Hope, J.M.; Brocks, J.J. Impact of aerobic reworking of biomass on steroid and hopanoid biomarker parameters recording ecological conditions and thermal maturity. Geochim. Cosmochim. Acta 2024, 364, 114–128. [Google Scholar]
  61. Bailey, W.J.; Bird, C.N. Pyrolysis of esters. 27. Pyrolysis of lactones. J. Org. Chem. 1977, 42, 3895–3899. [Google Scholar] [CrossRef]
  62. Moldoveanu, S.C. Pyrolysis of various derivatives of carboxylic acids. Tech. Instrum. Anal. Chem. 2010, 28, 579–627. [Google Scholar]
  63. Bond, J.Q.; Alonso, D.M.; West, R.M.; Dumesci, J.A. Gamma-valerolactone ring-opening and decarboxylation over SiO2/Al2O3 in the presence of water. Langmuir 2010, 26, 16291–16298. [Google Scholar] [PubMed]
  64. Bond, J.Q.; Alonso, D.M.; Wang, D.; West, R.M.; Dumesci, J.A. Integrated catalytic conversion of gamma-valerolactone to liquid alkenes for transportation fuels. Science 2010, 327, 1110–1114. [Google Scholar]
  65. Bond, J.Q.; Jungong, C.S.; Chatzidimitriou, A. Microkinetic analysis of ring-opening and decarboxylation of cvalerolactone over silica alumina. J. Catal. 2016, 344, 640–656. [Google Scholar]
  66. Huang, X.Y.; Pancost, R.D.; Xue, J.T.; Gu, Y.S.; Evershed, R.P.; Xie, S.H. Response of carbon cycle to drier conditions in the mid-Holocene in central China. Nat. Commun. 2018, 9, 1369. [Google Scholar] [PubMed]
Figure 1. Region structure and sample distribution of Santanghu Basin.
Processes 13 01011 g001
Figure 2. Basis for the classification of source rocks with different abundances of the GBLs (m/z 85).
Processes 13 01011 g002
Figure 3. Ternary diagrams showing organic matter source. (a) the n-alkane distributions and (b) the distribution of C27, C28, and C29 ααα 20R steranes; the data are from Table 1.
Processes 13 01011 g003
Figure 4. Carbon isotope distribution of n-alkanes and GBLs individuals; the data are from Table 2.
Processes 13 01011 g004
Figure 5. Source rocks of the Lucaogou Formation. (a) The identification of the biodegradation degree, (b) the identification of the sedimentary environmental conditions; the data are from Table 1.
Processes 13 01011 g005
Figure 6. Source rocks of the Lucaogou Formation. (a) reflects the organic matter abundance, and (b) reflects the organic matter type; the data are from Table 1.
Processes 13 01011 g006
Figure 7. The diagram of Paq vs. S1/S2 reflecting submerged algae contribution; the data are from Table 1.
Processes 13 01011 g007
Figure 8. Identification of the maturity of source rocks in the Lucaogou Formation. (a) Ro vs. Tmax, and (b) C29 sterane αββ/(ααα + βββ) vs. C29 sterane 20S/(20S + 20R); the data are from Table 1.
Processes 13 01011 g008
Figure 9. Gas yields of Group H and Group L versus temperature; the data are from Table S2.
Processes 13 01011 g009
Figure 10. Stable carbon isotopic (δ13C) values of CO2 of Group H and Group L versus temperature; the data are from Table S2.
Processes 13 01011 g010
Figure 11. Py-GC-MS sequential pyrolysis products of polar components in the Lucaogou formation.
Processes 13 01011 g011
Table 1. Pyrolysis and biomarker parameters of Lucaogou formation in Santanghu Basin.
SampleGroupTOCRoTmaxS1 + S2S2/S3HIOIPaqPr/PhGIn-C17/Prn-C18/PhC29 Sterane αββ/(ααα + αββ)C29 Sterane S/(S + R)
%%°Cmg/g
STH-1H10.940.8944072.2517.20653.7238.010.920.640.031.090.640.230.14
STH-3H0.560.974451.070.64156.28242.500.771.390.094.173.640.230.18
STH-6H3.180.9144410.994.46340.4476.390.951.501.203.793.760.410.44
STH-7H3.190.8644114.608.23453.4655.120.890.820.526.585.540.270.31
STH-8H5.410.9744130.1010.38553.1753.280.931.060.554.964.720.220.28
STH-9H10.580.8544162.7511.97584.9848.870.941.030.853.132.650.310.43
STH-10H10.830.8244071.9414.20650.2845.800.940.900.396.026.180.250.29
STH-11H12.510.9843976.7511.30600.0653.090.851.410.283.664.450.240.22
STH-12H10.441.0043967.8813.56637.6147.040.901.160.183.173.530.240.24
STH-13H16.170.60445118.3618.42721.2539.160.950.930.338.0010.420.250.34
STH-14H16.940.83440115.849.20661.5971.911.000.860.3314.2021.740.230.31
STH-15H19.350.81447160.6154.40823.5915.140.901.070.165.384.420.180.18
YJG-3H11.110.5344387.5158.29781.4913.410.930.940.805.904.070.200.20
YJG-5H2.280.544376.464.00277.3669.340.860.702.093.412.240.210.19
YJG-6H0.680.884442.071.93292.30151.290.850.910.483.302.100.150.11
YJG-7H1.410.604375.714.18388.5492.880.800.830.121.151.000.180.14
YJG-8H7.410.5944051.3213.94677.2248.590.910.870.392.582.740.200.17
T25-1H5.430.6144930.7111.76522.875.160.931.450.158.969.900.390.39
T34-1H0.851.014338.32107.86556.0144.450.910.420.384.804.360.450.49
T31-1H5.070.6542437.1845.34715.6115.780.890.710.451.640.940.140.11
T31-2H9.450.7044570.11112.19736.446.560.840.590.251.700.910.190.20
T31-3H4.470.9144122.7862.42502.398.050.880.690.071.951.110.210.17
T31-4H10.220.9344788.17150.59854.635.680.910.660.382.731.370.180.17
STH-2L0.781.034402.441.75299.92171.750.631.010.111.480.850.240.19
STH-4L0.511.054410.920.62159.07257.270.960.880.123.273.040.230.17
STH-5L2.230.974287.824.45335.8975.440.630.350.151.870.440.190.17
YJG-1L0.10-4410.210.21153.53726.710.830.662.292.571.500.320.39
YJG-4L0.14-4360.330.37197.95535.190.571.451.264.783.840.230.18
YJG-9L1.19-4330.200.189.2151.930.781.110.223.272.220.350.42
YJG-10L1.380.963100.160.065.8193.020.780.910.253.872.500.340.46
Paq index is calculated as (n-C21 + n-C23)/(n-C21 + n-C23 + n-C29 + n-C31).
Table 2. Carbon isotope analysis of n-alkanes and GBLs individuals (‰, VPDB).
δ13CYJG-1
n-Alkanes
YJG-4
n-Alkanes
YJG-9
n-Alkanes
YJG-10
n-Alkanes
YJG-3
n-Alkanes
YJG-5
n-Alkanes
YJG-6
n-Alkanes
YJG-7
n-Alkanes
YJG-8
n-Alkanes
YJG
GBLs
C10 −34.8
C11 −35
C12 −34.5
C13 −35.2
C14 −35.7
C15−32.9 −35−31.7−34.2 −35.3
C16−32.4−33−31.6 −35.7−31.2−33.2−35.1 −35.1
C17−33.7−34.4−33.5−35.3−37.5−31.4−33.5−37.6−38−37.2
C18−33−34.2−33.2−34.1−37.7−31.6−34.5−38.7−39.5−36.8
C19−33.6−35.6−33.8−34.7−38.5−35−35.2−39.7−36−37.3
C20−33.3−35.5−34.2−35.8−39.9−35.4−36.4−40.1−38.3−36.6
C21−33.8−36.3−33−36.4−40.3−36.7−38.7−40.5−38.7−37
C22−32.8−33.1−30.8−35.4−40.3−38.1−39−39.7−38.6−39.2
C23−32.1−32.3−31.8−34.1−39.1−38.2−39.5−39.5−37.9−37.4
C24−31.1−32.4−31.7−33.4−39.6−39.9−39.5−40.9−37.9−38
C25−32.1 −32.1−33.1−39−38.9−39.3−39.9−37.9−38.4
C26−33.4 −31.3−32.2−37.6−39.7−39.2−40.7−36.4−38.3
C27−32.4 −31.9−32.1−37.9−37.6−38.2−40.3−35.3−37.2
C28 −32−32.6−39 −40
C29 −31.5 −36.2
Disclaimer/Publisher’s Note: The statements, opinions and data contained in all publications are solely those of the individual author(s) and contributor(s) and not of MDPI and/or the editor(s). MDPI and/or the editor(s) disclaim responsibility for any injury to people or property resulting from any ideas, methods, instructions or products referred to in the content.

