Article

Fluorescence-Based Detection of Picric Acid Using Vortex-Assisted Liquid–Liquid Microextraction: An Innovative Analytical Approach

by
Sofia Kakalejčíková
1,*,
Dominik Harenčár
1,
Yaroslav Bazeľ
1,* and
Maksym Fizer
2
1
Department of Analytical Chemistry, Institute of Chemistry, Faculty of Science, Pavol Jozef Šafárik University in Košice, Moyzesova 11, 040 01 Košice, Slovakia
2
Department of Chemistry, University of Nevada, Reno, 1664 N. Virginia Street, Reno, NV 89557-0216, USA
*
Authors to whom correspondence should be addressed.
Processes 2025, 13(4), 1051; https://doi.org/10.3390/pr13041051
Submission received: 9 March 2025 / Revised: 24 March 2025 / Accepted: 25 March 2025 / Published: 1 April 2025

Abstract

:
A novel design for vortex-assisted liquid–liquid microextraction (VALLME), combined with spectrofluorimetric determination (FLD), was proposed and successfully tested for determining picric acid (PA) in water samples. This fluorescence method is based on the formation of an ion associate (IA) through electrostatic interactions, which serves as the analytical species for fluorescence measurement in the presence of the basic polymethine dye Astrafloksin (AF). The approach aims to minimize the volume of the extraction phase, aligning with the principles of green analytical chemistry. The calibration curve was linear from 0.92 to 11.45 µg L−1, with an R2 of 0.9930. LOD was 0.40 µg L−1. Density functional theory (DFT) calculations, supported by analysis of van der Waals and electrostatic interionic attraction, helped explain the experimentally observed selectivity of the AF cation for picrate compared to other selected phenols. Theoretical solubility descriptors of the proposed IA provided insight into the extraction of IA from water to the n-amyl acetate phase. This VALLME-FLD method represents a significant advancement in PA determination, characterized by high sensitivity, selectivity, and procedural simplicity. It minimizes the use of organic solvents, facilitates direct sample preparation, and shortens analysis time. The developed method was successfully applied to real samples.

1. Introduction

Trinitrophenol, also known as picric acid (PA), is a strong organic acid with a low pKa value (0.42 at 24 °C) [1,2]. PA appears as white to yellow crystals and is highly soluble in both water and organic solvents. It exhibits explosive power surpassing that of trinitrotoluene (TNT) [3,4]. Historically, it was used as an explosive charge in artillery shells, grenades, and aerial bombs. For this reason, PA was widely utilized as an explosive material, particularly during World War I [5]. At temperatures above 122.5 °C, PA undergoes sublimation and explodes only when subjected to rapid heating or detonation by a blasting cap. PA can also form esters, such as trinitroanisole and trinitrophenetole [6,7]. Today, its primary application lies in the synthesis of other explosives, where it serves as an intermediate [6]. Although its main use is now focused on explosive synthesis, PA continues to find applications in the chemical and pharmaceutical industries [8,9]. In the pharmaceutical sector, PA acts as a key ingredient in the formulation of drugs like antiseptics and antibiotics, which are used to treat conditions such as malaria, herpes, and burns. Additionally, PA plays a role in the production of herbicides and is utilized in chemical analysis, where it helps detect metals and other substances [10,11].
Despite its wide range of applications, PA poses significant environmental and health risks. Its low biodegradability, toxicity, strong acidity due to nitro groups, and explosive properties can lead to severe contamination of air, soil, and aquatic ecosystems [12]. For living organisms, PA represents considerable hazards, causing liver dysfunction [13], kidney failure [14], respiratory problems [15], and skin and eye irritation [16]. Moreover, it is metabolized into picramic acid (2-amino-4,6-dinitrophenol), which exhibits higher mutagenic activity than PA itself [17]. Due to these characteristics and the increasing need for the detection of nitro-explosives, especially in the context of international terrorism over the past three decades, research on this compound has become crucial in the fields of environmental, security, and forensic analysis [12].
Fluorescence-based methods are currently of significant interest due to their high sensitivity, simplicity, and cost-effectiveness. These methods enable the identification of analytes through the interaction of the target analyte with a fluorophore, which in turn affects the fluorescence properties of the fluorophore [18,19]. In recent decades, several methods for detecting PA have been developed, with spectrofluorimetry being one of the highly selective techniques [20,21]. These methods, including the use of fluorescent probes [22,23], quantum dots [24], sensors [25,26], and metal–organic frameworks [27], offer high sensitivity in detecting PA in diverse environments. A comparison of existing fluorescence methods is provided in Table 1. One of the main challenges with these methods is their low selectivity, limited specificity when analyzing complex samples, and the need for specialized detection equipment [28].
On the other hand, the combination of fluorescence detection with liquid–liquid extraction (LLE) represents a powerful and widely used technique for the preconcentration and separation of various analytes. However, conventional LLE, when performed manually, has certain limitations, such as the use of volatile and potentially hazardous solvents. Liquid–liquid microextraction (LLME) has emerged as a sustainable alternative that offers a cost-effective, green, and stable solution for sample preparation [29,30,31]. Many different LLME methods are known, such as dispersive liquid–liquid microex-traction (DLLME), single-drop microextraction (SDME), homogeneous liquid–liquid microextraction (HLLME), and hollow fiber liquid-phase microextraction (HF-LPME), among others. The advantages of the mentioned microextraction methods include their efficiency, ecological sustainability, compatibility with various detection techniques, and a wide range of applications. The correct choice of solvents and optimization of extraction conditions minimize the impact of interferents, ensuring a high preconcentration factor, which in turn guarantees high sensitivity and selectivity of the analysis. However, these methods also have drawbacks, including the complex selection of appropriate solvents, losses due to the solubility or volatility of solvents, and the complexity of handling microvolumes of the extraction phase. The efficiency of LLME can be significantly increased by additional physico-chemical effects, based on which methods such as ultrasound-assisted emulsi-fication microextraction (UAEME), microwave-assisted extraction (MAE), and air-assisted liquid–liquid microextraction (AALLME) have been developed. Among LLME techniques, vortex-assisted liquid–liquid microextraction (VALLME) is one of the most efficient. This method utilizes vortex mixing to enhance the distribution of the extraction solvent, increasing the interfacial area and improving mass transfer. As a result, extraction is faster and reaches equilibrium within minutes. This technique is typically characterized by speed, efficiency, and lower costs, which align with the principles of green analytical chemistry. Overall, VALLME contributes to reducing the environmental impact of analytical processes [32,33]. However, only a few examples in the literature combine microextraction methods with fluorescent detection techniques [34,35].
In this study, we focus on the development of a highly sensitive, environmentally friendly, and green method for determining PA, combining VALLME with fluorescence detection (FLD). This method was successfully applied to real samples, confirming its practical applicability in environmental and analytical chemistry.

2. Materials and Methods

2.1. Materials

All chemicals used were of analytical-grade purity and were dissolved in doubly distilled water. A stock solution of (2Z)-1,3,3-trimethyl-2-[(E)-3-(1,3,3-trimethylindol-1-ium-2-yl)prop-2-enylidene]indole chloride, Astrafloksin (AF) dye (Jiacheng-Chem Enterprises Limited, Hángzhōu, China) with a final concentration of 10−3 M was prepared by dissolving 0.039 g of AF in doubly distilled water after adding three drops of ethyl alcohol and stirring with a magnetic stirrer to ensure complete dissolution. The prepared solution was then adjusted to a final volume of 100 mL in a volumetric flask. An AF working solution with a final concentration of 2 × 10⁻⁵ M was prepared by diluting the AF stock solution with doubly distilled water in a measuring flask. A fresh working solution was prepared from the stock solution for each measurement. A stock solution of PA (Merck, Darmstadt, Germany) with a final concentration of 10−3 M was prepared by dissolving 0.023 g of PA in doubly distilled water, stirring on a magnetic stirrer until fully dissolved. This solution was then adjusted to a final volume of 100 mL in a volumetric flask. The PA working solution, with a final concentration of 10−5 M, was prepared by diluting the PA stock solution with doubly distilled water in a volumetric flask. A fresh working solution was prepared from the stock solution before each measurement. Buffer solutions with pH values in the range of 3.0–10.0 were prepared using a 1 M solution of ammonium hydroxide (ITES, Dlhé Klčovo, Slovakia) and a 1 M solution of acetic acid (ITES, Dlhé Klčovo Slovakia). The n-amyl acetate and other organic solvents used were purchased from Centralchem (Bratislava, Slovakia). Deep eutectic solvent (DES) extraction mixtures were prepared by combining tetrabutylammonium bromide (TBAB) (Merck, Darmstadt, Germany) with various alcohols such as hexanol, octanol, and decanol (Merck, Darmstadt, Germany) in different molar ratios.

Applied Instruments

Fluorescence measurements were conducted using a Shimadzu RF-6000 luminescence spectrophotometer (Kyoto City, Japan). A high-precision cell fluorescence micro cuvette (10 × 2 mm) from Hellma Analytics (Müllheim, Germany) was employed for these measurements. A Fisherbrand Vortex Stirrer 3000 (Fisher Scientific, Hampton, VA, USA) facilitated the extraction of the ion associate (IA), while an MRC BLCEN-208 centrifuge from LabGear (Washington, DC, USA) was utilized to separate the organic and aqueous phases. The spectrophotometric measurements were conducted using a Specord S600 spectrophotometer (Analytic Jena, Jena, Germany). For in situ measurements, a standard optical probe from Hellma Analytics was connected to the spectrophotometer. pH was measured with a portable Vio 70 pH meter (XS Instruments, Carpi, Italy). DES extraction mixtures were prepared using an AREX DIGITAL Heating Magnetic stirrer from VELP SCIENTIFICA (Usmate Velate, Italy).

2.2. Methods

2.2.1. Samples Preparation

Tap water samples were filtered through a paper filter (blue ribbon) using a Büchner funnel, and a 1 mL aliquot was used for analysis.

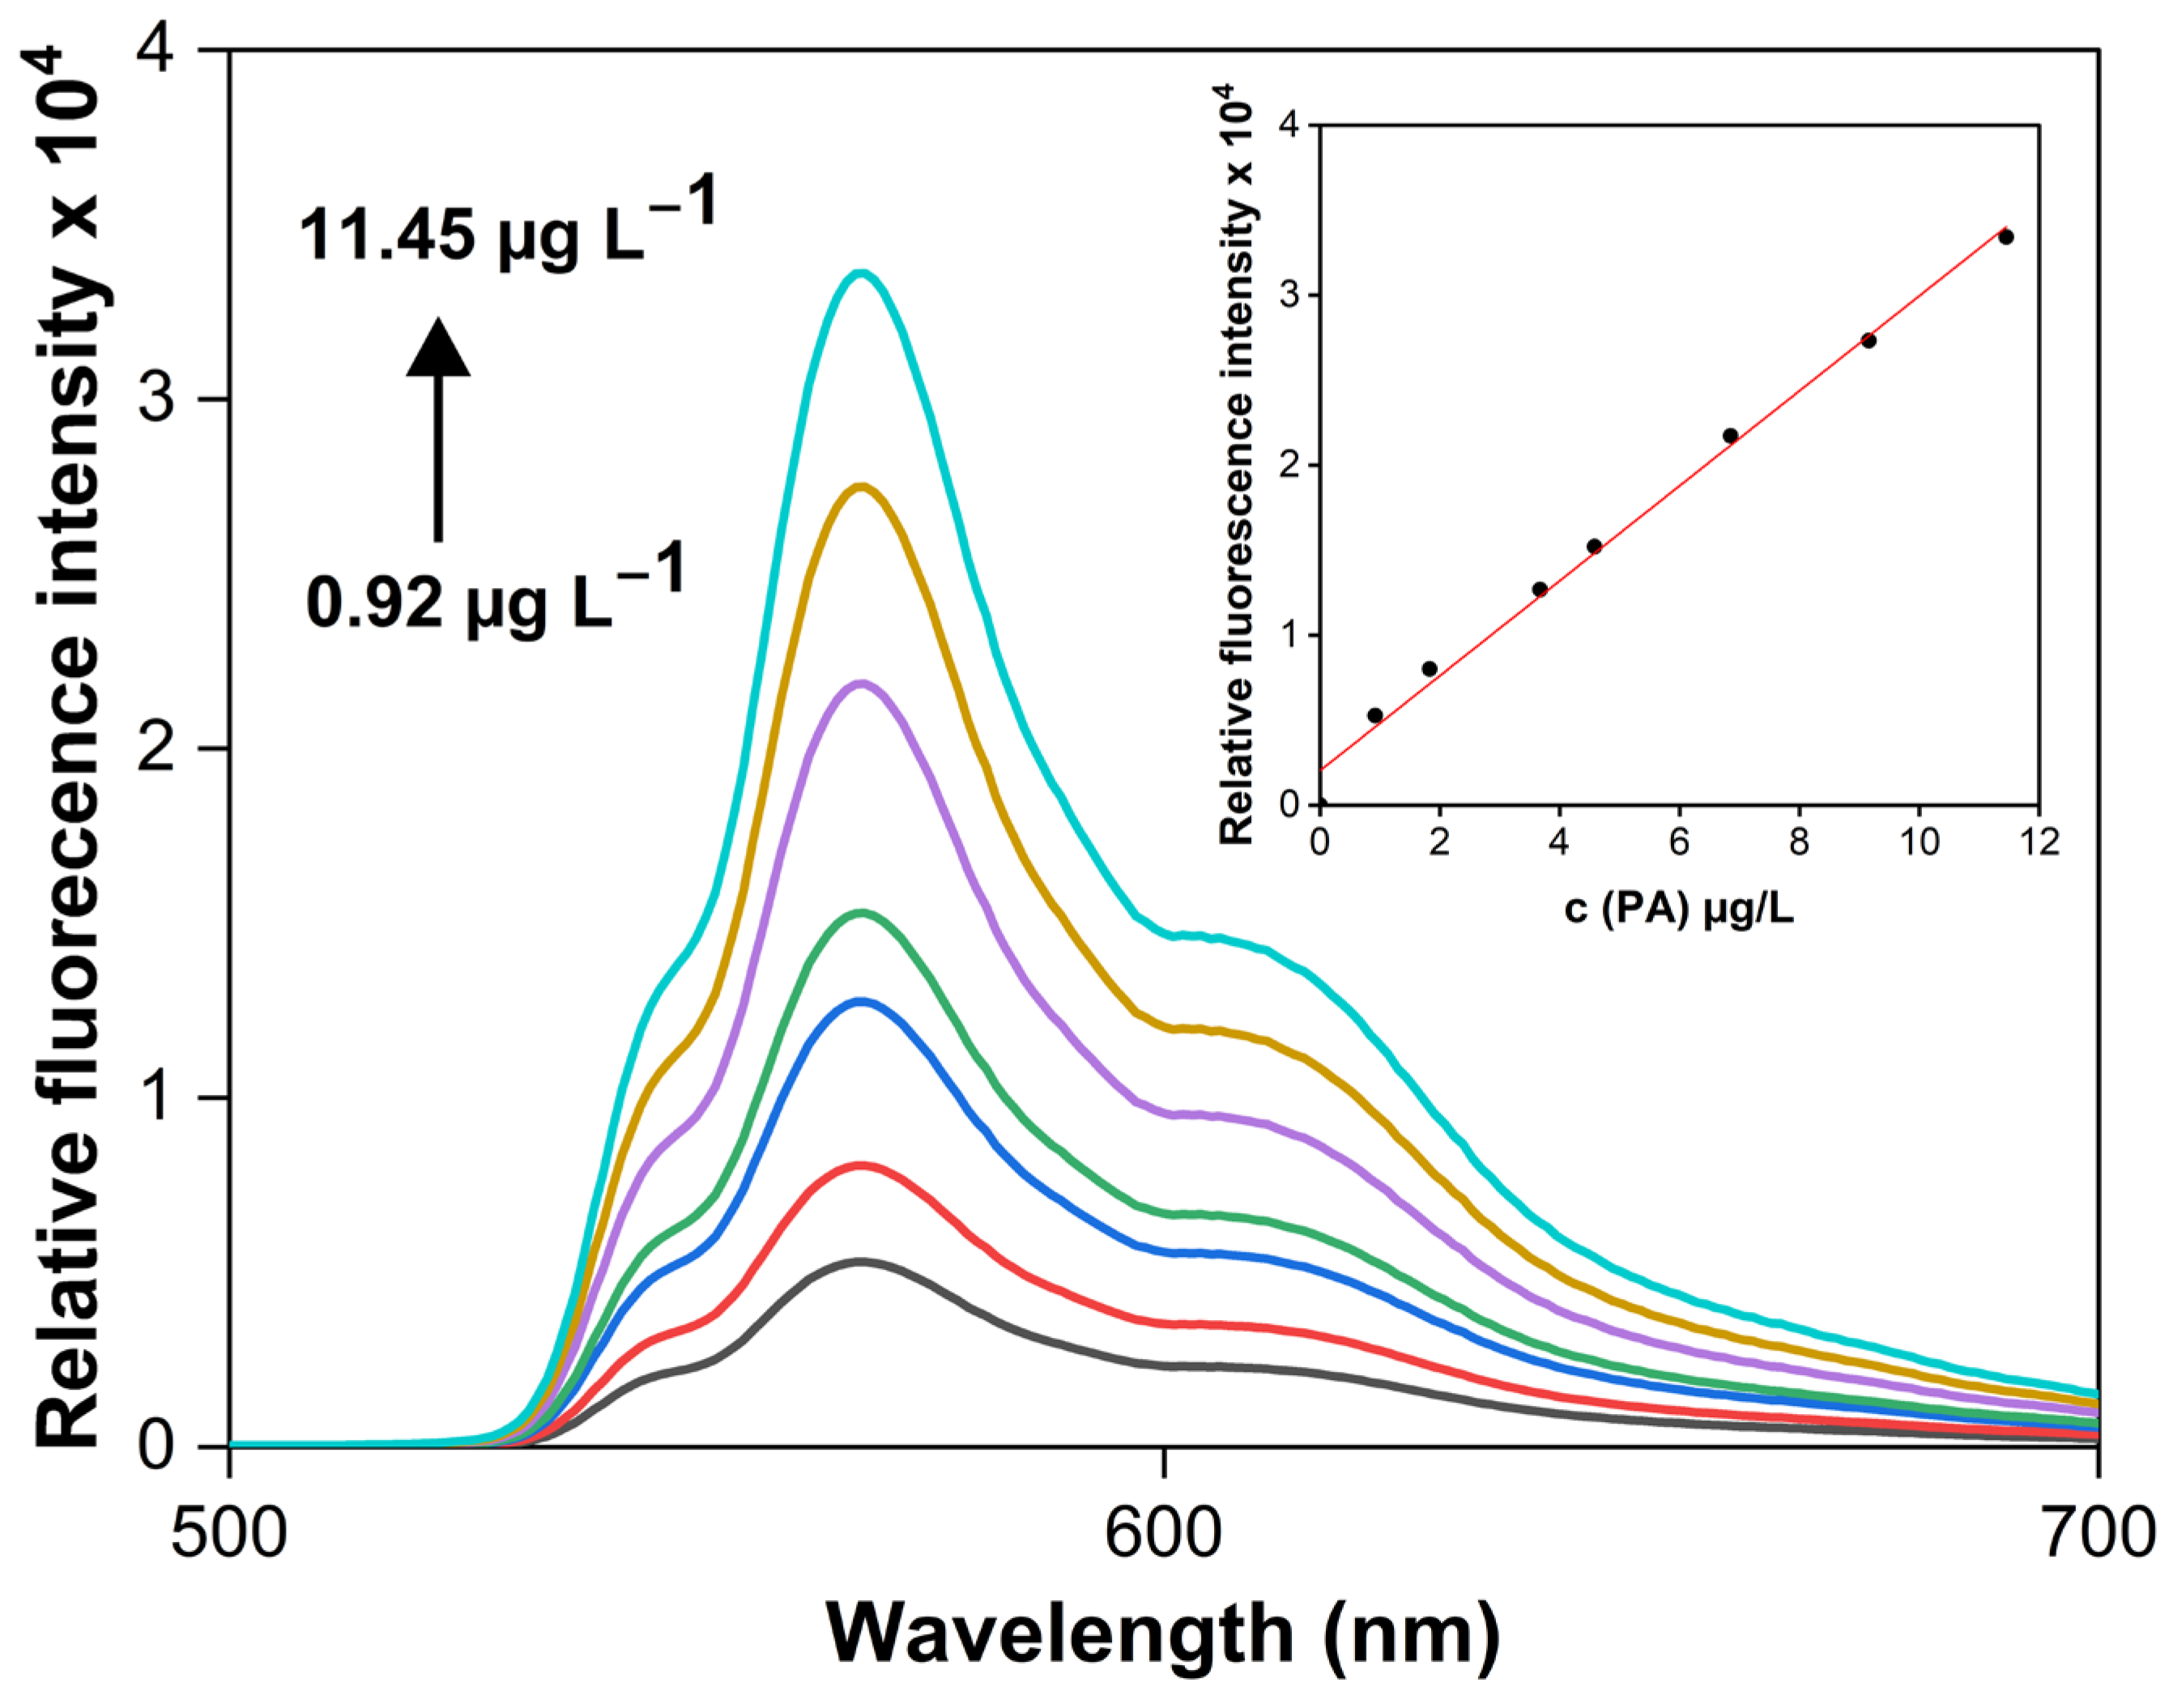
2.2.2. Procedure of Calibration and PA Determination with VALLME-FLD

Centrifugation tubes were filled with 5 mL of a sample containing the following components: AF dye (2 × 10⁻⁶ M), 0.5 mL of pH 3.0 buffer, and PA solution with concentrations ranging from 0.92 to 11.45 µg L−1, with the volume adjusted using distilled water. Next, 500 µL of n-amyl acetate extract was added to each test tube. The mixtures were vortexed at 1600 rpm for 15 s. The resulting turbid emulsion underwent centrifugation for 2 min at 5000 rpm. Afterward, the extraction phase was collected using a micropipette and transferred to a fluorescent micro cuvette (Hellma Analytics, Müllheim, Germany). Fluorescence measurements were made at 569 nm, with excitation at 540 nm. Results were analyzed based on calculations from the calibration curve.

2.3. Computational Details

The reciprocal starting positions of ions in ion associates (IA) were generated using the ABCluster 3.3Pre software [36,37]. Initial geometries and partial charges of the ions needed for the ABCluster bee colony algorithm were obtained using the GFN2-xTB tight-binding method implemented in XTB 6.7.0 [38,39].
Re-optimization of geometry and frequency calculations for separate ions and ion associates were performed using the M06-2X functional and the 6-311G(d,p) basis set with diffuse functions on oxygen and nitrogen atoms [40,41]. The M06-2X functional was chosen for its efficiency in modeling geometries [42], electrostatic interactions [43,44], weak dispersion interactions [45], and other properties [46]. To screen the charge of the ionic species and suppress unphysical electron density “leakage”, the conductor-like polarizable continuum model (CPCM) with water solvent parameters was applied [47]. Electrostatic potential-derived charges were computed using the grid-based CHELPG method at the specified level of theory [48]. All the DFT computations were accelerated using the “resolution of identity” and “chain of spheres” approximations [49,50]. Free energies of solvation for the free ions and IA in water and amyl acetate were calculated using the COSMO-RS approach, employing the recently developed openCOSMO-RS 24a model [51,52]. All calculations were performed using the ORCA 6.0.1 software package [53].
Non-covalent interionic interactions were analyzed using the independent gradient model based on the Hirshfeld partition of molecular density (IGMH) [54]. Multiwfn 3.8 was employed to perform this analysis [55].

3. Results and Discussion

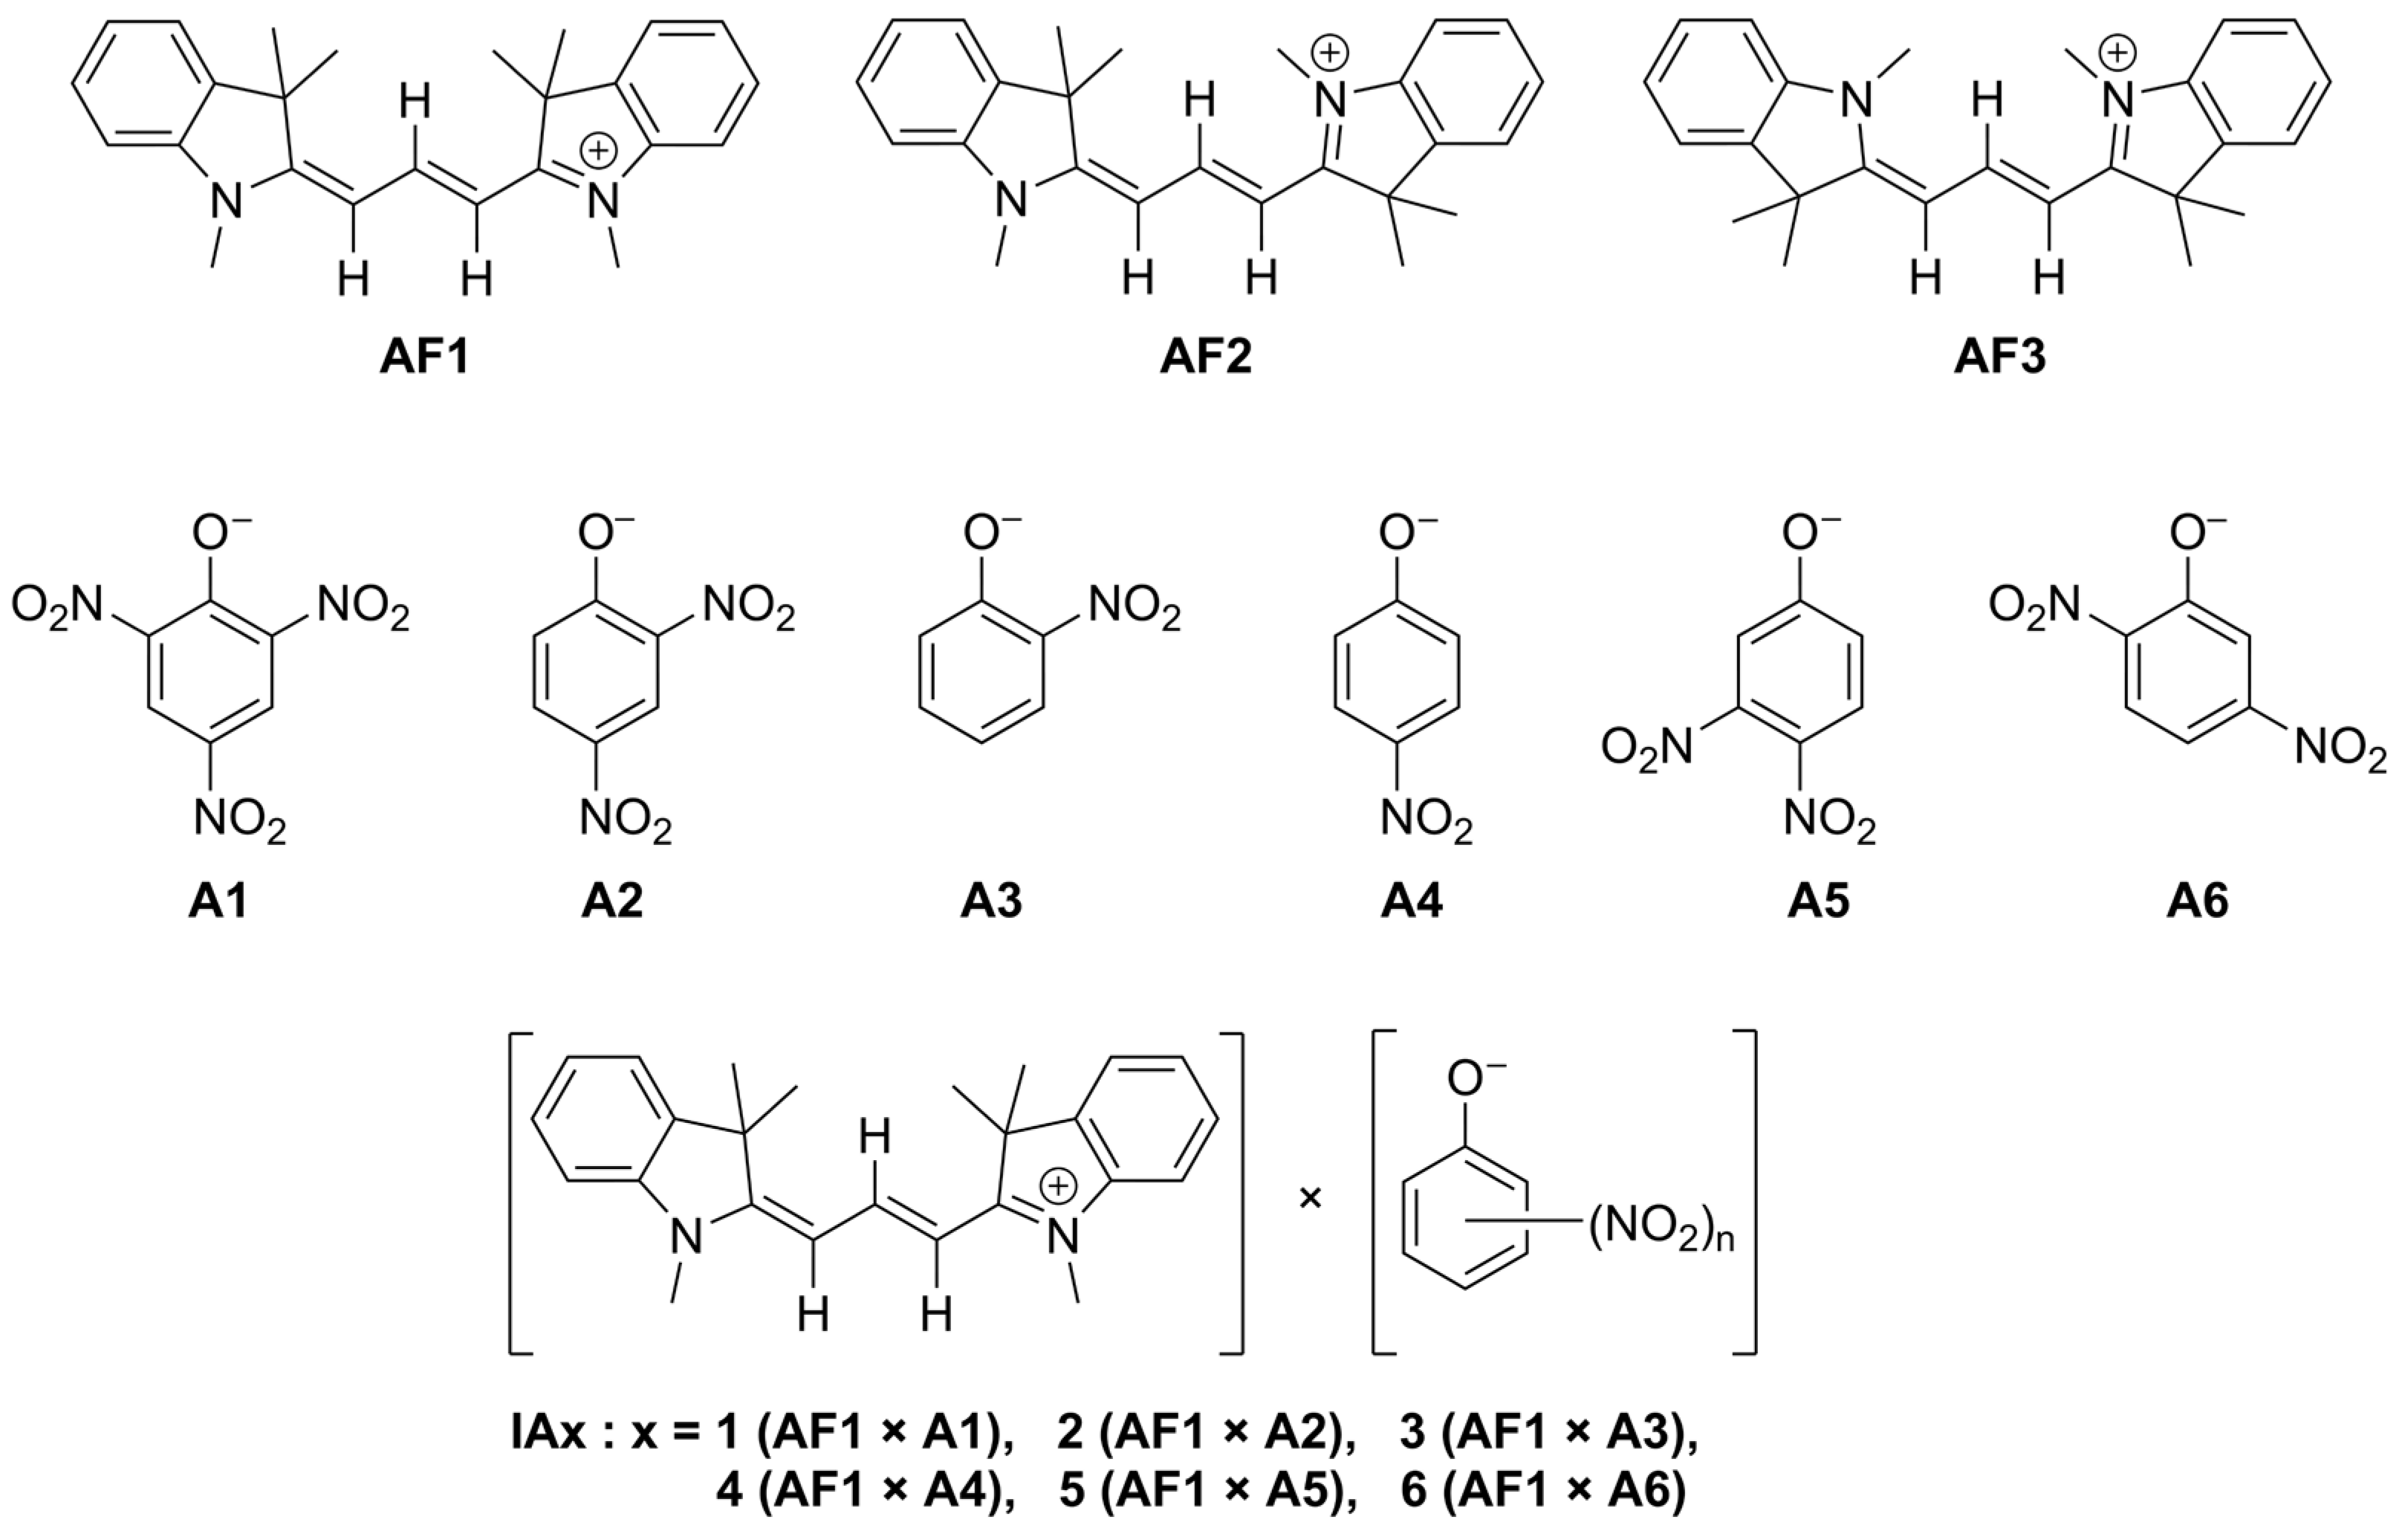
3.1. Reaction Chemistry

AF, also known as Basic Red 12, is a synthetic fluorescent dye belonging to the xanthene group and classified as a polymethine basic dye [56]. Polymethine dyes are widely used as reagents in extraction spectrophotometric determinations of various analytes [57,58]. The structure of AF contains a conjugated system that enables the absorption and emission of light within the visible spectrum. This characteristic is crucial for its broad application as a fluorescent dye in biological and analytical chemistry [59]. The spectral and solvatochromic properties of AF have been extensively studied in our previous research [60,61]. The dye is characterized by its intense color and strong fluorescence. AF exhibits two prominent absorption maxima: approximately 540 nm (in its dimeric form) and a less intense maximum at 510 nm (in its monomeric form) [61]. The fluorescence spectra of AF in water are symmetrical with respect to the absorbance spectra. The maximum peak in the fluorescence spectrum is observed at 560 nm, with another, less intense peak at 600 nm.
In this study, the spectral and acid–base properties of the dye AF and nitrophenols, particularly 4-nitrophenol (4-NP), 3,4-dinitrophenol (3,4-DNP), and PA, were investigated. For this purpose, the previously developed technique of on-line measurement using an optical probe and glass pH electrode [61] was employed. AF is characterized by color stability across a wide pH range (Figure 1). A decrease in absorbance in strongly acidic media is attributed to the formation of a protonated form of the dye, which exhibits a maximum in the UV region of the spectrum (330 nm) and is characterized by significantly lower color intensity. In solutions with pH greater than 10.0, a decrease in light absorption at 540 nm is observed, which is explained by the hydrolysis of the dye and the formation of a colorless form with a maximum at =322 nm. This indicates that AF is capable of forming ionic associations (IA) over a broad pH range, from pH 1.0 to pH 10.0.
In aqueous solutions, nitrophenols are either colorless or pale yellow (at higher concentrations). In the absorption spectrum, all three nitrophenols display two absorption maxima. The more intense maximum is located in the longer wavelength region: at 358 nm (PA), 402 nm (4-NP), and 399 nm (3,4-DNP). The less intense maximum shows a hypsochromic shift to shorter wavelengths: 241 nm (PA), 318 nm (4-NP), and 326 nm (3,4-DNP), respectively. All nitrophenols are monoacids, so it is assumed that the first peak corresponds to the dissociated anionic form, while the second peak corresponds to the molecular form of nitrophenols. Since it is known that only anionic forms are capable of forming IA, it was important to investigate the pH intervals in which these forms dominate. As shown in Figure 1, the effect of pH on the absorbance of nitrophenols varies. It was observed that the anionic forms of the compounds dominate in different pH ranges: 1.0–10.0 (PA), 6.0–10.0 (3,4-DNP), and 7.5–10.0 (4-NP).
These results are in good agreement with the tabulated pK values of the corresponding nitrophenols: 0.42, 5.2, and 7.2, respectively. PA is a strong acid, meaning it exists in its anionic form across a wide range of pH values, from acidic to alkaline environments. 3,4-DNP is a weak acid and will exist in its anionic form only in neutral and alkaline solutions. 4-NP, being the weakest acid, will primarily exist in its anionic form exclusively in alkaline environments. This explains the limited conditions under which ionic associations between 4-NP and 3,4-DNP with polymethine dyes can form [62].
The basis of the spectrofluorometric determination of nitrophenols is their ability to form IAs with AF. For this, the nitrophenols must dominate in water solutions in the anionic form, and the dye in the singly charged cationic form. The choice of extractant is also important; it should quantitatively extract the formed IA and minimally extract the dye itself. It was found that the picrate-based IA was extracted the best. The excitation and emission spectra of n-amyl acetate extracts of IA picrate from AF are shown in Figure 2. The optimal excitation wavelength, which provides the maximum fluorescence intensity of IAs, is 540 nm. IAs formed by 3,5-DNP and 4-NP have similar fluorescent properties, but are extracted much weaker than PA.
In general, the process of formation and extraction of IAs formed by nitrophenols and AF, using PA as an example, can be represented by Equations (1)–(3):
(AF+)(Cl)(aq) ↔ (AF+)(aq) + Cl(aq)
(PA)(aq) ↔ (PA)(aq) + H+(aq)
(AF+)(aq) + (PA)(aq) ↔ [(AF)+(PA)](org.)
However, it is difficult to explain why PA is so well extracted as an IA compared to other nitrophenols solely based on differences in acid–base properties alone. We believe that the influence of the molecular structure, particularly the symmetry of the ions, may also play an important role. AF is one of the few symmetrical polymethine dyes. This may be the reason for its increased reactivity. In the case of reactions with nitrophenol anions, this symmetry can be a decisive factor, since PA has a more symmetrical structure compared to DNP and NP. A more detailed study of the influence of structure on the formation and extraction of IAs is described in the next section.

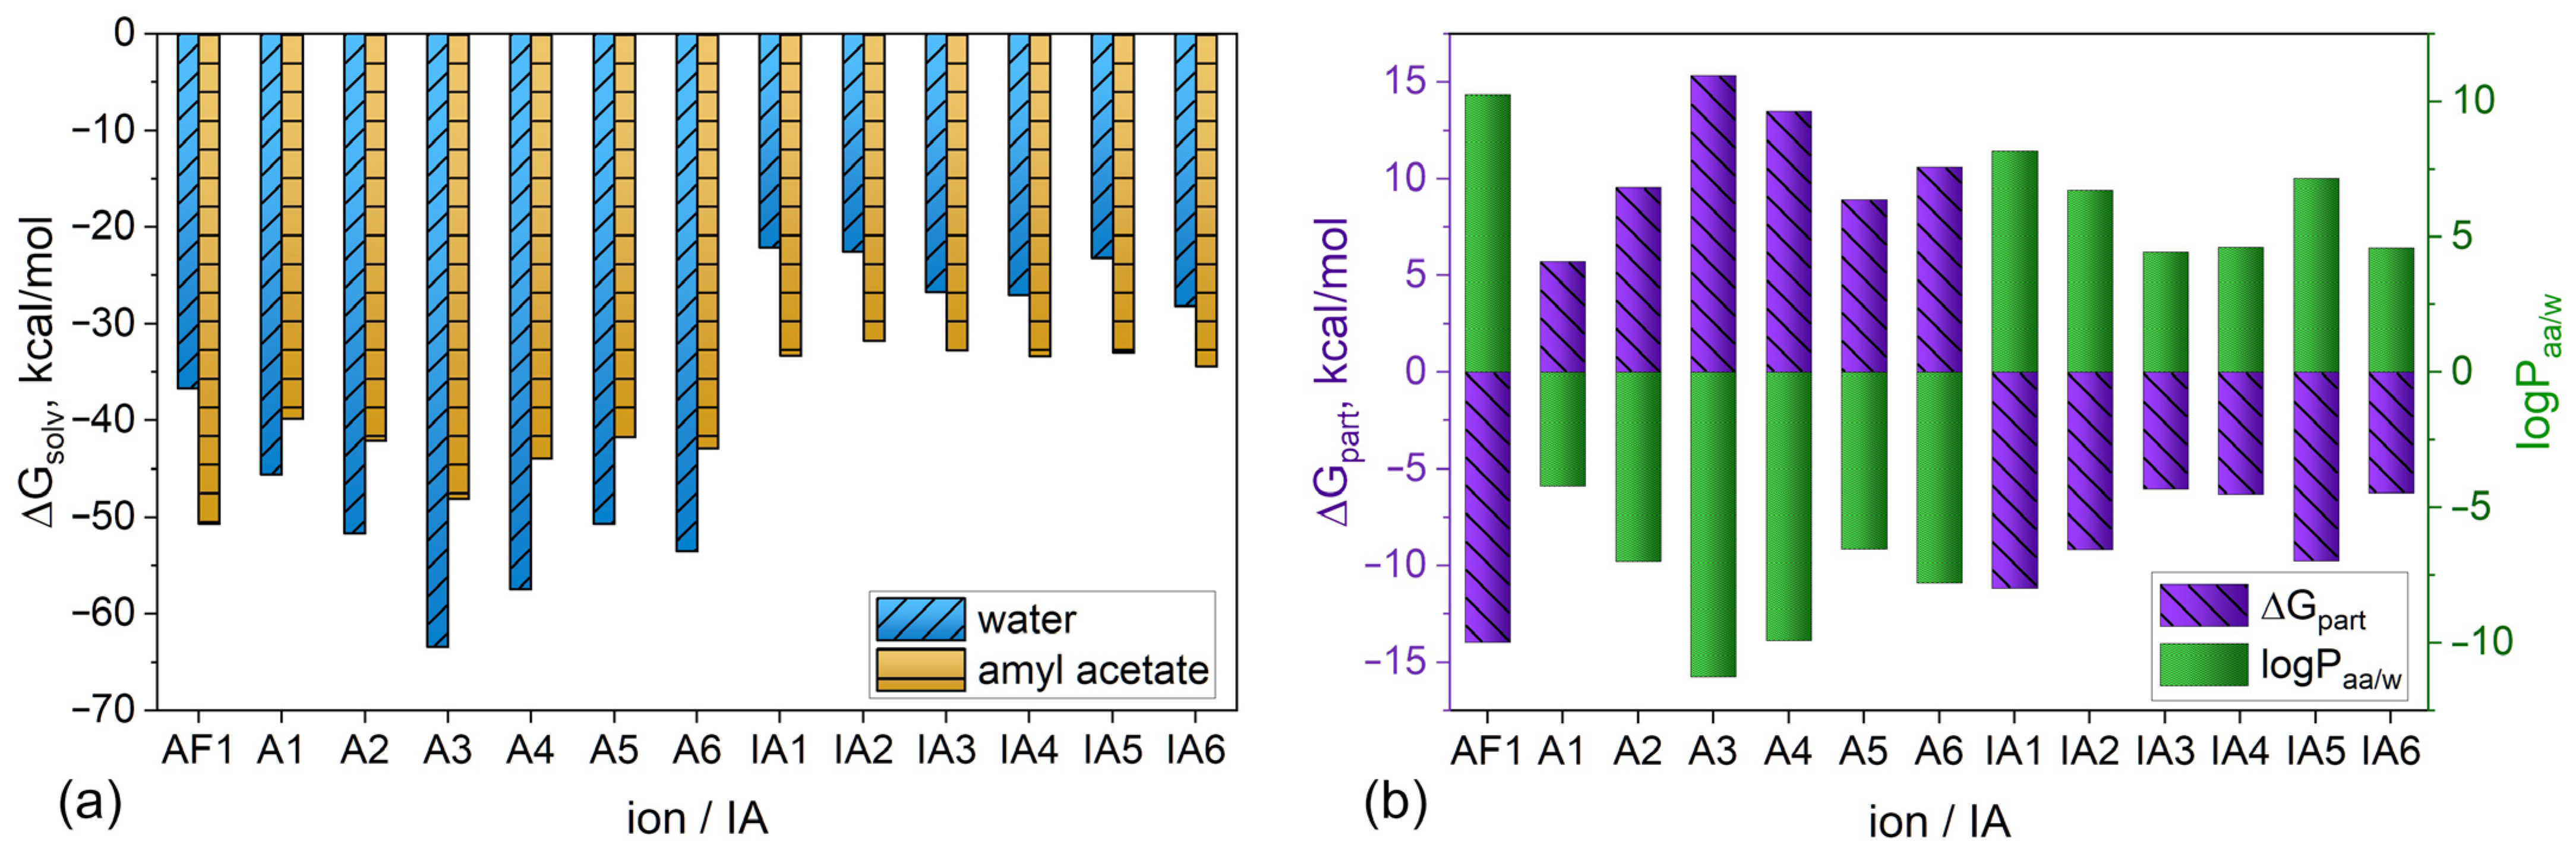
3.2. Theoretical Explanation of the Mechanism of Picrate Extraction

Theoretical calculations were performed to investigate the mechanism of interphase selective transfer of picrate from water to amyl acetate. Several structures were considered as model species in this study, including three cationic forms of AF: trans-1,3,3-trimethyl-2-[(1E)-3-[(2E)-1,3,3-trimethyl-2,3-dihydro-1H-indol-2-ylidene]prop-1-en-1-yl]-3H-indol-1-ium (AF1), cis-1,3,3-trimethyl-2-[(1E)-3-[(2E)-1,3,3-trimethyl-2,3-dihydro-1H-indol-2-ylidene]prop-1-en-1-yl]-3H-indol-1-ium (AF2), and cis-1,3,3-trimethyl-2-[(1E)-3-[(2Z)-1,3,3-trimethyl-2,3-dihydro-1H-indol-2-ylidene]prop-1-en-1-yl]-3H-indol-1-ium (AF3). Additionally, six nitro-substituted phenolate anions were considered: picrate (A1), 2,4-dinitrophenolate (A2), 2-nitrophenolate (A3), 4-nitrophenolate (A4), 3,4-dinitrophenolate (A5), and 2,5-dinitrophenolate (A6). According to CPCM-DFT calculations, the AF1 form is 1.74 kcal/mol more stable than AF2 and 3.33 kcal/mol more stable than AF3. Therefore, only the AF1 structure was used in subsequent calculations for the ion pairs IA1-IA6. All structures are presented in Figure 3.
The interaction of ions should be studied in detail to understand the influence of ion association on the phase-transfer process. Electrostatic interactions can be analyzed using partial atomic charges, and in this study, we focused on the CHELPG charges, which are designed to reproduce the molecular electrostatic potential (MESP). Both CHELPG and MESP are known to be accurate in predicting electrostatic interactions [63,64]. The structures of the ions and IAs, colored according to atomic CHELPG charges, are shown in Figure 4. The exact values of CHELPG charges are assembled in the Supplementary Information File.
Particular attention should be given to the changes in CHELPG charges during the ion association process. Generally, the absolute values of partial charges differ by no more than 0.2 e between the associated form and the separate ions. However, even below 0.2 e, these changes should not be attributed to a charge transfer process between ions. The overall charges of individual ions in the IA deviate from unity by less than 0.02 e, a negligible difference. Instead, the observed changes in atomic charges during ion association likely result from a slight redistribution of electron density within the ions. This redistribution alters the MESP, which is reflected in the corresponding CHELPG charges.
According to Figure 4 all the considered species are highly polar, emphasizing the crucial role of electrostatic forces in interionic interactions within the corresponding IA. Nevertheless, due to the bulkiness of the AF1 cation, weak van der Waals inter-fragment interactions are also anticipated [65]. To further analyze these weak non-covalent interactions, we employed the IGMH approach. The interionic IGMH isosurfaces are provided in the Supplementary Information (see Figure S1). Large green areas on the isosurface indicate weak van der Waals dispersion interactions, while stronger electrostatic attractions corresponding to C–H⋯O and C–H⋯O=N interactions are highlighted in blue. These findings suggest that interactions between ions in IA are governed by strong Coulomb electrostatics, intermediate CH⋯O hydrogen bonding, and weak dispersion forces.
The subsequent study focused on the solvation of the IAs. The phase-transfer process of ions and IAs is heavily influenced by their interactions with solvent molecules. For this analysis, we utilized the recently developed open-source implementation of the COSMO-RS algorithm, renowned for its accuracy in modeling solvation thermodynamics. DFT calculations required for the openCOSMO-RS-24a protocol were conducted at the BP86/def2-TZVPD level of theory [66,67,68,69]. Figure 5a–c illustrate an example of molecular COSMO-RS surface segmentation used to calculate solvation descriptors.
Typically, the COSMO-RS surface is characterized by the σ-profile, a histogram representing the density [ρnorm(σ)] of the screening charge (σ). The normalized σ-profiles of water, amyl acetate, and IA1 are shown in Figure 5d. A qualitative comparison of IA1’s σ-profile with those of water and amyl acetate indicates that IA1 is likely more soluble in amyl acetate than in water. IA1’s surface is predominantly characterized by screening charges ranging from −1 to +1 e/nm2, aligning well with the σ-profile of amyl acetate. Conversely, water’s σ-profile, with screening charge values spanning −2 to −1 and +0.5 to +2 e/nm2, reflects its highly polar nature.
The solvation free energies (ΔGsolv) calculated using the COSMO-RS method are summarized in Figure 6a. Notably, the AF1 cation exhibits lower solvation energy in amyl acetate than in water. In contrast, the phenolate anions display the opposite trend. The association of anions with AF1 leads to IA with ΔGsolv values of approximately −33 kcal/mol in amyl acetate. However, in water, the ΔGsolv values of IA are about 25–35 kcal/mol higher than those of the free phenolate anions and significantly higher than the corresponding values in amyl acetate. This difference results in a preferential solvation of IA in amyl acetate, whereas free anions are more favorably solvated in water.
Using the calculated ΔGsolv values, the free energies of the interphase transition from water to amyl acetate (ΔGpart) can be determined as ΔGpart = ΔGaa − ΔGwater, where “aa” refers to amyl acetate. More negative ΔGpart values indicate a preference for transfer into the amyl acetate phase, while more positive ΔGpart values correspond to species concentrating preferentially in the water phase (see Figure 6b, purple bars).
A partition coefficient describes how a solute is distributed between two immiscible solvents, serving as a valuable descriptor of lipophilicity [70,71,72]. In this study, the solvents are water and amyl acetate, and the corresponding partition coefficient can be expressed as logPaa/w = −ΔGpart/(2.303RT), where R is the gas constant (0.0019872 kcal/K/mol), and T is the temperature (298 K). From Figure 6b (green bars), it is evident that the logPaa/w values of the IAs are positive, indicating that the IAs are primarily distributed in the amyl acetate phase. In contrast, free anions, characterized by negative logPaa/w values, are predominantly concentrated in the water phase. Based on these logPaa/w values, the partitioning of the IA species can be calculated, and they can be ranked in order of decreasing partition in the “water–amyl acetate” system: IA1 (1.5 × 10⁸) > IA5 (1.5 × 10⁷) > IA2 (5.5 × 10⁶) > IA4 (4.2 × 10⁴) > IA6 (3.9 × 10⁴) > IA3 (2.7 × 10⁴). This ranking demonstrates that, at equal concentrations of anionic species, an extraction system consisting of amyl acetate and the AF cation will selectively extract the picrate anion between 10 times (compared to IA5) to 5500 times (compared to IA3) more effectively than other phenolates.

3.3. Investigation of the Experimental Conditions

As part of the optimization, we examined the effects of various chemical and physical factors on the relative fluorescence intensity, with the parameters that led to the maximal difference in fluorescence intensity (F–F0) considered optimal. Fluorescence was measured at the emission maximum, which occurred at 569 nm upon excitation at 540 nm.

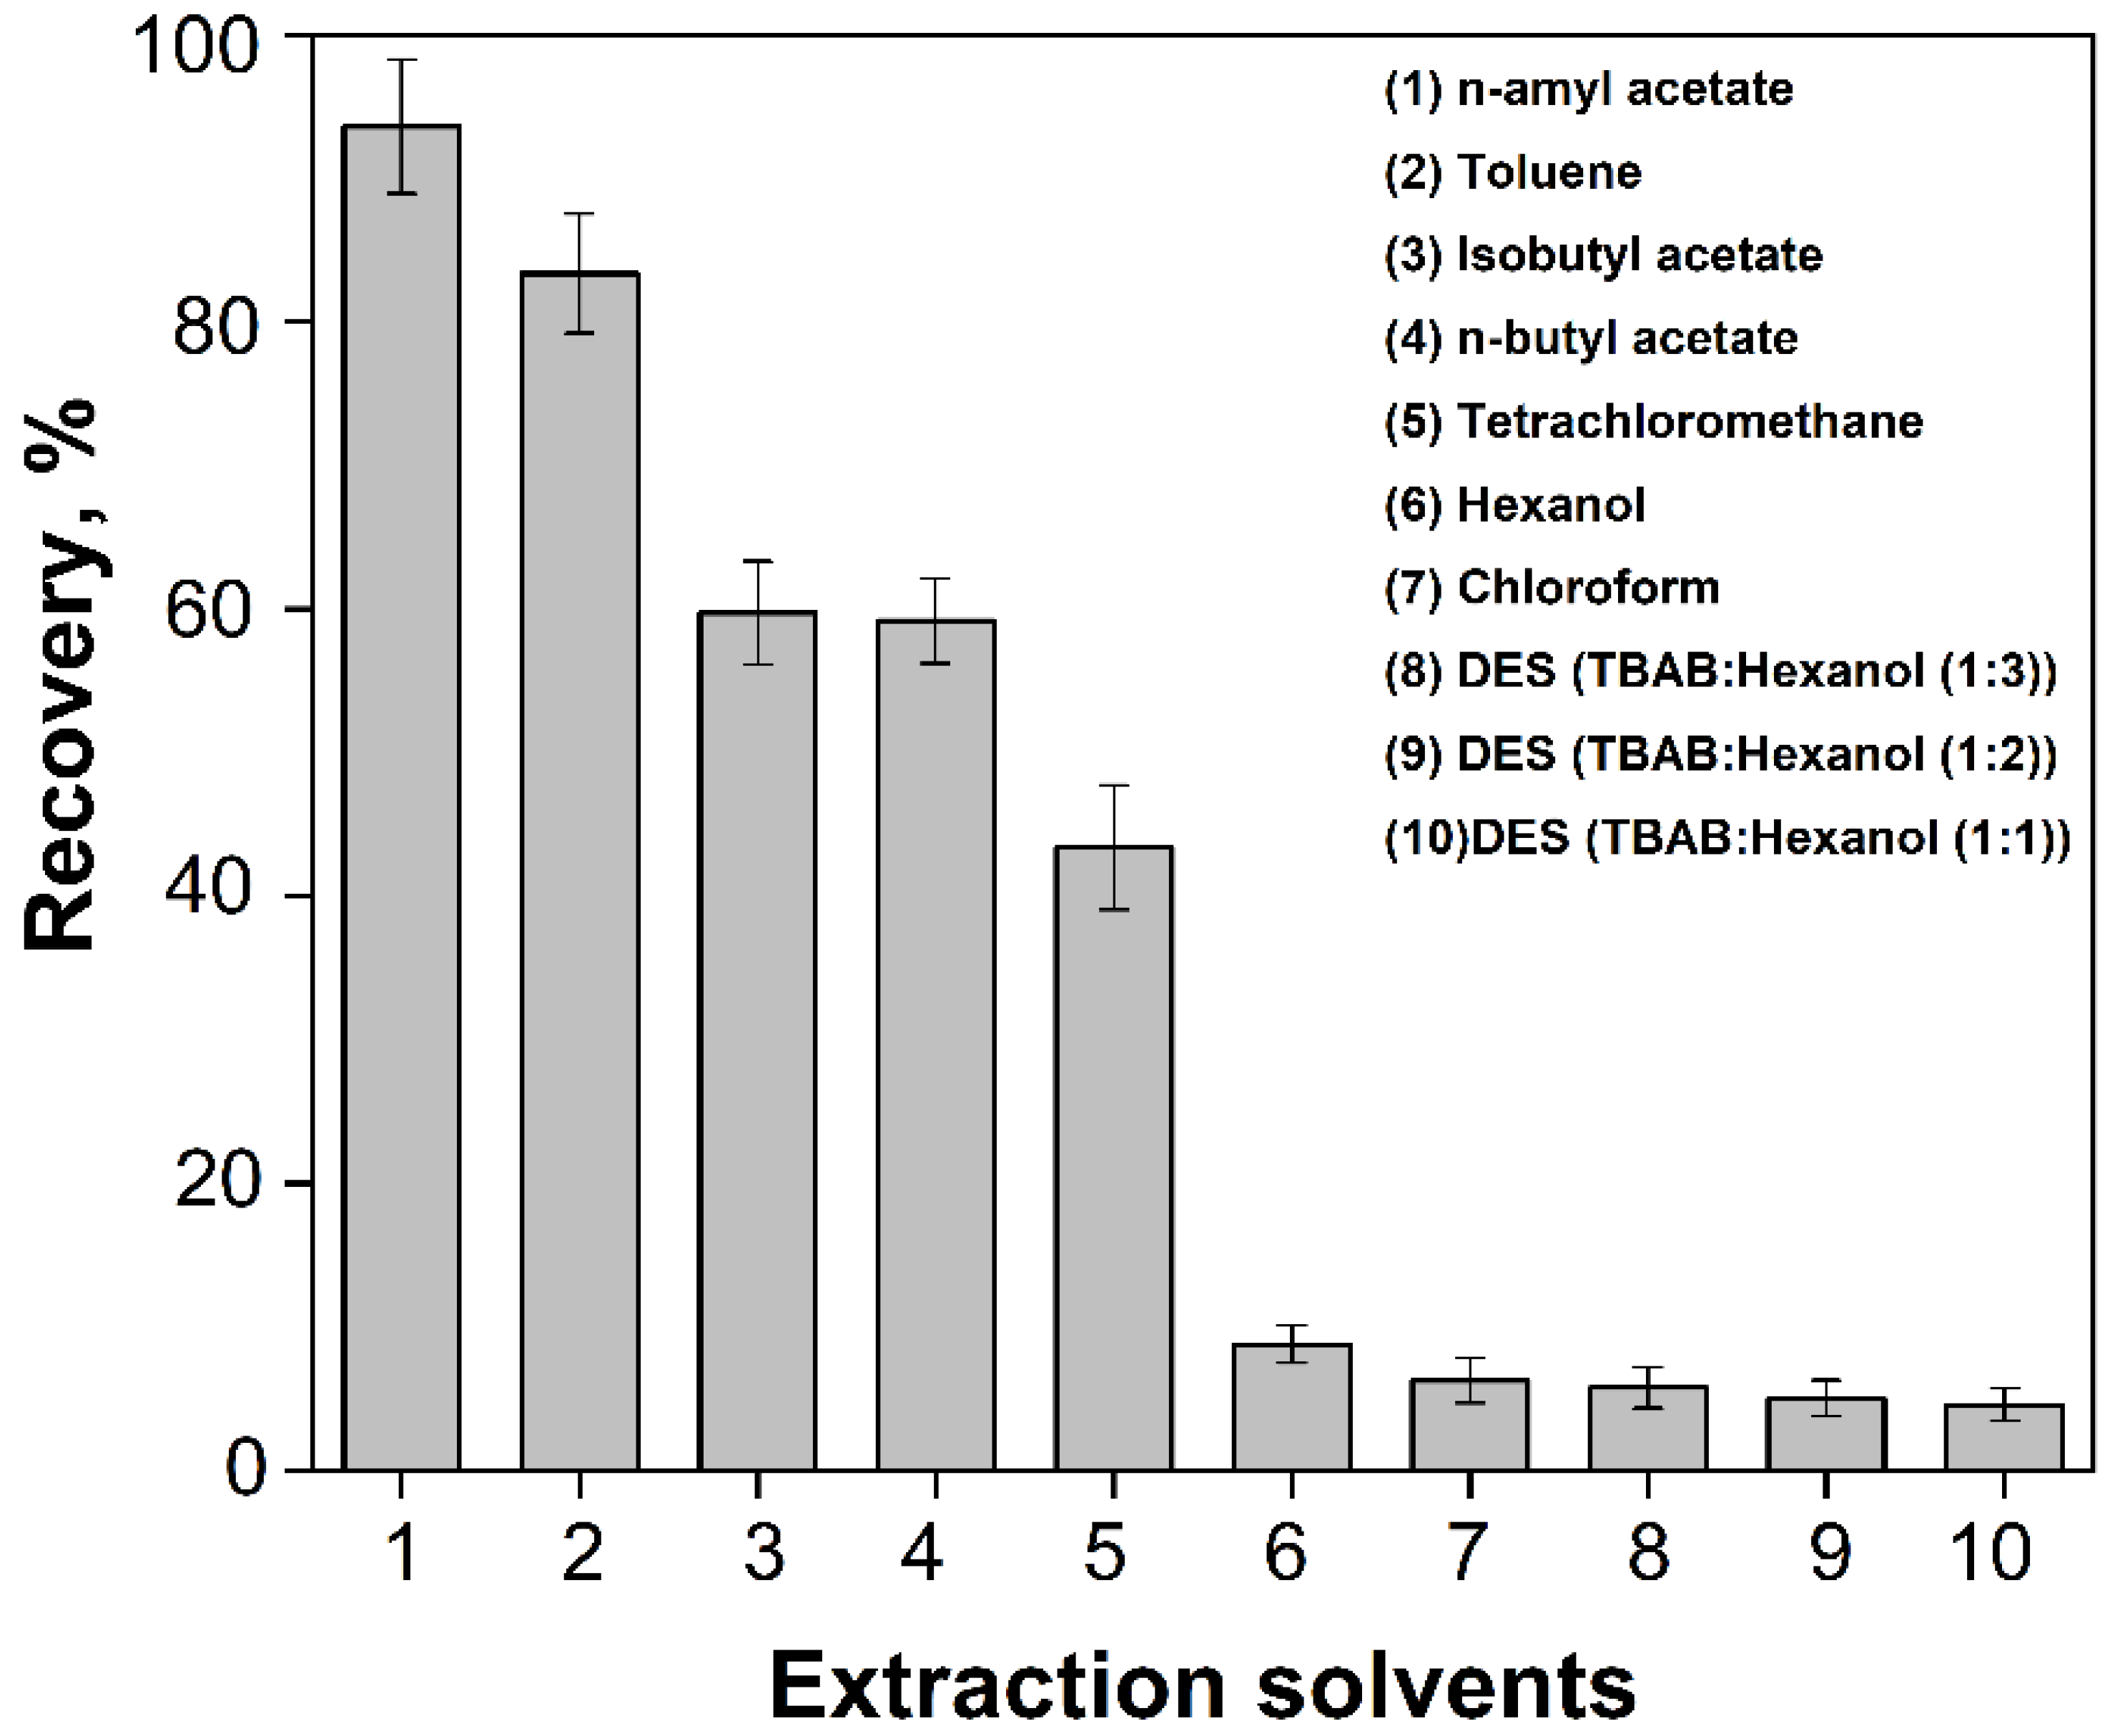
3.3.1. Effect of Type of Extraction Solvents

Given that we implemented a microextraction technique in this method, we also focused on optimizing the organic solvent, or extraction phase, used. We tested various solvents, including n-amyl acetate, n-butyl acetate, isobutyl acetate, toluene, chloroform, tetrachloromethane, hexanol, and DES formulated from TBAB and hexanol in varying molar ratios (1:1, 1:2, 1:3). These solvents differ not only in their chemical and physical properties but also in their environmental impact.
Based on the measured results, it can be concluded that chloroform, n-butyl acetate, isobutyl acetate, tetrachloromethane, hexanol, and DESs exhibit only low extraction efficiency, while n-amyl acetate and toluene demonstrate good extraction efficiency (Figure 7). Considering the measured results and also the ecological impact, we chose n-amyl acetate as the optimal extraction phase, as it is the most suitable extractant and also meets the requirements for green analytical chemistry due to its low toxicity.

3.3.2. Effect of AF Concentration

We optimized the concentration of the AF dye within the range from 4 × 10⁻⁷ to 4 × 10⁻⁶ M. Fluorescence measurements under the specified conditions revealed a gradual increase in the relative fluorescence intensity up to an AF dye concentration of 2 × 10⁻⁶ M. In the concentration range of (2.5–3.2) × 10−6 M, the fluorescence signal remained relatively constant. However, with further increases in the AF concentration, the relative fluorescence intensity began to decrease. Based on this optimization, we selected 2 × 10⁻⁶ M as the optimal AF dye concentration for subsequent experiments.

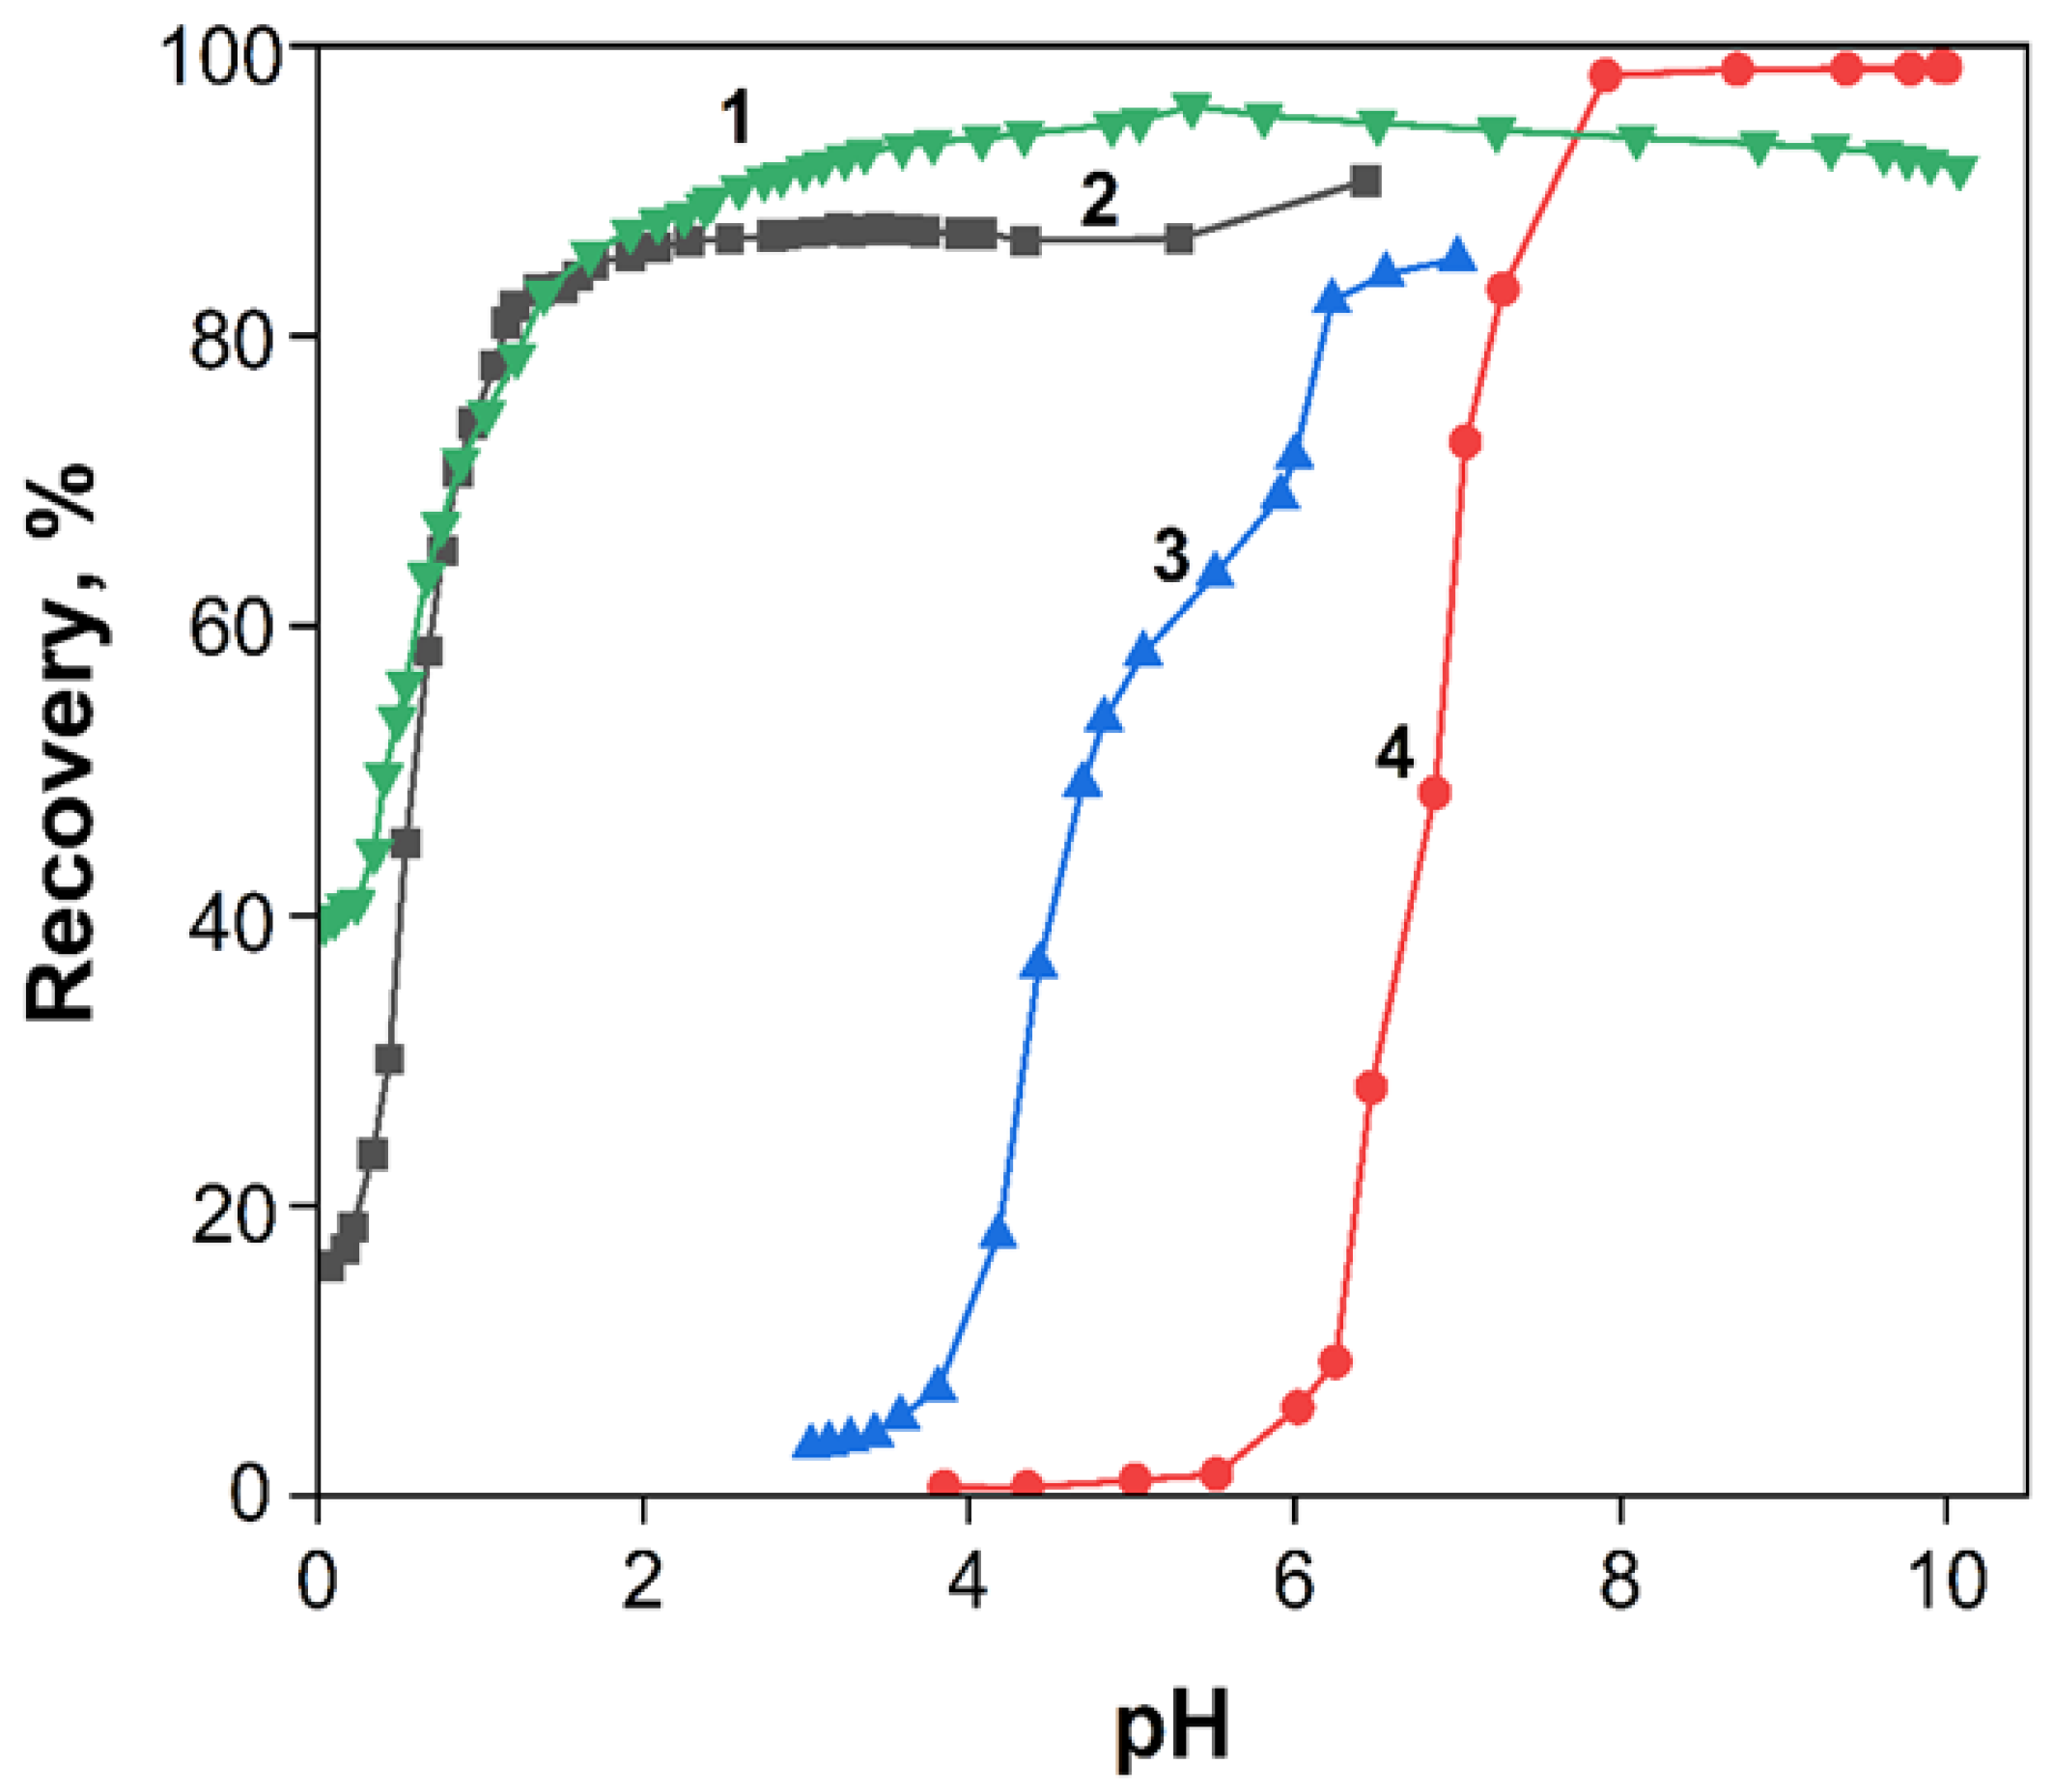
3.3.3. Effect of pH and Buffer Volume

In this method, we optimized the pH while maintaining constant concentrations of AF and PA across a defined pH range of 0 to 10.0. The results indicated that the relative fluorescence intensity was minimally affected by pH variations within this range, with no significant differences observed among the pH values. Based on these findings and empirical observations, a pH of 3.0 was selected as the optimal value for subsequent experiments.
Additionally, we optimized the volume of the buffer solution added to stabilize both the pH and ionic strength, testing volumes in the range of 0.5 to 4.0 mL. Based on our results, we selected a buffer volume of 0.5 mL (pH = 3.0) for further experiments.

3.3.4. Effect of Extraction and Vortexing Time

To support automation and improve the efficiency of the extraction process, we investigated the use of vortexing in the method for PA detection. Specifically, we examined the effects of both vortexing speed and time. Vortexing speed was evaluated at three levels: minimum speed (800 rpm), medium speed (1600 rpm), and maximum speed (3200 rpm). The influence of vortexing time was assessed across the following intervals: 2–30 s. Based on the results, we determined that the optimal vortexing conditions were a medium speed (1600 rpm) for a duration of 15 s. These conditions were subsequently applied in all following experiments.

3.3.5. Effect of the Stability of the Extracts

In this section, we optimized the effect of time on the stability of relative fluorescence intensity over the time intervals of 0, 10, 20, 30, 40, 50, and 60 min. The results showed that time did not significantly affect the formation of IA or alter its relative fluorescence intensity. Additionally, we investigated the impact of the reagent addition order on the relative fluorescence intensity. We consider this to be an important advantage of the method, since it is not necessary to control the time interval before measuring the fluorescence of microextracts.

3.4. Interference Study

The influence of interferents under conditions that were evaluated as optimal during the research was investigated. The following inorganic interferents were monitored: KNO3, Na2HPO4, KBr, KI, KSCN, NaNO2, KCl, Na2CO3, Pb(NO3)2, and MgSO4. These interferents were investigated in relation to the analyte (PA) at concentration ratios ranging from 1:1 to 1:100. From the obtained results, we concluded that none of the investigated interferents significantly affected the relative fluorescence intensity.
The influence of organic interferents, including 2-nitrophenol, 4-nitrophenol, 3,4-dinitrophenol, 2,6-dinitrophenol, and 2,5-dinitrophenol was also investigated. These organic compounds belong to the group of nitro compounds and differ, among other factors, in the number and position of nitro groups. The effect of these organic compounds at pH = 3.0 fell within the range of variation, indicating that they do not affect the relative fluorescence intensity at concentration ratios from 1:1 to 1:100. However, when investigating the extraction in an alkaline medium (at pH = 10.0), we found that DNP and NP change the fluorescence intensity and affect the determination of PA at concentration ratios of 1:10 and higher. This observation suggests the possibility of determining dinitrophenols or nitrophenols, which is, however, an area that requires separate investigation.

3.5. Analytical Characteristics of the VALLME-FLD Method and Analytical Application

Upon establishing the optimal conditions, we generated a calibration curve for PA determination. A linear increase in relative fluorescence intensity was observed with rising PA concentrations in the measured extracts (Figure 8). This linearity in the calibration curve for microextraction into 500 µL of n-amyl acetate was maintained over a PA concentration range of 0.92 to 11.45 µg L−1. The regression equation for the calibration line was y = (2793 ± 96)x + (2027 ± 588), where y denotes the relative fluorescence intensity and x represents the PA concentration in µg L−1, with a correlation coefficient R2 = 0.9930. The limit of detection (LOD), calculated as three times the standard deviation of the blank, was 0.40 µg L−1, while the limit of quantification (LOQ), calculated as ten times the standard deviation of the blank, was 1.30 µg L−1.
The comparative characteristics of several current fluorescence methods for PA determination are shown in Table 1. The LOD values and other validation parameters of the proposed method are significantly better compared to those of other fluorescent techniques.
The accuracy and reliability of the proposed method were evaluated by conducting five independent extractions of model samples at two PA concentration levels (3.7 and 9.2 μg L−1) over two consecutive days. As summarized in Table 2, the method achieved satisfactory recovery rates ranging from 94.6% to 104.3%, with relative standard deviations (RSD) between 2.5% and 4.2%.
Green analytical chemistry focuses on improving analytical methods to make them more environmentally sustainable and safer for human health, considering factors such as reagent toxicity, waste generation, energy consumption, and procedural complexity. To assess the greenness and practicality of our VALLME-FLD method, we used a combination of the Analytical GREEnness (AGREE) and Blue Applicability Grade Index (BAGI) tools. The AGREE tool provides a unified score ranging from 0 to 1 based on the 12 principles of green analytical chemistry, while the BAGI evaluates ten key attributes, such as the type of analysis, the number of analytes, sample throughput, reagent types, and the degree of automation, generating an asteroid pictogram with the corresponding score [73,74]. The results of the evaluation using these tools are shown in Figure 9.
The practicality of the proposed method was assessed through its application to the quantification of PA in real water samples, namely tap water. Samples were spiked with various concentrations of PA and analyzed in quintuplicate following the described procedure. Recovery rates were satisfactory, ranging from 97.3% to 101.1%, with an RSD of 1.2 to 2.3%.

4. Conclusions

This study presents an innovative methodology combining VALLME with spectrofluorimetric detection for the determination of PA. The discussed theoretical investigations provide a comprehensive understanding of the interactions of AF with nitro-substituted phenolate anions. Electrostatic and weak dispersion forces were identified as key contributors to interionic interactions in IA, with solvation studies highlighting their preferential distribution into the n-amyl acetate phase over water. The calculated partition coefficients (logPaa/w) and associated rankings underscore the superior selectivity of n-amyl acetate and AF cation systems for extracting picrate anions compared to other phenolates.
The results showed that the proposed VALLME-FLD method, utilizing the formation of IA with the basic polymethine dye AF, is highly effective, selective, and sensitive. The obtained optimal conditions were as follows: AF dye (2 × 10⁻⁶ M), 0.5 mL of pH 3.0 buffer, and 500 µL of n-amyl acetate. The mixtures were vortexed at 1600 rpm for 15 s. The resulting turbid emulsion was then centrifuged for 2 min at 5000 rpm. The optimization of organic solvents revealed that n-amyl acetate provided the best results, achieving a linear calibration curve in the range of 0.92–11.45 µg L−1 (R2 = 0.9930) with a detection limit of 0.40 µg L−1. The method demonstrated high selectivity for PA, even in the presence of inorganic ions and other nitrophenolic compounds at concentrations at least 100 times higher, making it a robust tool for environmental analytical chemistry. A key contribution of this work is its alignment with the principles of green analytical chemistry. The proposed method significantly reduces the consumption of organic solvents, simplifies sample preparation, and shortens analysis time, providing an environmentally sustainable and efficient solution for the determination of PA in water samples. The practicality of the proposed method was assessed through its application to the quantification of PA in real water samples, namely tap water. Recovery rates were satisfactory, ranging from 97.3% to 101.1%, with an RSD of 1.2 to 2.3%.

Supplementary Materials

The following supporting information can be downloaded at: https://www.mdpi.com/article/10.3390/pr13041051/s1, Figure S1: Independent gradient model analysis based on the Hirshfeld partition of molecular density (IGMH). Considered IAs are IA1 (a), IA2 (b), IA3 (c), IA4 (d), IA5 (e), IA6 (f). Table S1: CHELPG partial charges of the separate AF1 cation (a) and cationic part of AIs IA1 (b), IA2 (c), IA3 (d), IA4 (e), IA5 (f), IA6 (g). Table S2: CHELPG partial charges of the separate anions A1 (a), A2 (c), and A3 (e) and corresponding parts of AIs IA1 (b), IA2 (d), and IA3 (f). Table S3: CHELPG partial charges of the separate anions A4 (a), A5 (c), and A6 (e) and corresponding parts of AIs IA4 (b), IA5 (d), and IA6 (f).

Author Contributions

S.K.: investigation, writing—original draft, and writing—review and editing. D.H.: investigation. Y.B.: conceptualization, validation, resources, writing—original draft, writing—review and editing, and supervision. M.F.: investigation and writing—original draft. All authors have read and agreed to the published version of the manuscript.

Funding

This research was funded by VEGA grant of the Scientific Grant Agency VEGA of the Ministry of Education, Research, Development and Youth of the Slovak Republic and the Slovak Academy of Sciences (Grant no. 1/0177/23).

Data Availability Statement

The original contributions presented in this study are included in the article/Supplementary Materials. Further inquiries can be directed to the corresponding authors.

Acknowledgments

Yaroslav Bazeľ and Sofia Kakalejčíková thanks the Scientific Grant Agency VEGA of the Ministry of Education, Research, Development and Youth of the Slovak Republic and the Slovak Academy of Sciences for their support (Grant no. 1/0177/23).

Conflicts of Interest

The authors declare no conflict of interest.

References

  1. Perez, G.V.; Perez, A.L. Organic acids without a carboxylic acid functional group. J. Chem. Educ. 2000, 77, 910. [Google Scholar] [CrossRef]
  2. Roy, B.; Bar, A.K.; Gole, B.; Mukherjee, P.S. Fluorescent tris-imidazolium sensors for picric acid explosive. J. Org. Chem. 2013, 78, 1306–1310. [Google Scholar] [CrossRef] [PubMed]
  3. Sun, X.; Wang, Y.; Lei, Y. Fluorescence based explosive detection: From mechanisms to sensory materials. Chem. Soc. Rev. 2015, 44, 8019–8061. [Google Scholar] [CrossRef] [PubMed]
  4. Wyman, J.F.; Serve, M.P.; Hobson, D.W.; Lee, L.H.; Uddin, D.E. Acute toxicity, distribution, and metabolism of 2,4,6-trinitrophenol (picric acid) in Fischer 344 rats. J. Toxicol. Environ. Health 1992, 37, 313–327. [Google Scholar] [CrossRef]
  5. Bauri, K.; Saha, B.; Mahanti, J.; De, P. A nonconjugated macromolecular luminogen for speedy, selective and sensitive detection of picric acid in water. Polym. Chem. 2017, 8, 7180–7187. [Google Scholar] [CrossRef]
  6. Wang, Y.; Chang, X.; Jing, N.; Zhang, Y. Hydrothermal synthesis of carbon quantum dots as fluorescent probes for the sensitive and rapid detection of picric acid. Anal. Methods 2018, 10, 2775–2784. [Google Scholar] [CrossRef]
  7. Tanwar, A.S.; Meher, N.; Adil, L.R.; Iyer, P.K. Stepwise elucidation of fluorescence based sensing mechanisms considering picric acid as a model analyte. Analyst 2020, 14, 4753–4767. [Google Scholar] [CrossRef]
  8. Ashbrook, P.C.; Houts, T.A. Targeting chemicals for waste minimization. Chem. Health Saf. 2000, 7, 41. [Google Scholar] [CrossRef]
  9. Sivaraman, G.; Vidya, B.; Chellappa, D. Rhodamine based selective turn-on sensing of picric acid. RSC Adv. 2014, 4, 30828–30831. [Google Scholar] [CrossRef]
  10. Saleem, A.; Rafi, N.; Qasim, S.; Ashraf, U.; Virk, N. Synthesis of Picric Acid at Domestic Scales. Int. J. Innov. Sci. Technol. 2019, 1, 62–78. [Google Scholar] [CrossRef]
  11. Ferreira de Sousa, P.V.; de Moraes Guimarães, Y.; Pinto, G.C.; Fernando de Oliveira, A.; Alberto da Silva, A.; Lopes, R.P. Study of Cu NPs reactivity for compounds with different chemical structures: Black reactive dye 5, picric acid and 2,4-D herbicide. Chemosphere 2019, 235, 749–756. [Google Scholar] [CrossRef] [PubMed]
  12. Bhatt, D.R.; Maheria, K.C.; Parikh, J.K. Highly efficient micellar extraction of toxic picric acid into novel ionic liquid: Effect of parameters, solubilization isotherm, evaluation of thermodynamics and design parameters. J. Hazard. Mater. 2015, 300, 338–346. [Google Scholar] [CrossRef] [PubMed]
  13. Udhayakumari, D.; Velmathi, S.; Venkatesa, P.; Wu, S.P. A pyrene-linked thiourea as a chemosensor for cations and simple fluorescent sensor for picric acid. Anal. Methods 2015, 7, 1161–1166. [Google Scholar] [CrossRef]
  14. Zhao, Y.; Xu, L.; Kong, F.; Yu, L. Design and preparation of poly(tannic acid) nanoparticles with intrinsic fluorescence: A sensitive detector of picric acid. J. Chem. Eng. 2021, 416, 1385–8947. [Google Scholar] [CrossRef]
  15. Hussain, S.; Malik, A.H.; Afroz, M.A.; Iyer, P.K. Ultrasensitive detection of nitroexplosive—Picric acid via a conjugated polyelectrolyte in aqueous media and solid support. Chem. Commun. 2015, 51, 7207–7210. [Google Scholar] [CrossRef]
  16. Xu, Y.; Li, B.; Li, W.; Zhao, J.; Sun, S.; Pang, Y. ICT-not-quenching near infrared ratiometric fluorescent detection of picric acid in aqueous media. Chem. Commun. 2013, 49, 4764–4766. [Google Scholar] [CrossRef]
  17. Wollin, K.M.; Dieter, H.H. Toxicological guidelines for monocyclic nitro-, amino- and aminonitroaromatics, nitramines, and nitrate esters in drinking water. Arch. Environ. Contam. Toxicol. 2005, 49, 18–26. [Google Scholar] [CrossRef]
  18. Smilkstein, M.; Sriwilaijaroen, N.; Kelly, J.X.; Wilairat, P.; Riscoe, M. Simple and inexpensive fluorescence-based technique for high-throughput antimalarial drug screening. Antimicrob. Agents Chemother. 2004, 48, 1803–1806. [Google Scholar] [CrossRef]
  19. Jia, M.; Zhang, Z.; Li, J.; Shao, H.; Chen, L.; Yang, X. A molecular imprinting f luorescence sensor based on quantum dots and a mesoporous structure for selective and sensitive detection of 2, 4-dichlorophenoxyacetic acid. Sens. Actuators B 2017, 252, 934–943. [Google Scholar] [CrossRef]
  20. Rageh, A.H.; Ibrahim, M.; Said, M.I. Bifunctional Fe(III) metal-organic framework: A highly sensitive “turn-off” fluorescent probe and a precursor of magnetite nanoparticles for potential water decontamination. Solid State Sci. 2023, 140, 107202. [Google Scholar] [CrossRef]
  21. Fang, X.; Wang, S.; Wang, Q.; Gong, J.; Li, L.; Lu, H.; Xue, P.; Ren, Z.; Wang, X. A highly selective and sensitive fluorescence probe based on BODIPY-cyclen for hydrogen sulfide detection in living cells and serum. Talanta 2024, 268, 125339. [Google Scholar] [CrossRef] [PubMed]
  22. Hu, J.-H.; Zhang, W.; Ren, C.-X.; Xiong, Y.; Zhang, J.-Y.; He, J.; Huang, Y.; Tao, Z.; Xiao, X. A novel portable smart phone sensing platform based on a supramolecular fluorescence probe for quick visual quantitative detection of picric acid. Anal. Chim. Acta 2023, 1254, 341095. [Google Scholar] [CrossRef] [PubMed]
  23. Kaur, N.; Tiwari, P.; Mate, N.; Sharma, V.; Mobin, S.M. Photoactivatable carbon dots as a label-free fluorescent probe for picric acid detection and light-induced bacterial inactivation. J. Photochem. Photobiol. B 2022, 229, 112412. [Google Scholar] [CrossRef] [PubMed]
  24. Keerthana, P.; Cherian, A.R.; Sirimahachai, U.; Thadathil, D.A.; Varghese, A.; Hegde, G. Detection of picric acid in industrial effluents using multifunctional green fluorescent B/N-carbon quantum dots. J. Environ. Chem. Eng. 2022, 10, 107209. [Google Scholar] [CrossRef]
  25. Sreekumar, A.; Mohan, M.G.; Raksha, C.; Nair, A.R.; Manoj, P.; Janardhanan, J.A.; Sivan, A. Design, synthesis, and spectrofluorimetric analysis of a novel fluorene-based chemosensor for the selective detection of picric acid. J. Mol. Struct. 2024, 1312, 138499. [Google Scholar] [CrossRef]
  26. Arshad, M.; AT, J.R.; Joseph, V.; Joseph, A. Selective detection of picric acid in aqueous medium using a novel naphthaldehyde-based aggregation induced emission enhancement (AIEE) active “turn-off” fluorescent sensor. J. Lumin. 2023, 258, 119818. [Google Scholar] [CrossRef]
  27. Lv, W.; Song, Y.; Guo, R.; Liu, N.; Mo, Z. Metal-organic frame material encapsulated Rhodamine 6G: A highly sensitive fluorescence sensing platform for the detection of picric acid contaminants in water. Spectrochim. Acta A Mol. Biomol. Spectrosc. 2024, 316, 124355. [Google Scholar] [CrossRef]
  28. Mansur, H.S.; Mansur, A.A.P.; Soriano-Araújo, A.; Lobato, Z.I.P.; de Carvalho, S.M.; Leite, M.d.F. Water-soluble nanoconjugates of quantum dot-chitosan-antibody for in vitro detection of cancer cells based on “enzyme-free” fluoroimmunoassay. Mater. Sci. Eng. C 2015, 52, 61–71. [Google Scholar] [CrossRef]
  29. Martinis, E.M.; Castro Grijalba, A.; Pérez, M.B.; Llaver, M.; Wuilloud, R.G. Synergistic analytical preconcentration with ionic liquid–nanomaterial hybrids. TrAC 2017, 97, 333–344. [Google Scholar] [CrossRef]
  30. Rykowska, I.; Ziemblinska, J.; Nowak, I. Modern approaches in dispersive liquid- liquid microextraction (DLLME) based on ionic liquids: A review. J. Mol. Liq. 2018, 259, 319–339. [Google Scholar] [CrossRef]
  31. Spietelun, A.; Marcinkowski, L.; de la Guardia, M.; Namiesnik, J. Green aspects, developments and perspectives of liquid phase microextraction techniques. Talanta 2014, 119, 34–45. [Google Scholar] [CrossRef] [PubMed]
  32. Pereira, J.A.M.; Casado, N.; Porto-Figueira, P.; Camara, J.S. The potential of microextraction techniques for the analysis of bioactive compounds in food. Front. Nutr. 2022, 9, 825519. [Google Scholar] [CrossRef]
  33. Psillakis, E. Vortex-assisted liquid-liquid microextraction revisited. TrAC 2019, 113, 332–339. [Google Scholar] [CrossRef]
  34. Guiñez, M.; Martinez, L.D.; Fernandez, L.; Cerutti, S. Dispersive liquid–liquid microextraction based on solidification of floating organic drop and fluorescence detection for the determination of nitrated polycyclic aromatic hydrocarbons in aqueous samples. Microchem. J. 2017, 131, 1–8. [Google Scholar] [CrossRef]
  35. Kakalejčikova, S.; Bazel, Y. A combination of vortex-assisted liquid–liquid microextraction with fluorescence detection: An innovative approach for a green and highly sensitive determination of sodium dodecyl sulfate in water samples and pharmaceuticals. Microchem. J. 2024, 199, 110226. [Google Scholar] [CrossRef]
  36. Zhang, J.; Dolg, M. ABCluster: The Artificial Bee Colony Algorithm for Cluster Global Optimization. Phys. Chem. Chem. Phys. 2015, 17, 24173–24181. [Google Scholar] [CrossRef]
  37. Zhang, J.; Dolg, M. Global Optimization of Rigid Molecular Clusters by the Artificial Bee Colony Algorithm. Phys. Chem. Chem. Phys. 2016, 18, 3003–3010. [Google Scholar] [CrossRef]
  38. Bannwarth, C.; Ehlert, S.; Grimme, S. GFN2-xTB—An Accurate and Broadly Parametrized Self-Consistent Tight-Binding Quantum Chemical Method with Multipole Electrostatics and Density-Dependent Dispersion Contributions. J. Chem. Theory Comput. 2019, 15, 1652–1671. [Google Scholar] [CrossRef]
  39. Bannwarth, C.; Caldeweyher, E.; Ehlert, S.; Hansen, A.; Pracht, P.; Seibert, J.; Spicher, S.; Grimme, S. Extended tight-binding quantum chemistry methods. Wiley Interdiscip. Rev. Comput. Mol. Sci. 2020, 11, e1493. [Google Scholar] [CrossRef]
  40. Zhao, Y.; Truhlar, D.G. The M06 suite of density functionals for main group thermochemistry, thermochemical kinetics, noncovalent interactions, excited states, and transition elements: Two new functionals and systematic testing of four M06-class functionals and 12 other functionals. Theor. Chem. Account 2008, 120, 215–241. [Google Scholar] [CrossRef]
  41. Krishnan, R.; Binkley, J.S.; Seeger, R.; People, J.A. Self-consistent molecular orbital methods. XX. A basis set for correlated wave functions. J. Chem. Phys. 1980, 72, 650–654. [Google Scholar] [CrossRef]
  42. Zhukovetska, O.; Fizer, M.; Mariychuk, R.; Guzenko, O.; Snigur, D. Spectrophotometric and DFT study of Germanium (IV) interaction with 6,7-dihydroxy-2,4-diphenyl-1-benzopyran-1-ium bromide in solutions: Room-temperature cloud point extraction and its analytical application. J. Mol. Liq. 2024, 401, 124724. [Google Scholar] [CrossRef]
  43. Riley, K.E.; Tran, K.-A.; Lane, P.; Murray, J.S.; Politzer, P. Comparative analysis of electrostatic potential maxima and minima on molecular surfaces, as determined by three methods and a variety of basis sets. J. Comput. Sci. 2016, 17, 273–284. [Google Scholar] [CrossRef]
  44. Fizer, M.; Fizer, O. Theoretical study on charge distribution in cetylpyridinium cationic surfactant. J. Mol. Model. 2021, 27, 203. [Google Scholar] [CrossRef]
  45. Walker, M.; Harvey, A.J.A.; Sen, A.; Dessent, C.E.H. Performance of M06, M06-2X, and M06-HF density functionals for conformationally flexible anionic clusters: M06 functionals perform better than B3LYP for a model system with dispersion and ionic hydrogen-bonding interactions. J. Phys. Chem. A 2013, 117, 12590–12600. [Google Scholar] [CrossRef]
  46. Fizer, M.; Slivka, M.; Sidey, V.; Baumer, V.; Mariychuk, R. XRD, NMR, FT-IR and DFT structural characterization of a novel organic-inorganic hybrid perovskite-type hexabromotellurate material. J. Mol. Struct. 2021, 1235, 130227. [Google Scholar] [CrossRef]
  47. Garcia-Rates, M.; Neese, F. Effect of the Solute Cavity on the Solvation Energy and its Derivatives within the Framework of the Gaussian Charge Scheme. J. Comput. Chem. 2020, 41, 922–939. [Google Scholar] [CrossRef]
  48. Maciel, G.S.; Garcia, E. Charges derived from electrostatic potentials: Exploring dependence on theory and geometry optimization levels for dipole moments. Chem. Phys. Lett. 2005, 409, 29–33. [Google Scholar] [CrossRef]
  49. Neese, F. An improvement of the resolution of the identity approximation for the formation of the Coulomb matrix. J. Comput. Chem. 2003, 24, 1740–1747. [Google Scholar] [CrossRef]
  50. Neese, F.; Wennmohs, F.; Hansen, A.; Becker, U. Efficient, approximate and parallel Hartree–Fock and hybrid DFT calculations. A ‘chain-of-spheres’ algorithm for the Hartree–Fock exchange. Chem. Phys. 2009, 356, 98–109. [Google Scholar] [CrossRef]
  51. Klamt, A. The COSMO and COSMO-RS solvation models. Wiley Interdiscip. Rev. Comput. Mol. Sci. 2018, 8, e1338. [Google Scholar] [CrossRef]
  52. Müller, S.; Nevolianis, T.; Garcia-Ratés, M.; Riplinger, C.; Leonhard, K.; Smirnova, I. Predicting solvation free energies for neutral molecules in any solvent with openCOSMO-RS. Fluid Ph. Equilibria 2025, 589, 114250. [Google Scholar] [CrossRef]
  53. Neese, F. Software update: The ORCA program system—Version 5.0. Wiley Interdiscip. Rev. Comput. Mol. Sci. 2022, 12, e1606. [Google Scholar] [CrossRef]
  54. Lu, T.; Chen, Q. Independent gradient model based on Hirshfeld partition: A new method for visual study of interactions in chemical systems. J. Comput. Chem. 2022, 43, 539–555. [Google Scholar] [CrossRef]
  55. Lu, T. A comprehensive electron wavefunction analysis toolbox for chemists, Multiwfn. J. Chem. Phys. 2024, 161, 082503. [Google Scholar] [CrossRef]
  56. Available online: https://pubchem.ncbi.nlm.nih.gov/compound/6540442 (accessed on 1 March 2025).
  57. Zaruba, S.; Vishnikin, A.B.; Andruch, V. A novel vortex-assisted liquid–liquid microextraction approach using auxiliary solvent: Determination of iodide in mineral water samples. Talanta 2016, 149, 110–116. [Google Scholar] [CrossRef]
  58. Hedjazi, I.M.; Vishnikin, A.B.; Okovytyy, S.I.; Miekh, Y.V.; Bazel, Y.R. Use of dye aggregation phenomenon for spectrophotometric and SIA-LAV determination of bismuth (III) as a specific ion association complex between tetraiodobismuthate and Astra Phloxine. J. Mol. Struct. 2022, 1251, 132015. [Google Scholar] [CrossRef]
  59. Rasooly, R. PhloxineB, a versatile bacterial stain. FEMS Immunol. Med. Microbiol. 2007, 49, 261–265. [Google Scholar] [CrossRef]
  60. Bazeľ, Y.; Tóth, J.; Fizer, M.; Sidey, V.; Balogh, I. Estimation of ground and excitedstate dipole moments of three symmetric carbocyanine dyes via the analysis of luminescence properties. J. Mol. Liq. 2021, 337, 116476. [Google Scholar] [CrossRef]
  61. Kakalejčíková, S.; Bazel, Y.; Fizer, M. Extraction-less green spectrofluorimetric method for determination of mercury using an Astra Phloxine fluorophore: Comprehensive experimental and theoretical studies. Spectrochim. Acta A Mol. Biomol. Spectrosc. 2024, 310, 123946. [Google Scholar] [CrossRef]
  62. Shkumbatiuk, R.; Bazel, Y.; Andruch, V.; Török, M. Investigation of 2-[(E)-2-(4-diethylaminophenyl)-1-ethenyl]-1,3,3-trimethyl-3H-indolium as a new highly sensitive reagent for the spectrophotometric determination of nitrophenols. Anal. Bioanal. Chem. 2005, 382, 1431–1437. [Google Scholar] [CrossRef] [PubMed]
  63. Slivka, M.; Korol, N.; Fizer, M.; Baumer, V.; Lendel, V. Thiazolo[3,2-b][1,2,4]triazol-7-ium salts: Synthesis, properties and structural studies. Heterocycl. Commun. 2018, 24, 197–203. [Google Scholar] [CrossRef]
  64. Fizer, M.; Slivka, M.; Baumer, V.; Slivka, M.; Fizer, O. Alkylation of 2-oxo(thioxo)-thieno[2,3-d]pyrimidine-4-ones: Experimental and theoretical study. J. Mol. Struct. 2019, 1198, 126858. [Google Scholar] [CrossRef]
  65. Yankovych, H.; Bodnár, G.; Elsaesser, M.S.; Fizer, M.; Storozhuk, L.; Kolev, H.; Melnyk, I.; Václavíková, M. Carbon composites for rapid and effective photodegradation of 4-halogenophenols: Characterization, removal performance, and computational studies. J. Photochem. Photobiol. A Chem. 2023, 441, 114753. [Google Scholar] [CrossRef]
  66. Gerlach, T.; Müller, S.; González de Castilla, A.; Smirnova, I. An Open Source COSMO-RS Implementation and Parameterization Supporting the Efficient Implementation of Multiple Segment Descriptors. Fluid Ph. Equilibria 2022, 560, 113472. [Google Scholar] [CrossRef]
  67. Becke, A.D. Density-functional exchange-energy approximation with correct asymptotic behaviour. Phys. Rev. A 1988, 38, 3098–3100. [Google Scholar] [CrossRef]
  68. Weigend, F.; Ahlrichs, R. Balanced basis sets of split valence, triple zeta valence and quadruple zeta valence quality for H to Rn: Design and assessment of accuracy. Phys. Chem. Chem. Phys. 2005, 7, 3297–3305. [Google Scholar] [CrossRef]
  69. Rappoport, D.; Furche, F. Property-optimized Gaussian basis sets for molecular response calculations. J. Chem. Phys. 2010, 133, 134105. [Google Scholar] [CrossRef]
  70. Fizer, O.; Fizer, M.; Sidey, V.; Studenyak, Y.; Mariychuk, R. Benchmark of different charges for prediction of the partitioning coefficient through the hydrophilic/lipophilic index. J. Mol. Model. 2018, 24, 141. [Google Scholar] [CrossRef]
  71. Starek, M.; Plenis, A.; Zagrobelna, M.; Dąbrowska, M. Assessment of Lipophilicity Descriptors of Selected NSAIDs Obtained at Different TLC Stationary Phases. Pharmaceutics 2021, 13, 440. [Google Scholar] [CrossRef]
  72. Fizer, O.; Fizer, M.; Sidey, V.; Studenyak, Y. Predicting the end point potential break values: A case of potentiometric titration of lipophilic anions with cetylpyridinium chloride. Microchem. J. 2021, 160, 105758. [Google Scholar] [CrossRef]
  73. Pena-Pereira, F.; Wojnowski, W.; Tobiszewski, M. AGREE—Analytical GREEnness Metric approach and software. Anal. Chem. 2020, 92, 10076–10082. [Google Scholar] [CrossRef] [PubMed]
  74. Manousi, N.; Wojnowski, W.; Płotka-Wasylka, J.; Samanidou, V. Blue applicability grade index (BAGI) and software: A new tool for the evaluation of method practicality. Green Chem. 2023, 25, 7598–7604. [Google Scholar] [CrossRef]
Figure 1. Distribution diagram of AF+ (1), and nitrophenolate ions: PA (2), 3,4-DNP (3), 4-NP (4).
Processes 13 01051 g001
Figure 2. Fluorescence properties of IA extracts: (a) excitation (1) and emission (2) spectra of picrate IA; (b) effect of PA (1–6), 4-NP (7), 3,4-DNP (8) and excitation wavelength (1–9). c (AF) = 2 × 10⁻⁶ M; c (PA; 3,4-DNP; 4-NP) = 4 × 10⁻⁸ M; n-amyl acetate. 1, 7, 8, 9—540 nm, 2—550 nm, 3—530 nm, 4—520 nm, 5—510 nm, 6—500 nm.
Processes 13 01051 g002
Figure 3. Structures of separate ions and IA considered in theoretical study. Trans-1,3,3-trimethyl-2-[(1E)-3-[(2E)-1,3,3-trimethyl-2,3-dihydro-1H-indol-2-ylidene]prop-1-en-1-yl]-3H-indol-1-ium (AF1), cis-1,3,3-trimethyl-2-[(1E)-3-[(2E)-1,3,3-trimethyl-2,3-dihydro-1H-indol-2-ylidene]prop-1-en-1-yl]-3H-indol-1-ium (AF2), cis-1,3,3-trimethyl-2-[(1E)-3-[(2Z)-1,3,3-trimethyl-2,3-dihydro-1H-indol-2-ylidene]prop-1-en-1-yl]-3H-indol-1-ium (AF3), picrate (A1), 2,4-dinitrophenolate (A2), 2-nitrophenolate (A3), 4-nitrophenolate (A4), 3,4-dinitrophenolate (A5), and 2,5-dinitrophenolate (A6), as well as ionic associates of AF1 cation with A1 anion (IA1), with A2 anion (IA2), with A3 anion (IA3), with A4 anion (IA4), with A5 anion (IA5), and with A6 anion (IA6).
Processes 13 01051 g003
Figure 4. CHELPG partial charges of the AF1 cation (a); anions A1 (b), A2 (c), A3 (d), A4 (e), A5 (f), A6 (g); and IAs IA1 (h), IA2 (i), IA3 (j), IA4 (k), IA5 (l), and IA6 (m). The correlation between the charges in IAs and free ions is shown (n).
Processes 13 01051 g004
Figure 5. Segments (shown as dots) that were used to calculate the properties of the COSMO-RS surface of water (a), amyl acetate (b), and IA1 (c). σ-profiles of water (blue), amyl acetate (orange), and IA1 (purple) are shown in the frame (d).
Processes 13 01051 g005
Figure 6. (a) COSMO-RS free energies of solvation (ΔGsolv in kcal/mol) of ions and IA in water (blue) and amyl acetate (yellow); (b) free energies of partition (ΔGpart in kcal/mol, purple bars) and partition coefficient (logPaa/w, green bars) of free ions and IAs between water and amyl acetate.
Processes 13 01051 g006
Figure 7. Effect of type of extraction solvents. c (AF) = 2 × 10⁻⁶ M; c (PA) = 2 × 10⁻⁶ M; pH 3.0.
Processes 13 01051 g007
Figure 8. Fluorescence spectra and calibration curve at different PA concentrations. c (AF) = 2 × 10⁻⁶ M; pH 3.0; n-amyl acetate = 500 µL.
Processes 13 01051 g008
Figure 9. Assessment of the greenness of the proposed method using AGREE and BAGI.
Processes 13 01051 g009
Table 1. Various fluorescence systems for the determination of PA.
SystemLinear Range
(mg L−1)
LOD
(mg L−1)
R2RSD
(%)
Recovery
(%)
Reference
Supramolecular polymer material based on cucurbit[8]uril and 1,3,5-tris[4-(pyridin-4-yl) phenyl] benzene derivative with aggregation-induced emission0–36.70.580.99511.2–1.598.0–102.6[22]
Photoactivatable carbon dots as a label-free fluorescent probe0–34.410.500.990093.8–98.2[23]
Multifunctional B/N-carbon quantum dots0–6.9 0.410.98900.9–1.099.5–100.7[24]
Chemosensor based on
1,4-bis((9H-fluoren-9-ylidene)methyl)benzene
0.05–0.20.070.9787[25]
Naphthaldehyde-based aggregation induced emission enhancement active “turn-off” fluorescent sensor0–0.60.560.987599.3–100.8[26]
Metal–organic frame material encapsulated Rhodamine 6G0.2–22.91.100.99831.8–2.798.2–101.9[27]
The VALLME-FLD method using AF0.92–11.45 µg L−10.40 µg L−10.99301.2–2.397.3–101.1This work
Table 2. Precision and accuracy data for the determination of PA in model and real samples (n = 5, P = 0.95).
PA Added, µg L−1Intra-DayInter-Day
PA Determined, µg L−1RSD, %Recovery, %PA Determined, µg L−1RSD, %Recovery, %
0.0 *N.d.
3.7 *3.5 ± 0.12.594.63.8 ± 0.24.2102.7
9.2 *8.9 ± 0.43.796.79.6 ± 0.32.6104.3
0.0 **N.d.
3.7 **3.6 ± 0.12.397.3
9.2 **9.3 ± 0.11.2101.1
* Model samples (20.5 µg L−1 4-NP; 24.2 µg L−1 3,4-DNP). ** Tap water. N.d.—not detected.
Disclaimer/Publisher’s Note: The statements, opinions and data contained in all publications are solely those of the individual author(s) and contributor(s) and not of MDPI and/or the editor(s). MDPI and/or the editor(s) disclaim responsibility for any injury to people or property resulting from any ideas, methods, instructions or products referred to in the content.

