Article

The Methane Adsorption Ability of Lacustrine Shale and Its Controlling Factors: A Case Study of Shale from the Jurassic Lianggaoshan Formation in the Sichuan Basin

by
Pei Fu
1,
Dazhi Zhang
2,
Mingyi Hu
1,*,
Gang Yang
2,
Sile Wei
1,3 and
Fan Zeng
1
1
School of Geoscience, Yangtze University, Wuhan 430100, China
2
Exploration and Development Research Institute of Daqing Oilfield Company Ltd., Daqing 163712, China
3
Key Laboratory of Exploration Technologies for Oil and Gas Resources (Yangtze University), Ministry of Education, Wuhan 430100, China
*
Author to whom correspondence should be addressed.
Processes 2025, 13(4), 1061; https://doi.org/10.3390/pr13041061
Submission received: 5 March 2025 / Revised: 23 March 2025 / Accepted: 26 March 2025 / Published: 2 April 2025
(This article belongs to the Section Energy Systems)

Abstract

:
For lacustrine shale oil and gas reservoirs with coexisting hydrocarbon fluid properties, evaluating the adsorption capacity of shale is of significant importance for the exploration of lacustrine shale oil and gas. Taking the lacustrine shale from the Jurassic Lianggaoshan Formation in the northern Sichuan Basin as an example, this study conducted pyrolysis, scanning electron microscopy (SEM), and high-pressure methane isotherm adsorption tests to investigate the methane adsorption capacity of lacustrine shale and its controlling factors. The research findings are as follows: (1) The organic matter content in the study area’s lacustrine shale is moderate, with organic types ranging from II to III, and it is within the oil generation window stage. The mineral composition exhibits characteristics of high clay and low silica content; (2) Both the TOC (total organic carbon) and clay minerals promote the methane adsorption capacity of lacustrine shale; however, due to the overall moderate–low TOC levels, the storage space is primarily composed of inorganic pores; (3) A high clay mineral content provides more surface area, becoming a primary factor influencing shale adsorption capacity. This indicates that semi-deep lake deposits also possess exploration potential.

1. Introduction

During the Early-to-Middle Jurassic period, three large-scale lacustrine transgressions occurred in the Sichuan Basin, resulting in widespread development of lacustrine shales. These shales have become key areas for continuous breakthroughs and large-scale exploration and development of shale oil and gas in China [1,2,3]. The shale gas in the Wufeng Formation (Ordovician) to Longmaxi Formation (Silurian) of the Sichuan Basin has already achieved commercial development on a significant scale, with exploration efforts reaching a relatively mature stage [4,5]. However, there are significant differences between the fundamental geological characteristics of lacustrine shale oil and gas and those of marine shale gases, particularly in terms of TOC content and mineral composition [6,7]. Exploration strategies developed for marine shales cannot be directly applied to lacustrine shales. The target section of lacustrine shales in the Jurassic Lianggaoshan Formation from the northern Sichuan Basin under investigation exhibits typical characteristics of high temperature and overpressure (Dc index: 0.50–1.07, pressure gradient: 1.39–1.89 g/cm3, burial temperature: 99–106 °C). Recently, large-scale gas condensate reservoirs have been discovered in this section. However, the evolution mechanism of shale adsorption properties remains unclear, which directly impacts evaluations of reservoir gas-bearing capacity and optimization of development plans. Therefore, clarifying the adsorption capacity of shales and its controlling factors is crucial for enhancing the efficiency of lacustrine shale gas exploration, holding significant theoretical and practical implications.
CH4 is mainly stored in shale reservoirs in an adsorbed state [8,9,10]. The adsorption capacity of shale is controlled by the pore type and pore space formed by organic–inorganic co-evolution [11,12,13,14]. In terms of shale pore characterization techniques, scanning electron microscopy (SEM), mercury intrusion porosimetry (MIP), low-temperature gas adsorption (LTGA), computed tomography (CT), nuclear magnetic resonance (NMR), and machine learning-based methods have been widely used for quantitative characterization of pore structure and evaluation of gas storage capacity [15,16,17,18,19,20,21]. Among these, scanning electron microscopy (SEM), which can directly identify pore types (such as intergranular pores, intragranular pores and organic pores) due to its high-resolution imaging ability, is the most effective method for qualitative analysis of pore morphology [22,23]. Shale pores are usually divided into mineral-related pores (including intergranular pores and intragranular pores) and organic matter pores [24]. The total organic carbon content (TOC), organic matter maturity, clay mineral type and pore structure are the main factors affecting shale pore development [25,26,27,28].
In terms of organic matter, through the study of marine shale by Chalmers and Gao et al. [29,30], it was confirmed that there was a significant positive correlation between micropore volume and TOC within a certain range, because marine shale’s specific surface area advantage can improve methane adsorption capacity. From the study of Jurassic shale by Ross et al. and the study of Permian shale by Hu Cheng’er et al. [31,32], it can be found that the organic matter undergoes structural transformation during the thermal evolution process. As the maturity increases, the pore structure changes from a single-peak structure dominated by macropores, to a bimodal structure of micropores and macropores, resulting in the formation and expansion of organic pores. These pores, in turn, provide more sites for the adsorption of methane, thereby increasing the gas storage potential of shale. In terms of inorganic minerals, based on the study of Longmaxi Formation shale in Dingshan area, southeast Sichuan [33], Wang Qingbo pointed out that montmorillonite has the strongest adsorption capacity for methane, due to its interlayer exchangeable cations and large specific surface area, which can reach more than two times that of illite, followed by illite–montmorillonite mixed layers and illite, while kaolinite and chlorite have weak adsorption capacity. However, when studying the Marcellus and Montney shale reservoirs, Heller and Bustin found that water film on the clay surface significantly reduced the shale’s effective adsorption sites [34].
Previous studies have shown that the methane adsorption capacity of shale is the result of the synergistic effect of TOC, pore structure and mineral composition (clay mineral type and content). Organic matter and clay minerals promote the development of pore structure, thus increasing the specific surface area of pores, providing more points for gas adsorption, and thus improving the gas storage capacity of shale. In the future, it may be necessary to combine multi-scale characterization (such as SEM and LTGA) with machine learning models to further quantify the contribution of organic–inorganic synergistic mechanisms to adsorption capacity.
Research on marine shale has achieved significant progress in terms of its adsorption properties, whereas lacustrine shale gas reservoirs have predominantly been studied for their oil retention mechanisms, with limited attention given to methane adsorption. Additionally, unlike marine shales, lacustrine shales exhibit extremely high heterogeneity, particularly in their mineral composition and organic matter attributes (type, maturity and TOC abundance), which significantly differ from those of marine shales. Therefore, studying the gas adsorption capacity of lacustrine shales is essential. In this study, typical samples of Jurassic Lianggaoshan Formation lacustrine shales were selected from Well YY3 in the northern Sichuan Basin. A comprehensive suite of experiments, including field emission scanning electron microscopy (FESEM), pyrolysis analysis of rocks, and high-pressure methane isotherm adsorption tests, were employed to investigate the methane adsorption properties of lacustrine shales, and their controlling factors, in the study area. This research aims to provide theoretical support for identifying sweet spots in lacustrine shale gas reservoirs within the Sichuan Basin.

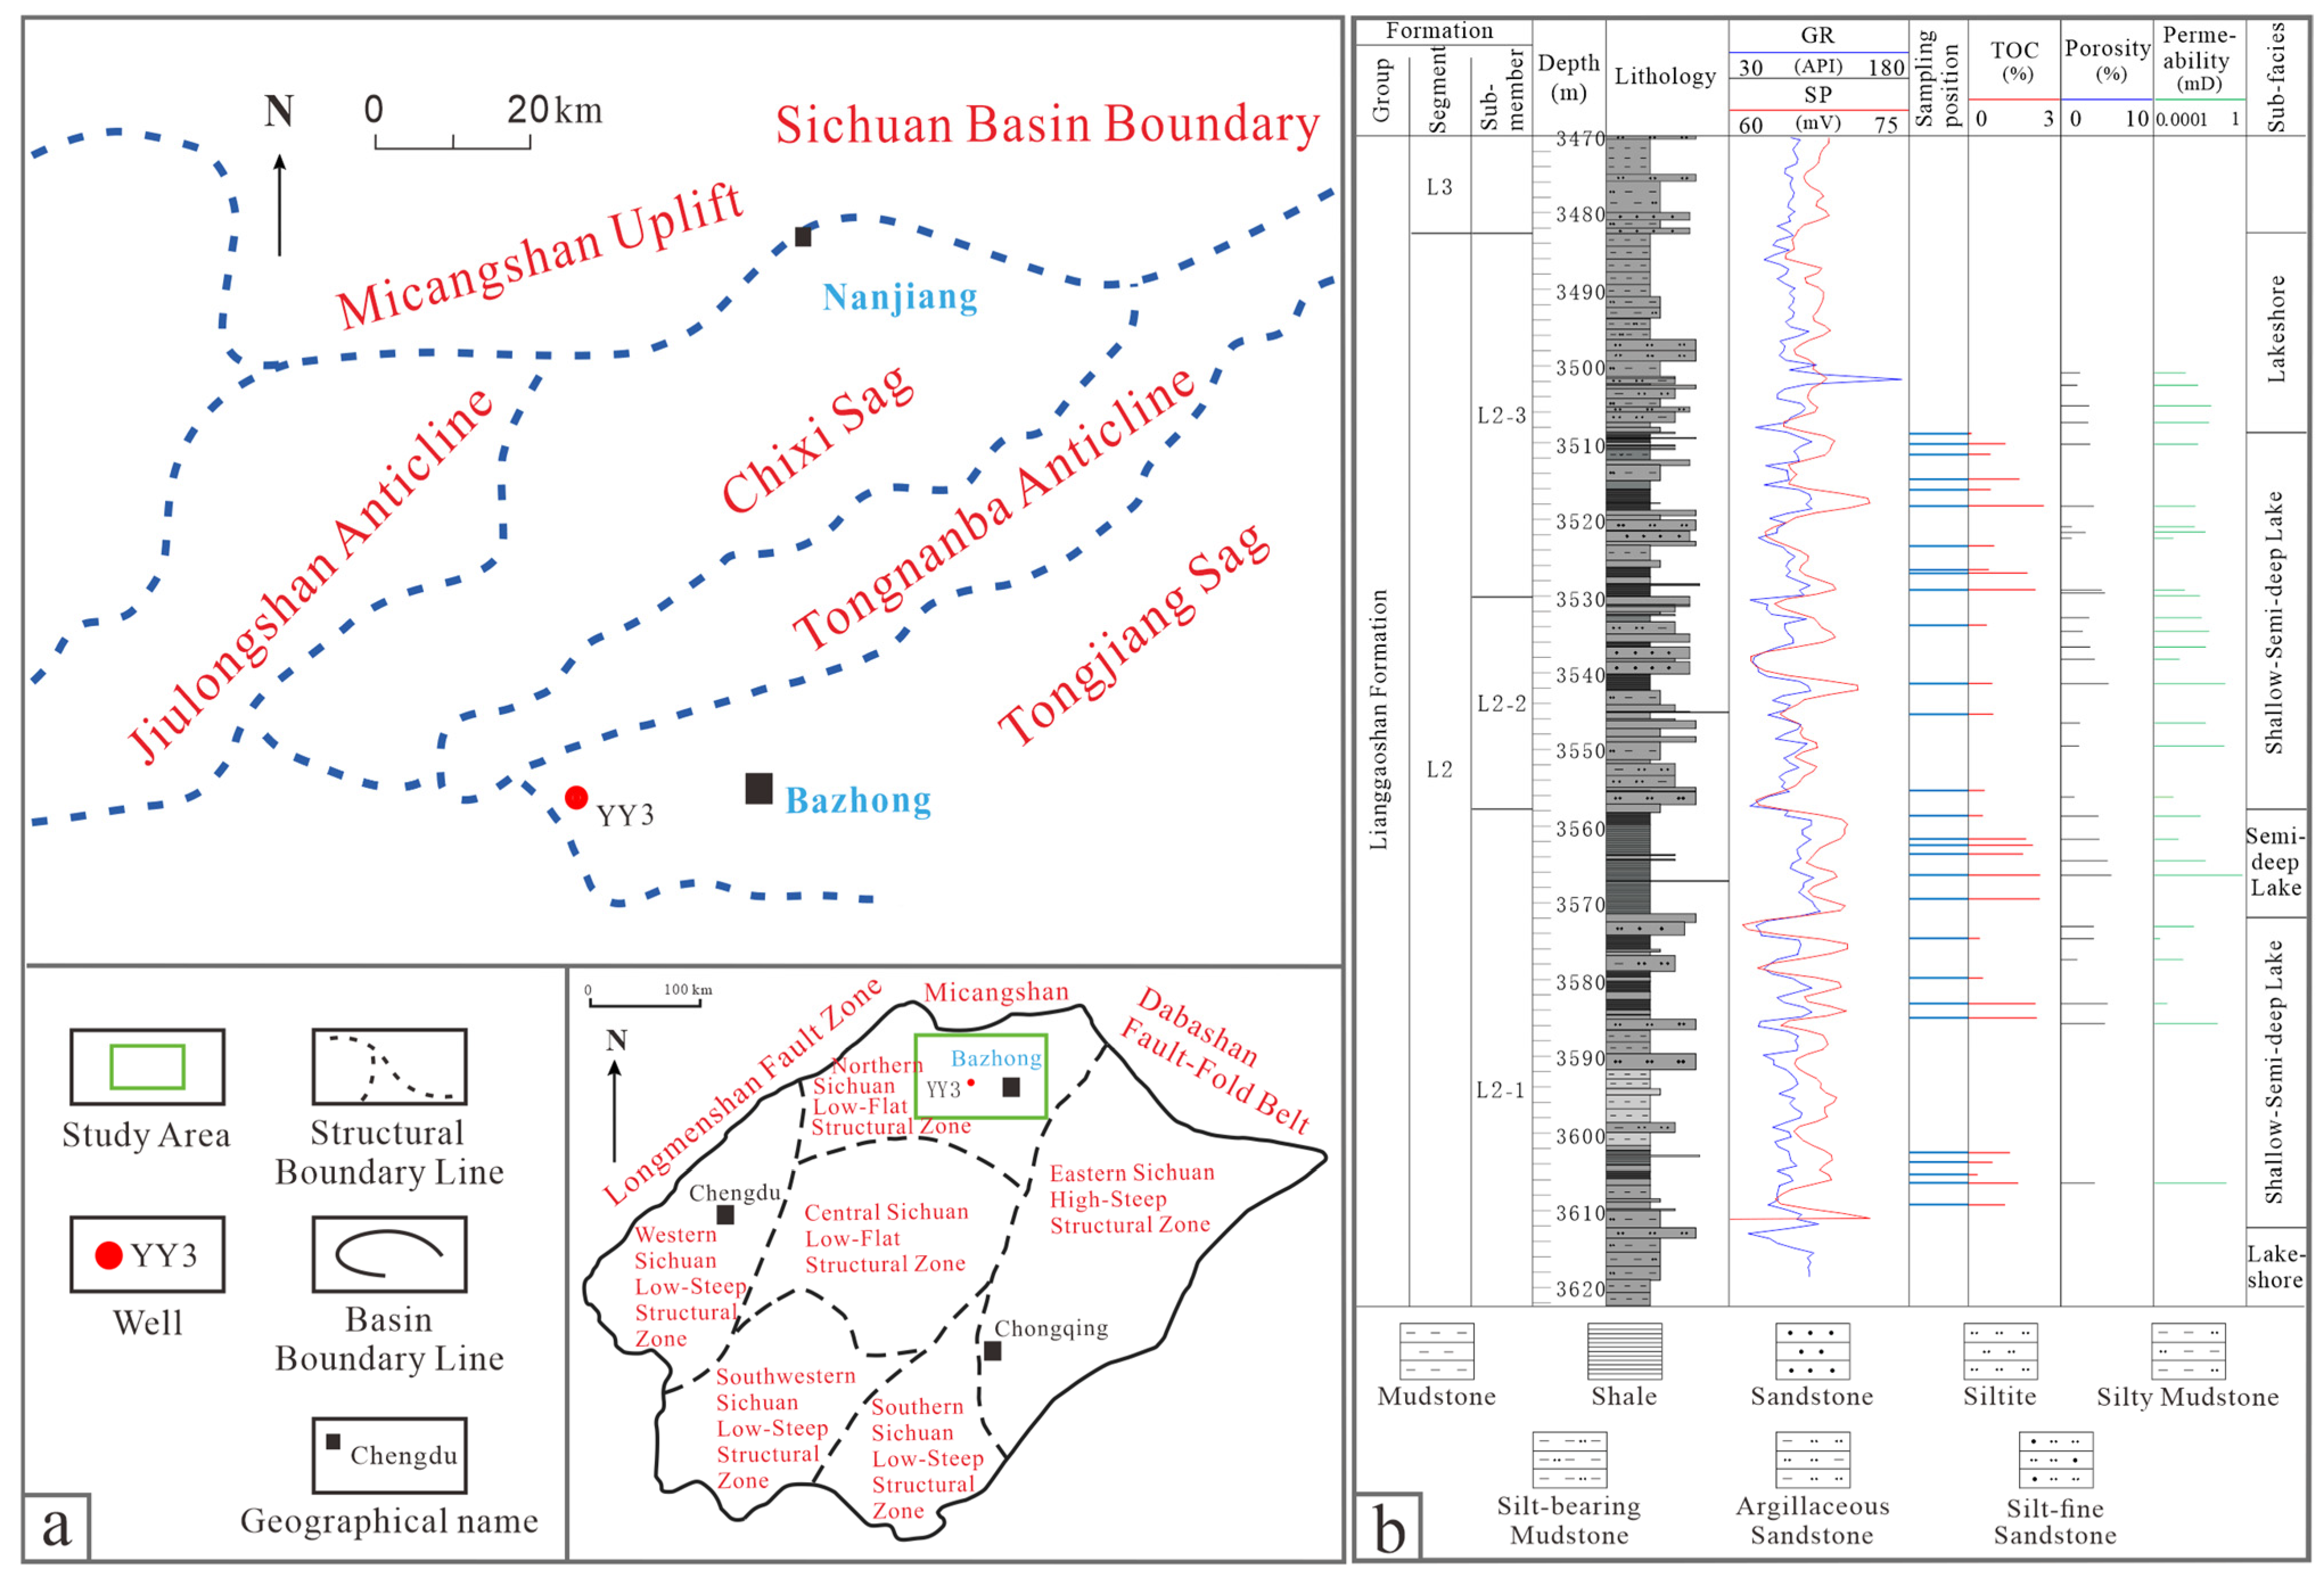
2. Geological Setting

The Sichuan Basin is situated in the western portion of the Yangtze Plate. Its basin rim exhibits a rhomboid shape, and internally, it is divided into six secondary geological units, based on regional structural characteristics. The study area is located within the northern uplift zone of the Sichuan Basin (Figure 1a).
In the Middle Jurassic period, northern Sichuan was in a period of basin depression. The sedimentary paleotopography was relatively gentle, and the accommodation space was small. Although the source supply was limited, it was still sustainable. A set of delta-lake sedimentary systems was formed in the sedimentary period of the Lianggaoshan Formation. The Lianggaoshan Formation can be vertically divided into the first section (L1), the second section (L2) and the third section (L3). The first section and the third section of Liang are mostly delta front sub-facies, and the lithology is mainly sandstone. The second member of Lianggaoshan mainly develops shallow lake–semi-deep lake sedimentary sub-facies, and the lithology is mainly shale, with a small amount of siltstone and fine sandstone. Among them, the second member of the Lianggaoshan Formation includes three sub-members, which constitute a complete three-stage cycle of lake transgression and lake regression. The maximum lake transgression period is located in the lower sub-member of the Lianggaoshan Formation, with the deepest sedimentary water body and the development of semi-deep lacustrine gray-black shale (Figure 1b). Through the testing and analysis of the multi-stage shale of the Lianggaoshan Formation in Well YY3, it was found that the TOC content of the shale section is generally between 1% and 2%, the porosity is generally between 3% and 5%, and the permeability is mostly between 0.001 and 0.4 mD (Figure 1b).

3. Materials and Methods

3.1. Samples

In this study, the YY3 well was selected as the key anatomical object, because it is located in the sedimentary center of the Lianggaoshan Formation in northern Sichuan, where the regional structure is gentle and it is far away from the later reformed faults (Figure 1a). In addition, the well vertically records the sedimentary sequence from shallow lake to semi-deep lake (Figure 1b), which confirms that the well can represent the heterogeneous characteristics of shale reservoirs against the background of regional stable deposition.
This study selected 30 gray and black mudstone/shale samples from the Lianggaoshan Formation of Well Yuan Ye-3, spanning depths of 3501.7–3609.6 m. The samples represent various lithofacies (primarily shale-rich shallow and semi-deep lacustrine sub-facies) with favorable TOC levels and reservoir properties within the study area, while comprehensively accounting for mineral compositional heterogeneity. The sample locations are detailed in Table 1.

3.2. TOC

The TOC content was determined using a carbon–sulfur analyzer, following a sequential procedure. First, the core samples were ground to a particle size finer than 200-mesh (diameter < 0.075 mm) and dried in an oven at 110 °C for 48 h. Approximately 50–150 mg of the dried sample was weighed and wrapped in folded tin foil, followed by treatment with 7% dilute hydrochloric acid to eliminate inorganic carbon, primarily carbonate minerals. The pretreated sample was then combusted in the carbon–sulfur analyzer at 930 °C. The CO₂ generated during combustion was measured and converted into TOC content.
Potential errors include incomplete removal of inorganic carbon due to oversized particles, which may prevent thorough reaction with hydrochloric acid, resulting in residual carbonate carbon being erroneously included in TOC calculations, and thus, overestimated values being produced. Additionally, an insufficient combustion temperature or shortened combustion time could lead to incomplete oxidation of organic carbon, causing underestimation of TOC measurements.

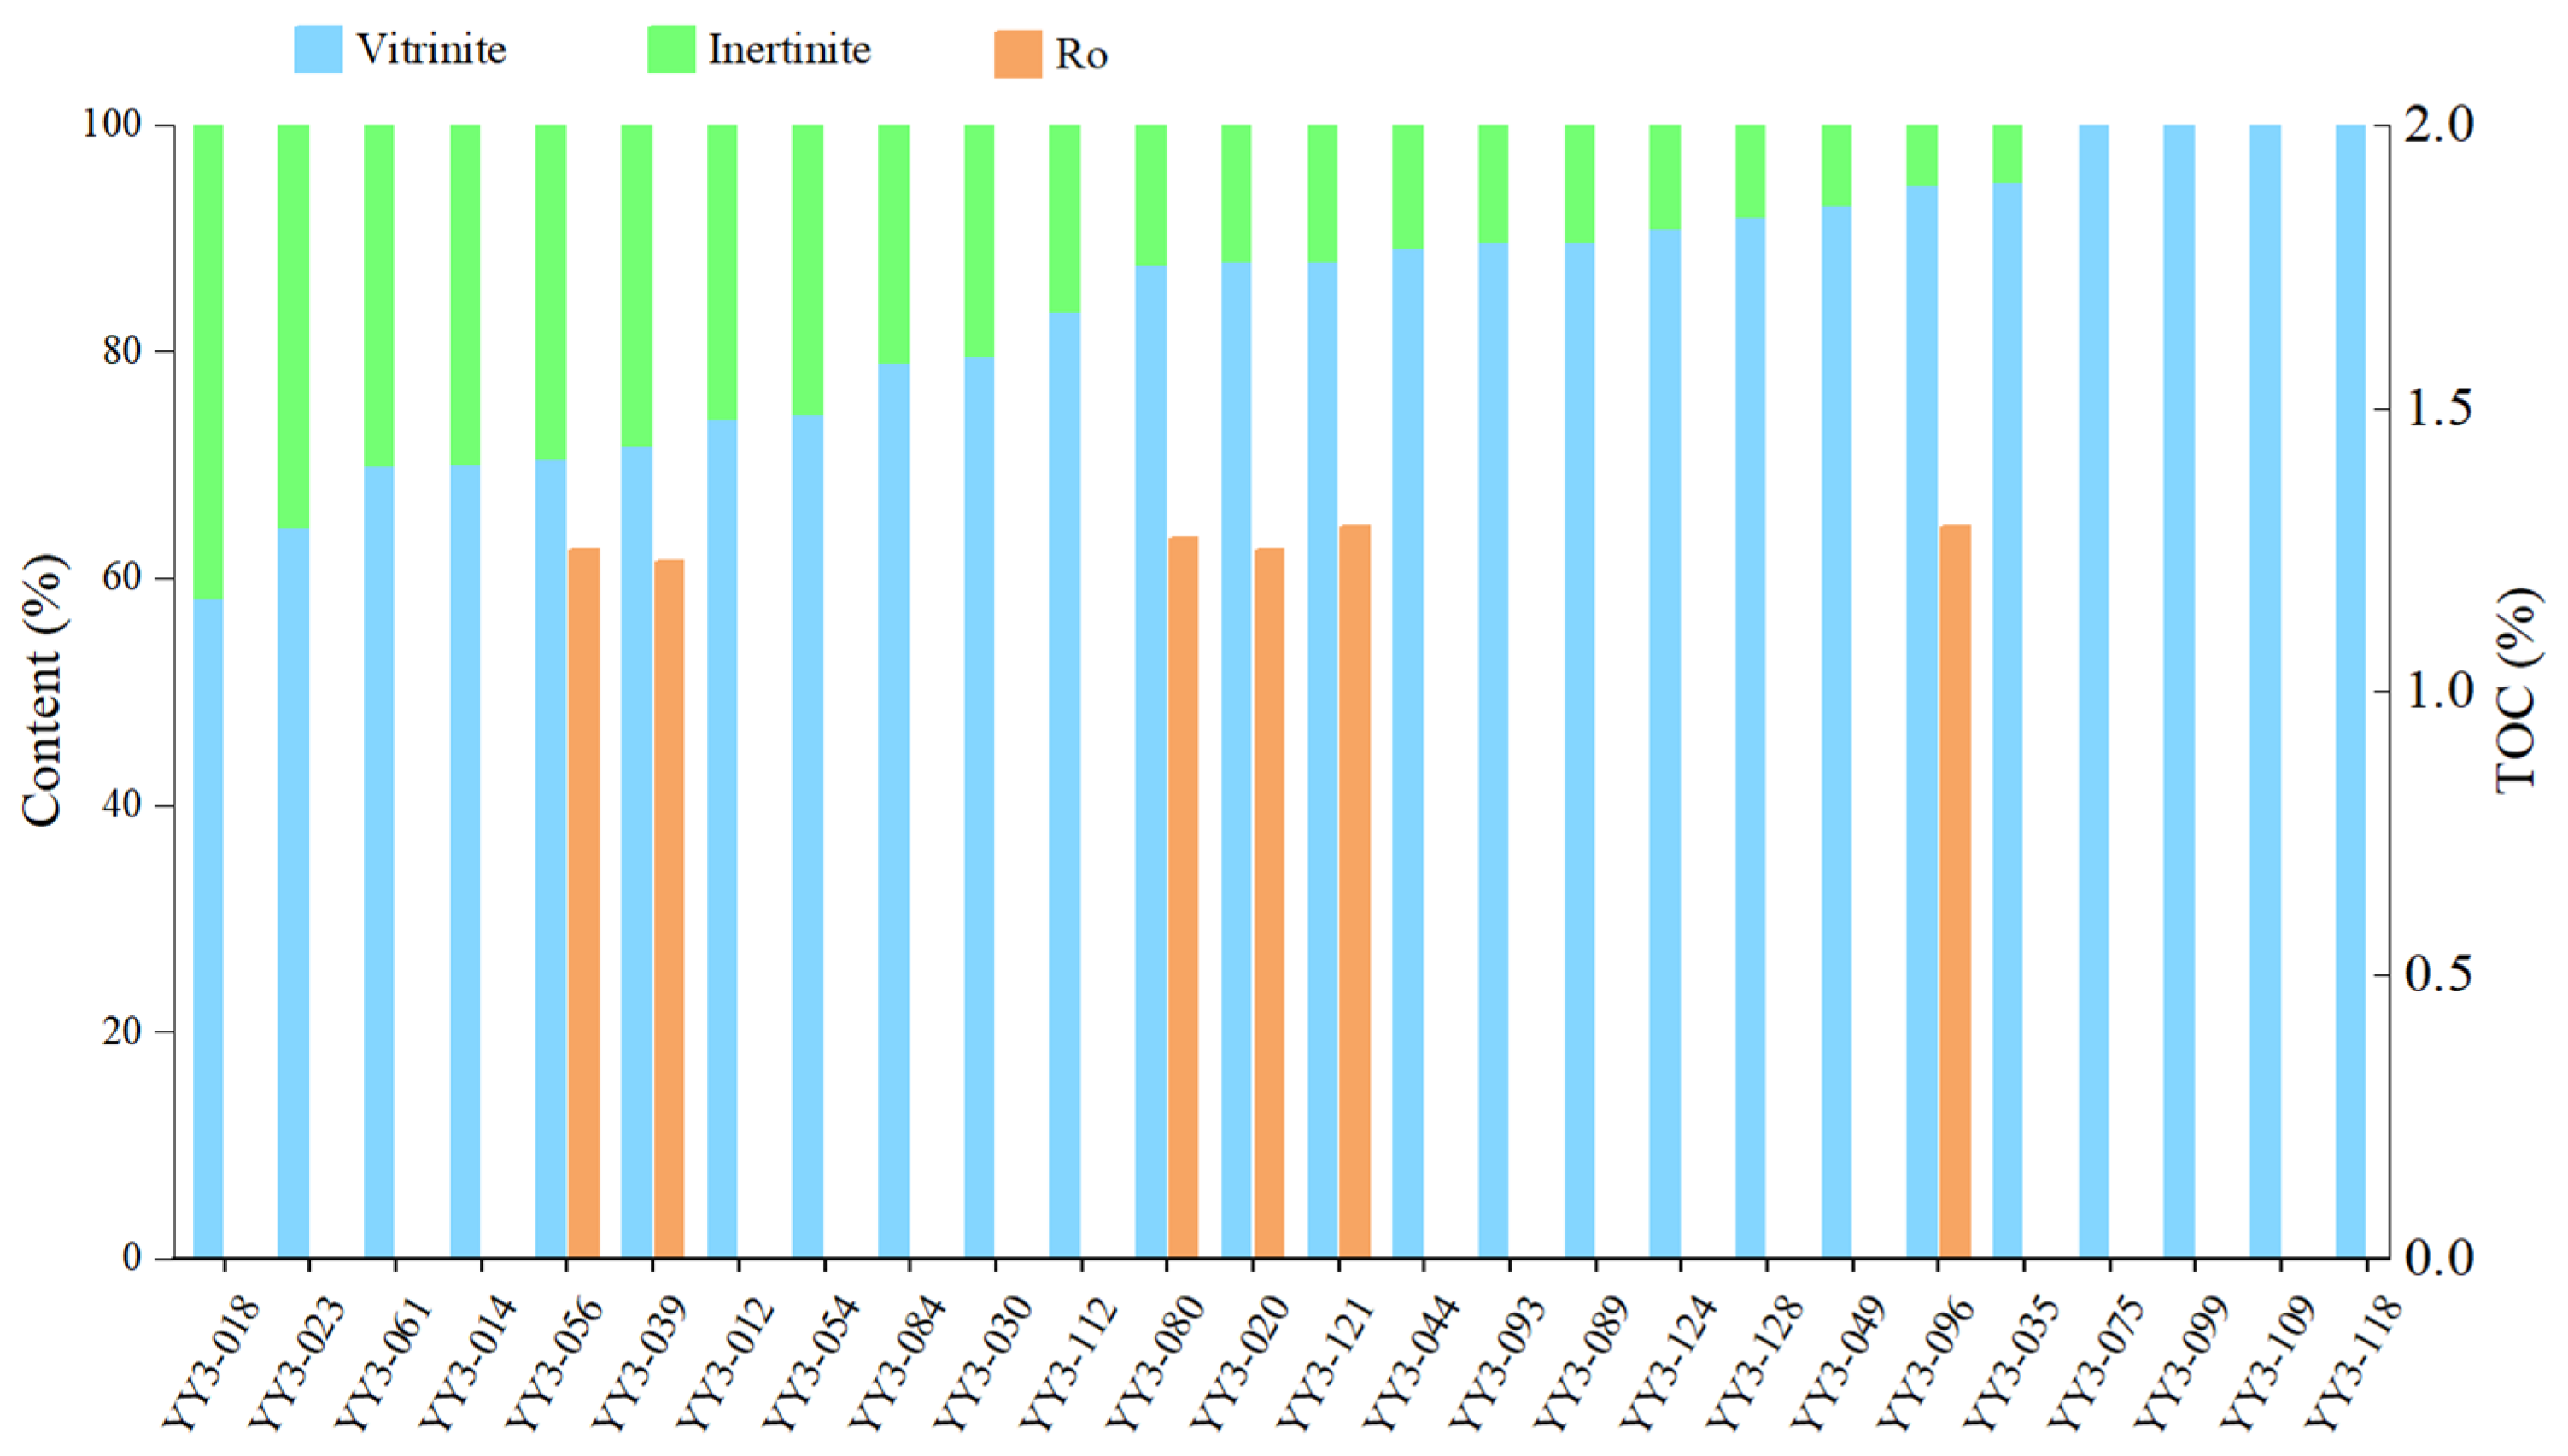
3.3. Thermal Maturity and Type of Organic Matter

Vitrinite reflectance measurements were conducted on six shale samples, and maceral composition analysis was performed on 26 samples. After sample crushing, cold mounting, section preparation and polishing, the tests were completed under constant temperature (20 ± 1 °C) and vibration-free conditions. Vitrinite reflectance was measured using green light (546 nm) under an oil-immersion objective (50×, numerical aperture 0.85), with multiple vitrinite particles measured to calculate the average reflectance value (Ro) and standard deviation. Maceral classification was based on fluorescence characteristics combined with statistical analysis using an MSP200 photometer (Ruicheng Instrument Co., Ltd., Hangzhou, China).
Experimental errors may originate from residual scratches or oxide films on polished sample surfaces, and from excessive polishing time, causing edge wear of vitrinite particles. These errors affect sample integrity, thereby reducing reflectance measurement accuracy. They can be reduced by increasing the number of vitrinite particles measured per sample and screening outliers to enhance data reliability.

3.4. Mineral Composition

The mineral composition was determined through X-ray diffraction (XRD). Prior to analysis, samples underwent low-temperature drying in a desiccator, and were ground to approximately 200 mesh. Experiments were conducted at room temperature, with each test requiring a minimum sample mass of 0.5 g. A D8Advance X-ray diffractometer was operated at 40 kV, 40 mA, with CuKα radiation (λ = 0.15418 nm) and a scanning speed of 0.417782°(2θ)/s. For clay mineral analysis, a LynxEye array detector was employed to perform continuous scans from 3° to 65°, with a step size of 0.017°. The detection limit for mineral composition quantification was approximately 1.5%, though verification through standard sample calibration was required to address potential inaccuracies arising from matrix effects or instrumental drift.

3.5. Bulk Porosity

To mitigate the influence of shale reservoir anisotropy, the shale core was processed into parallel bedding cylindrical specimens (diameter 2.54 cm, length 3.00–5.00 cm) along the bedding plane orientation prior to testing. The geometric bulk volume of specimens was calculated from diameter and height measurements obtained using a vernier caliper (±0.01 mm accuracy). A PoroPDP200 helium porosimeter (CoreLab, Houston, TX, USA) was employed to determine grain (matrix) volume based on Boyle’s law gas expansion principles, where helium permeated the rock matrix under unconfined conditions. The test pressure was stabilized at 200 psi (1.38 MPa), with pressure equilibrium defined as a pressure variation <0.001 psi over 20 s. Total porosity was derived from the functional relationship between bulk volume and grain (matrix) volume.
Experimental errors may originate from non-strict parallelism between the core axis and bedding planes during specimen processing, resulting in deviations of effective volume calculations from true values.

3.6. SEM

The SEM experiments utilized a Helios NanoLab 650 dual-beam microscope system (Thermo Fisher Scientific, Hillsboro, OR, USA) equipped with an Oxford X-Max 80 energy-dispersive spectrometer (elemental detection range: B–U) (Oxford Instruments, Abingdon, UK). The dual-beam system incorporates a field-emission electron gun with an accelerating voltage range of 0.5–30 kV, achieving a secondary electron resolution <1.0 nm at 15 kV. Prior to analysis, samples were surface-polished using a Model 1060 Ar ion polisher (parameters: 3 keV ion energy, 5° incidence angle, 2 h polishing duration) (Fischione Instruments, Inc., Canonsburg, PA, USA), followed by deposition of a 15 nm carbon coating via magnetron sputtering to enhance sample conductivity.

3.7. High Methane Adsorption

Methane adsorption capacity was measured using a Rubotherm isothermal adsorption apparatus (Model YQ2-14-16; Rubotherm GmbH, Bochum, Germany) via the magnetic suspension balance gravimetric method, which directly calculates adsorption quantities through real-time mass change monitoring. The system consists of a magnetic suspension weighing unit (±10 μg precision), a high-pressure reaction chamber (0–300 bar), and precision temperature control (±0.1 °C). Each sample (4–5 g) was ground to 60–80 mesh, vacuum-dried at 105 °C for 24 h, then degassed at 80 °C under a vacuum for 6 h prior to testing. Adsorption measurements were performed at 85 ± 0.1 °C, with stepwise pressure increments (until adsorption equilibrium) up to 300 bar. The system demonstrated <3% repeatability deviation and a detection limit of 0.002 mmol/g.
Experimental errors may arise from the grinding process damaging shale pore structures and reducing effective adsorption sites, leading to systematically underestimated methane adsorption capacity measurements.

4. Results

4.1. TOC Content and Organic Petrology

The TOC content and mineral composition of all the samples in this study are shown in Table 1. The TOC content ranges from 0.10% to 2.45%, with an average of 1.22%.
The experimental results of organic matter thermal maturity and type analysis are summarized as follows: Under ambient conditions of 23 °C, a relative humidity of 55% and a magnification of 500×, the organic matter of the Lianggaoshan Formation shale mainly consist of two parts: vitrinite and inertinite. The average contents of these two groups are 84.38% and 15.62%, respectively. The reflected light value (Ro) ranges from 1.23% to 1.29%, with an average of 1.26% (Figure 2). These results indicate that the organic matter type in the study samples is Type II–III, and the maturity level falls within the oil generation window.

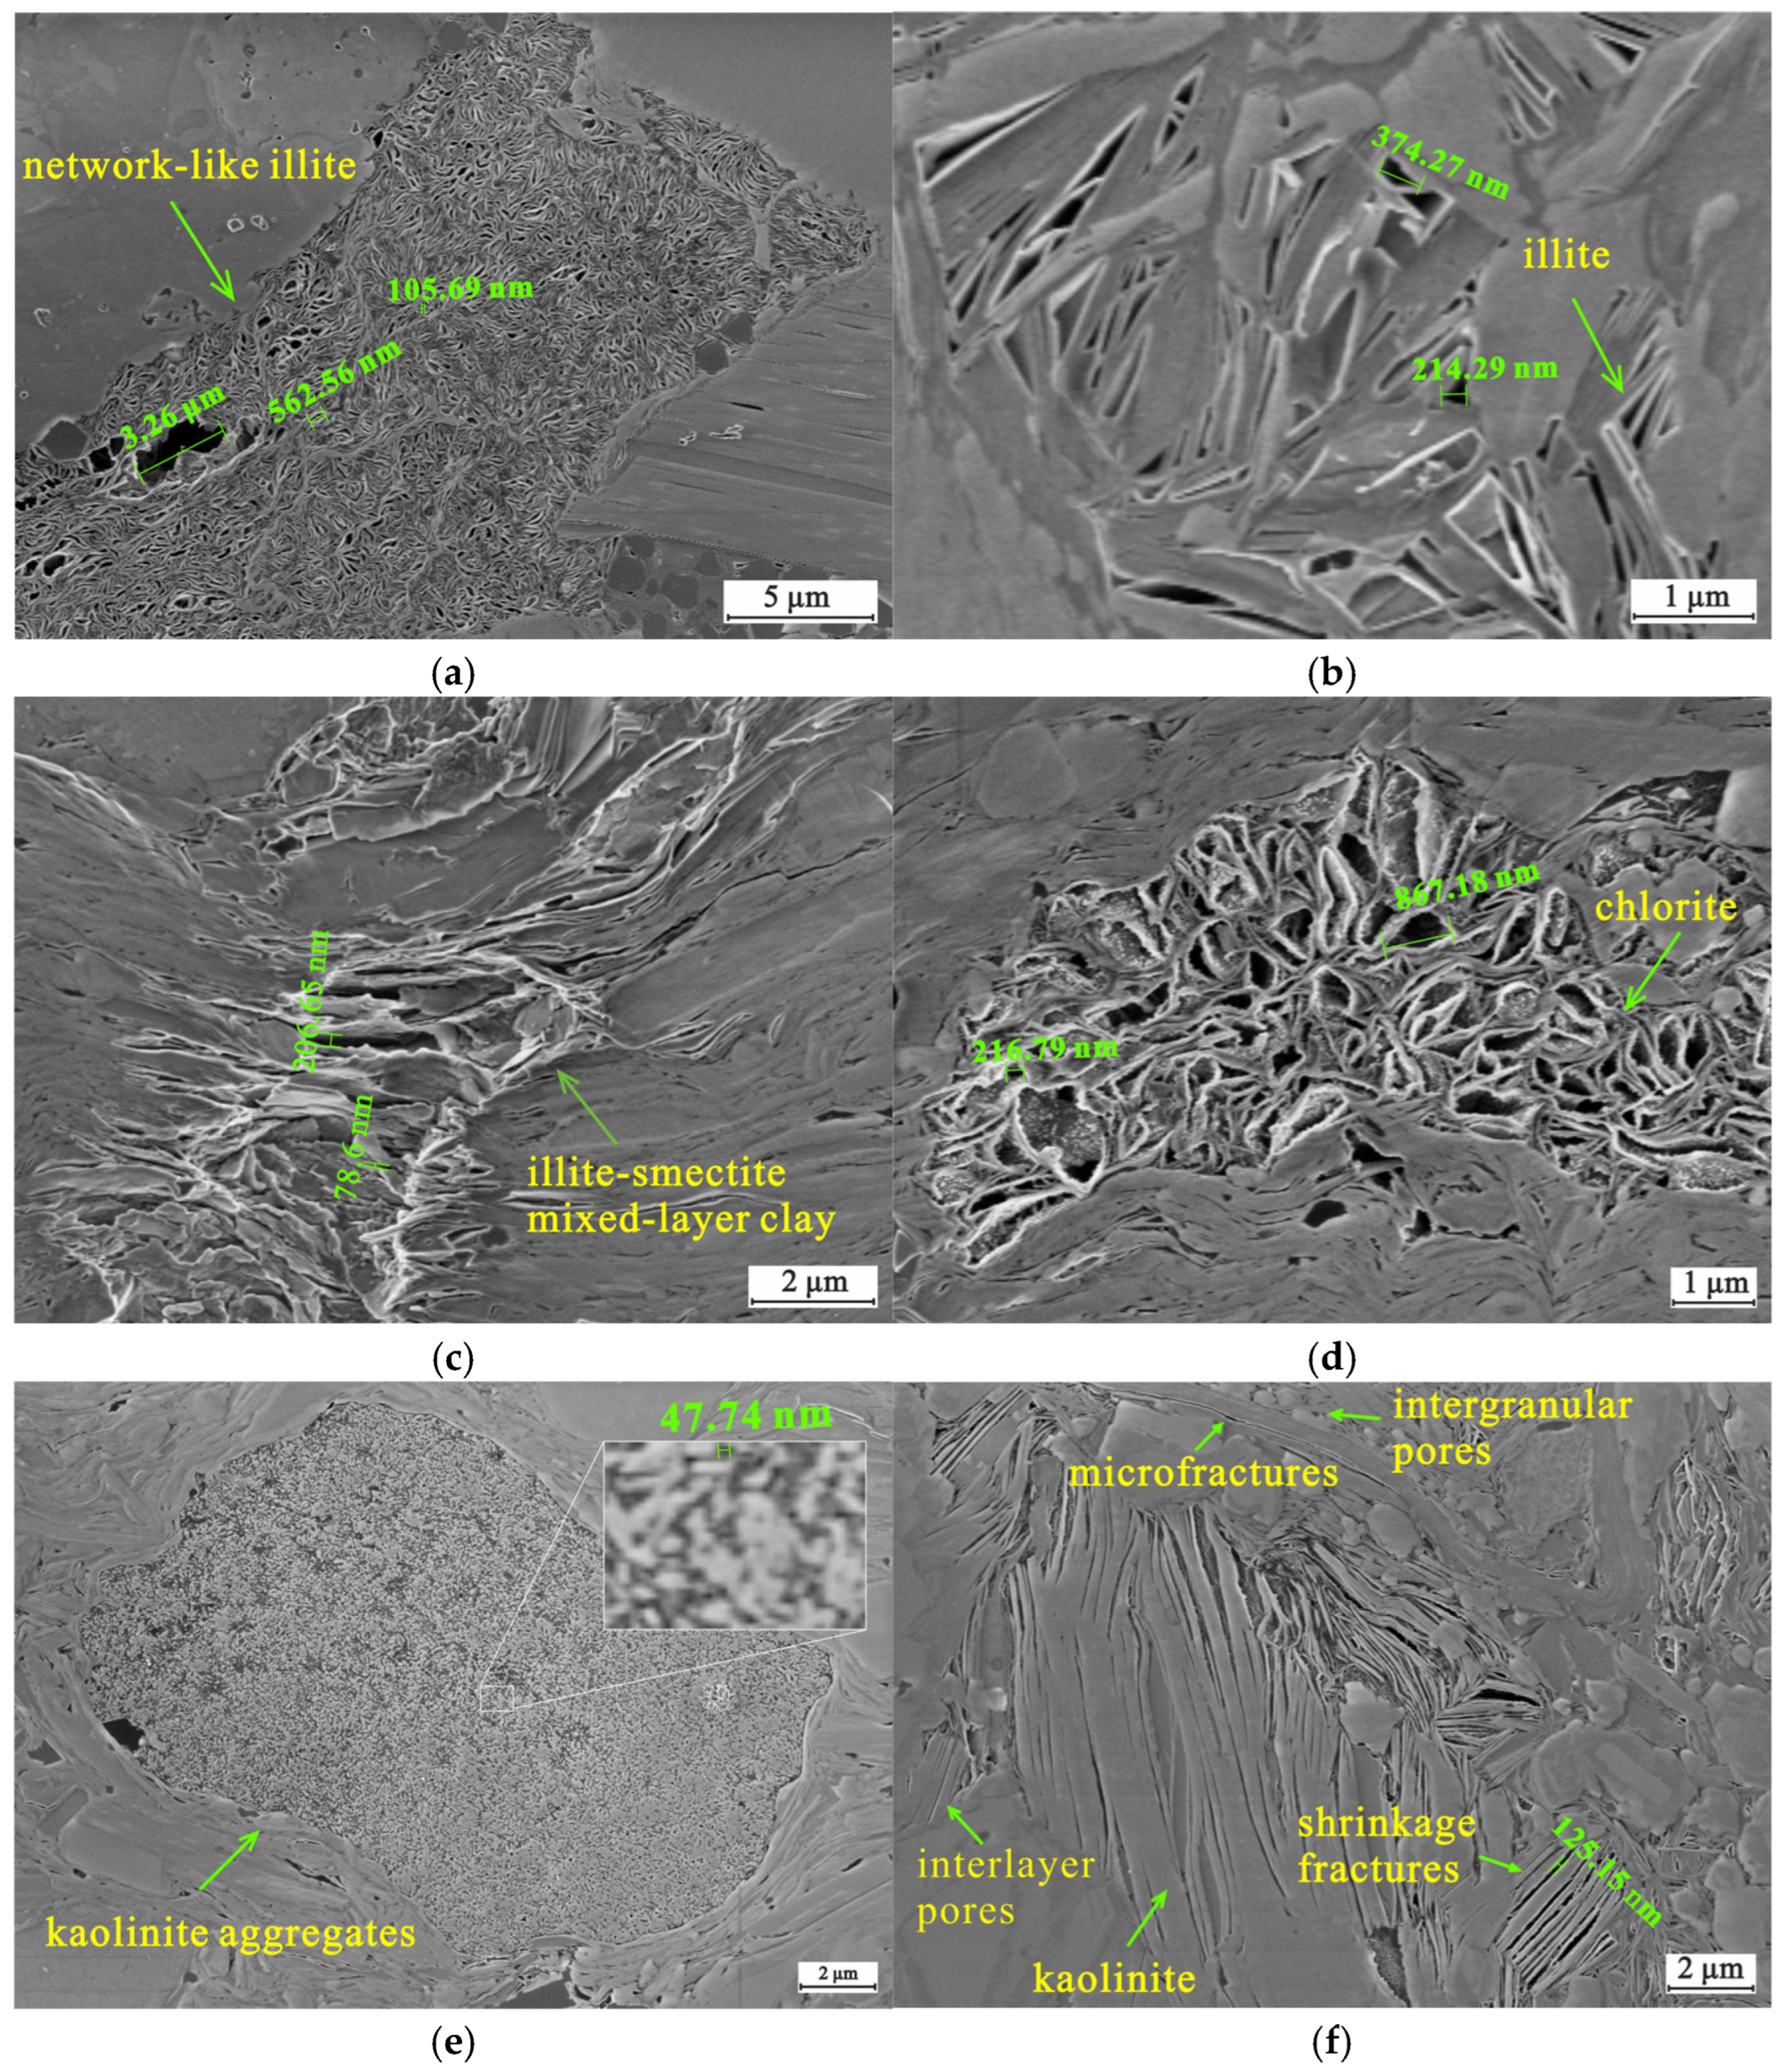
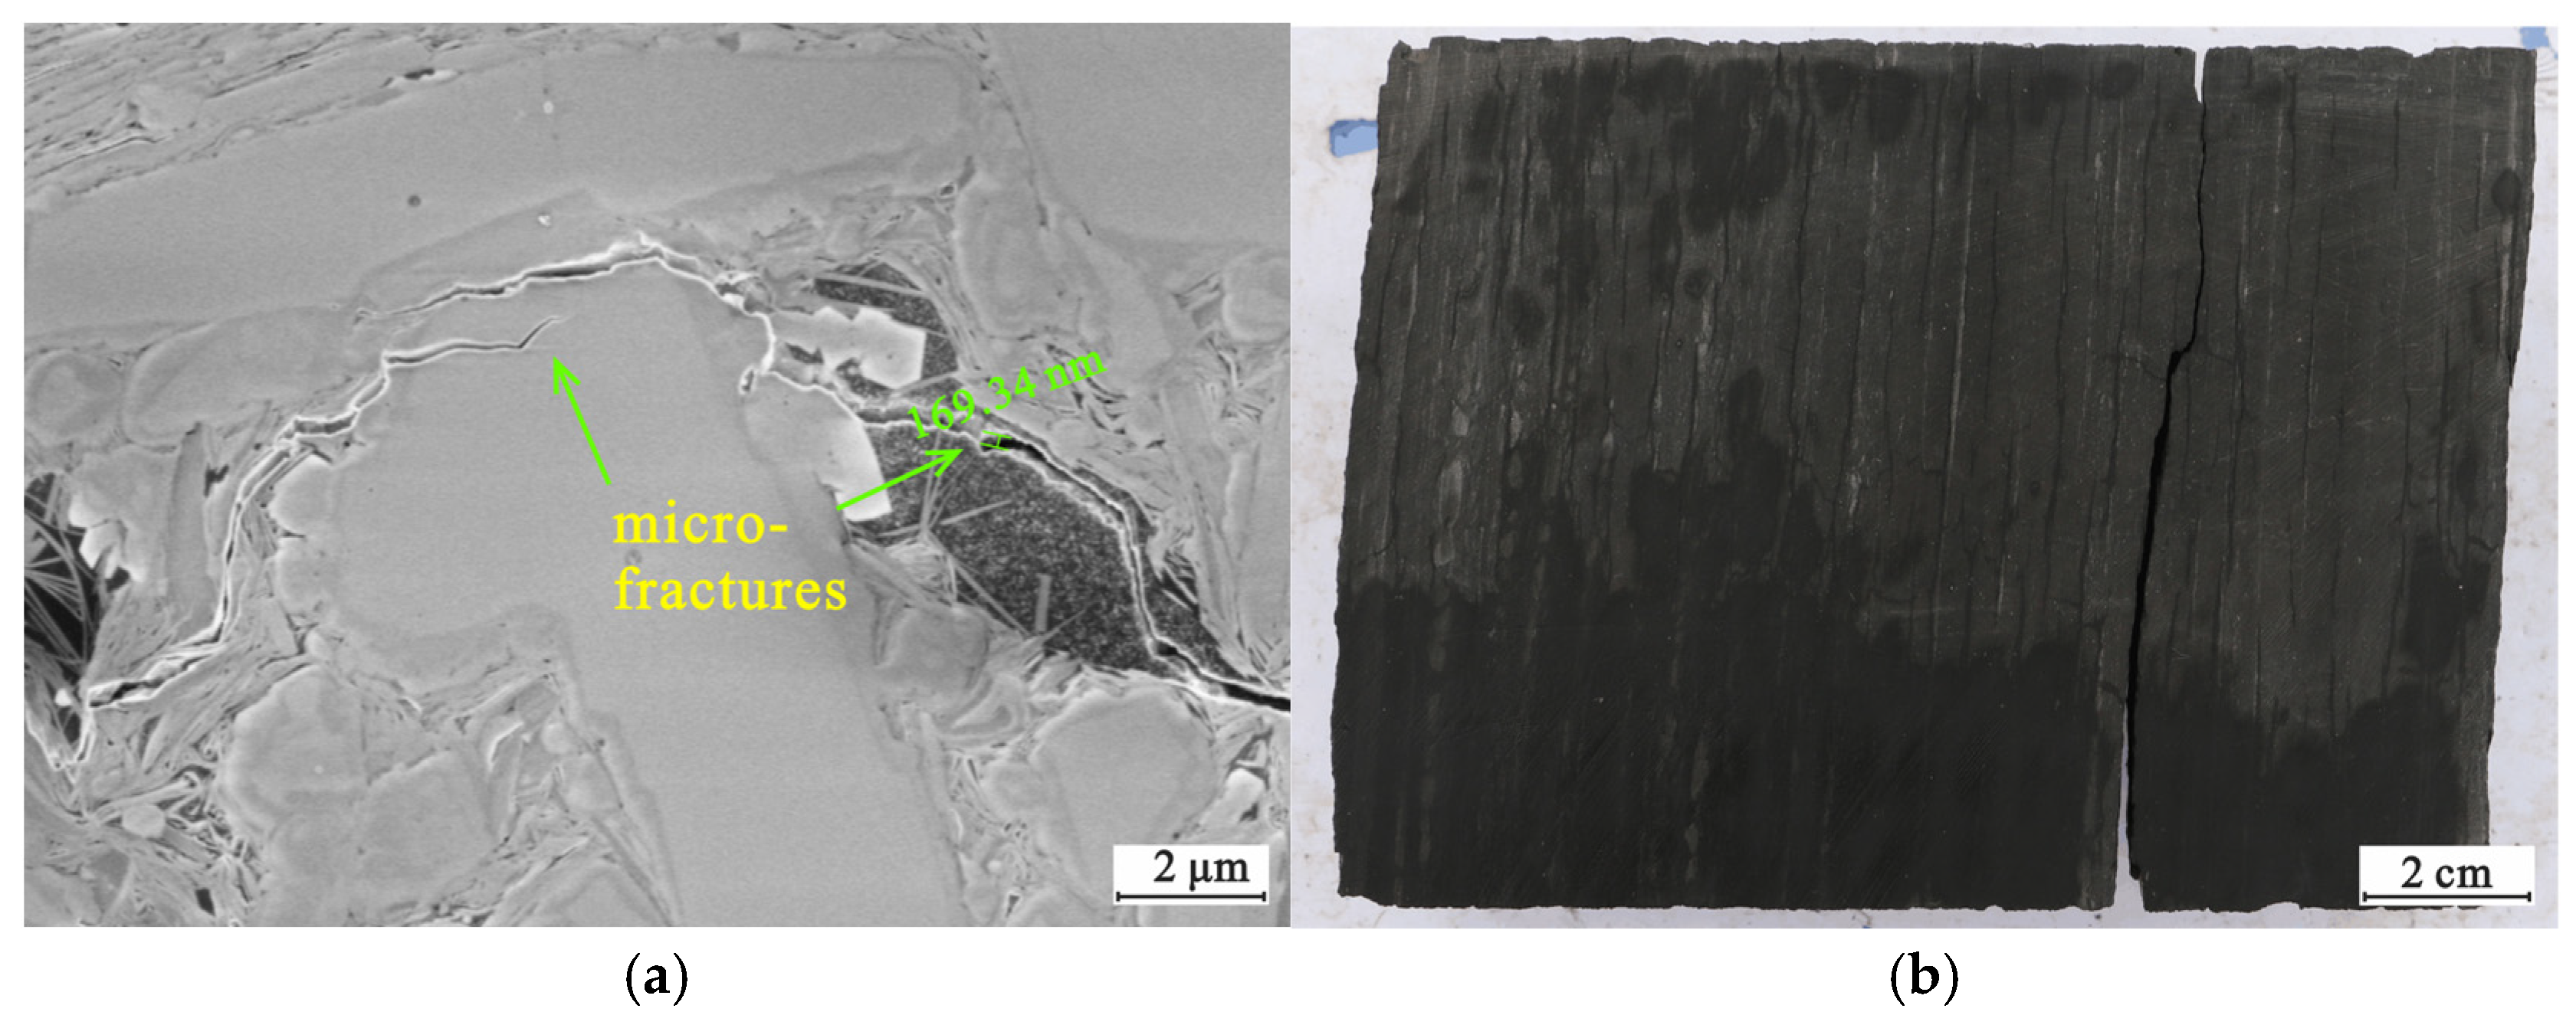
4.2. Inorganic Petrology

Table 1 shows the XRD results: The mineral composition of the Lianggaoshan Formation shale mainly consists of quartz, feldspar and clay minerals, with average contents of 36.4%, 6.34% and 50.16%, respectively. Clay minerals specifically include illite/montmorillonite interlayers, illite, chlorite and kaolinite (Figure 3). Among these, the illite/montmorillonite interlayers have the highest content, accounting for 41.77% of the clay minerals and 20.95% of the whole rock. Illite, chlorite and kaolinite have relatively low contents, accounting for 34.03%, 17.37% and 6.77% of the clay minerals, respectively, and representing 17.07%, 8.71% and 3.39% of the whole rock.
Figure 4a shows a weak positive correlation between clay content and TOC values. Similar phenomena have also been observed in other lacustrine shales, such as the continental shale of the Da’anzhai section in the Yuanba area [36], and the Carboniferous Benxi Formation shale in the eastern Ordos Basin [37]. The positive relationship between the clay minerals and TOC content is likely to be related to the adsorption capacity of clay minerals, which adsorb a certain amount of organic matter during the sedimentation process. A negative relationship between quartz and TOC content is observed in the investigated Lianggaoshan Shale (Figure 4b), which is different to marine shales [38]. It suggests that the input of terrigenous debris has a dilution effect on organic matter in continental shale.

4.3. Reservoir Characteristics

Scanning electron microscopy (SEM) results show that the lacustrine shale reservoir of the Lianggaoshan Formation is widely developed with nano- to millimeter-sized pores, and exhibits diverse pore types. These include clay mineral-related pores, feldspar and carbonate dissolution pores, organic matter pores, pyrite intercrystalline pores and microfractures.
Organic matter pores: Overall, these pores are poorly developed, and can only be observed in samples with a high organic matter content, appearing as dispersed and isolated distributions. The pore sizes of organic pores are mainly concentrated in the range of 10~200 nm, with some pores reaching the micrometer scale. Their shapes are diverse, typically irregular, elliptical, bubble-like, slit-shaped or honeycomb-like (Figure 5c,d). Honeycomb-like pores often locally connect to form micrometer-sized pore networks. The development of organic matter pores in lacustrine shales is significantly lower than that in marine shales, such as the Wufeng–Longmaxi Formation, Niutitang Formation and Sargelu–Garau shales [39,40,41]. Additionally, relatively large-scale pore-free organic matter is observed in samples with a high organic content. This may be due to these organic matters being subjected to compression deformation under compaction. A type of shrinkage fracture is commonly developed between the bent side of such organic matter and the surrounding clay minerals (Figure 5a,b).
The clay mineral-related pores are primarily intergranular pores, typically distributed as elongated shapes parallel to the stratification. The size and shape of the pores are influenced by factors such as the size, shape and arrangement of clay mineral particles. Illite generally fills the gaps between particles in fibrous and network-like forms (Figure 6a), with pore diameters mostly concentrated in the range of 0.1~1 μm. Some interconnected pores can reach micro-scale sizes, while others exhibit triangular or irregular intercrystalline pores (Figure 6b) with diameters ranging from 0.5 to 4.0 μm. The illite/smectite mixed layers, characterized by fine particle sizes and clay matrix filling between particles, exhibit continuous and oriented layered structures (Figure 6c). Their intercrystalline gaps are well developed, with their measurements mostly falling in the range of 50~300 nm. Chlorite exhibits rose-like fillings between particles (Figure 6d), with pore diameters concentrated in the range of 0.1~1 μm. Kaolinite occasionally occurs as grain-like or worm-shaped aggregates filling the pores (Figure 6e), with small intergranular pores generally not exceeding 50 nm; mechanically compacted book-like kaolinite can also be observed (Figure 6f). The brittle minerals in the clay minerals also form interlayer pores and interlayer cracks after being crushed during the compaction process (Figure 6f). The widths of these fractures exhibit significant variation, generally ranging from 10 to 300 nm. Additionally, the fractures have relatively short extensions, typically only a few micrometers in length. Howbeit, these fractures connect previously isolated pores, effectively enhancing the pore space and permeability of the reservoir.
Erosion pores: These are often irregularly shaped, unevenly distributed and occur sporadically. The overall size of feldspar erosion pores ranges from 100 to 500 nm, with shapes typically appearing as elongated, honeycomb-like or spotted forms (Figure 7a). The size of carbonate erosion pores generally falls between 50 and 500 nm, often taking on near-circular or elliptical shapes (Figure 7b). The formation of these pores may be related to organic acids released by kerogen.
Intercrystalline pores of pyrite: In framboidal pyrite aggregates, intercrystalline pores are abundant between the crystals, with pore sizes typically ranging from 0.1 to 2.0 μm (Figure 7c), and pores commonly filled with organic matter. Non-strawberry-like pyrite also exhibits dissolution pores, though these occur more sporadically, with less consistency in size, generally ranging from 0.05 to 2.0 μm. These pores are occasionally filled with organic matter (Figure 7d).
Microfractures: Lamination fractures constitute one primary type of microfracture. They become clearly observable during the drying of wet rocks (Figure 8b). They display parallel linear morphologies with centimeter-scale extensions along bedding planes. The dominant theory attributes their formation to differential compaction between mineral composition laminae. Beyond lamination fractures, nanoscale/micron-scale microfractures occur at plastic-rigid mineral boundaries (Figure 8a). Organic matter-hosted microfractures primarily derive from hydrocarbon generation. These fractures contain minimal fillings (Figure 5c). Clay mineral microfractures mainly form contraction fractures through mineral transformation and dehydration (Figure 6f). Organic–inorganic interfacial microfractures originate from organic matter shrinkage during hydrocarbon generation (Figure 5a) or organic acid dissolution at particle edges. Mechanical compaction during diagenesis also generates particle-breaking microfractures (Figure 6f). Microfracture development significantly enhances reservoir properties by improving shale porosity and permeability. At specific depths (3566.4 m), porosity and permeability reach 5.5% and 2.29 mD, respectively (Figure 1b). Microfractures exhibit non-unilaterally beneficial effects: while increasing the adsorption-specific surface area (particularly in the case of organic-hosted fractures), they may compromise pore sealing integrity and induce methane leakage [42].

4.4. Methane Adsorption Ability

The data fitting experimental results and adsorption isotherms of Lianggaoshan Formation shale at 358.15 K are presented in Table 2 and Figure 9. The excess adsorption capacity (mexcess) shows an initial increase, followed by a decrease, under high pressure (15–20 MPa). This trend closely relates to the dynamic interplay between adsorbed gas density (ρads) and free gas density (ρbulk). Analysis using Equation (1) reveals that at low-pressure stages, lower ρbulk drives a rapid adsorption increase with rising pressure. At high-pressure stages, significantly elevated ρbulk reduces the (1 − ρads/ρbulk) term. Despite the absolute adsorption capacity (mabs) approaching saturation, the excess adsorption capacity declines. This initial-rise-then-fall pattern of excess adsorption curves has been widely documented in previous studies [43,44,45]. Wei et al. propose that this phenomenon may correlate with the adsorbed-phase volume [46]. The adsorbed-phase volume occupies only a minor fraction of the total pore volume, while most of the remaining space in macropores remains filled with free gas.
The absolute adsorption quantity represents the true amount of adsorbed gas in shale, which is a function of temperature and pressure. At a given temperature, the maximum amount of an adsorbate that can be adsorbed by an adsorbent is referred to as the saturated adsorption capacity. The relationships between excess adsorption quantity, absolute adsorption quantity and saturated adsorption quantity can be expressed using the Gibbs equation:
mexcess = mabs × (1 − ρads/ρbulk)
ρbulk: the density of free gas (kg/m3), and ρads: the density of adsorbed gas (kg/m3).
While the Langmuir model is widely used for shale gas adsorption fitting, its simplified assumptions conflict with real-system complexities: The model assumes monolayer adsorption, homogeneous surfaces and negligible intermolecular interactions. However, capillary condensation may occur in micropores, and heterogeneous compositions (organic matter, clay minerals, quartz) create uneven adsorption site energy distributions, violating the monolayer/homogeneous surface assumptions. Furthermore, influenced by free gas density, the model requires coupling with the Gibbs equation and additional corrections to fit the declining trend of mexcess. Therefore, combining the Langmuir fitting formula (Vex = VL ∗ P/(PL + P) ∗ (1 − ρg/ρa)) with the Gibbs formalism enables fitting of excess adsorption capacity. This approach allows for the derivation of absolute adsorption capacity and adsorption isotherms. The corrected adsorption curves exhibit Type I isotherm characteristics (Figure 9).

5. Discussion

5.1. Lacustrine and Marine Shale Pore Type Differences

The distinct dominant pore types constitute the primary reservoir characteristic difference between lacustrine and marine shales. Inorganic pores show greater development in continental shales, whereas organic pores exhibit wider distribution in marine shales. Xin Liwei et al. reached consistent conclusions when comparing reservoir characteristics between marine Longmaxi Formation shales and lacustrine Da’anzhai Member shales in the Sichuan Basin [38]. The disparity in dominant pore types stems principally from variations in organic matter (mainly types and maturity) and mineral compositions. The organic matter type directly governs pore development: Type I kerogen generates the most pores during thermal evolution, facilitating methane adsorption and storage. Type II-III kerogens also produce pores during thermal evolution, but demonstrate comparatively inferior pore development relative to Type I kerogen [21].
The type and thermal maturity of the organic matter are the major factors influencing the rare development of organic matter pores in the Lianggaoshan lacustrine shale. Organic geochemical analysis indicates that Lianggaoshan Formation shale predominantly contains Type II-III organic matter, with a high vitrinite content and a low sapropelinite composition (Figure 3). A large number of studies have confirmed that the abundance of organic pores in gas-prone organic shale with a high vitrinite content is generally lower than that in oil-prone organic shale dominated by sapropelinite. For example, continental shales, such as the Lianggaoshan Formation shale (in this paper), the Gulong shale and the Lucaogou shale are compared with marine shales, such as the Longmaxi Formation shale, the Shuijingtuo Formation shale, the Mississippian Barnett shale, and the Upper Cretaceous Eagle Ford shale [47,48,49,50]. Organic pores are categorized into primary and secondary types. Primary organic pores are observable in immature/low-maturity shale macerals, while secondary organic pores form through thermal maturation of kerogen and derivatives. Gao Fenglin et al. demonstrated, through thermal simulation of continental Shahezi Formation shale in Songliao Basin’s Changling Sag, that Type III kerogen-dominated shale exhibits underdeveloped organic pores throughout thermal maturation, even reaching gas-generation window stages.
Marine and continental shales exhibit similar mineral type compositions; however, their mineral content shows significant differentiation. Marine shales are characterized by high silica–low clay mineral assemblages, with a quartz content generally ranging from 45% to 60%, and some high-quality intervals exceeding 65% [51]. In contrast, continental shales exhibit a reduced silica content (typically 30–45%) and significantly increased clay mineral proportions (45–60%), presenting a composition dominated by plastic minerals (as observed in this study).
The pore system evolution differs substantially between marine and continental shales: in marine shales, silica minerals’ rigid framework effectively resists mechanical compaction. Coupled with hydrocarbon-generation pressurization effects, this promotes abundant interconnected circular–elliptical organic pores [38], making organic porosity the focal target for marine shale exploration. Lacustrine shales demonstrate distinct evolutionary patterns: early diagenesis induces co-compaction of plastic clays and organic matter into dense composites, causing plastic deformation/closure of most primary organic pores. Late diagenetic clay transformations (e.g., smectite-to-illite) trigger mineral lattice collapse, generating secondary pores/fractures [52]. This “secondary porosity compensation effect” enables clay minerals to effectively enhance shale pore structures.

5.2. The Effect of Inorganic Minerals on Adsorption Capacity

Inorganic minerals exert differential controls on shale methane adsorption capacity. Research shows that clay minerals (including illite/smectite mixed-layer, illite, etc.) exhibit higher abundance than quartz and feldspar minerals (Table 1). These clay minerals host diverse pore types (Figure 6), providing additional methane adsorption space. Though bulk clay mineral content shows a weak correlation with adsorption capacity (Figure 10a), a positive correlation emerges after TOC-normalized processing [53], contrasting sharply with marine shales’ negative correlation [54]. This occurs because marine shale clay mineral content inversely correlates with TOC, allowing organic matter to overshadow clay mineral effects, whereas studied samples show no significant mutual exclusivity between clays and organic matter.
Sub-mineral analysis (combined with Figure 3) reveals the following: illite/smectite mixed-layer minerals, constituting excessive proportions (>40% average) in clays, exhibit layered structures that are vulnerable to compaction under deep burial pressures. This disrupts interlayer pore–fracture connectivity, ultimately suppressing adsorption capacity (Figure 10e). In contrast, illite’s compaction-resistant network and triangular pore structures (Figure 6a,b) effectively preserve pore architecture, positively controlling adsorption capacity (Figure 10f) and showing a strong positive correlation with maximum adsorption capacity (R2 = 0.56). Rigid minerals like quartz demonstrate negative adsorption correlations (Figure 10b–d), failing to enhance adsorption capacity.
Collectively, specific clay minerals (particularly illite) can dominate adsorption capacity through microstructural advantages when TOC effects are excluded. This provides critical guidance for optimizing favorable intervals in lacustrine shale gas exploration.

5.3. The Effect of TOC Content on Adsorption Capacity

Figure 11a illustrates a positive correlation between methane adsorption capacity and TOC. Additionally, the value of the correlation coefficient (R2) is 0.15, indicating that TOC exhibits a positive control effect on shale adsorption capacity. Similar positive correlations have also been reported in other shales, such as Wufeng–Longmaxi Formation shale, Sargelu-Garau shale, and other North American and European shales [41,55,56].
Though organic pores do not represent the dominant pore type in Lianggaoshan Formation shale, they are also developed. Shale samples with a higher organic matter content exhibit greater organic pore abundance compared to their low-TOC counterparts, as confirmed by SEM observations and the TOC–porosity correlation plot (Figure 11b). Furthermore, increased organic matter content enhances pore development within organic matter, significantly expanding adsorption sites and adsorption volume for methane molecules. This process concurrently elevates the specific surface area available for methane adsorption. Additionally, the inherent oil-wetting characteristics of organic matter facilitate effective gas adsorption, thereby amplifying shale adsorption capacity. Consequently, TOC still exerts a positive influence on shale adsorption capability.

5.4. Implications for Oil and Gas Exploration in Lianggaoshan Formation Shale

The adsorption relationships demonstrated in Figure 10 and Figure 11 suggest that clay minerals (particularly illite) act as the primary controlling factor for adsorption capacity in lacustrine Lianggaoshan Formation shale, evidenced by their higher correlation coefficient values with maximum adsorption capacity compared to other factors. This arises because marine shales inherently possess a high adsorption gas potential when organic matter abundance and pore types develop under high-TOC conditions. In contrast, lacustrine shales lack absolute TOC dominance. Elevated clay mineral content compensates by increasing micropore volume and specific surface area, enabling comparable gas-bearing capacity. High porosity and microfracture development break traditional “high-TOC sweet spot” constraints in hydrocarbon exploration, demonstrating the exploration potential of semi-deep lacustrine deposited shales.

6. Conclusions

(1)
The lacustrine shale of the Lianggaoshan Formation has a moderate organic matter content, with organic types ranging from II to III, and maturation levels within the oil window. The mineral components are dominated by clay minerals, among which illite/smectite mixed layers have the highest proportion, followed by illite, chlorite and kaolinite.
(2)
The pore types in the lacustrine shale reservoir of the Lianggaoshan Formation mainly include clay mineral-related pores, feldspar and carbonate dissolution pores, organic matter pores, pyrite intercrystalline pores and micro-fractures. Among these, clay mineral-related pores are the most well developed.
(3)
The adsorption capacity of lacustrine shale from the Lianggaoshan Formation is primarily influenced by clay mineral content. A high clay mineral content significantly improves the pore structure of the reservoir, compensating for the limitations posed by moderate-to-low TOC in shale exploration and development. This highlights the exploration potential of shale deposits in semi-deep lacustrine environments.
(4)
Although lacustrine shale is less dependent on TOC, future research may still need to explore the synergistic or competitive effects between clay minerals and organic matter in the mixed system, and we urge the development of a comprehensive evaluation framework combining clay mineralogy, porosity, fracture density and geochemical data. The previously neglected lacustrine basins may occupy a dominant position in future oil and gas exploration.

Author Contributions

Conceptualization, D.Z. and M.H.; methodology, P.F.; software, G.Y.; validation, P.F., D.Z. and S.W.; formal analysis, F.Z.; investigation, P.F.; resources, G.Y.; data curation, S.W.; writing—original draft preparation, P.F.; writing—review and editing, D.Z.; visualization, F.Z.; supervision, G.Y.; project administration, M.H.; funding acquisition, M.H. All authors have read and agreed to the published version of the manuscript.

Funding

Supported by Open Fund of Key Laboratory of Exploration Technologies for Oil and Gas Resources (Yangtze University), Ministry of Education, No. K2024-08.

Data Availability Statement

All data and materials are available on request from the corresponding author. The data are not publicly available, due to ongoing research using part of the data.

Conflicts of Interest

Authors Dazhi Zhang and Gang Yang were employed by Exploration and Development Research Institute of Daqing Oilfield Company Ltd. The remaining authors declare that the research was conducted in the absence of any commercial or financial relationships that could be construed as a potential conflict of interest.

References

  1. Chen, C.; Chen, Z.; Liu, X.; Yin, X.; Shi, M.; Chen, Q.; Zhou, J. Key technologies for predicting sweet spots of Jurassic Lianggaoshan Formation continental shale oil and gas in the Fuxing area of the Sichuan Basin. Nat. Gas Ind. 2025, 45, 94–104. [Google Scholar]
  2. Luo, Q.; Goodarzi, F.; Zhong, N.; Qiu, N.; Wang, X.; Suchý, V.; Khan, I.; Zheng, X.; Liu, B.; Ardakani, O.H.; et al. Dispersed organic matter from pre-Devonian marine shales: A review on its composition, origin, evolution, and potential for hydrocarbon prospecting. Earth-Sci. Rev. 2025, 261, 105027. [Google Scholar]
  3. Li, P.; Liu, Z.-B.; Bi, H.; Jiang, T.; Bian, R.-K.; Wang, P.-W.; Shang, X.-Y. Differences in and factors controlling organic matter enrichment in the Ziliujing Formation shale in the Sichuan Basin. Pet. Sci. 2024, 21, 77–86. [Google Scholar] [CrossRef]
  4. Teng, J.; Liu, B.; Mastalerz, M.; Schieber, J. Origin of Organic Matter and Organic Pores in the Overmature Ordovician-Silurian Wufeng-Longmaxi Shale of the Sichuan Basin, China. Int. J. Coal Geol. 2022, 253, 103970. [Google Scholar]
  5. Abelly, E.N.; Yang, F.; Ngata, M.R.; Mwakipunda, G.C.; Shanghvi, E.R. A Field Study of Pore-Network Systems on the Tight Shale Gas Formation through Adsorption-Desorption Technique and Mercury Intrusion Capillary Porosimeter: Percolation Theory and Simulations. Energy 2024, 302, 131771. [Google Scholar]
  6. Ukaomah, C.F.; Sun, M.; Pan, Z.; Ostadhassan, M.; Liu, B.; Meng, Q.; Aminu, M.D.; Fischer, M. Experimental and Molecular Investigation of Water Adsorption Controls in Marine and Lacustrine Shale Reservoirs. J. Hydrol. 2023, 621, 129672. [Google Scholar]
  7. Li, X.; Jiang, Z.; Wang, S.; Wu, F.; Miao, Y.; Wang, X.; Wang, H.; Liu, X. Differences of Marine and Transitional Shales in the Case of Dominant Pore Types and Exploration Strategies, in China. J. Nat. Gas Sci. Eng. 2022, 103, 104628. [Google Scholar]
  8. Ali, A.M.; Kwaya, M.Y.; Mijinyawa, A.; Aminu, A.A.; Usman, Z.M. Molecular Dynamics and Energy Distribution of Methane Gas Adsorption in Shales. J. Nat. Gas Geosci. 2023, 8, 1–15. [Google Scholar]
  9. Yang, S.; Zhao, C.; Ji, B.; He, Y. Adsorption Isotherm Calculation and Mechanism of High Pressure and High Temperature Shale Gases. Fuel 2023, 331, 125854. [Google Scholar]
  10. Mudoi, M.P.; Sharma, P.; Khichi, A.S. A Review of Gas Adsorption on Shale and the Influencing Factors of CH4 and CO2 Adsorption. J. Pet. Sci. Eng. 2022, 217, 110897. [Google Scholar]
  11. Liu, B.; Mohammadi, M.-R.; Ma, Z.; Bai, L.; Wang, L.; Wen, Z.; Liu, Y.; Morta, H.B.; Hemmati-Sarapardeh, A.; Ostadhassan, M. Experimental Investigation and Intelligent Modeling of Pore Structure Changes in Type III Kerogen-Rich Shale Artificially Matured by Hydrous and Anhydrous Pyrolysis. Energy 2023, 282, 128799. [Google Scholar]
  12. Aruah, B.; Sakhaee-Pour, A.; Hatzignatiou, D.G. Alteration of Pore Structure and Effects on Critical Properties of Shale Formations Undergone Cryogenic Thermal Shock. Geoenergy Sci. Eng. 2024, 240, 213002. [Google Scholar] [CrossRef]
  13. Mishra, V.K.; Mendhe, V.A.; Kamble, A.D.; Pandey, S.; Singh, V.P.; Shukla, P. Significance of Organo-Mineralogical Constituents on Pore Distribution, Fractals and Gas Sorption Mechanism of Permian Shale Beds in Korba Sub-Basin of the Son-Mahanadi Valley, India. Geoenergy Sci. Eng. 2023, 231, 212334. [Google Scholar]
  14. Hazarika, S.; Boruah, A.; Kumar, H. Study of Pore Structure of Shale Formation for CO2 Storage. Mater. Today Proc. 2024, 99, 138–144. [Google Scholar]
  15. Ren, Y.-J.; Wei, B.; Ji, B.-X.; Pu, W.-F.; Wang, D.-L.; Tang, J.-Y.; Lu, J. Pore-Scale Probing CO2 Huff-n-Puff in Extracting Shale Oil from Different Types of Pores Using Online T1–T2 Nuclear Magnetic Resonance Spectroscopy. Pet. Sci. 2024, 21, 4119–4129. [Google Scholar]
  16. Zhang, N.; Wang, X.; Wang, S.; Wang, R.; Wu, J.; Li, Z.; Song, Y. Multifractal characteristics on pore structure of Longmaxi shale using nuclear magnetic resonance (NMR). Geoenergy Sci. Eng. 2024, 241, 213176. [Google Scholar]
  17. Zheng, H.; Yang, F.; Guo, Q.; Liu, K. Upscaling characterizing pore connectivity, morphology and orientation of shale from nano-scale to micro-scale. Mar. Pet. Geol. 2025, 172, 107213. [Google Scholar]
  18. Jiang, W.; Lin, M.; Luo, C.; Chen, Z.; Cao, G.; Ji, L.; Dou, W.; Zhong, K.; Hao, F. Optimal selection of inversion method for gas-adsorption pore characterization of shales in Wufeng and Longmaxi Formation, Sichuan Basin. Chem. Eng. J. 2024, 485, 149889. [Google Scholar]
  19. Taghavinejad, A.; Rabbani, A.; Falcone, G.; Shang, J.; Arif, M.; Zhang, Y. Pore Network Modelling of CO2-Shale Interaction for Carbon Storage: Swelling Effect and Fracture Permeability. Int. J. Greenh. Gas Control 2025, 141, 104294. [Google Scholar]
  20. Hui, G.; Chen, Z.; Wang, Y.; Zhang, D.; Gu, F. An Integrated Machine Learning-Based Approach to Identifying Controlling Factors of Unconventional Shale Productivity. Energy 2023, 266, 126512. [Google Scholar]
  21. Liu, B.; Mohammadi, M.-R.; Ma, Z.; Bai, L.; Wang, L.; Xu, Y.; Hemmati-Sarapardeh, A.; Ostadhassan, M. Pore structure characterization of solvent extracted shale containing kerogen type III during artificial maturation: Experiments and tree-based machine learning modeling. Energy 2023, 283, 128885. [Google Scholar]
  22. Hui, S. Quantifying the Relative Contribution and Evolution of Pore Types to Shale Reservoir Space: Constraints from over-Mature Marine Shale in the Sichuan Basin, SW China. J. Asian Earth Sci. 2023, 249, 105625. [Google Scholar] [CrossRef]
  23. Dong, Z.; Tian, S.; Xue, H.; Lu, S.; Liu, B.; Erastova, V.; Chen, G.; Zhang, Y. A Novel Method for Automatic Quantification of Different Pore Types in Shale Based on SEM-EDS Calibration. Mar. Pet. Geol. 2025, 173, 107278. [Google Scholar]
  24. Zhang, W.; Zhou, S.; Yu, Z.; Liu, X.; Wang, S.; Miao, H.; Liu, D.; Tian, J.; Wang, H. Controls of Clay Mineral Transformation and Organic Matter on Pore Networks of the Paleogene Lacustrine Shale Oil System in the Yitong Basin, NE China. J. Asian Earth Sci. 2025, 280, 106469. [Google Scholar]
  25. Hou, Y.; He, S.; Yi, J.; Zhang, B.; Chen, X.; Wang, Y.; Zhang, J.; Cheng, C. Effect of pore structure on methane sorption capacity of shales. Pet. Explor. Dev. 2014, 41, 248–256. [Google Scholar]
  26. Borrok, D.M.; Yang, W.; Wei, M.; Mokhtari, M. Heterogeneity of the Mineralogy and Organic Content of the Tuscaloosa Marine Shale. Mar. Pet. Geol. 2019, 109, 717–731. [Google Scholar]
  27. Lohr, C.D.; Merrill, M.D. Comparison of Measured versus Modeled TOC in the Tuscaloosa Marine Shale of Southwestern Mississippi, U.S.A. Mar. Pet. Geol. 2024, 164, 106655. [Google Scholar] [CrossRef]
  28. Galoski, C.E.; Froehner, S.; Jiménez Martínez, A.E.; Aquino, C.D.; França, A.; Borillo, G.C. Insights into Organic Matter Source and Depositional Environments of Shales from the Ponta Grossa Formation in Parana Basin, Brazil. J. S. Am. Earth Sci. 2024, 143, 104995. [Google Scholar]
  29. Chalmers, G.R.L.; Bustin, R.M. The Organic Matter Distribution and Methane Capacity of the Lower Cretaceous Strata of Northeastern British Columbia, Canada. Int. J. Coal Geol. 2007, 70, 223–239. [Google Scholar]
  30. Gao, P.; Xiao, X.; Hu, D.; Lash, G.G.; Liu, R.; Cai, Y.; Wang, Z.; Zhang, B.; Yuan, T.; Liu, S. Effect of Silica Diagenesis on Porosity Evolution of Deep Gas Shale Reservoir of the Lower Paleozoic Wufeng-Longmaxi Formations, Sichuan Basin. Mar. Pet. Geol. 2022, 145, 105873. [Google Scholar]
  31. Ross, D.J.K.; Bustin, R.M. The Importance of Shale Composition and Pore Structure upon Gas Storage Potential of Shale Gas Reservoirs. Mar. Pet. Geol. 2009, 26, 916–927. [Google Scholar]
  32. Hu, C.; Tan, J.; Lyu, Q.; Zhang, Y. Evolution of Organic Pores in Permian Low Maturity Shales from the Dalong Formation in the Sichuan Basin: Insights from a Thermal Simulation Experiment. Gas Sci. Eng. 2024, 121, 205166. [Google Scholar]
  33. Wang, Q. Effects of Clay Mineral Characteristics on Shale Adsorbed Gas: Based on the Experimental Analysis of Shale Samples in Longmaxi Formation of Dingshan Area, Southeast Sichuan. J. Chongqing Univ. Sci. Technol. Sci. Ed. 2019, 21, 20–24. [Google Scholar]
  34. Heller, R.; Zoback, M. Adsorption of Methane and Carbon Dioxide on Gas Shale and Pure Mineral Samples. J. Unconv. Oil Gas Resour. 2014, 8, 14–24. [Google Scholar]
  35. Wang, A.; Zhong, D.; Wang, W.; Zhou, Z.; Tang, Z. Controls of Multi-stage Tectonic Movement on Sandstones with Different Provenances. J. Southwest Pet. Univ. (Sci. Technol. Ed.) 2022, 44, 27–40. [Google Scholar]
  36. Wei, X.; Huang, J.; Li, Y.; Wang, Q.; Liu, R.; Wen, Z. The main controlling factors of continental shale gas enrichment and high yield in the Da’anzhai section of Yuanba area. Geol. China 2014, 41, 970–981. [Google Scholar]
  37. Xi, Y.; Wen, Z.; Zhao, W.; Zhang, L.; Zhang, H.; Sun, L.; Wu, C.; Song, H. Study on geological characteristics and enrichment law of shale gas of Carboniferous Benxi Formation in eastern Ordos Basin. Nat. Gas Geosci. 2022, 33, 1936–1950. [Google Scholar]
  38. Xin, L.; Li, H.; Wang, X.; Zhang, Z.; Hou, S.; He, S. Comparative study of shale reservoir characteristics between the Longmaxi Formation and the Da’anzhai Member in the Sichuan Basin: Highlighting facies differences between marine and lacustrine depositional environments. Chin. J. Geol. 2024, 59, 1003–1017. [Google Scholar]
  39. Chen, L.; Dong, J.; Hu, Y.; Ji, Y.; Ren, G. Mechanism of Organic Matter Enrichment in the Wufeng Formation–Longmaxi Formation Shale in the Upper Yangtze Platform. J. Southwest Pet. Univ. Technol. Ed. 2024, 46, 66–79. [Google Scholar]
  40. Miao, F.; Peng, Z.; Wang, C.; Yue, Y.; Wang, Z. Gas-Bearing Capacity and Controlling Factors of Niutitang Formation Shale in Well XZD-1, Western Margin of Xuefeng Uplift. Earth Sci. 2019, 44, 3662. [Google Scholar] [CrossRef]
  41. Shabani, M.; Moallemi, S.A.; Krooss, B.M.; Amann-Hildenbrand, A.; Zamani-Pozveh, Z.; Ghalavand, H.; Littke, R. Methane Sorption and Storage Characteristics of Organic-Rich Carbonaceous Rocks, Lurestan Province, Southwest Iran. Int. J. Coal Geol. 2018, 186, 51–64. [Google Scholar]
  42. Feng, Y.; Xiao, X.-M.; Wang, E.-Z.; Gao, P.; Lu, C.-G.; Li, G. Gas Storage in Shale Pore System: A Review of the Mechanism, Control and Assessment. Pet. Sci. 2023, 20, 2605–2636. [Google Scholar]
  43. Ghasemzadeh, H.; Babaei, S.; Tesson, S.; Azamat, J.; Ostadhassan, M. From Excess to Absolute Adsorption Isotherm: The Effect of the Adsorbed Density. Chem. Eng. J. 2021, 425, 131495. [Google Scholar]
  44. Rugarabamu, J.R. Modelling of Physical and Chemical Properties of Activated Carbons Which Affect Methane Adsorption Mechanisms. Pet. Res. 2025, 10, 188–203. [Google Scholar]
  45. de Araujo, I.S.; Jagadisan, A.; Heidari, Z. Impacts of Kerogen Type and Thermal Maturity on Methane and Water Adsorption Isotherms: A Molecular Simulation Approach. Fuel 2023, 352, 128944. [Google Scholar]
  46. Wei, S.; He, S.; Pan, Z.; Zhai, G.; Dong, T.; Guo, X.; Yang, R.; Han, Y.; Yang, W. Characteristics and evolution of pyrobitumen-hosted pores of the overmature Lower Cambrian Shuijingtuo Shale in the south of Huangling anticline, Yichang area, China: Evidence from FE-SEM petrography. Mar. Pet. Geol. 2020, 116, 104303. [Google Scholar]
  47. Zheng, X.-W.; Schovsbo, N.-H.; Bian, L.-B.; Rudra, A.; Sanei, H. Organic Geochemical and Petrographic Characteristics of the Cambrian-Ordovician Organic-Rich Marine Shales in Scandinavia. Pet. Sci. 2023, 20, 2637–2647. [Google Scholar]
  48. Atwah, I.; Adeboye, O.O.; Zhang, J.; Wilcoxson, R.; Marcantonio, F. Linking Biomarkers with Elemental Geochemistry to Reveal Controls on Organic Richness in Devonian-Mississippian Mudrocks of Oklahoma. Palaeogeogr. Palaeoclimatol. Palaeoecol. 2023, 611, 111355. [Google Scholar]
  49. Teng, J.; Mastalerz, M.; Liu, B. Petrographic and Chemical Structure Characteristics of Amorphous Organic Matter in Marine Black Shales: Insights from Pennsylvanian and Devonian Black Shales in the Illinois Basin. Int. J. Coal Geol. 2021, 235, 103676. [Google Scholar]
  50. Wu, Z.; Grohmann, S.; Littke, R. Geochemistry and Petrology of Early Permian Lacustrine Shales in the Lodève Basin, Southern France: Depositional History, Organic Matter Accumulation and Thermal Maturity. Int. J. Coal Geol. 2024, 284, 104469. [Google Scholar]
  51. Wei, S.; Hu, M.; He, S.; Shu, Y.; Dong, T.; He, Q.; Yang, W.; Cai, Q. Effects of Quartz Precipitation on the Abundance and Preservation of Organic Matter Pores in Cambrian Marine Shale in South China. JMSE 2023, 11, 1267. [Google Scholar]
  52. Zhang, Y.; Zuo, S.; Li, Y.; Huang, Y.; Mo, Y. Analysis on Pore Evolution and Microscopic Mechanism of Red Clay during Loss Water and Shrinkage. Chin. J. Undergr. Space Eng. 2022, 18, 1882–1890. [Google Scholar]
  53. Zhou, J.; Fan, M.; Xian, X.; Yang, K.; Lu, Z. Correction calculation of shale gas absolute adsorption capacity and its influencing factors analysis. Coal Sci. Technol. 2022, 50, 154–162. [Google Scholar]
  54. Li, A.; Ding, W.; Zhou, X.; Cao, X.; Zhang, M.; Fu, F.; Chen, E. Investigation of the Methane Adsorption Characteristics of Marine Shale: A Case Study of Lower Cambrian Qiongzhusi Shale in Eastern Yunnan Province, South China. Energy Fuels 2017, 31, 2625–2635. [Google Scholar]
  55. Tan, J.; Weniger, P.; Krooss, B.; Merkel, A.; Horsfield, B.; Zhang, J.; Boreham, C.J.; Graas, G.; Tocher, B.A. Shale gas potential of the major marine shale formations in the upper yangtze platform, south China, part II: Methane sorption capacity. Fuel 2014, 129, 204–218. [Google Scholar]
  56. Rexer, T.F.; Mathia, E.J.; Aplin, A.C.; Thomas, K.M. High-Pressure Methane Adsorption and Characterization of Pores in Posidonia Shales and Isolated Kerogens. Energy Fuels 2014, 28, 2886–2901. [Google Scholar]
Figure 1. (a) Structural geological map of study area (according to Wang Ai et al., 2022) [35]. (b) Composite stratigraphic column of Lianggaoshan Formation (Jurassic) from Well YY3 in study area.
Processes 13 01061 g001
Figure 2. Organic maceral components and vitrinite reflectance.
Processes 13 01061 g002
Figure 3. Composition and types of clay minerals.
Processes 13 01061 g003
Figure 4. (a) Correlation between TOC and clay mineral content; (b) correlation between TOC and quartz content.
Processes 13 01061 g004
Figure 5. Organic matter and pore types in Lianggaoshan Formation lacustrine shale of Well YY3. (a) Edge fractures of organic matter, 3563.65 m; (b) bending deformation of organic matter, 3527.36 m; (c) irregular organic pores and bubble-like organic pores, 3580.69 m; (d) honeycomb-shaped organic pores, 3529.20 m.
Processes 13 01061 g005
Figure 6. Clay mineral-related features in Lianggaoshan Formation lacustrine shale of Well YY3. (a) Reticular illite intercrystalline pores, 3565.10 m; (b) triangular illite intercrystalline pores, 3565.10 m; (c) illite–smectite mixed layers, 3581.45 m; (d) rosette-shaped chlorite, 3563.65 m; (e) kaolinite aggregates, 3609.25 m; (f) book-like kaolinite with clay mineral-related interlayer, interparticle and shrinkage fractures, as well as microfractures, 3566.40 m.
Processes 13 01061 g006
Figure 7. Dissolution pores and pyrite intercrystalline pores in Lianggaoshan Formation lacustrine shale of Well YY3. (a) Carbonate dissolution pores, 3583.15 m; (b) feldspar dissolution pores, 3565.10 m; (c) intercrystalline pores of framboidal pyrite, 3569.51 m; (d) pyrite intercrystalline pores, 3581.45 m.
Processes 13 01061 g007
Figure 8. (a) Microfractures developed at clay mineral boundaries, Well YY3, 3518.26 m; (b) shale bedding fractures in black shale after water absorption, Well YY3, 3562.52 m.
Processes 13 01061 g008
Figure 9. (a) Methane excess adsorption data and fitting curve (358.15 K); (b) methane absolute adsorption curve (358.15 K).
Processes 13 01061 g009
Figure 10. Correlation between inorganic mineral content and maximum adsorption capacity. (a) Correlation with clay mineral content; (b) correlation with quartz content; (c) correlation with feldspar content; (d) correlation with carbonate content; (e) correlation with illite/smectite mixed-layer (I/S) content; (f) correlation with illite content.
Processes 13 01061 g010
Figure 11. (a) Correlation between TOC and maximum adsorption capacity; (b) correlation between TOC and porosity.
Processes 13 01061 g011
Table 1. TOC and mineral composition of samples.
Sample IDTOC
(%)
Mineral Composition (%)
QuartzFeldsparCalciteDolomitePyriteSideriteClay Minerals
YY3-0050.2335.304.400.200.500.400.8055.40
YY3-0100.1050.2025.303.400.600.100.2019.40
YY3-0121.2028.003.002.800.703.303.1057.60
YY3-0140.7133.7022.400.200.000.300.3042.20
YY3-0181.6629.602.609.000.202.100.8055.00
YY3-0200.7133.504.700.901.001.801.0056.20
YY3-0232.4534.103.301.500.504.201.8053.60
YY3-0300.8342.8010.201.800.100.601.0042.60
YY3-0350.6640.804.904.500.600.100.4048.00
YY3-0361.9231.903.700.400.101.100.9060.90
YY3-0392.1831.102.503.700.100.301.7056.70
YY3-0460.5935.505.900.101.500.200.8055.00
YY3-0560.7730.503.500.500.200.301.0060.50
YY3-0610.8140.0017.900.500.600.201.0039.00
YY3-0710.5236.105.700.201.000.201.1053.30
YY3-0750.4632.604.200.200.100.200.5059.30
YY3-0801.8733.704.700.200.101.201.6057.00
YY3-0812.0935.304.908.000.402.601.5046.30
YY3-0841.7829.804.100.200.102.601.4057.90
YY3-0892.3336.404.900.400.102.001.2051.20
YY3-0932.3228.202.700.301.301.600.3061.50
YY3-0990.3634.307.201.000.100.100.6054.50
YY3-1060.4741.309.800.601.800.301.0044.00
YY3-1122.1827.903.109.700.202.300.9054.60
YY3-1152.2232.703.300.201.100.401.0060.40
YY3-1181.3540.804.507.800.100.700.5044.60
YY3-1210.7834.402.700.600.201.406.5051.30
YY3-1230.2960.906.809.900.200.500.7020.50
YY3-1241.6142.303.604.800.400.800.6044.70
YY3-1281.1948.403.702.400.300.600.5041.50
Table 2. Langmuir fitting results.
Sample IDDepth (m)Langmuir Volume (m3/t)Langmuir Pressure (MPa)
YY3-0233518.262.1821.08
YY3-0393529.22.0918.68
YY3-0563541.423.5927.95
YY3-0803561.72.7217.72
YY3-0893566.42.7221.44
YY3-1123583.152.4616.03
Disclaimer/Publisher’s Note: The statements, opinions and data contained in all publications are solely those of the individual author(s) and contributor(s) and not of MDPI and/or the editor(s). MDPI and/or the editor(s) disclaim responsibility for any injury to people or property resulting from any ideas, methods, instructions or products referred to in the content.

