


Modelling the Permeabilities of Dry Filament Wound Cylindrical Reinforcements for RTM Simulation

Abstract

1. Introduction
2. Theory
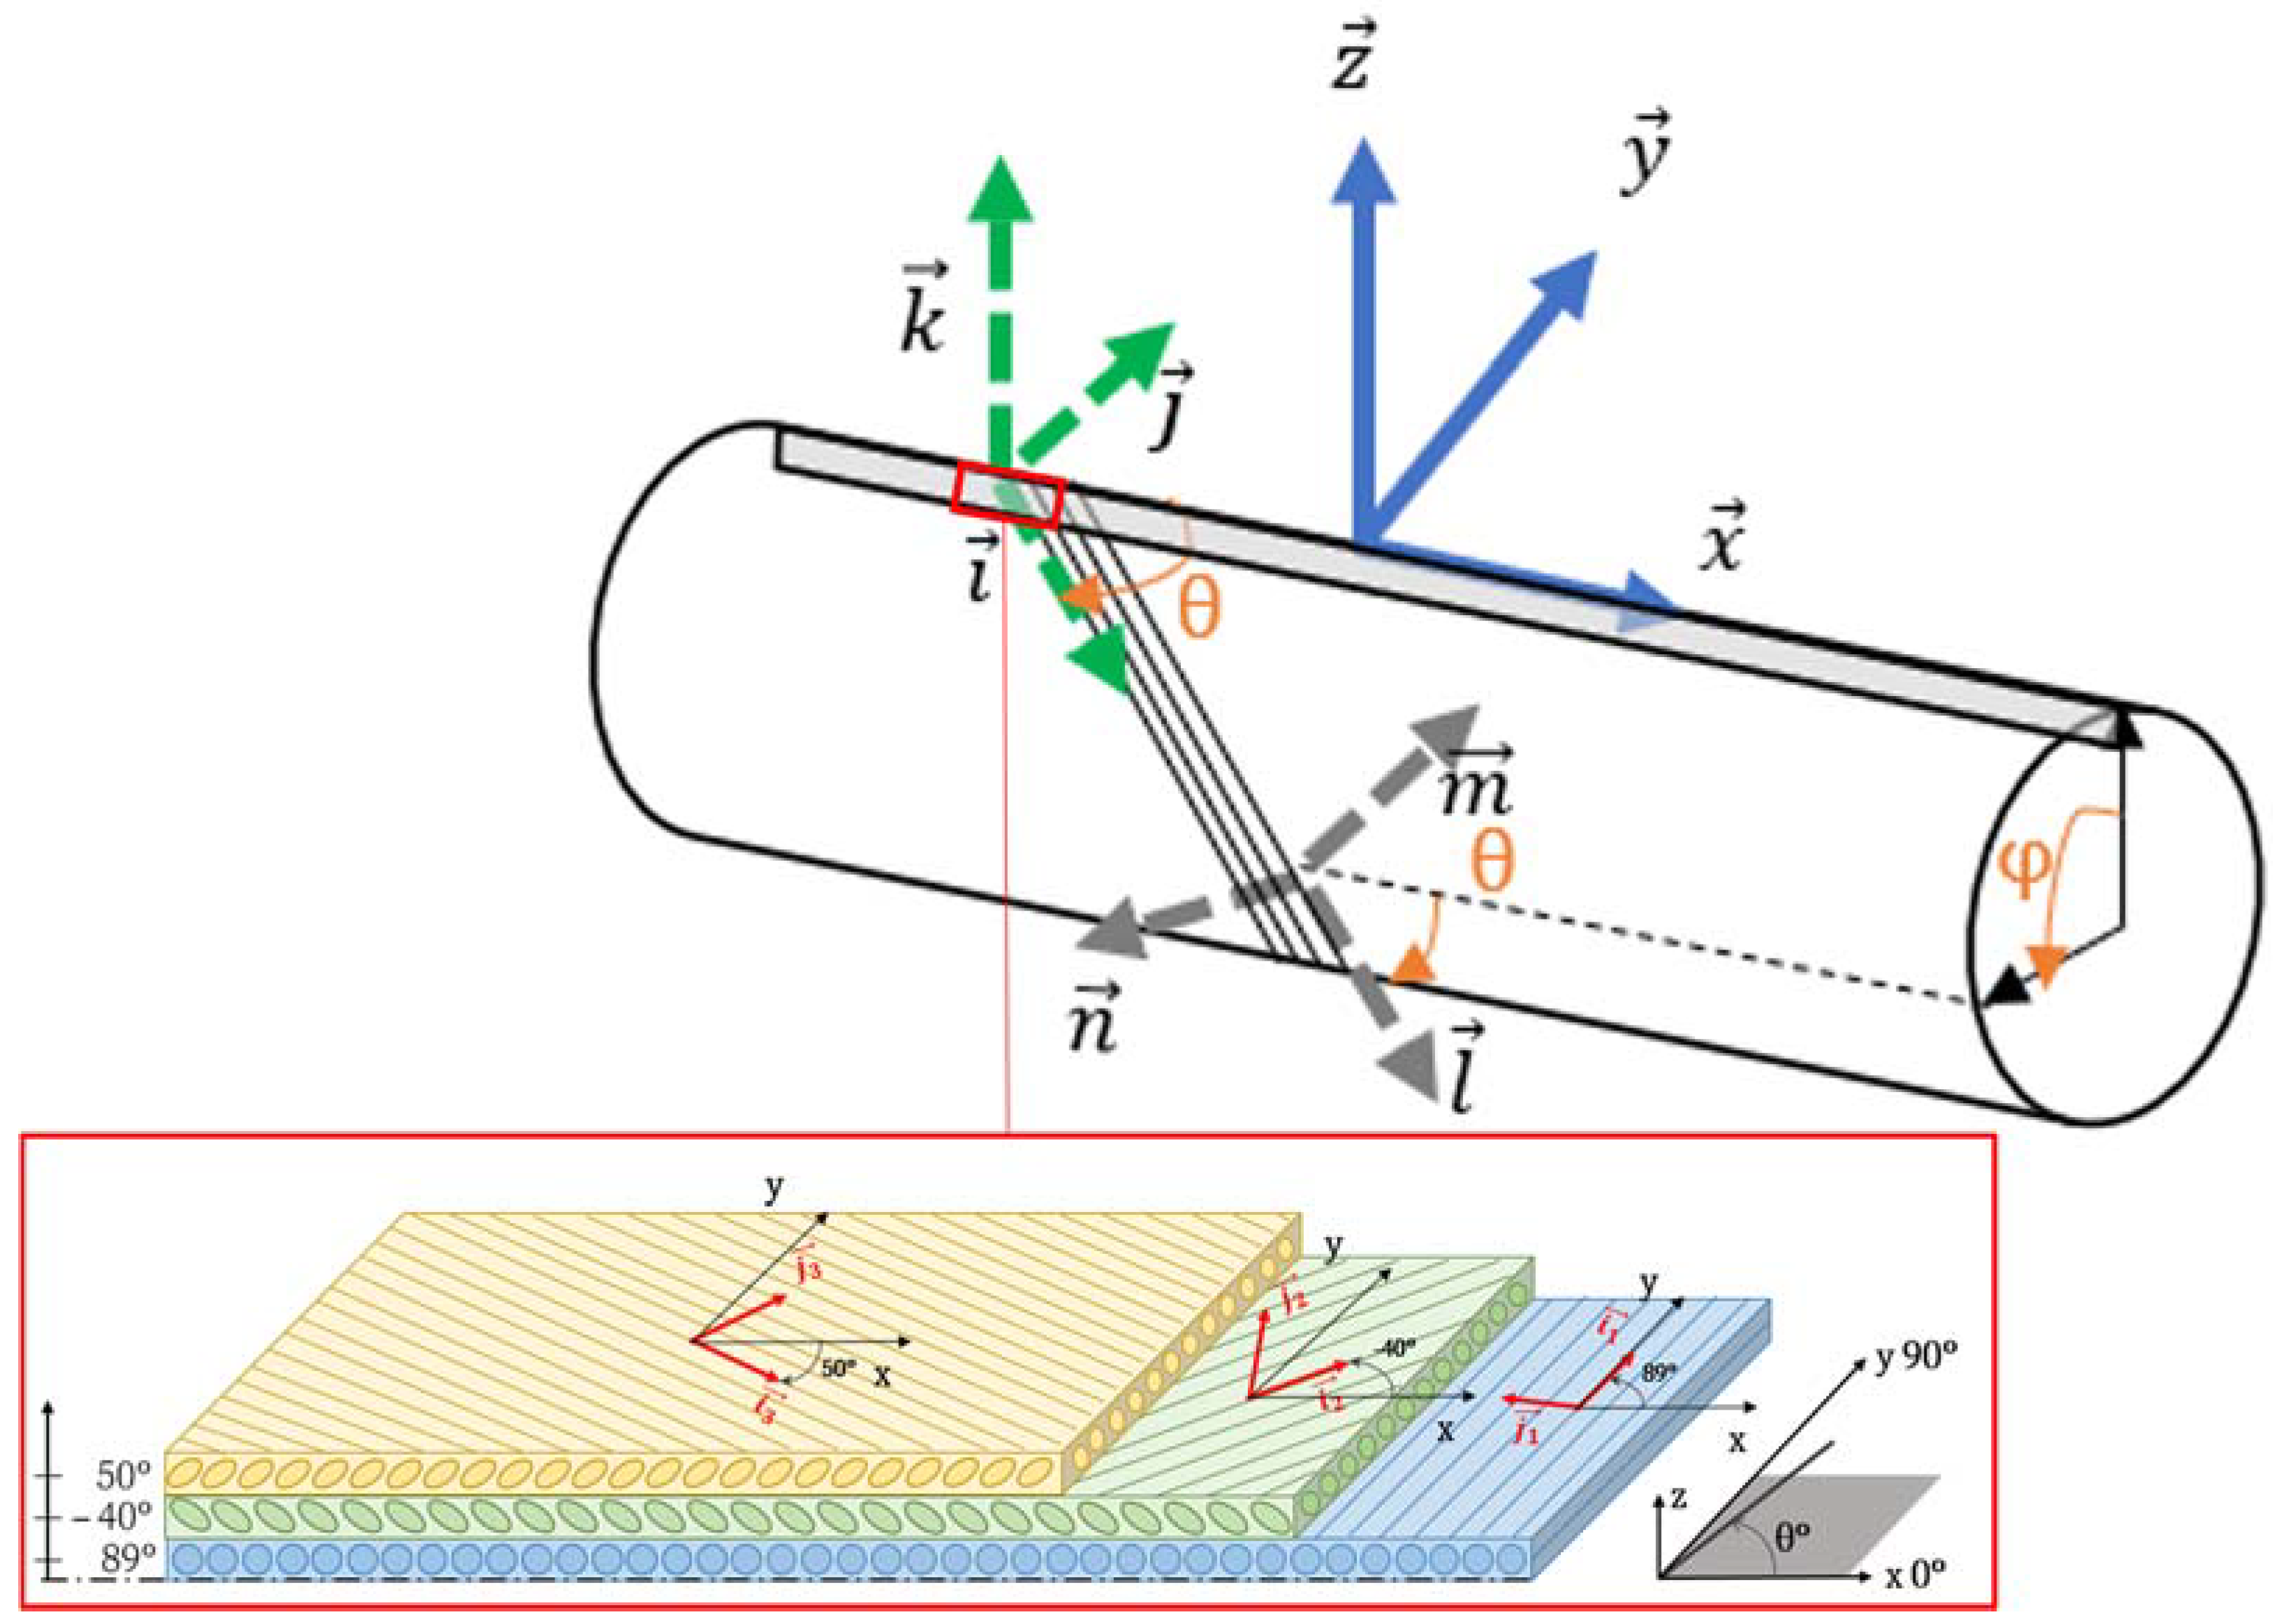
2.1. General Sketch
- () corresponds to the “global” coordinate system or “geometric” coordinate system of the multidirectional stacking of a 2D-axisymmetric element;
- ) corresponds to the principal directions of a unidirectional ply of a 2D-axisymmetric element;
- corresponds to the principal directions of the multidirectional stacking of a 2D-axisymmetric element;
- θ is the “principal” angle between the principal directions ) of the multidirectional stacking of a 2D-axisymmetric element and the stacking global coordinate system . φ is the “revolution angle”, which depends on the position of the 3D element. correspond to the principal directions of the multidirectional stacking of the 3D element. The following sections describe the steps of the method used to calculate the principal permeabilities (the values and the directions ) of each 3D element of the dry preform.
2.2. Calculation of the Principal Permeability Tensor of a UD Ply as a Function of the Fibre Volume Fraction and Based on Experimental Measurements
2.3. Calculation of the Permeability Tensor of an Orientated UD Ply (Winding Angle) in the Global Coordinate System
2.4. Homogenization of the Permeability Tensor of a Multidirectional Stacking in the Stacking Global Coordinate System
2.5. Calculation of the Principal Permeabilities of the Multidirectional Stacking of Each 2D-Axisymmetric Section
2.6. Rotational Transformations of the Geometric Global Coordinate System for Each Element
- Rotation around by φ: one rotation around the revolution axis of the part. The “revolution angle” φ depends on the position of the 3D element and is calculated by means of a scalar product using the position of each 3D tetra element (barycenter) and the position of the section of the 2D axisymmetric model from which it has been generated by spinning the model;
- Rotation around by θ: the “stacking principal angle” between the principal directions of the stacking and the stacking global coordinate system is calculated by means of a scalar product between these two coordinate systems.
3. Materials and Methods
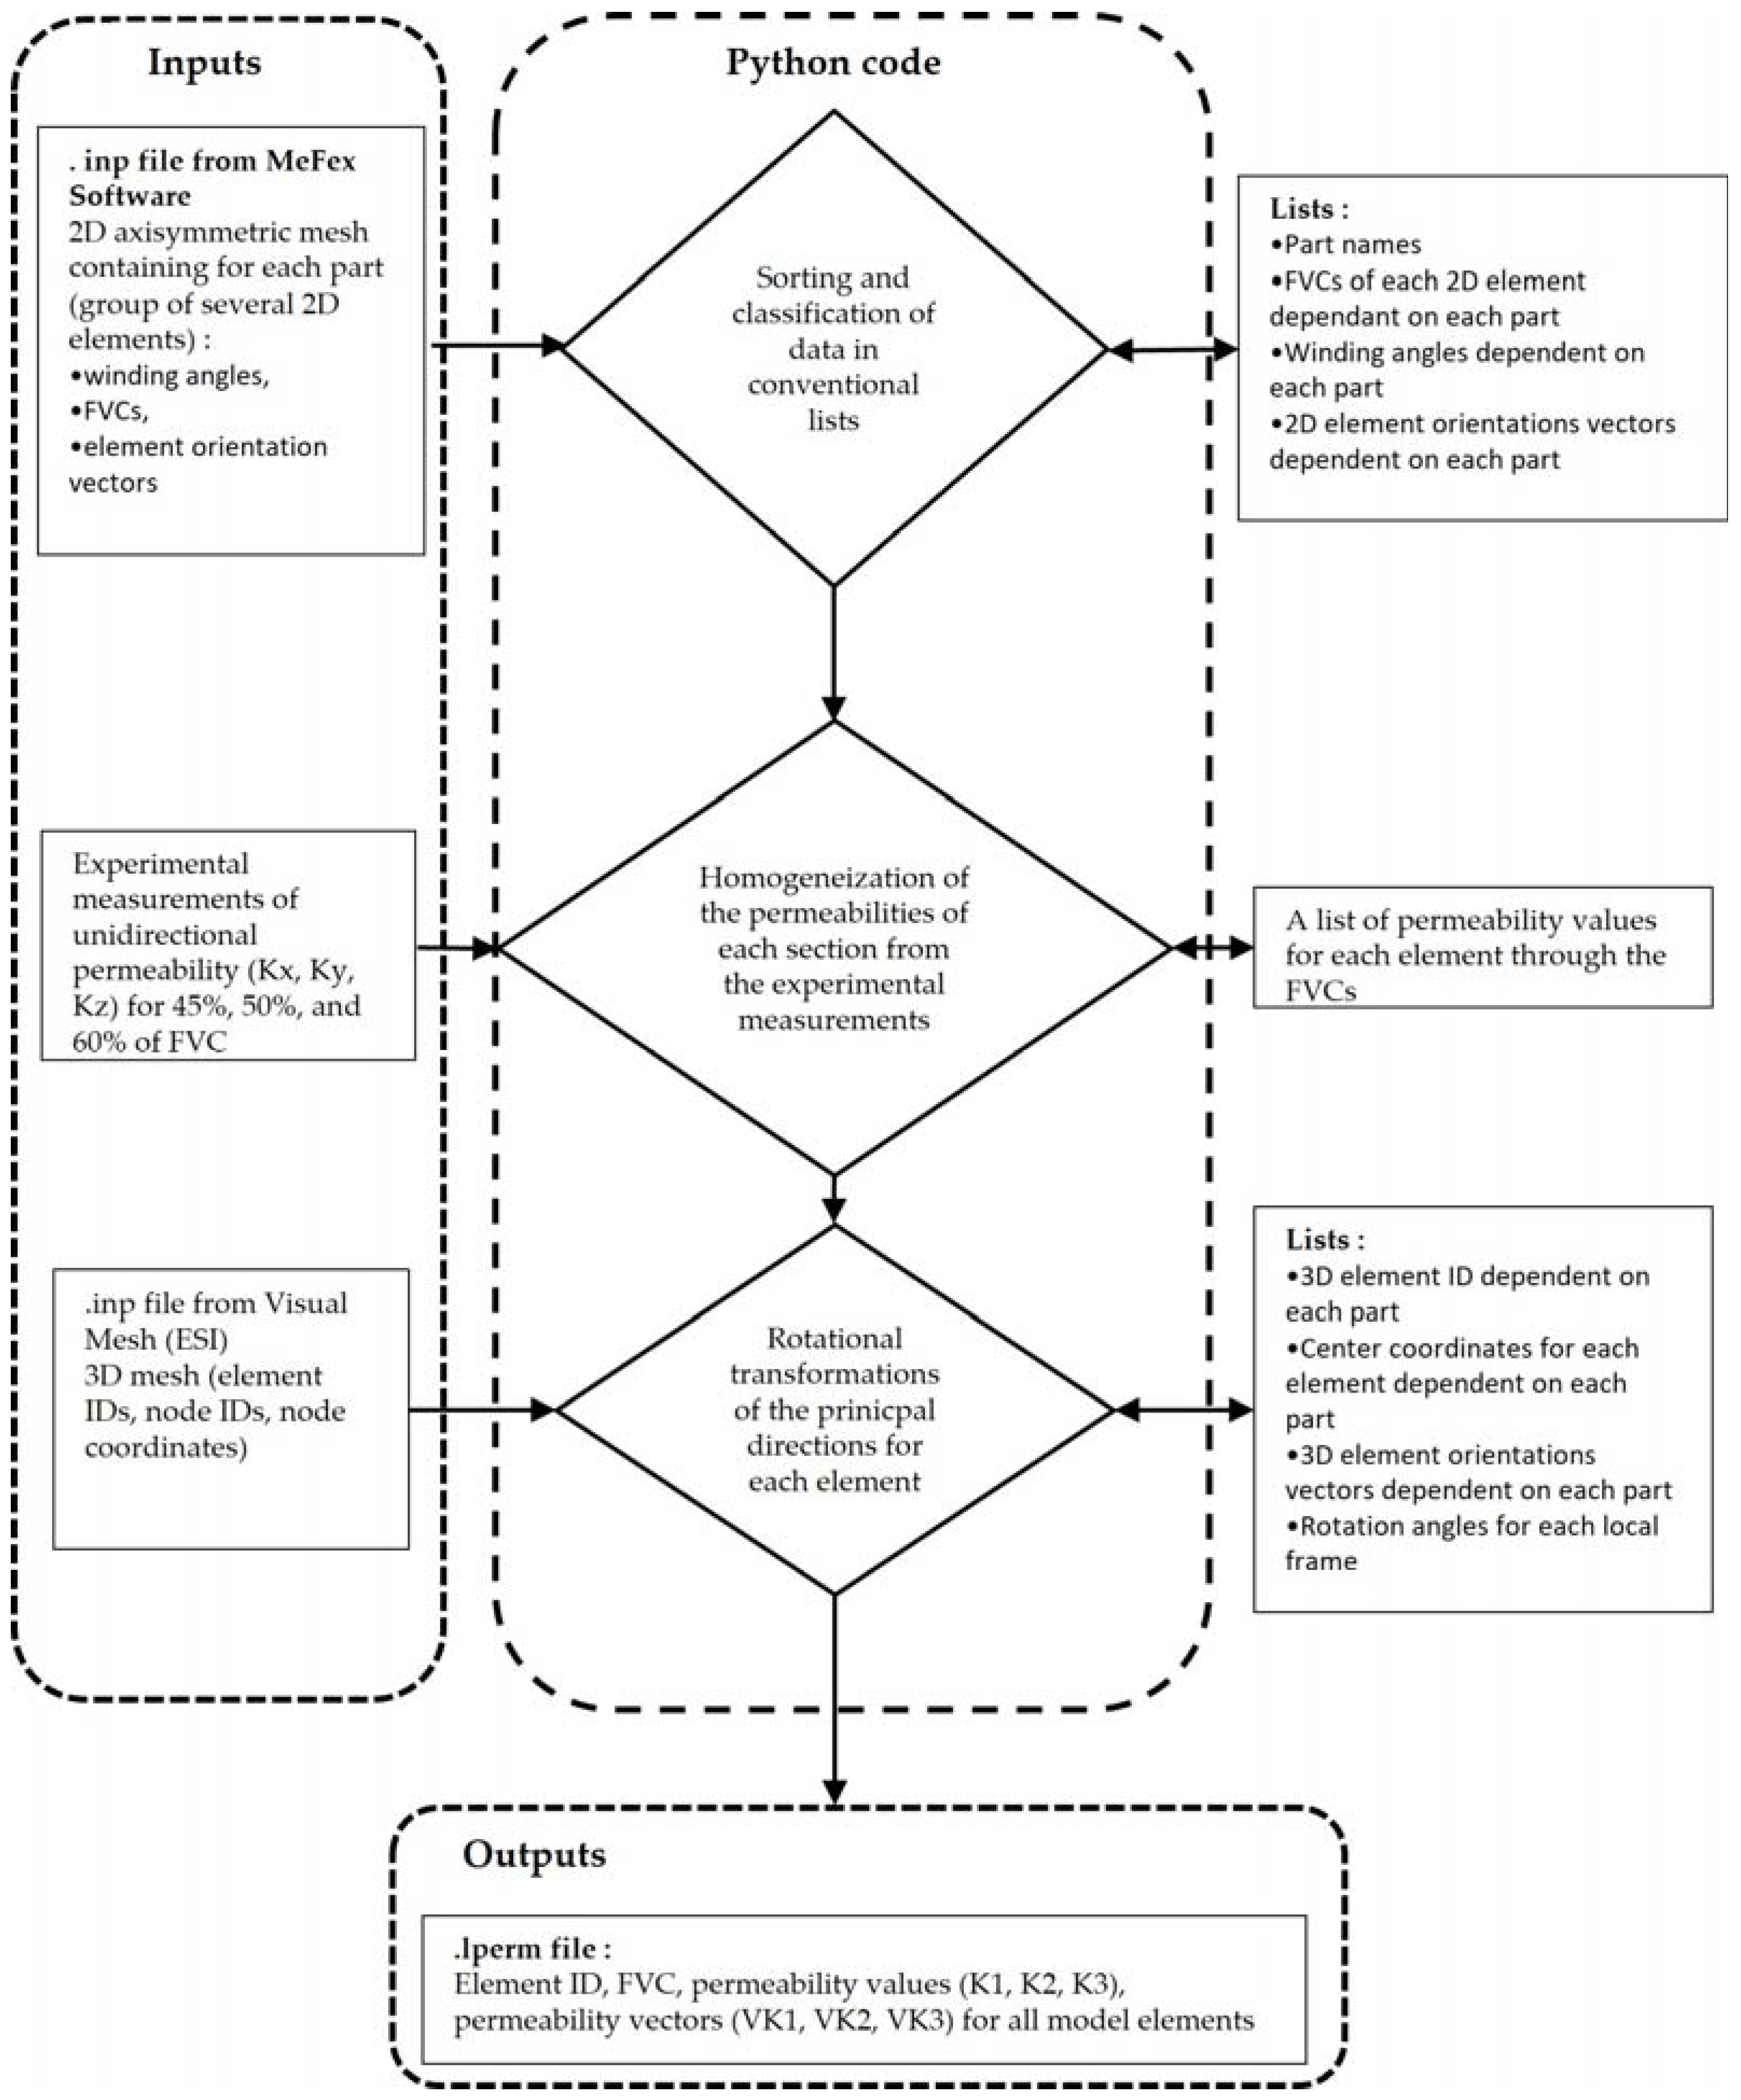
3.1. General Workflow
3.2. Importation of the .inp File Data, the Experimental Permeability Measurements, and the 3D Mesh File
3.3. Reading and Sorting the .inp File Data into a List for Each 2D Section
3.4. Homogenization-Diagonalization of the Permeability of the Stacking of Each Part, and Rotational Transformations of the Principal Directions for Each 3D Element
3.5. Writing of the .Iperm File
3.6. Experimental Measurement of the Principal Values and Directions of Permeabilities for UD Stacking and Multidirectional Stackings
- [] at 45%, 50%, and 60% of FVC, for use as input for the model;
- [] at 45%, 50%, and 60% of FVC, to see the impact of an interface involving a change in winding angle;
- at 45% and 60% of FVC, to see the impact of several interfaces involving a change in winding angle;
- [90; 80; −80; 72; −72; 65; −65; 60; −60; 56; −56] at 60% of FVC, to see the effect of the circumferential layer and to compare the results with the homogenization model;
4. Results
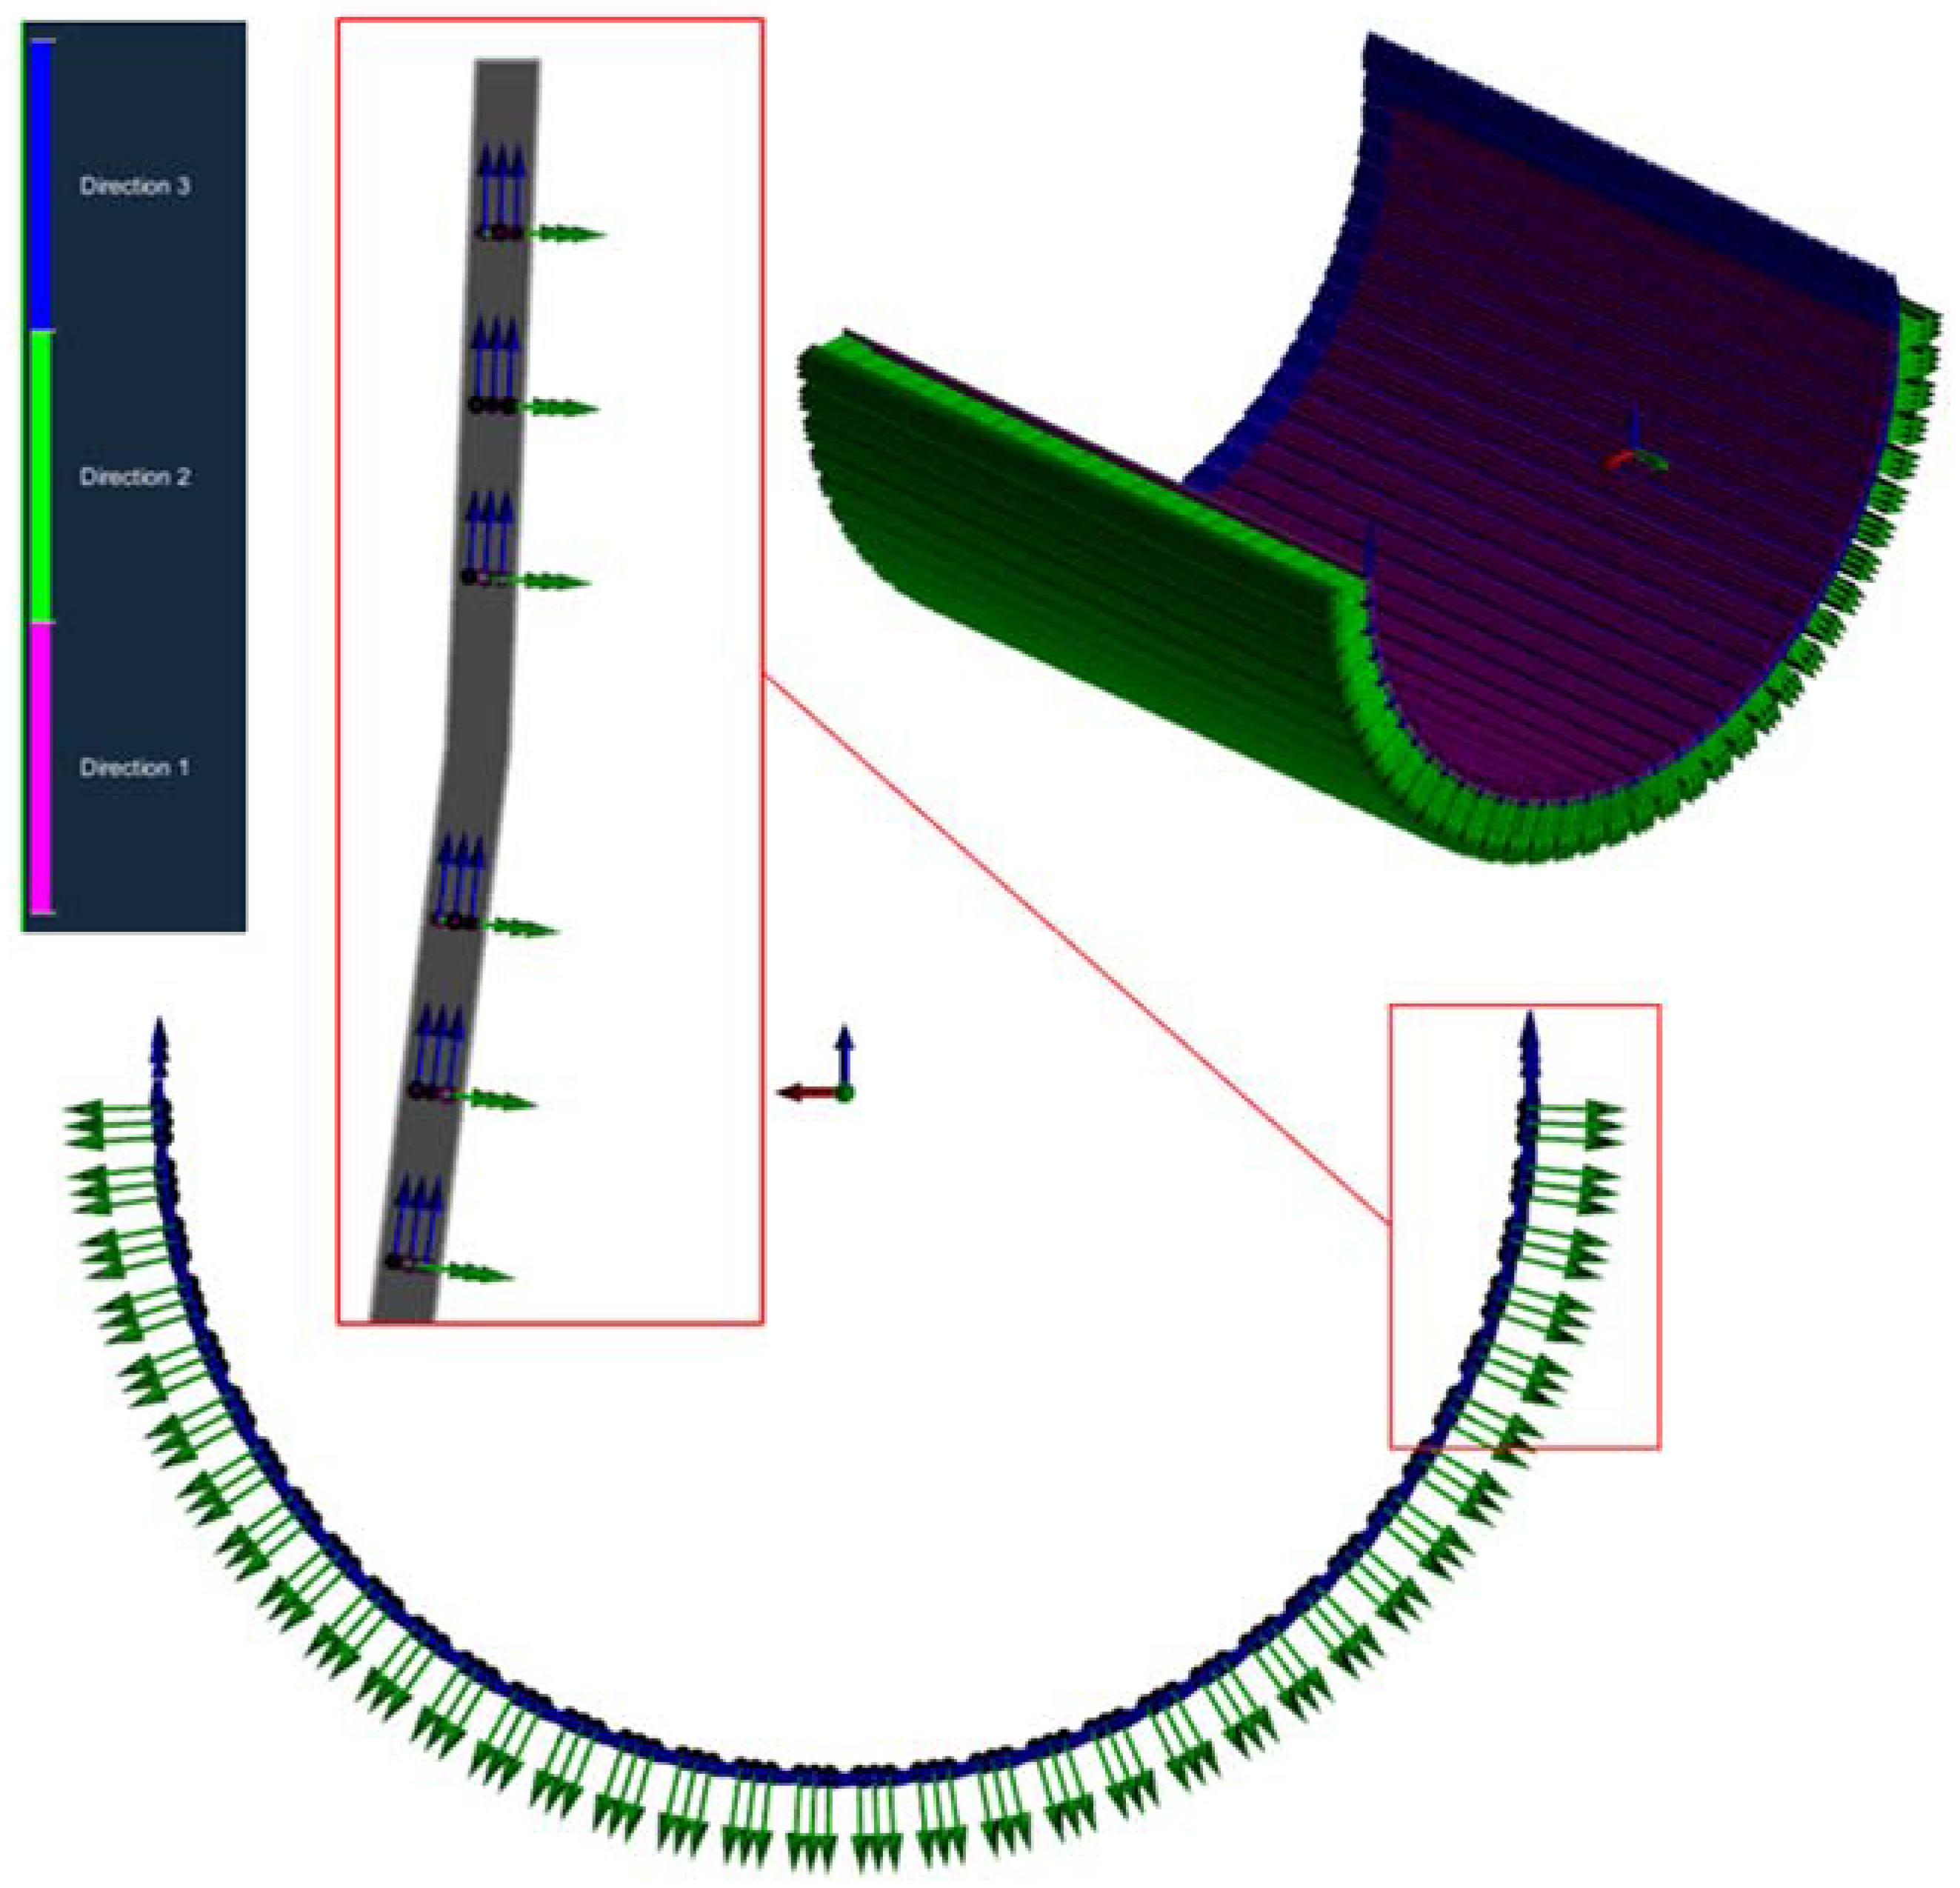
4.1. Visualization of the Computed Permeabilities Principal Directions
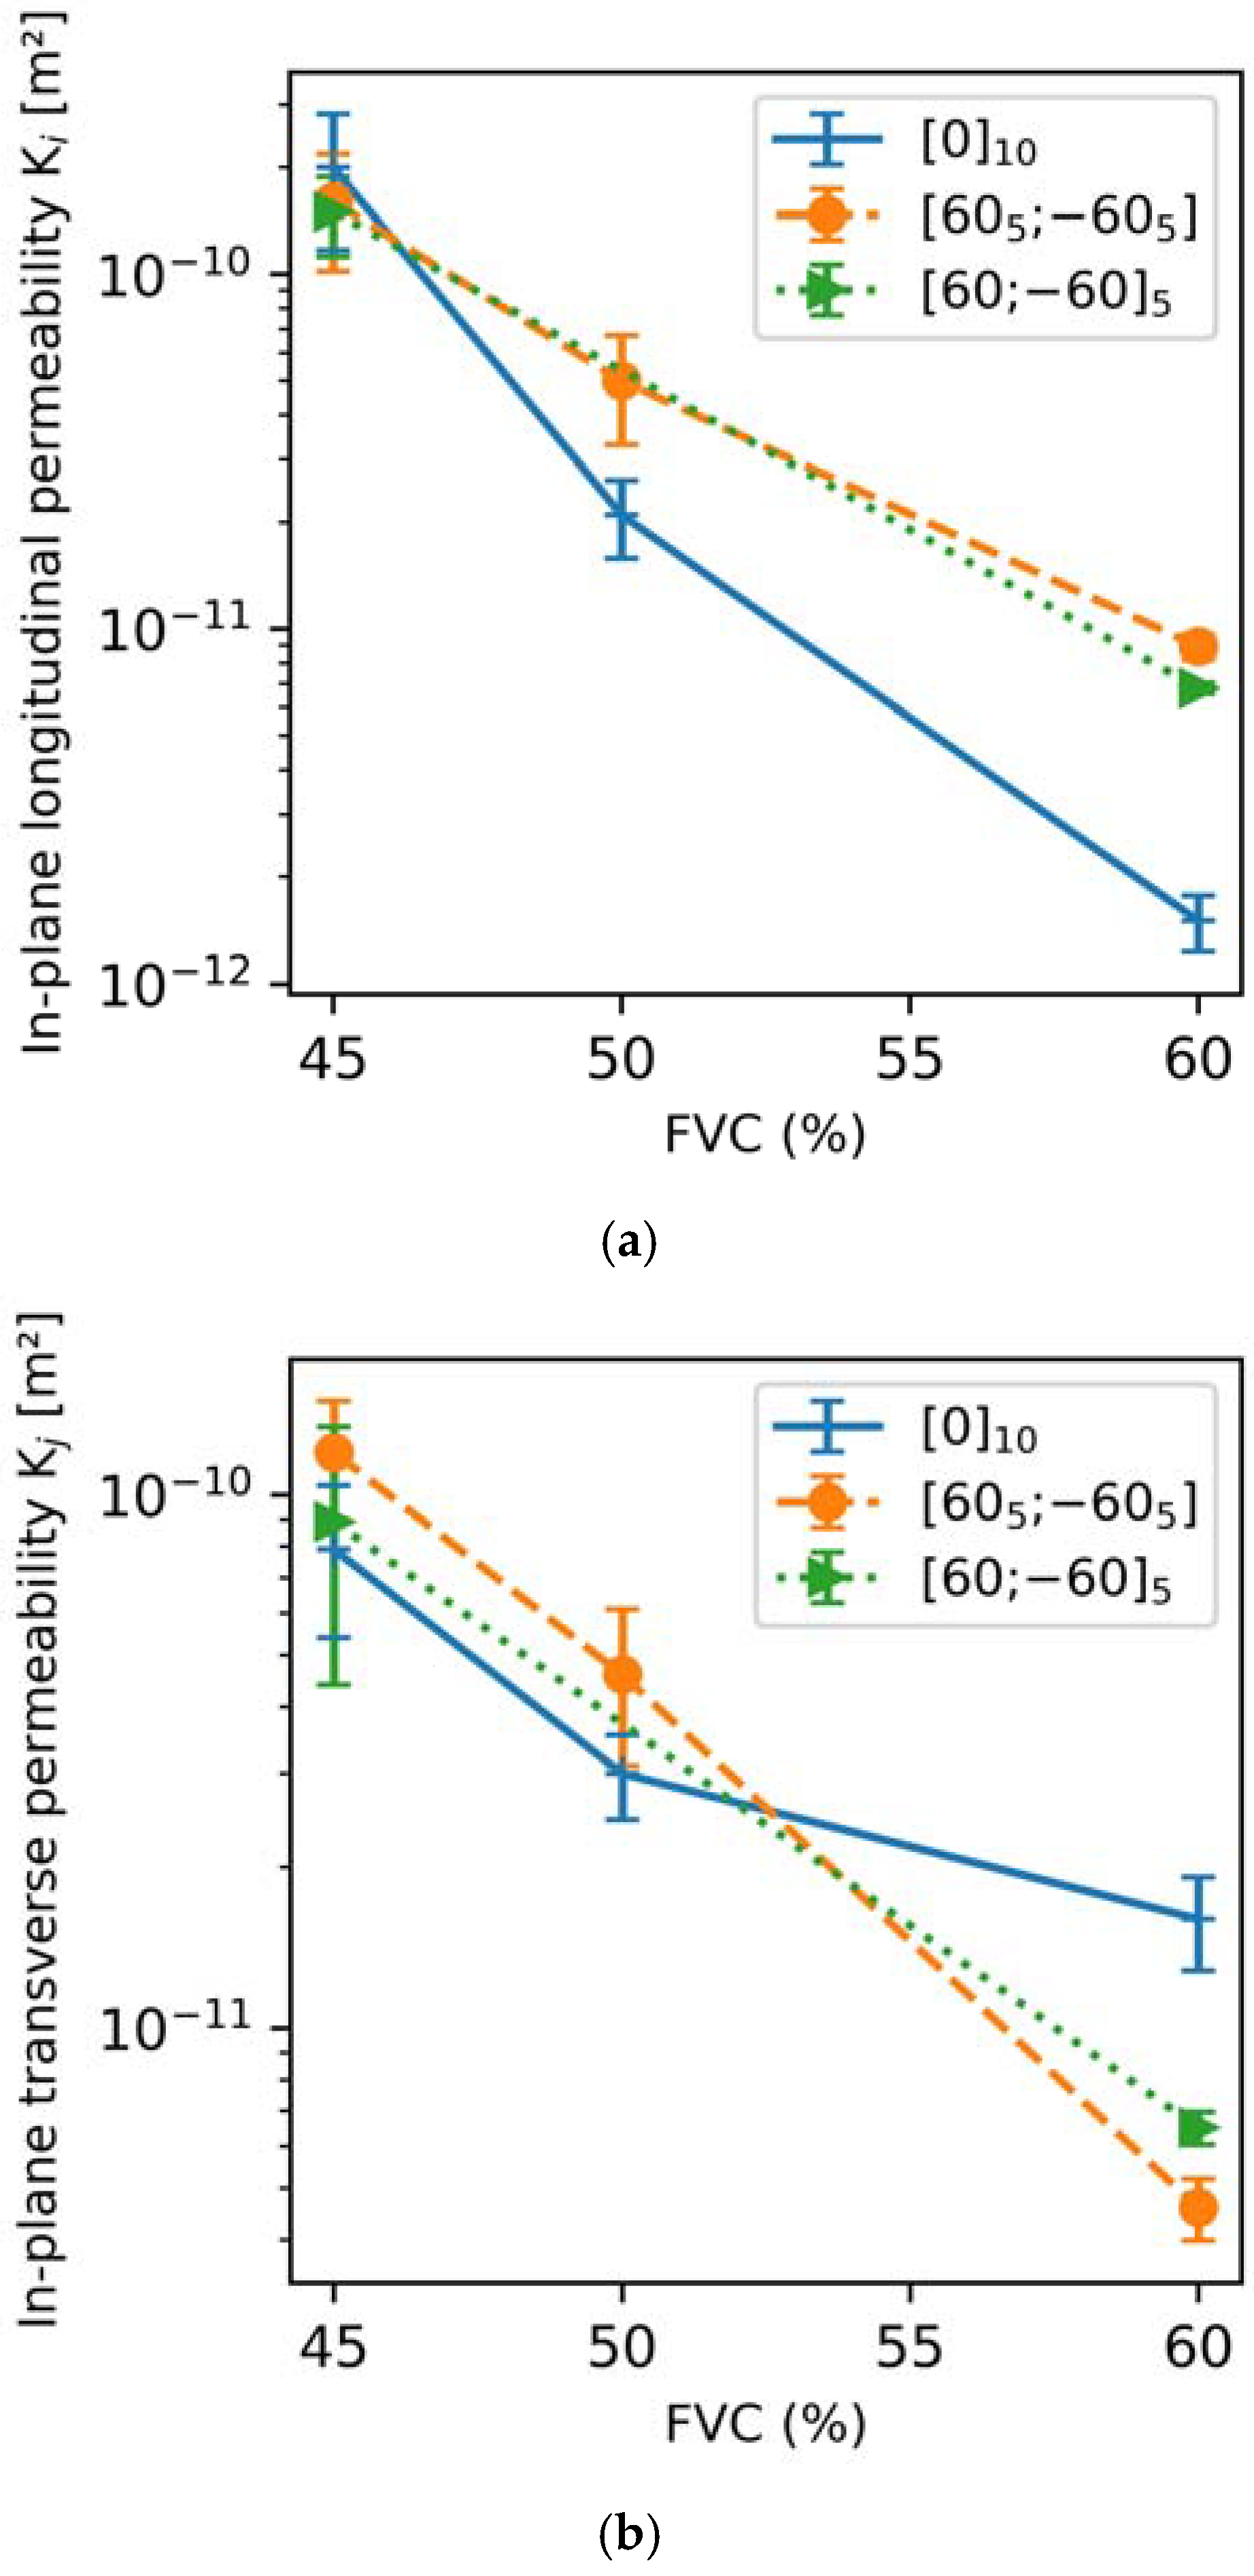
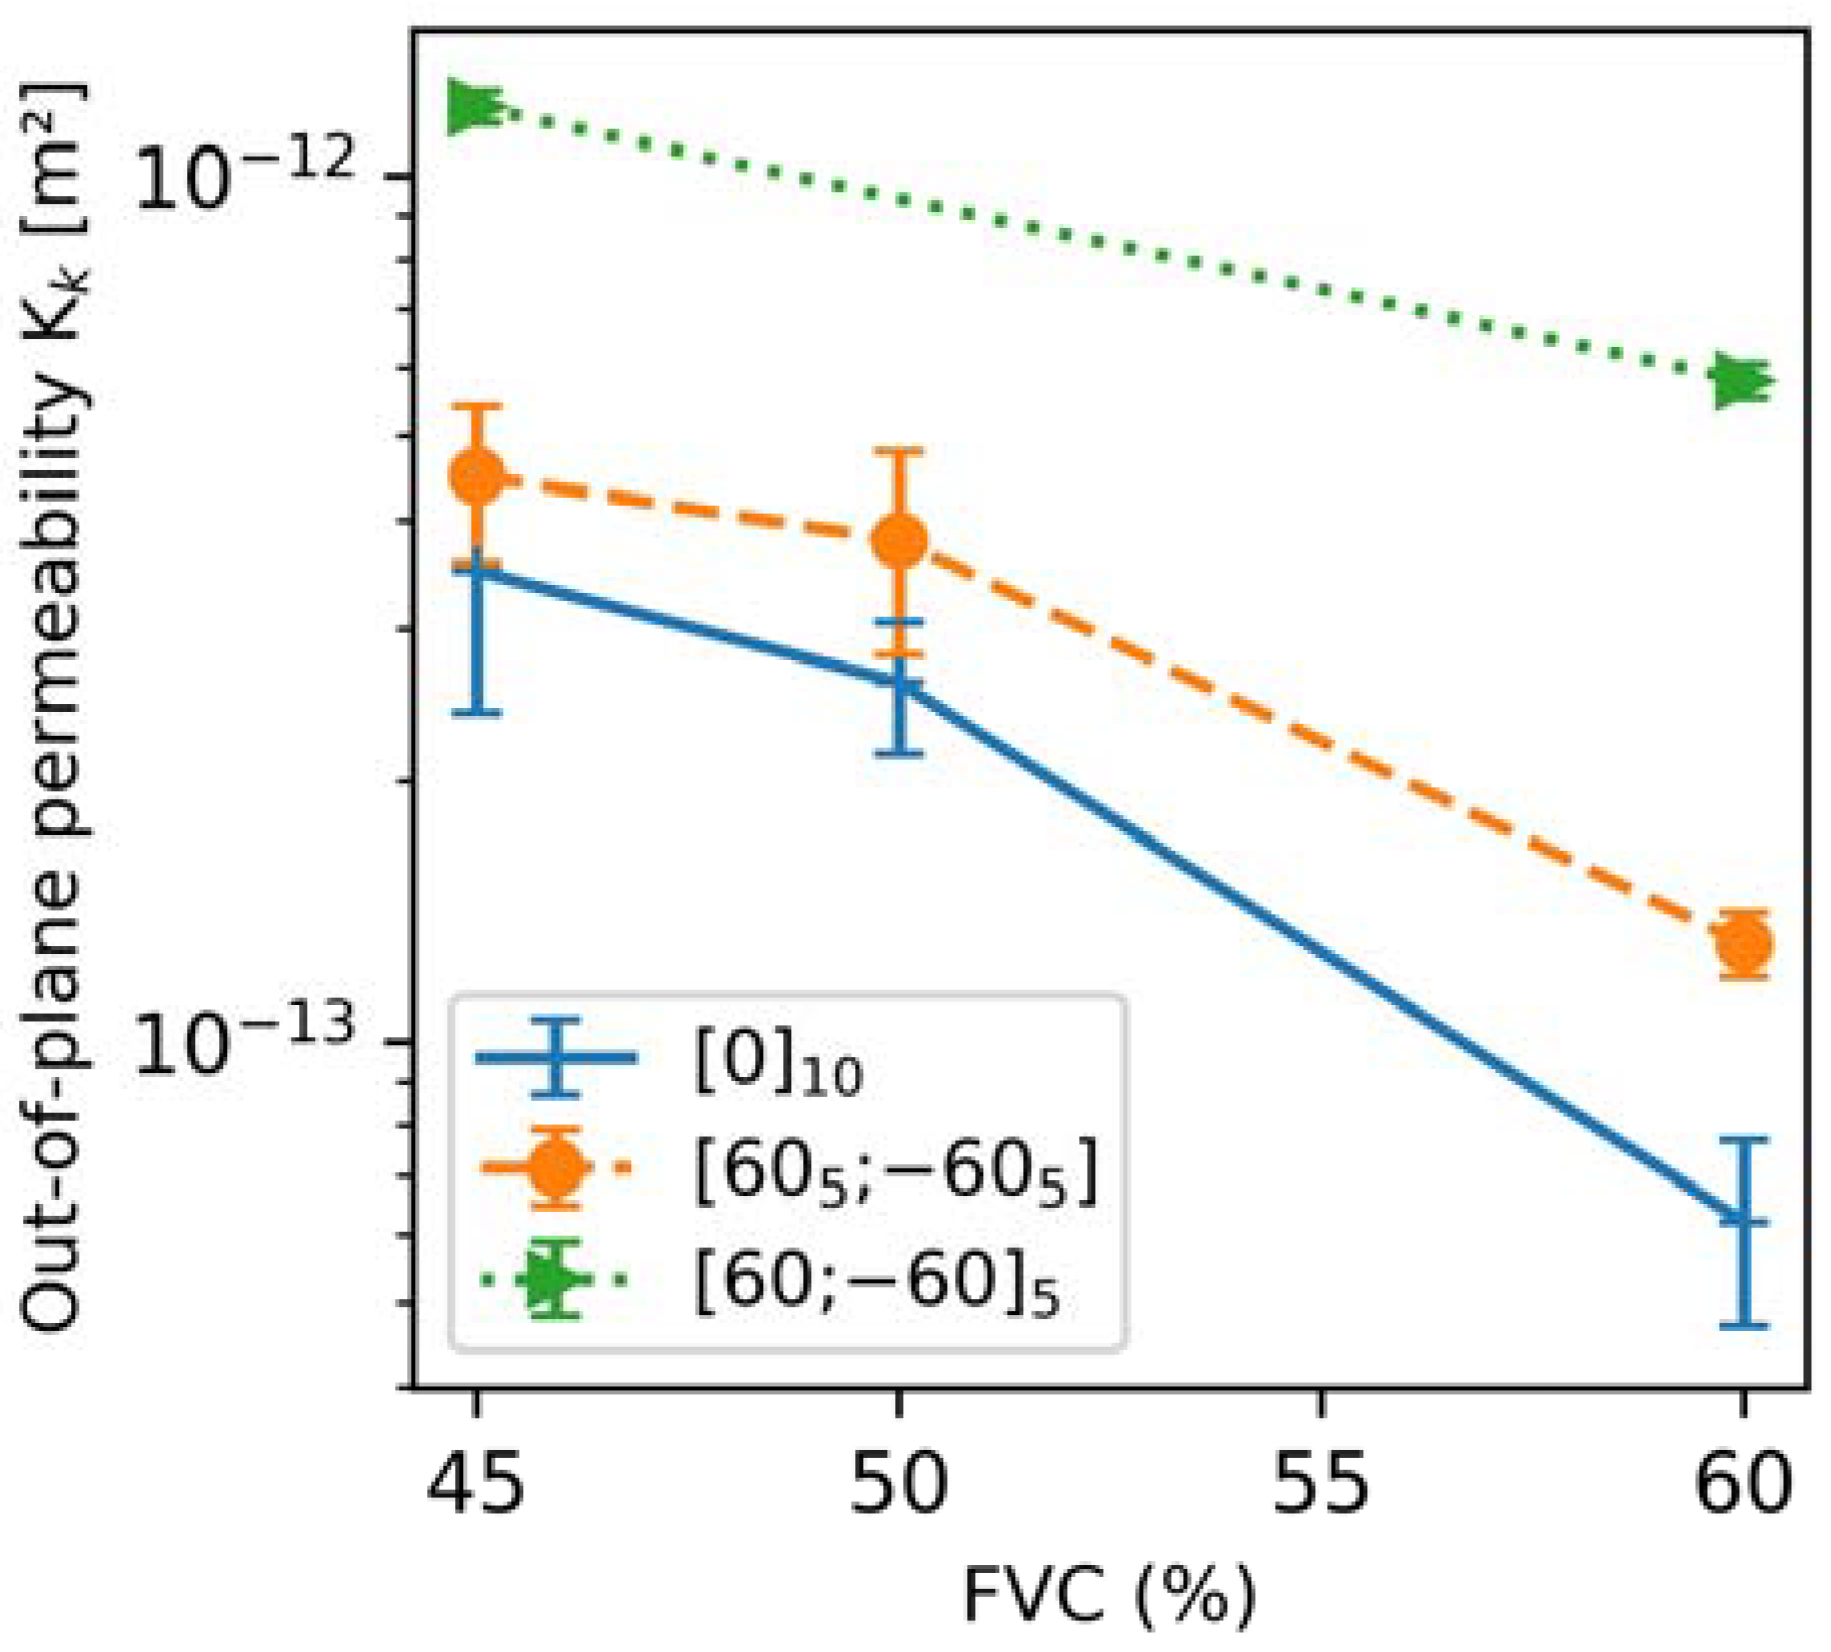
4.2. Experimental Measurements of the Principal Permeabilities of the Stackings
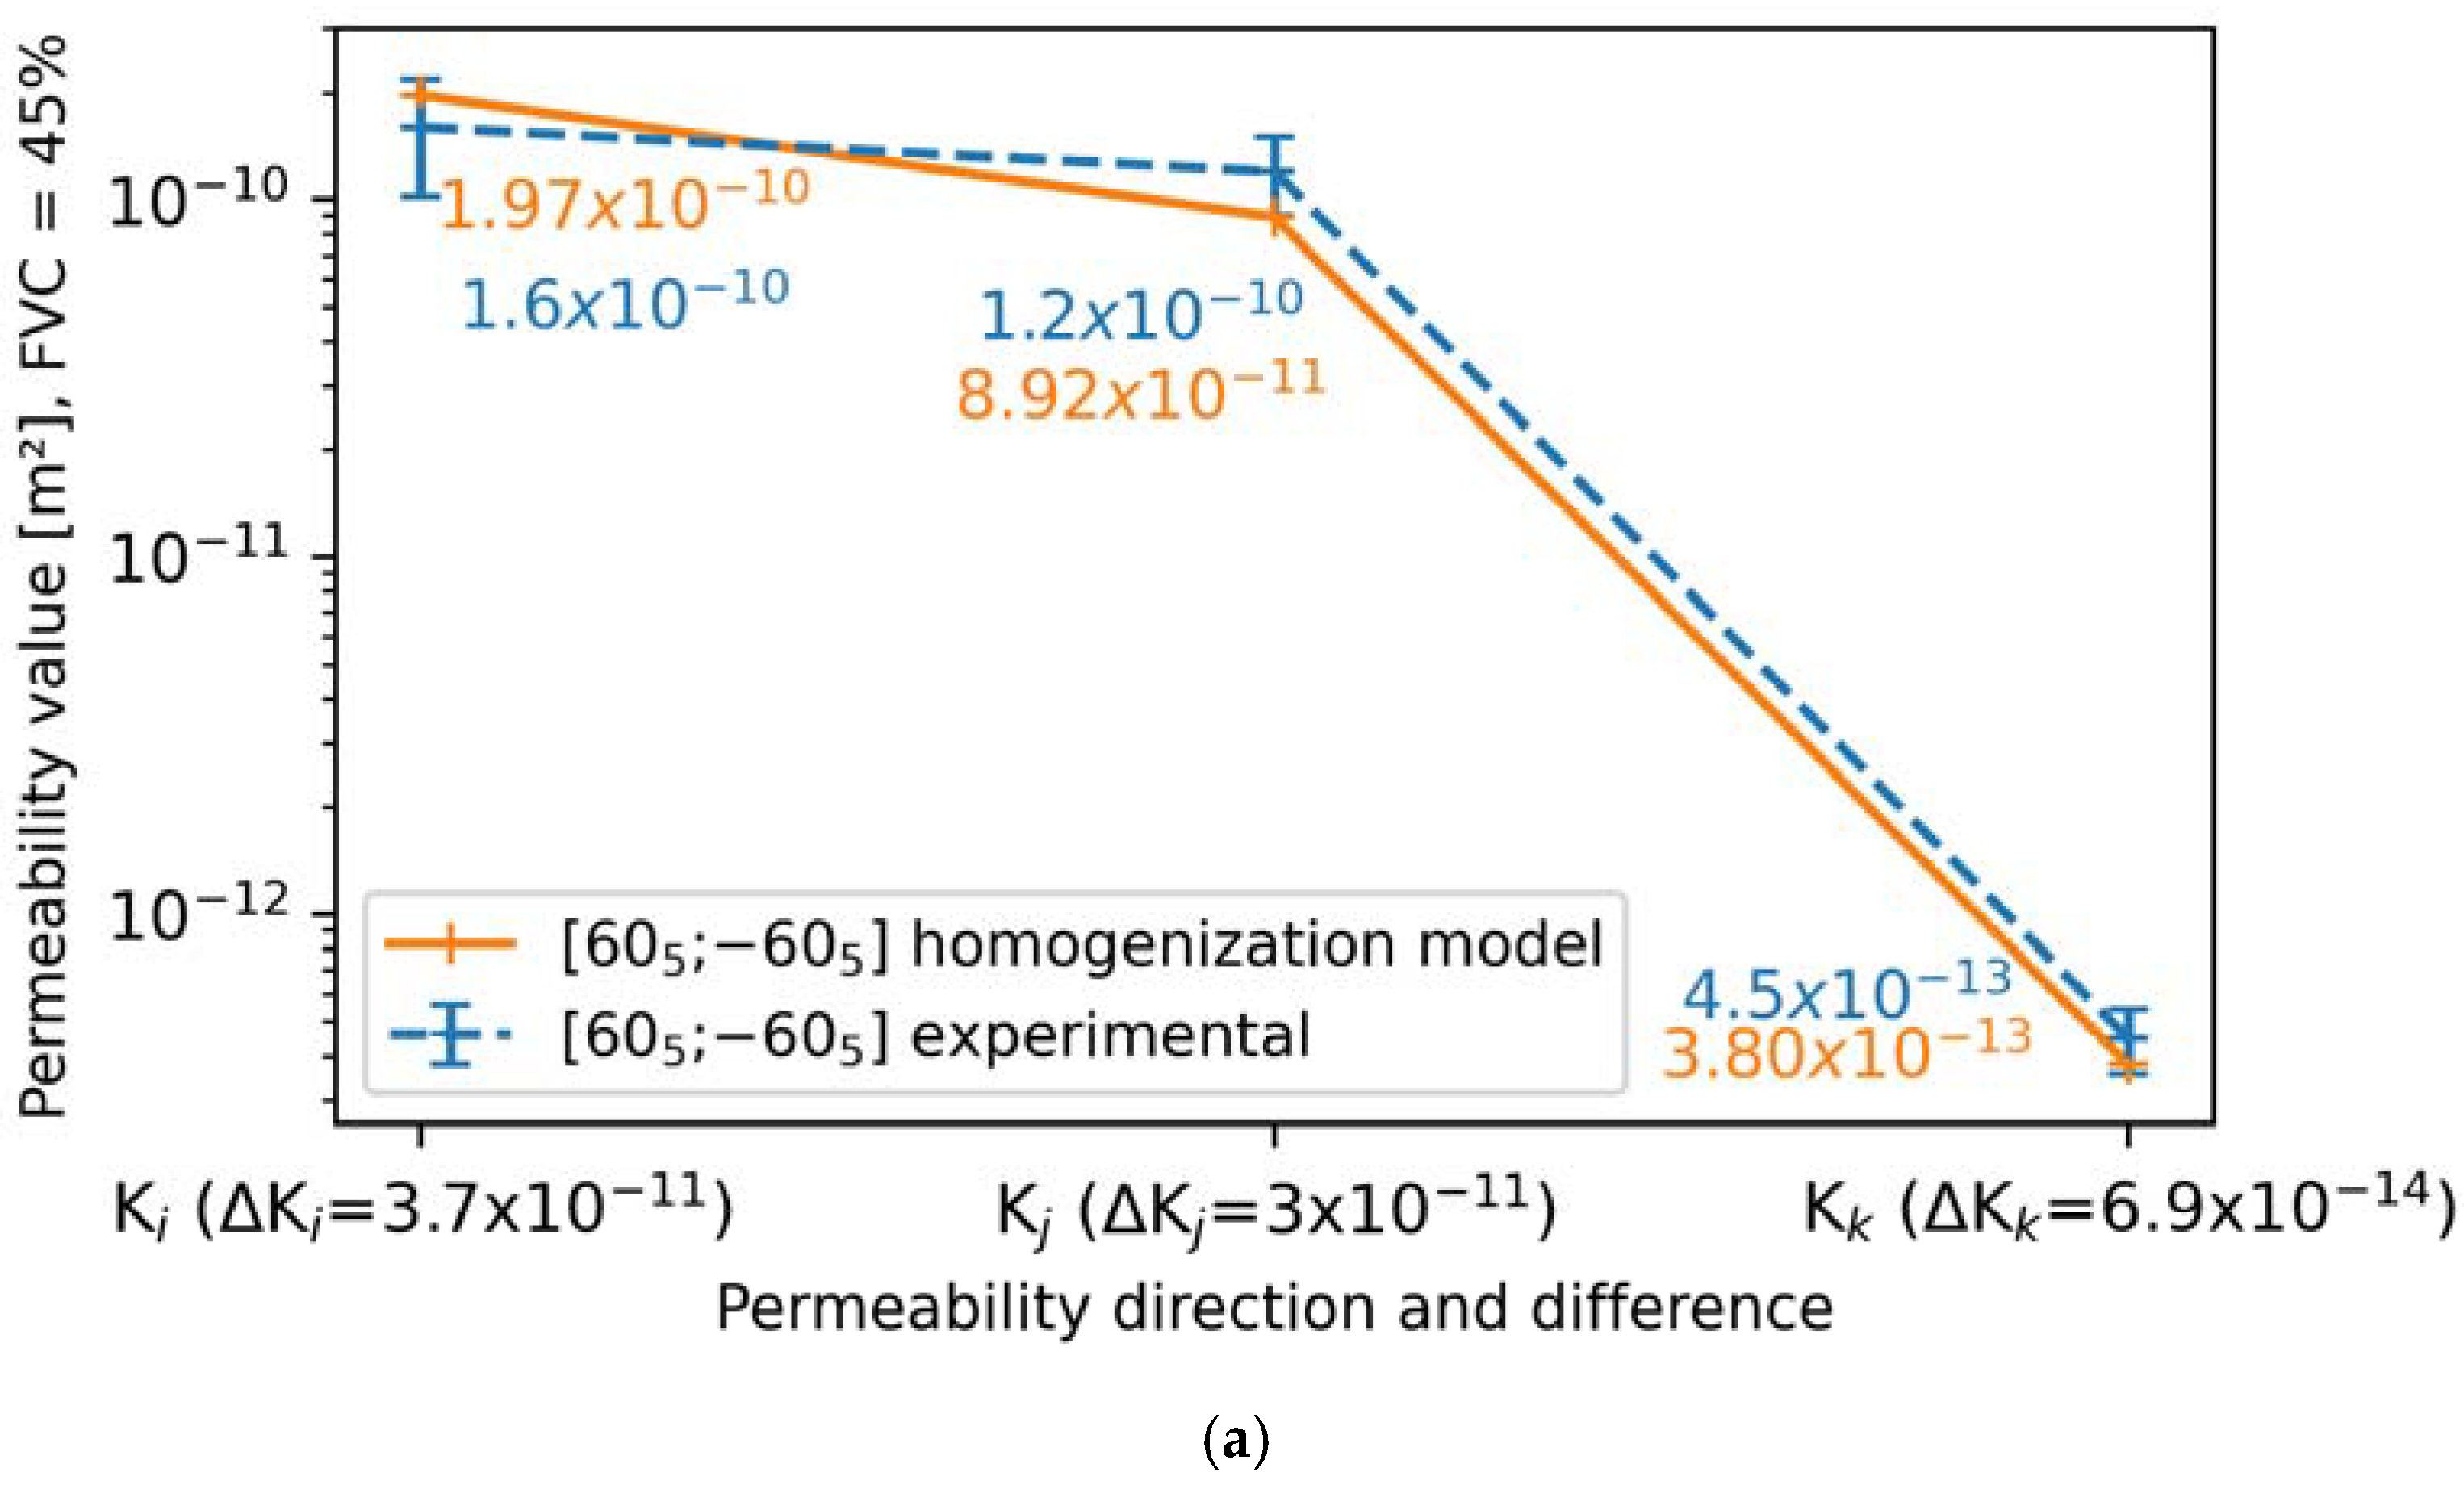
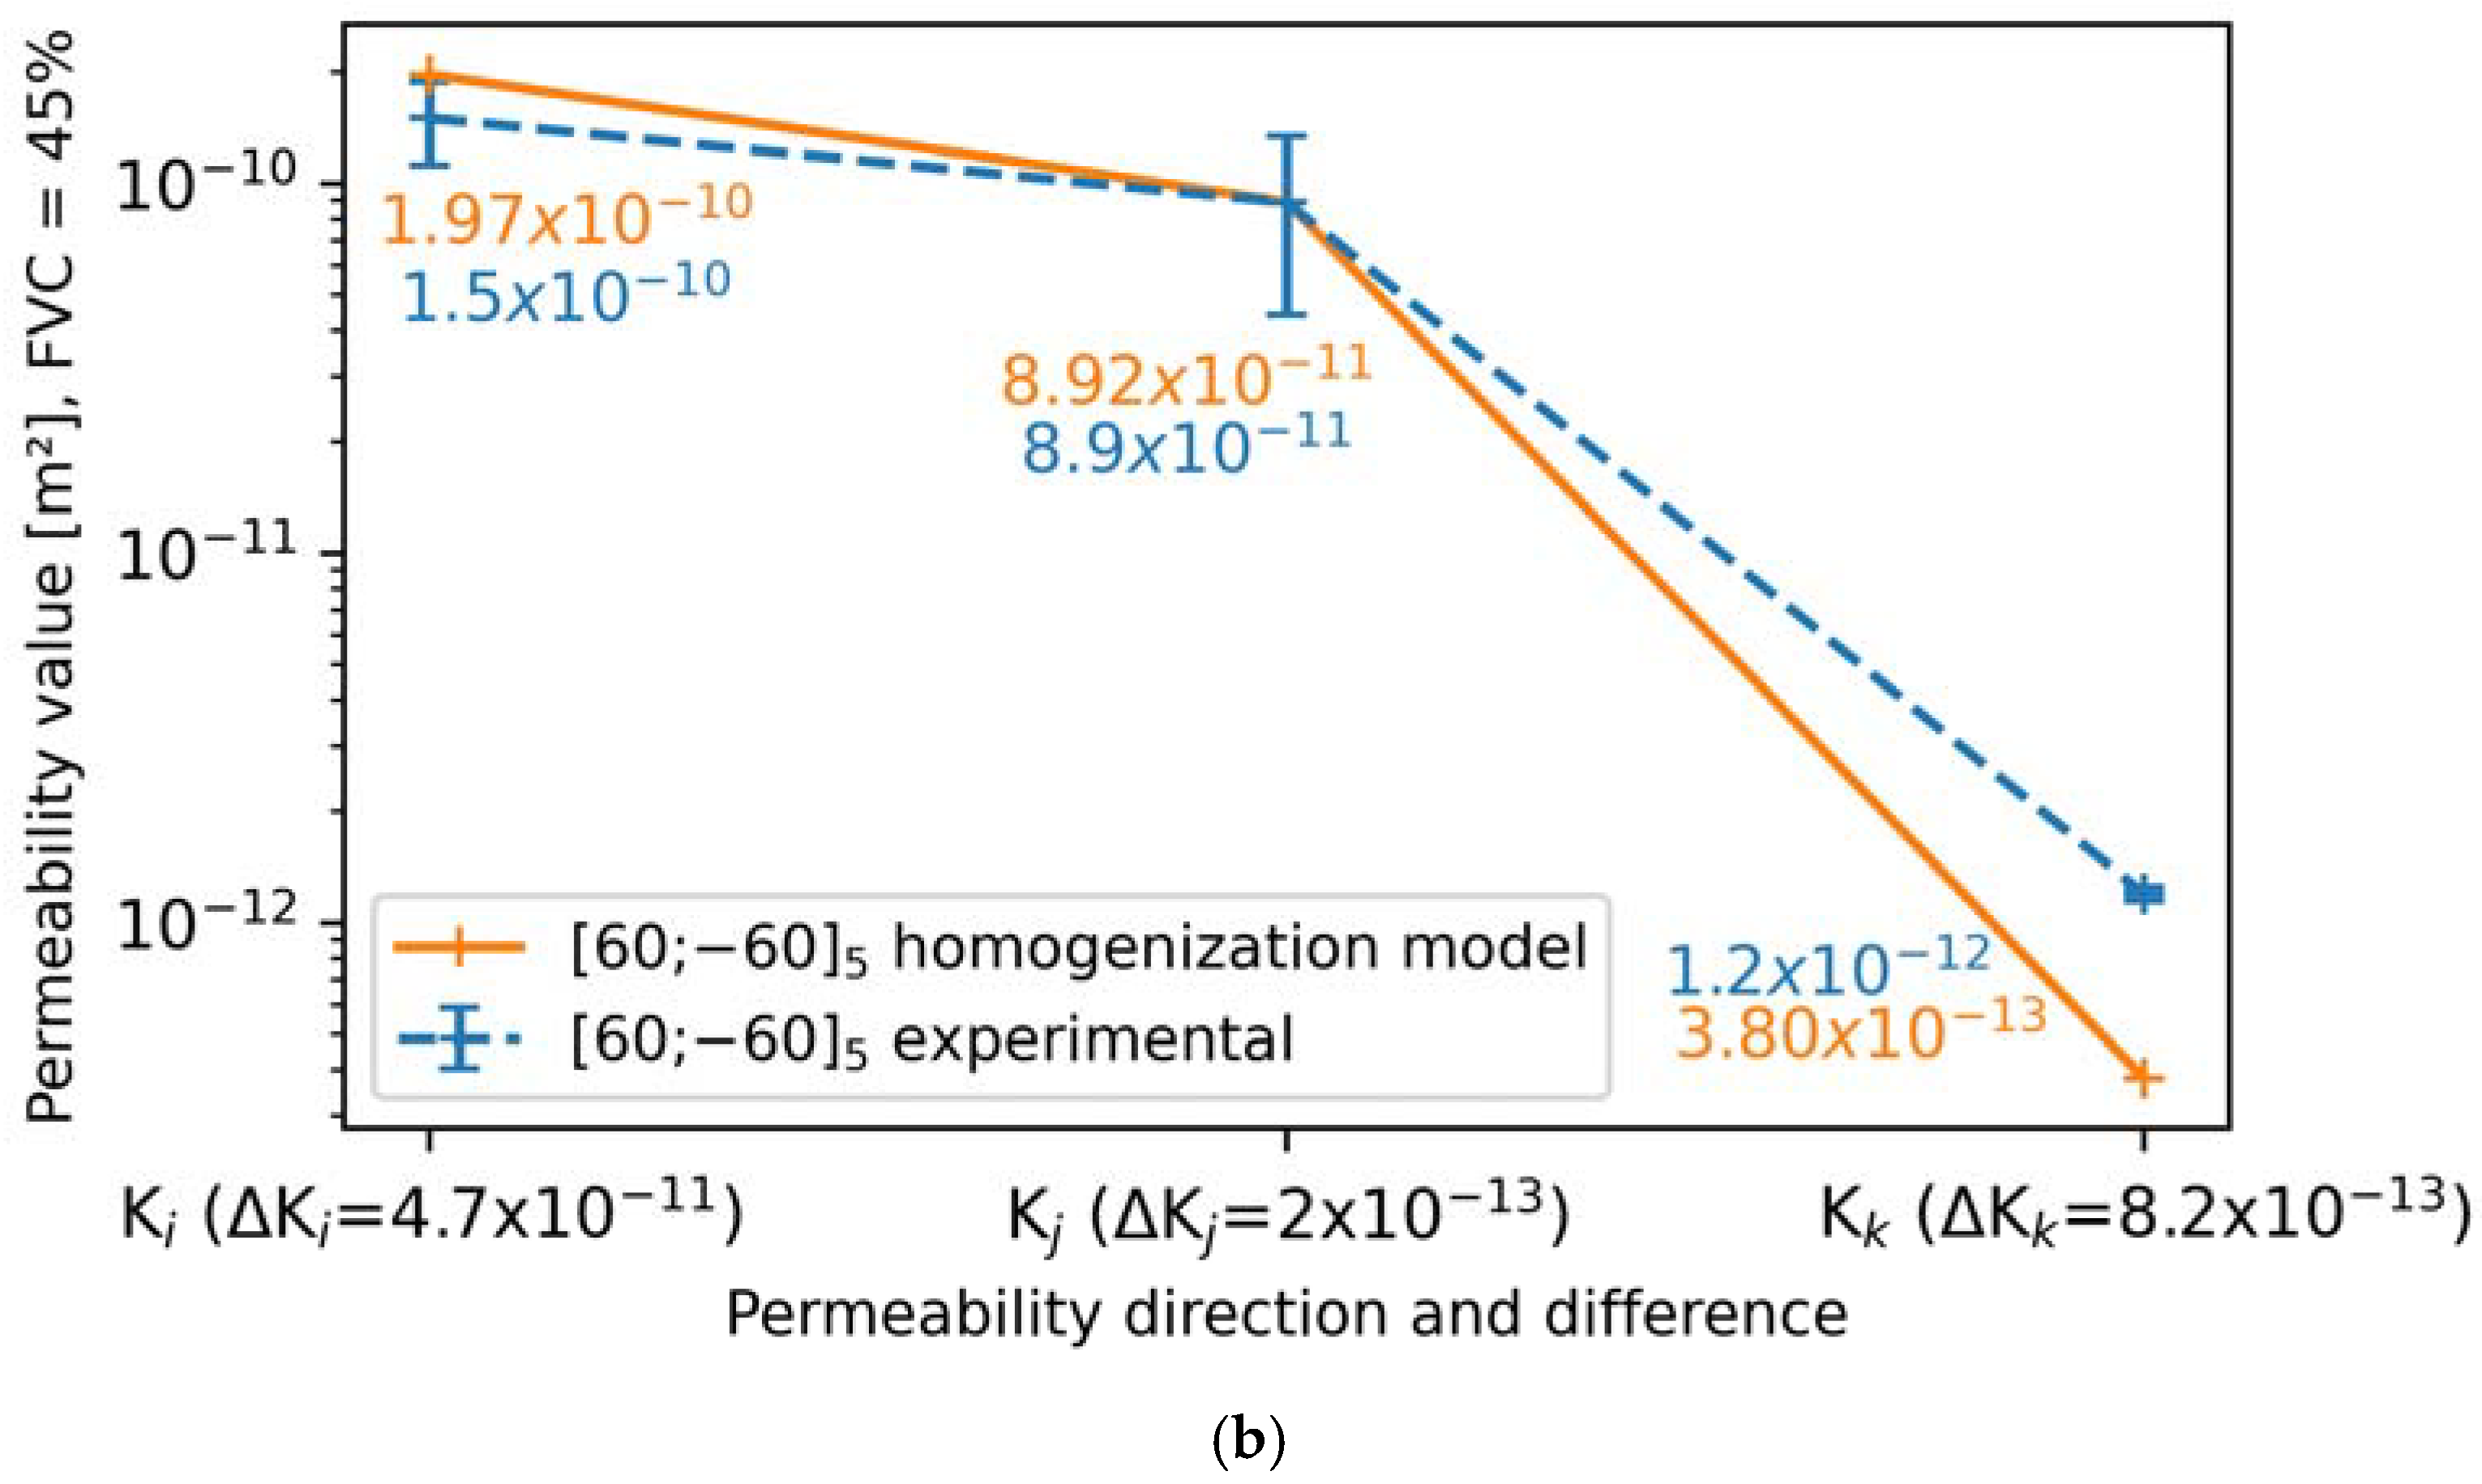
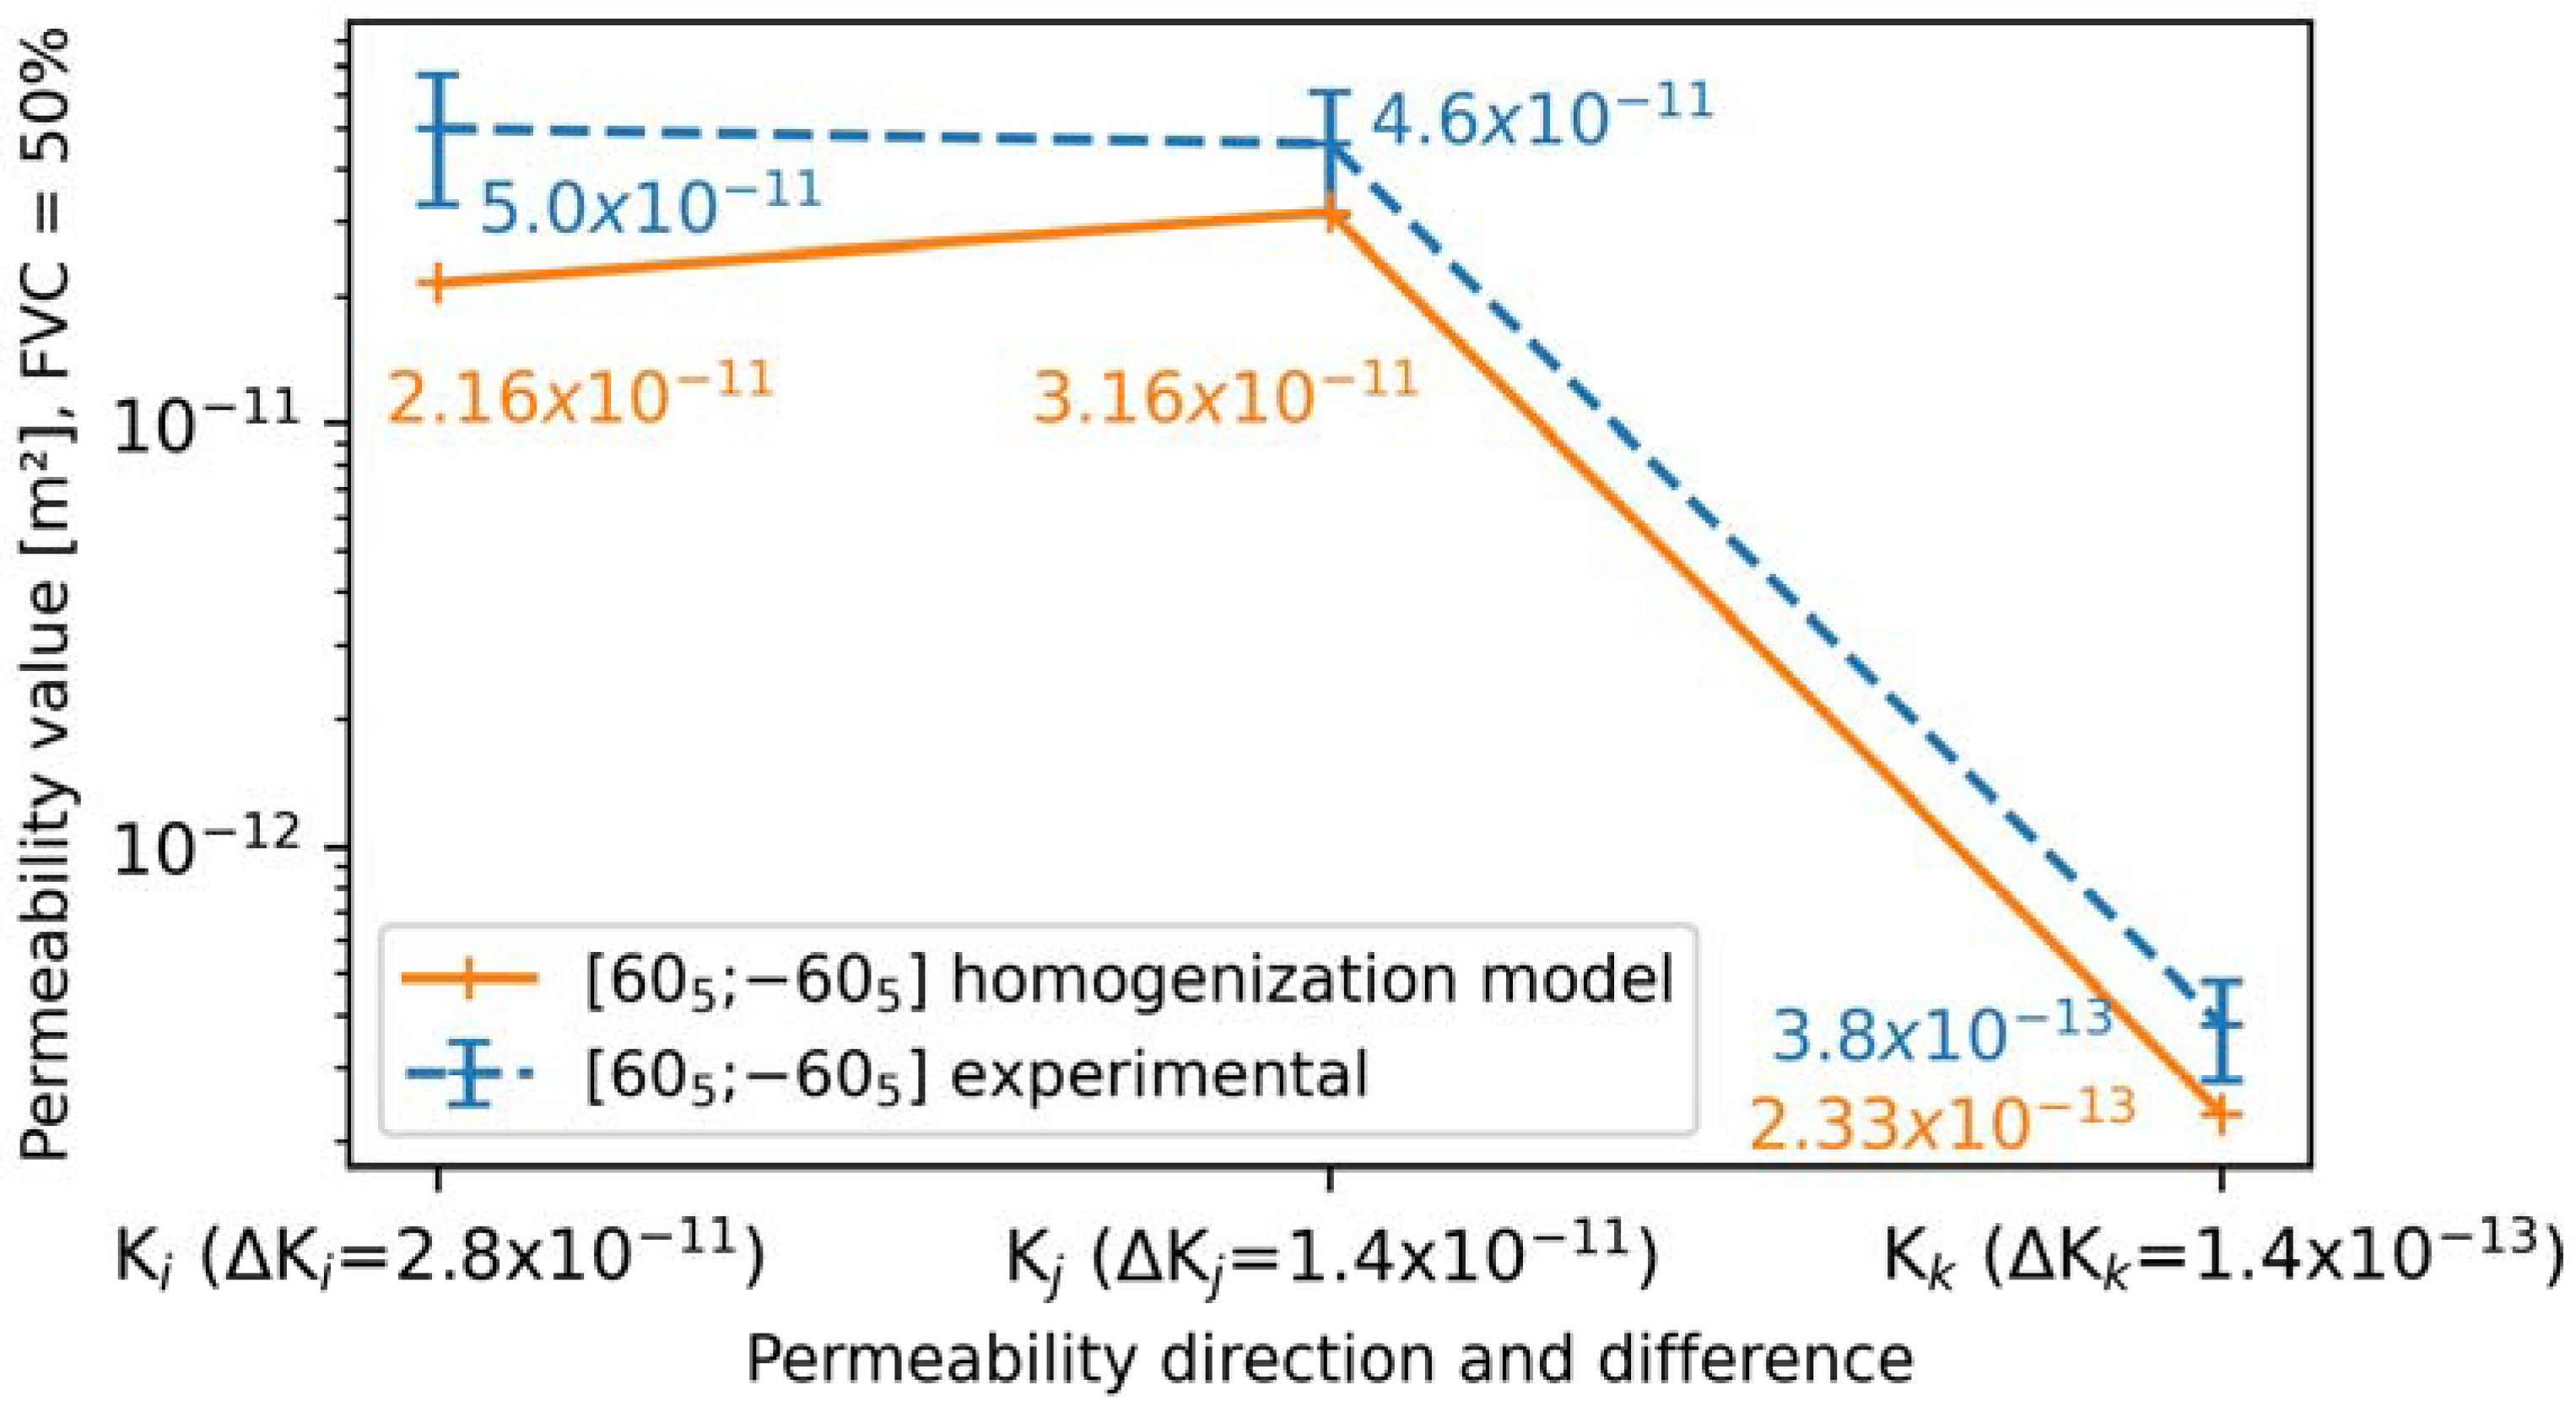
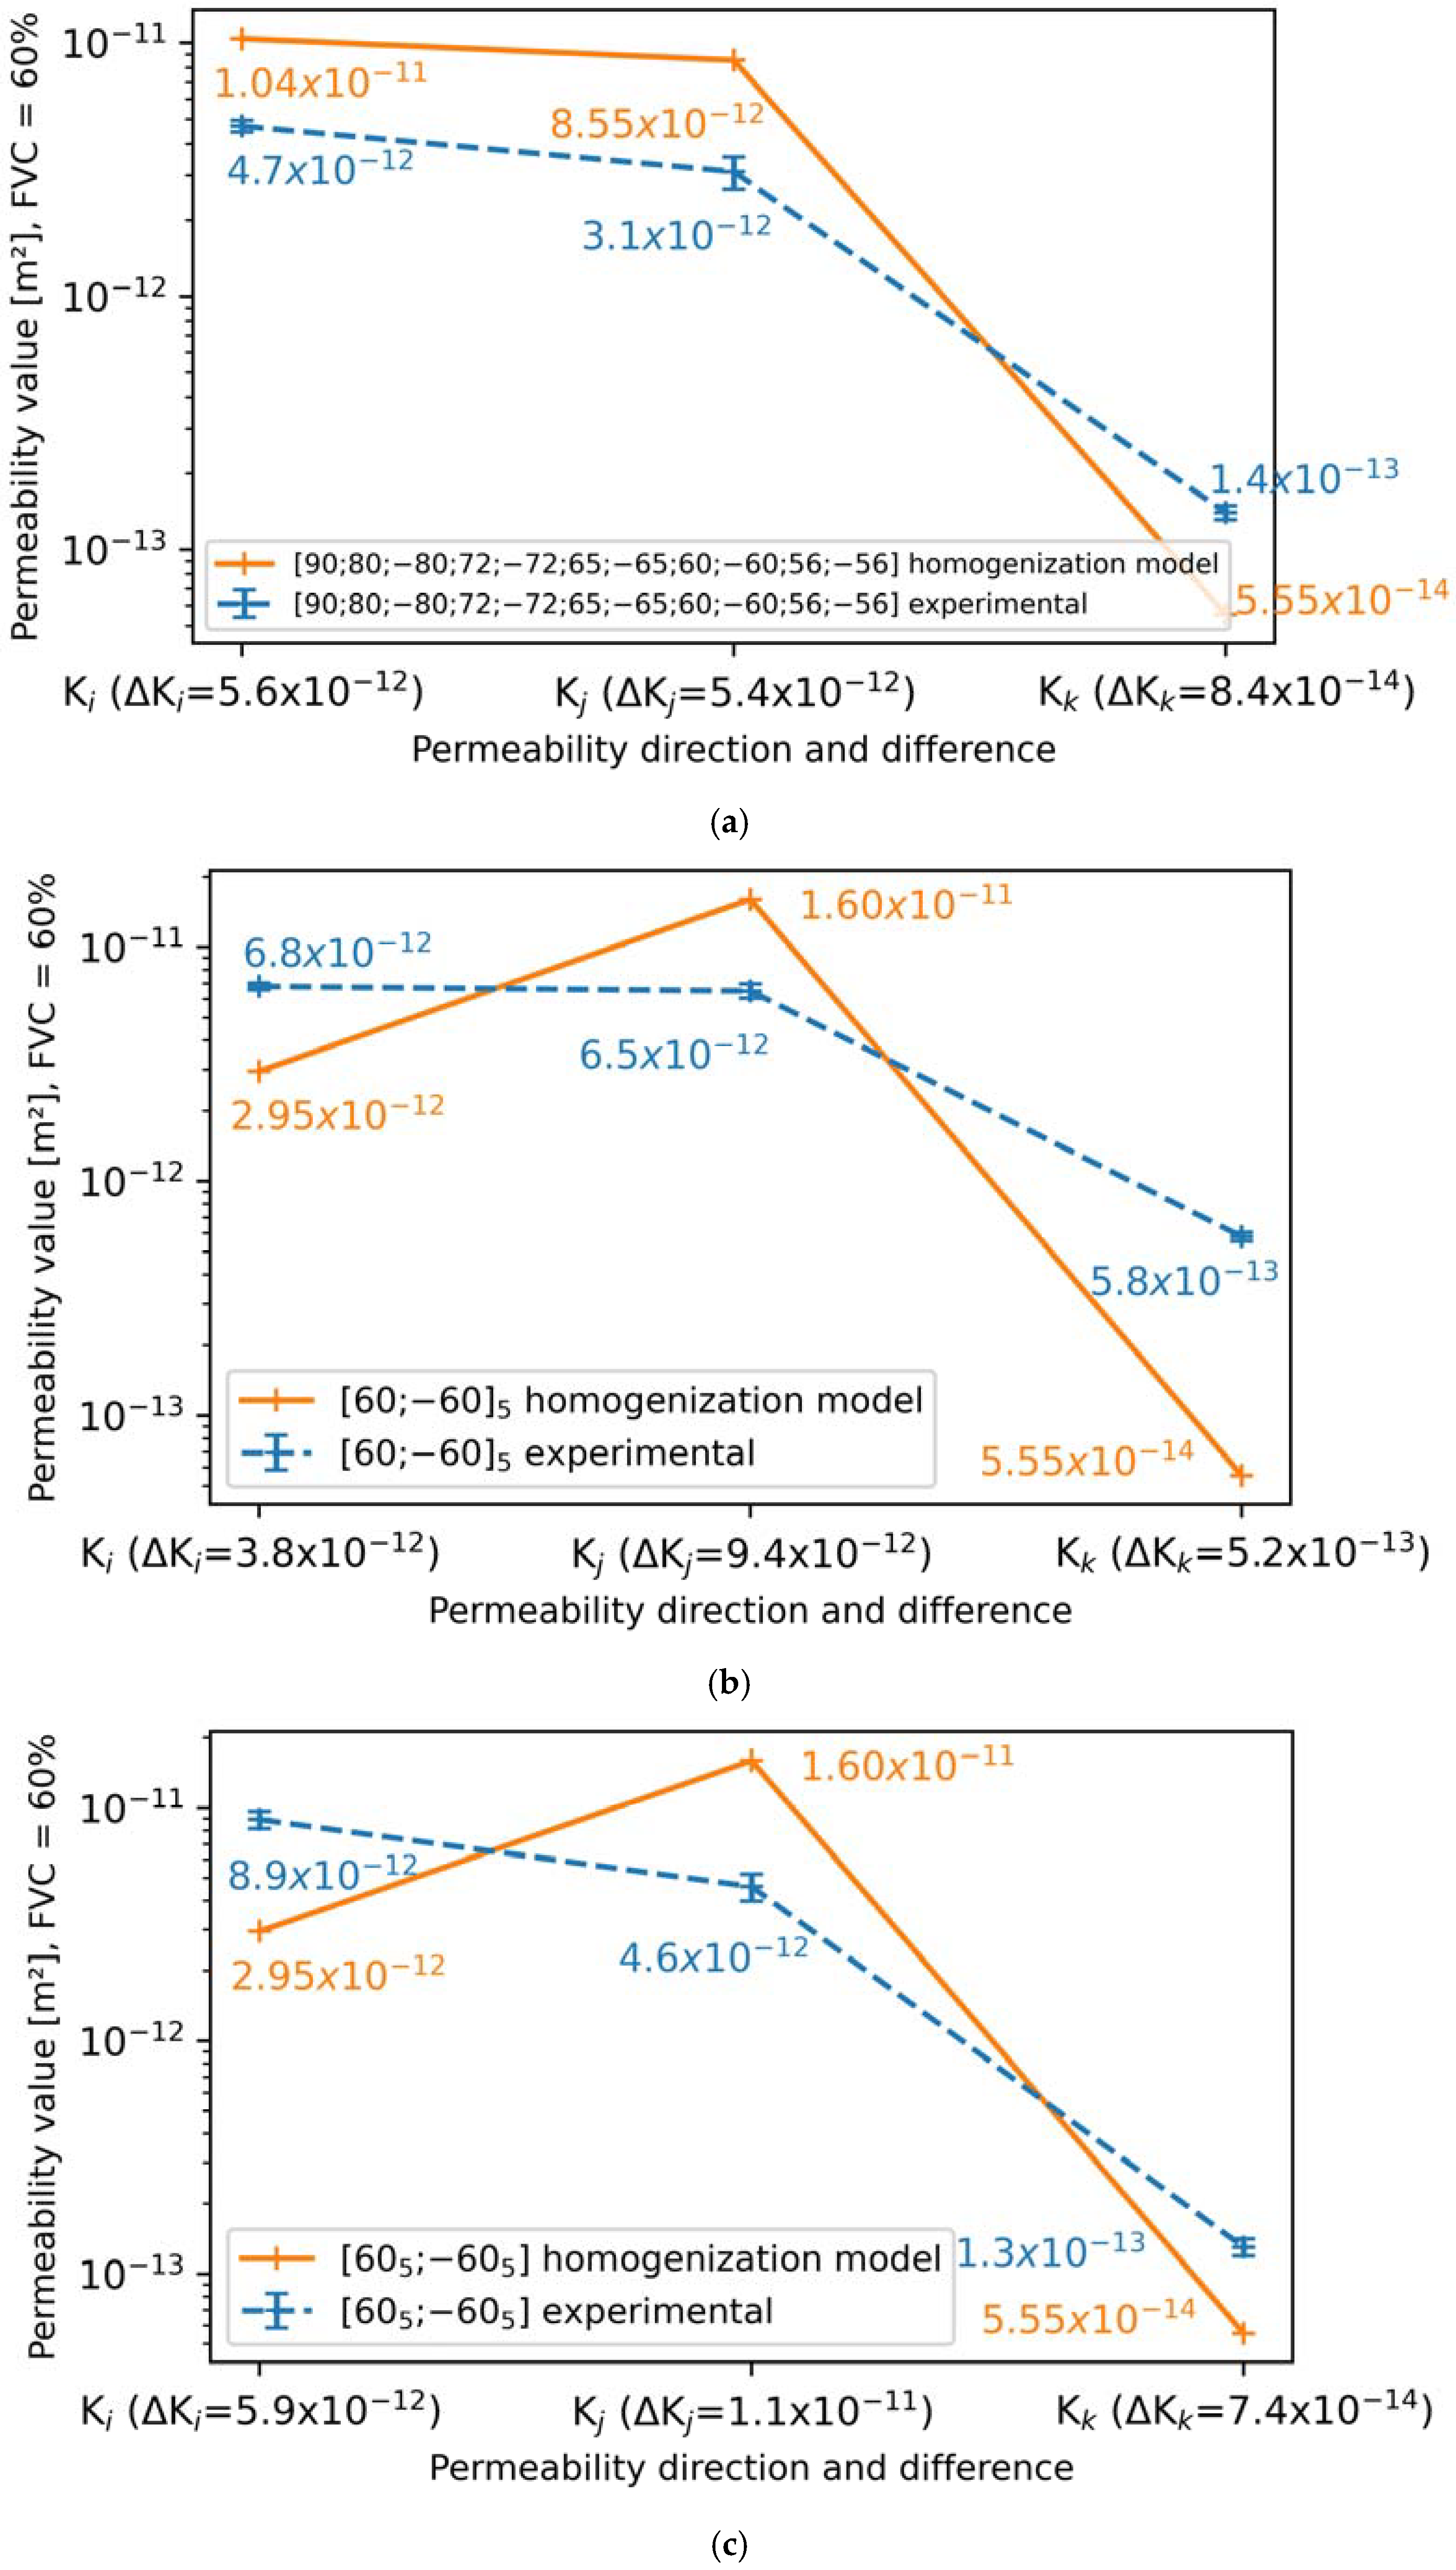
4.3. Comparison Between Computed Permeabilities and Measured Permeabilities
5. Discussion
5.1. Experimental Measurements of the Principal Permeabilities
5.2. Deviations Between Computed Permeabilities and Experimental Permeabilities
5.3. Recalibration of the UD Tape Input Permeabilities Using Experimental Results of Stackings with Only Little Nesting Effect
- Stacking 1: [90; 80; −80; 72; −72; 65; −65; 60; −60; 56; −56] with 60% of FVC;
- Stacking 2: with 45% and 60% of FVC;
- Stacking 3: [] with 45%, 50%, and 60% of FVC.
5.4. Evaluation of the Modelling Approach
6. Conclusions
Author Contributions
Funding
Data Availability Statement
Acknowledgments
Conflicts of Interest
Abbreviations
| UD | Unidirectional |
| FVC | Fibre Volume Content |
| RTM | Resin Transfer Moulding |
References
- Zhao, L.; Mantell, S.C.; Cohen, D.; McPeak, R. Finite element modeling of the filament winding process. Compos. Struct. 2001, 52, 499–510. [Google Scholar] [CrossRef]
- Sofi, T.; Neunkirchen, S.; Schledjewski, R. Path calculation, technology and opportunities in dry fiber winding: A review. Adv. Manuf. Polym. Compos. Sci. 2018, 4, 57–72. [Google Scholar] [CrossRef]
- Gebart, R. Permeability of Unidirectional Reinforcements for RTM. J. Compos. Mater. 1992, 26, 1100–1133. [Google Scholar]
- Advani, S.G.; Sozer, E.M. Constitutive Laws and Their Characterization. In Process Modeling in Composites Manufacturing; Marcel Dekker, Inc.: New York, NY, USA, 2003. [Google Scholar]
- Calado, V.M.A.; Advani, S.G. Effective average permeability of multi-layer preforms in resin transfer molding. Compos. Sci. Technol. 1996, 56, 519–531. [Google Scholar]
- Fournier, R.A. Optimisation et Modélisation du Procédé RTM. Ph.D. Thesis, École Nationale Supérieure des Mines de Paris, Paris, France, 2003. [Google Scholar]
- Binetruy, C. Calcul et Validation Expérimentale de la Perméabilité et Prévision de L’imprégnation de Tissus en Moulage RTM. Ph.D. Thesis, Université des Sciences et Technologies de Lille, Lille, France, 1996. [Google Scholar]
- Vernet, N.; Ruiz, E.; Advani, S.; Alms, J.; Aubert, M.; Barburski, M.; Barari, B.; Beraud, J.; Berg, D.; Correia, N.; et al. Experimental determination of the permeability of textiles: Benchmark II. Compos. Part A: Appl. Sci. Manuf. 2014, 61, 172–184. [Google Scholar]
- Cai, Z. Estimation of the permeability of fibrous preforms for resin transfer moulding processes. Compos. Manuf. 1992, 3, 251–257. [Google Scholar]
- Choi, M.A.; Lee, M.H.; Chang, J.; Lee, S.J. Permeability modeling of fibrous media in composite processing. J. Non-Newton. Fluid Mech. 1998, 79, 585–598. [Google Scholar]
- BYu, B.; Lee, L.J. A Simplified In-plane Permeability Model for Textile Fabrics. Polym. Compos. 2000, 21, 660–685. [Google Scholar]
- Endruweit, A.; Long, A.C. A model for the in-plane permeability of triaxially braided reinforcements. Compos. Part A 2011, 42, 165–172. [Google Scholar]
- Adams, L.K.; Rebenfeld, L. Permeability Characteristics of Multilayer Fiber Reinforcements. Part II: Theoretical Model. Polym. Compos. 1991, 12, 186–190. [Google Scholar] [CrossRef]
- Gebart, R.; Gudmunson, P.; Strömbeck, A.L.; Lundemo, C.Y. Analysis of the permeability in RTM Reinforcement. In Proceedings of the ICCM8, Honolulu, HI, USA, 15–19 July 1991. [Google Scholar]
- Mogavero, J.; Advani, S. Experimental Investigation of Flow Through Multi-Layered Preforms. Polym. Compos. 1997, 18, 649–655. [Google Scholar] [CrossRef]
- Yang, B.; Wang, S.; Tang, Q. Geometry modeling and Permeability Prediction for Textile Preforms With Nesting in Laminates. Polym. Compos. 2018, 39, 4408–4415. [Google Scholar]
- Fang, L.; Jiang, J.; Wang, J.; Deng, C. The effect of nesting on the in-plane permeability of unidirectional fabrics in resin transfer molding. Polym. Compos. 2016, 37, 1695–1704. [Google Scholar]
- Hoes, K.; Dinescu, D.; Sol, H.; Parnas, R.S.; Lomov, S. Study of nesting induced scatter of permeability values in layered reinforcement fabrics. Compos. Part A 2004, 35, 1407–1418. [Google Scholar]
- Sommi, A.D.; Lionetto, F.; Maffezzoli, A. An overview of the measurement of permeability of composite reinforcements. Polymers 2023, 15, 728. [Google Scholar] [CrossRef] [PubMed]
- Zhao, X. Multi-Scale Study of RTM Process Modelling in the Manufacturing of Aerospace Composites. Ph.D. Thesis, University of Nottingham, Nottingham, UK, 2017. [Google Scholar]
- Huang, Z.M.; Lee, S.Y.; Kim, H.M.; Youn, J.R.; Song, Y.S. Permeability analysis for non-crimp fabrics for resin transfer molding. Polym. Polym. Compos. 2019, 27, 429–439. [Google Scholar]
- Törnqvist, L.; Vartia, P.; Vartia, Y.O. How should relative changes be measured? Am. Stat. 1985, 39, 43–46. [Google Scholar]
- Bethea, R.M.; Duran, B.S. Statistical Methods for Engineers and Scientists, 3rd ed.; Revised and Expanded; Taylor & Francis Group, Marcel Dekker, Inc.: New York, NY, USA, 1995. [Google Scholar]


| Lay-Up | FVC (%) | |||
|---|---|---|---|---|
| [] | 45% | 2.0 × 10⁻¹⁰ (±41.3%) | 7.9 × 10⁻¹¹ (±32.3%) | 3.5 × 10⁻¹³ (±30.9%) |
| [] | 50% | 2.1 × 10⁻¹¹ (±24.9%) | 3.0 × 10⁻¹¹ (±18%) | 2.6 × 10⁻¹³ (±17.1%) |
| [] | 60% | 1.5 × 10⁻¹² (±17.6%) | 1.6 × 10⁻¹¹ (±19.5%) | / |
| [] | 58.7% | / | / | 6.2 × 10⁻¹⁴ (± 24.3%) |
| Lay-Up | FVC (%) | |||
|---|---|---|---|---|
| ] | 45% | 1.6 × 10⁻¹⁰ (±35.8%) | 1.2 × 10⁻¹⁰ (±25.3%) | 4.5 × 10⁻¹³ (±20.2%) |
| ] | 50% | 5.0 × 10⁻¹¹ (±33.5%) | 4.6 × 10⁻¹¹ (±32%) | 3.8 × 10⁻¹³ (±26.9%) |
| ] | 60% | 8.9 × 10⁻¹² (±8.3%) | 4.6 × 10⁻¹² (±13.1%) | 1.3 × 10⁻¹³ (±9%) |
| 45% | 1.5 × 10⁻¹⁰ (±25.4%) | 8.9 × 10⁻¹¹ (±49.8%) | 1.2 × 10⁻¹³ (±4%) | |
| 60% | 6.8 × 10⁻¹² (±3.4%) | 6.5 × 10⁻¹² (±7.1%) | 5.8 × 10⁻¹³ (±4.5%) | |
| [90; 80; −80; 72; −72; 65; −65; 60; −60; 56; −56] | 60% | 4.7 × 10⁻¹² (±5.3%) | 3.1 × 10⁻¹² (±14.6%) | 1.4 × 10⁻¹³ (±6.2%) |
| Units | Experimental UD Permeabilities | Theoretical UD Permeabilities, Calculated from [3,4] | Calculated UD Permeabilities for Model Recalibration | |
|---|---|---|---|---|
| FVC | % | 60 | 60 | 60 |
| Ki | m² | 1.50 × 10⁻¹² | 4.36 × 10⁻¹³ | 5.00 × 10⁻¹³ |
| Kj | m² | 1.60 × 10⁻¹¹ | 3.86 × 10⁻¹⁴ | 5.08 × 10⁻¹² |
| Kk | m² | 6.20 × 10⁻¹⁴ | 3.86 × 10⁻¹⁴ | 2.85 × 10⁻¹³ |
| B: Experimental Permeabilities (m²) | Standard Deviation (SD) of Experimental Permeabilities (%) | A: Recalibrated Homogenization Model (m²) | Absolute Value of Logarithmic Difference, [22,23] | Absolute Value of Percentage Change: | ||
|---|---|---|---|---|---|---|
| Stacking 1 | Ki | 4.7 × 10⁻¹² | 5.3% | 5.00 × 10⁻¹² | 2.7% | 6.4% |
| Kj | 3.1 × 10⁻¹² | 14.6% | 5.08 × 10⁻¹² | 21.5% | 63.9% | |
| Kk | 1.4 × 10⁻¹³ | 6.0% | 2.85 × 10⁻¹³ | 30.9% | 103.6% | |
| Stacking 2 | Ki | 6.8 × 10⁻¹² | 3.0% | 5.44 × 10⁻¹² | 9.7% | 20.0% |
| Kj | 6.5 × 10⁻¹² | 7.0% | 5.68 × 10⁻¹² | 5.9% | 12.6% | |
| Kk | 5.8 × 10⁻¹³ | 5.0% | 2.19 × 10⁻¹³ | 42.3% | 62.2% | |
Disclaimer/Publisher’s Note: The statements, opinions and data contained in all publications are solely those of the individual author(s) and contributor(s) and not of MDPI and/or the editor(s). MDPI and/or the editor(s) disclaim responsibility for any injury to people or property resulting from any ideas, methods, instructions or products referred to in the content. |
© 2025 by the authors. Licensee MDPI, Basel, Switzerland. This article is an open access article distributed under the terms and conditions of the Creative Commons Attribution (CC BY) license (https://creativecommons.org/licenses/by/4.0/).
Share and Cite
Somrani, S.; Jacques, E.; Weiss, B.; Duchamp, B. Modelling the Permeabilities of Dry Filament Wound Cylindrical Reinforcements for RTM Simulation. Processes 2025, 13, 1071. https://doi.org/10.3390/pr13041071
Somrani S, Jacques E, Weiss B, Duchamp B. Modelling the Permeabilities of Dry Filament Wound Cylindrical Reinforcements for RTM Simulation. Processes. 2025; 13(4):1071. https://doi.org/10.3390/pr13041071
Chicago/Turabian StyleSomrani, Souheil, Eric Jacques, Benjamin Weiss, and Boris Duchamp. 2025. "Modelling the Permeabilities of Dry Filament Wound Cylindrical Reinforcements for RTM Simulation" Processes 13, no. 4: 1071. https://doi.org/10.3390/pr13041071
APA StyleSomrani, S., Jacques, E., Weiss, B., & Duchamp, B. (2025). Modelling the Permeabilities of Dry Filament Wound Cylindrical Reinforcements for RTM Simulation. Processes, 13(4), 1071. https://doi.org/10.3390/pr13041071