Article

Differential Evolution of Reservoir Permeability Under Dip Angle Control During Coalbed Methane Production

1
Key Laboratory of Coalbed Methane Resources and Reservoir Formation Process, Ministry of Education, School of Resources and Geosciences, China University of Mining and Technology, Xuzhou 221008, China
2
Xinjiang Yaxin Coalbed Methane Investment and Development (Group) Co., Ltd., Urumqi 830001, China
*
Author to whom correspondence should be addressed.
Processes 2025, 13(4), 1147; https://doi.org/10.3390/pr13041147
Submission received: 7 March 2025 / Revised: 1 April 2025 / Accepted: 7 April 2025 / Published: 10 April 2025

Abstract

:
Permeability variations during coalbed methane (CBM) production remain a critical research focus. However, existing studies have primarily concentrated on nearly horizontal reservoirs, with limited in-depth analyses of the dynamic evolution of permeability in steeply inclined coal reservoirs (SICRs) (>45°). This study examined the dynamic permeability characteristics across different reservoir dip angles, comparing variations in the up-dip (UD) and down-dip (DD) directions of SICRs and investigating their controlling mechanisms. The results indicate an asymmetry in permeability changes between UDs and DDs, with UDs generally exhibiting a greater amplitude of variation. The reservoir dip angle exerts a more pronounced influence on DD permeability changes, primarily through its effects on effective stress (ES) and matrix shrinkage (MS). Specifically, a reduction in the negative impact of ES in the UD enhances the overall reservoir permeability, whereas a reduction in the positive effect of MS in the DD leads to a more significant permeability decline. The comparatively smaller increase in DD permeability contributes to distinct evolutionary trends in the permeability between UDs and DDs. These dynamic permeability changes in SICRs have a more substantial impact on CBM production, particularly in low-strength and low-rank coal reservoirs. The findings of this study provide valuable insights for optimizing CBM production strategies in SICRs.

1. Introduction

The dip angles of coal reservoirs in China vary significantly, ranging from 5 to 15° in the Qinshui Basin and 15 to 35° in the Sichuan Basin to both horizontal and vertical coal reservoirs in the Junggar Basin [1,2]. Recently, steeply inclined coal reservoirs (SICRs) with dip angles exceeding 45° at the southern margin of the Junggar Basin have garnered significant attention for coalbed methane (CBM) recovery (Figure 1) [3,4]. Previous studies have examined the gas production profile and the dynamic evolution of the pressure and gas content in SICRs [5]. However, research specifically addressing permeability—which is strongly influenced by variations in the pressure and gas content—remains limited. Therefore, it is essential to elucidate the effects of the dip angle on reservoir permeability, investigate its role in controlling gas production, and develop optimized production strategies tailored to CBM production in SICRs.
Permeability changes are influenced by the effective stress (ES) and matrix shrinkage (MS) [6], and numerous models have been developed to describe these effects [7]. It has been widely observed that permeability typically decreases initially before subsequently increasing [8]. In nearly horizontal reservoirs, where heterogeneity within the production-controlled region of CBM wells is relatively weak, a symmetric pressure drop funnel and desorption funnel are formed. Consequently, permeability evolution exhibits a symmetric funnel shape centered around the wellbore [9]. However, in steeply inclined coal reservoirs (SICRs), variations in the initial pressure, gas content, and permeability—resulting from reservoir inclination—as well as the influence of gravity, cause the pressure drop funnel to deviate from that observed in nearly horizontal reservoirs [10,11]. As a result, changes in the reservoir pressure and gas content do not exhibit a symmetric funnel shape [5,10], leading to distinct permeability evolution patterns in SICRs. These dynamic permeability changes further impact water and gas production, subsequently influencing the temporal variations in the pressure and gas content. To better understand permeability variations in SICRs, it is essential to investigate how reservoir inclination governs permeability evolution. While previous studies have examined the production profiles, gas content, and reservoir pressure across coal reservoirs with varying dip angles [5,10], research specifically focusing on the permeability across different dip angles remains limited. Although permeability is influenced by changes in the reservoir pressure and gas desorption, these effects are mutually coupled, making it insufficient for directly extrapolating the permeability solely from variations in the gas content and reservoir pressure.
To investigate the evolution of permeability during the CBM drainage process, previous researchers have developed numerous mathematical models [12]. Among these, the P&M and S&D models are the most widely utilized [6], with the P&M model being extensively integrated into oil and gas reservoir simulation software, such as Eclipse and CMG [13,14]. These established permeability models provide a framework for understanding permeability variations throughout the CBM production process [12]. Tao [9] analyzed the impact of the reservoir elastic deformation capacity on permeability changes, suggesting that reservoirs with a higher Young’s modulus experience lower reductions in permeability. Some studies have indicated that the effects of Young’s modulus and Poisson’s ratio on permeability variations are relatively minor [15], whereas adsorptive strain has been shown to exert a significant influence on permeability evolution [16,17].
Previous research has primarily focused on permeability variations at single points within the reservoir space [18,19]. In nearly horizontal reservoirs, the overall permeability evolution can be inferred based on variations in the reservoir pressure. However, in steeply inclined reservoirs, differences in the initial permeability, reservoir pressure changes, and gas desorption dynamics introduce greater complexity to permeability evolution. Despite its critical role in CBM production, the permeability in inclined coal reservoirs remains underexplored, and its evolution during gas production differs markedly from that in horizontal reservoirs.
Therefore, further research is urgently needed to investigate the differences in permeability evolution between the up-dip (UD) and down-dip (DD) directions under varying dip angles. This study examined reservoir permeability changes across dip angles ranging from 0° to 80° and evaluated their impact on CBM production profiles. Additionally, this study compared and analyzed the evolutionary differences in the permeability between UDs and DDs based on the P&M model, while assessing the influence of the effective stress (ES) and matrix shrinkage (MS) on permeability. The controlling effect of dip angle variations on permeability was also examined. Finally, this study explored the permeability evolution of steeply inclined coal reservoirs (SICRs) under different coal rock mechanical conditions and assessed its influence on the overall permeability, providing a foundation for the quantitative analysis of permeability across diverse reservoir conditions.

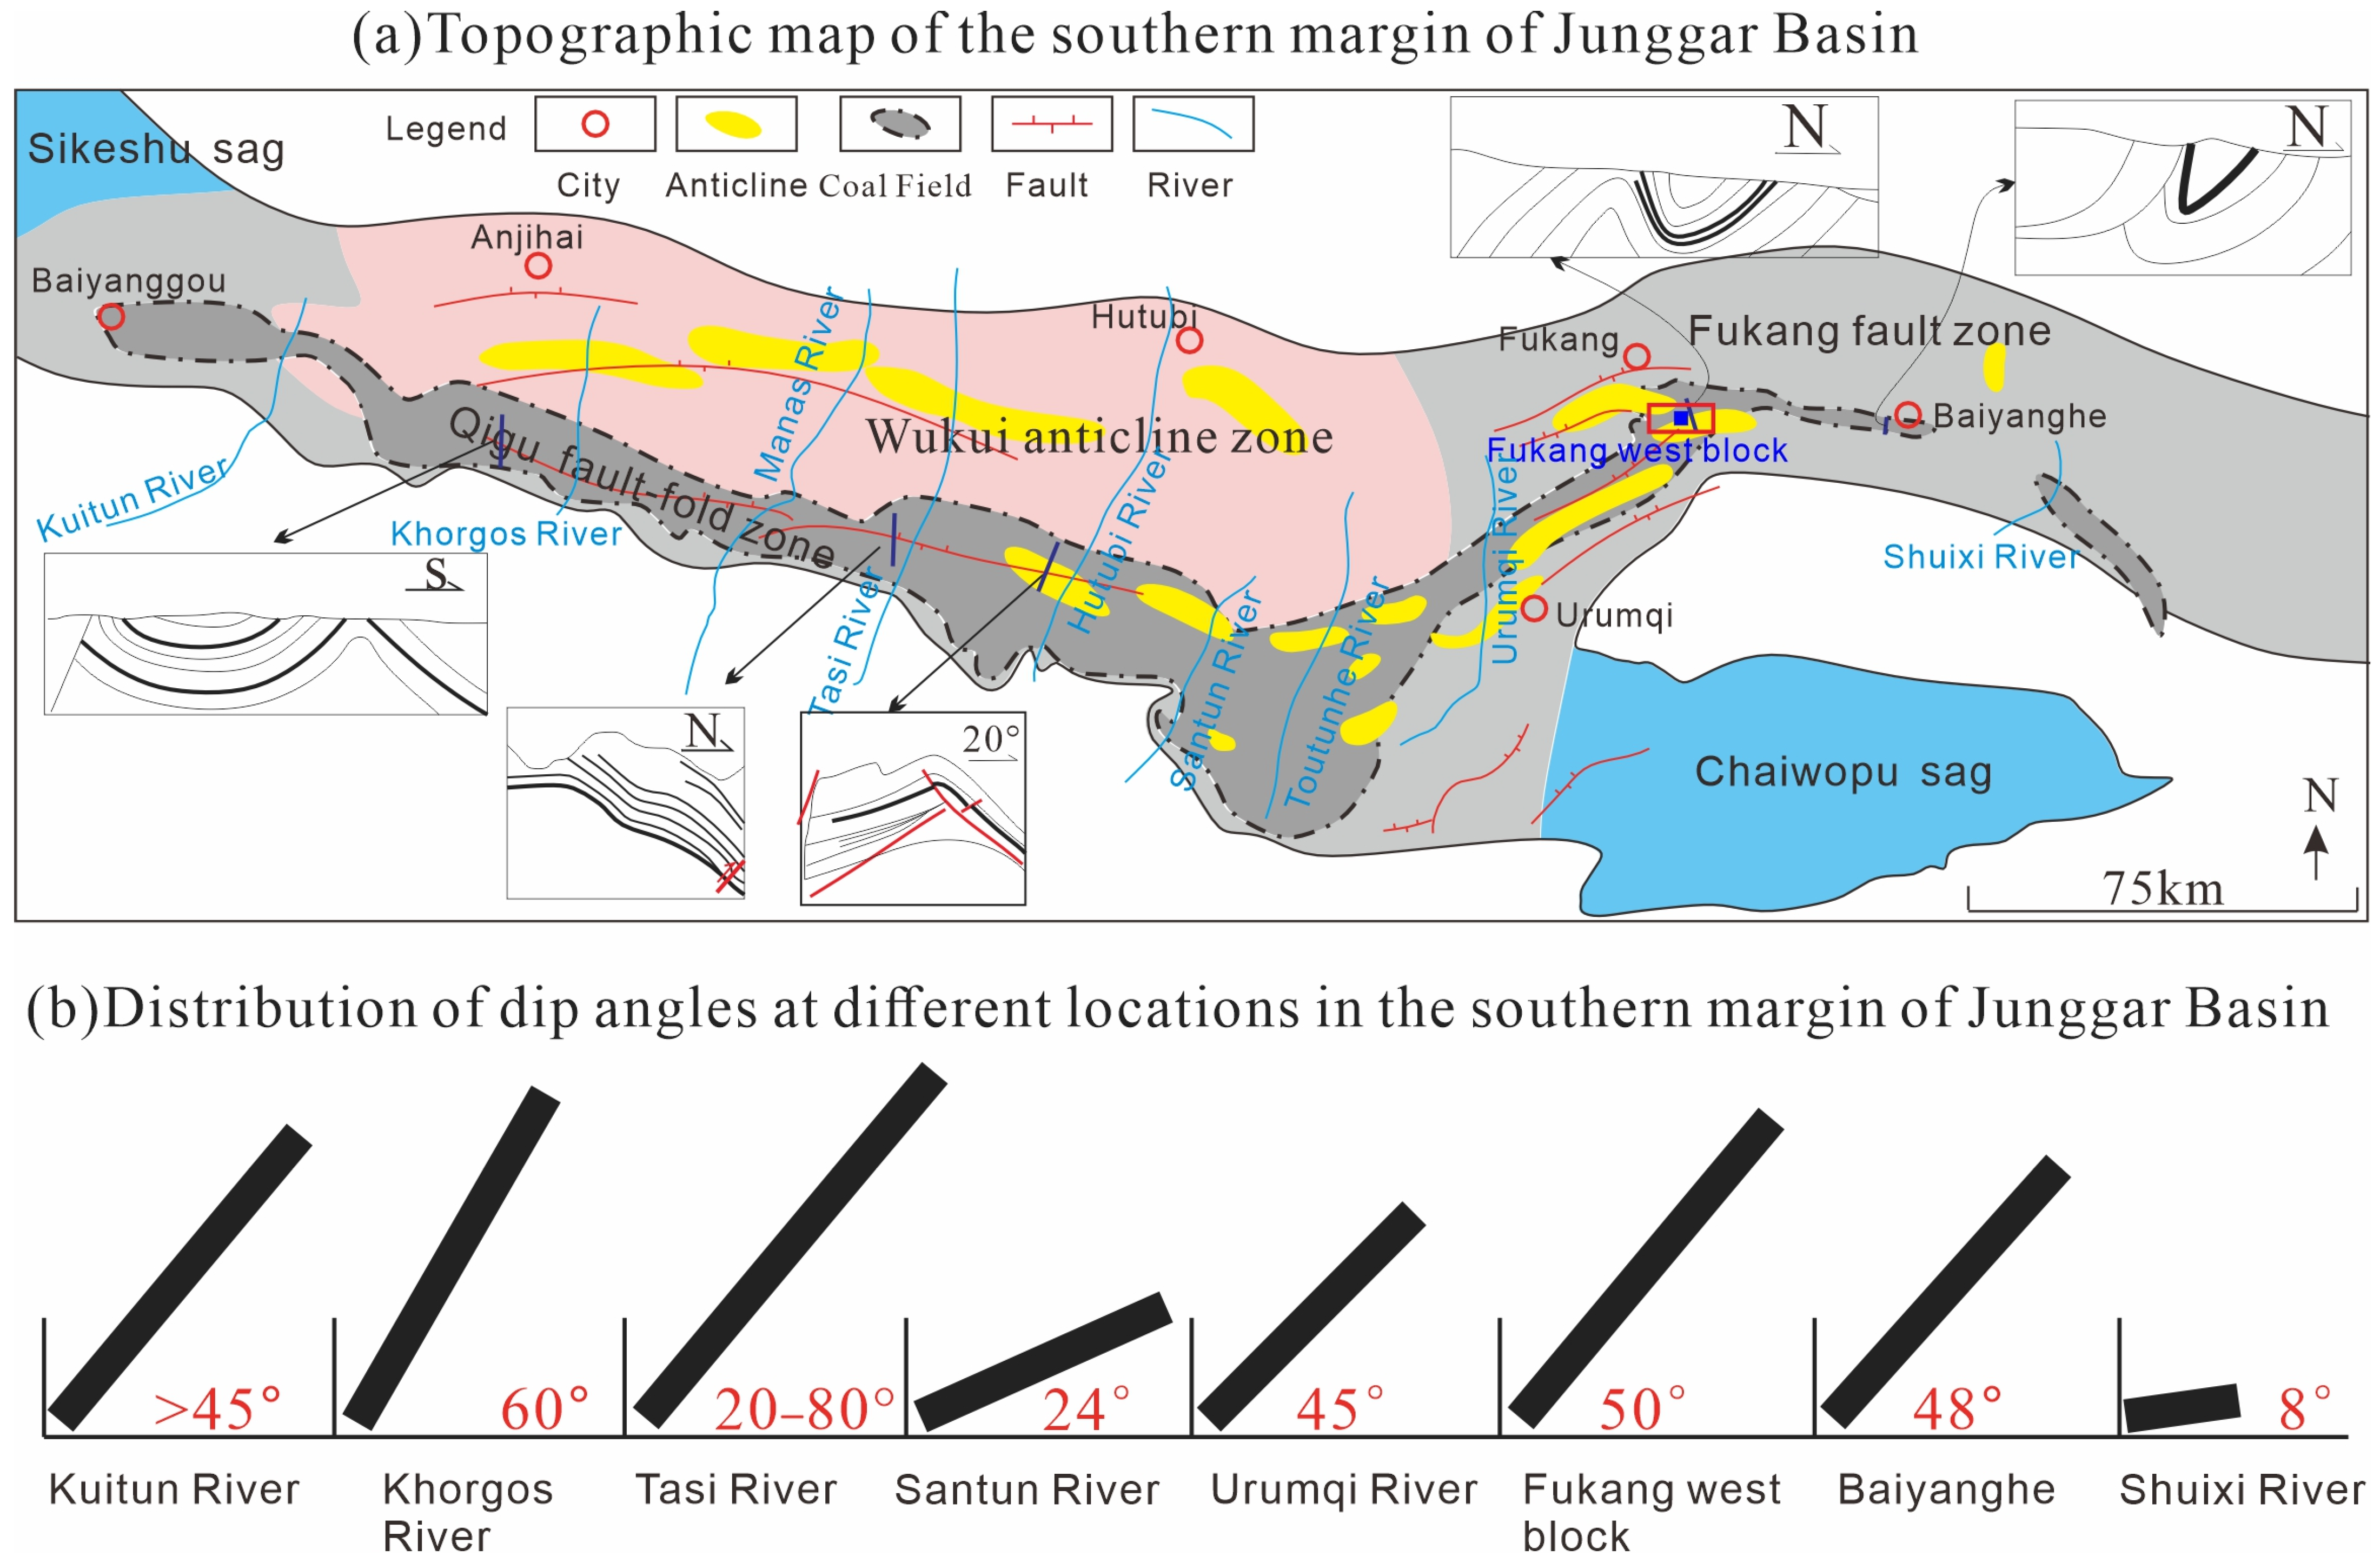
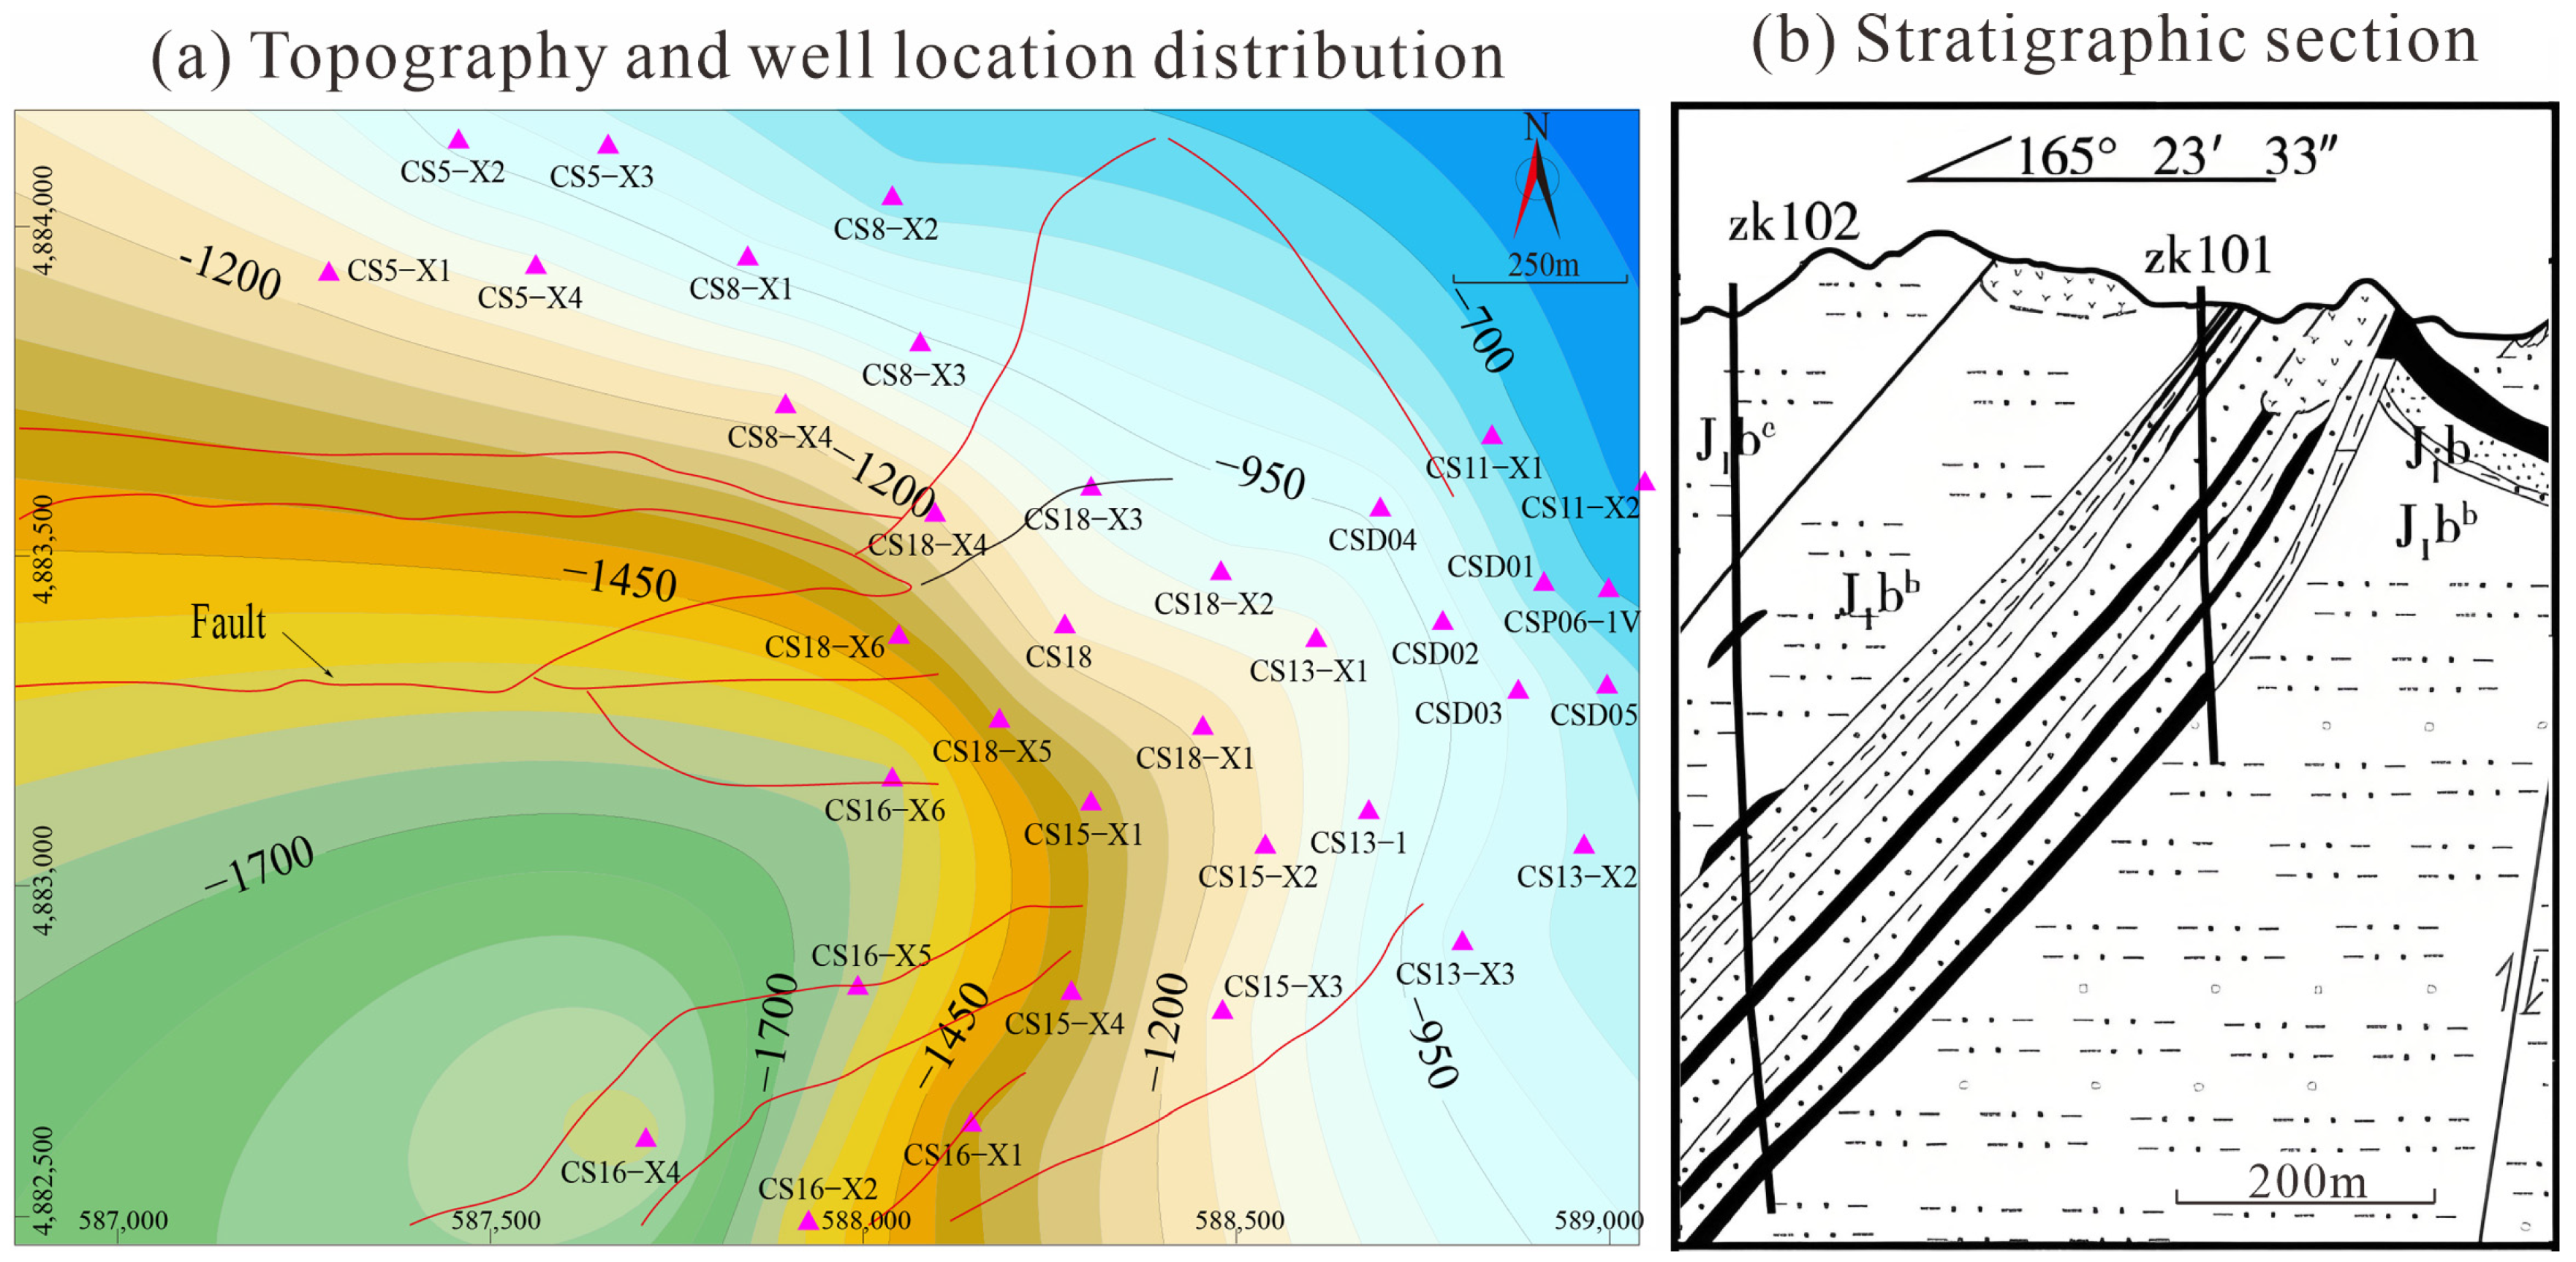
2. Research Background

SICRs in China are predominantly located along the southern margin of the Junggar Basin, where approximately 50% of coalbed methane (CBM) resources are hosted within these reservoirs. This region exhibits diverse structural styles, including thrust faults, synclines, and anticlines (Figure 1a). The variations in dip angles within this area result from south-to-north thrust nappe tectonics caused by multiple geological movements (Figure 1a). For instance, the Badaowan Formation in Fukang has a dip angle exceeding 45°, while Baiyanghe exhibits a dip angle of approximately 50°. Similarly, the Urumqi River region features coal seams with dip angles exceeding 45°, whereas the Hutubi River area displays a north-by-east inclination with dip angles ranging from 8° to 45°. In the Tasi River area, coal seams at depths shallower than 1550 m have dip angles between 45° and 80°, while at greater depths (>1550 m), the dip angles gradually decrease to 28–45°. Likewise, the Khorgos River region contains coal reservoirs with dip angles of 55–60°, whereas the Kuitun River area generally exhibits dip angles greater than 45° (Figure 1b).
CBM production in SICRs differs significantly from that in gently dipping reservoirs, such as those found in the Qinshui and Ordos Basins [5]. The steep dip angles in these reservoirs lead to substantial variations in physical properties, including the reservoir pressure, permeability, and gas content [8,20], which in turn influence the gas production dynamics and reservoir property evolution. Among these factors, permeability is a critical parameter that directly impacts the gas extraction efficiency. Therefore, it is essential to analyze permeability variations in SICRs and elucidate the mechanisms by which the dip angle affects the permeability.
The Fukang west area, influenced by the southward thrust nappe of the Bogda Mountains, is characterized by well-developed faults and folds [2] (Figure 2). The coal seams in this region exhibit relatively steep dip angles, generally ranging from 30° to 60°. The A2# coal seam is the primary gas-producing layer, with a thickness varying between 10 and 35 m, averaging approximately 20 m (Figure 2).
Currently, more than 30 wells have been drilled in the Fukang west area, the majority of which are directional wells. The average daily gas production exceeds 5000 m3, indicating substantial CBM development potential [2,4]. Given these characteristics, this study selected this block as the research area.

3. Simulation for CBM Production

This study employed the finite element method to investigate permeability variations during CBM production in reservoirs with different dip angles. The permeability model utilized in this research was based on the widely adopted P&M model [21]. The CBM production process primarily involves methane diffusion within the coal matrix and Darcy flow through the fracture network [22]. This process exhibits fluid–solid coupling behavior, wherein methane desorption and reservoir pressure reduction induce changes in coal fractures, leading to fluctuations in the reservoir permeability. Furthermore, permeability variations, in turn, influence methane desorption and pressure depletion, creating a dynamic feedback mechanism. Consequently, finite element simulations of CBM production require the formulation of equations governing the methane–water flow, along with a state equation describing permeability evolution. For a detailed formulation of the gas–water flow model in CBM production, refer to [23].

3.1. Evolution of Permeability During Gas Production

The Palmer–Mansoori (P&M) model is a widely used numerical model for describing permeability variations during CBM production [21]. It is currently the most extensively applied approach for simulating permeability evolution in coal reservoirs [24]. The fundamental principle of the P&M model is that changes in the ES and MS induce strain in the coal reservoir, leading to variations in the fracture width, which in turn affect the fracture porosity and permeability. The permeability evolution during CBM production is governed by the P&M equation:
k / k 0 = 1 + 1 ϕ 0 M ( p p 0 ) 3   If   p > p c 1 + 1 ϕ 0 M ( p p 0 ) + 1 ϕ 0 ( K M 1 ) ( ε β p 1 + β p ε β p c 1 + β p c ) 3   If   p < = p c
where:
M = ( 1 v ) E ( 1 + v ) ( 1 2 v ) ;   K = E 3 ( 1 2 v )
where k—real-time permeability, k0—initial permeability, p—reservoir pressure, p0—initial reservoir pressure, pc—critical desorption pressure, ε and β—strain parameters, E—Young’s modulus, and v—Poisson’s ratio. The evolution characteristics of permeability can be reflected by the ratio of k to k0 (k/ k0).

3.2. Parameter Determination

Using the Eclipse numerical simulation software (version 2013.1), developed by Schlumberger Corp., U.S., a 300 × 300 m numerical model was constructed to simulate CBM production under various reservoir dip angles, including 0° (horizontal coal seam), 10°, 20°, 30°, 40°, 50°, 60°, 70°, and 80°, and to analyze permeability variations (Figure 3). Eclipse employs the Warren–Root dual-porosity model to represent coal reservoirs and simulate gas production by incorporating the methane adsorption, desorption, diffusion, and permeability dynamics in CBM extraction [25,26,27,28]. The permeability evolution during coalbed methane drainage, as described by the P&M model, was implemented using the built-in P&M grid.
The reservoir inclination influences the initial reservoir pressure, gas content, and permeability, leading to differences in the simulated input parameters compared to horizontal reservoirs. The fundamental parameters used for the simulation were derived from drilling and testing data of Well CS18 in the western Fukang area (Table 1). The burial depth and coal thickness were determined based on field drilling depths and logging data. The reservoir pressure was inferred from the hydrostatic level during drilling, while the gas content and desorption time were obtained through on-site desorption experiments using the USBM method. The permeability was assessed through well test data using the injection pressure drop method. The Langmuir parameters were derived from adsorption experiments conducted at formation temperature. The variations in the permeability and gas content with burial depth were established by fitting the on-site gas content and permeability data across different depths. The strain parameters were determined from core coal samples subjected to adsorption deformation experiments under stress conditions corresponding to the burial depth. Young’s modulus and Poisson’s ratio were obtained through triaxial compression experiments conducted under stress conditions representative of in situ conditions.

4. Results and Discussion

The permeability changes in SICRs were qualitatively analyzed, and the spatio-temporal evolution of the permeability during CBM production under different dip angles was quantitatively compared. The influence of the ES and MS on permeability was examined, highlighting the controlling effects of the dip angle on the permeability evolution. Finally, the sensitivity of permeability to variations in the reservoir mechanical properties was assessed.

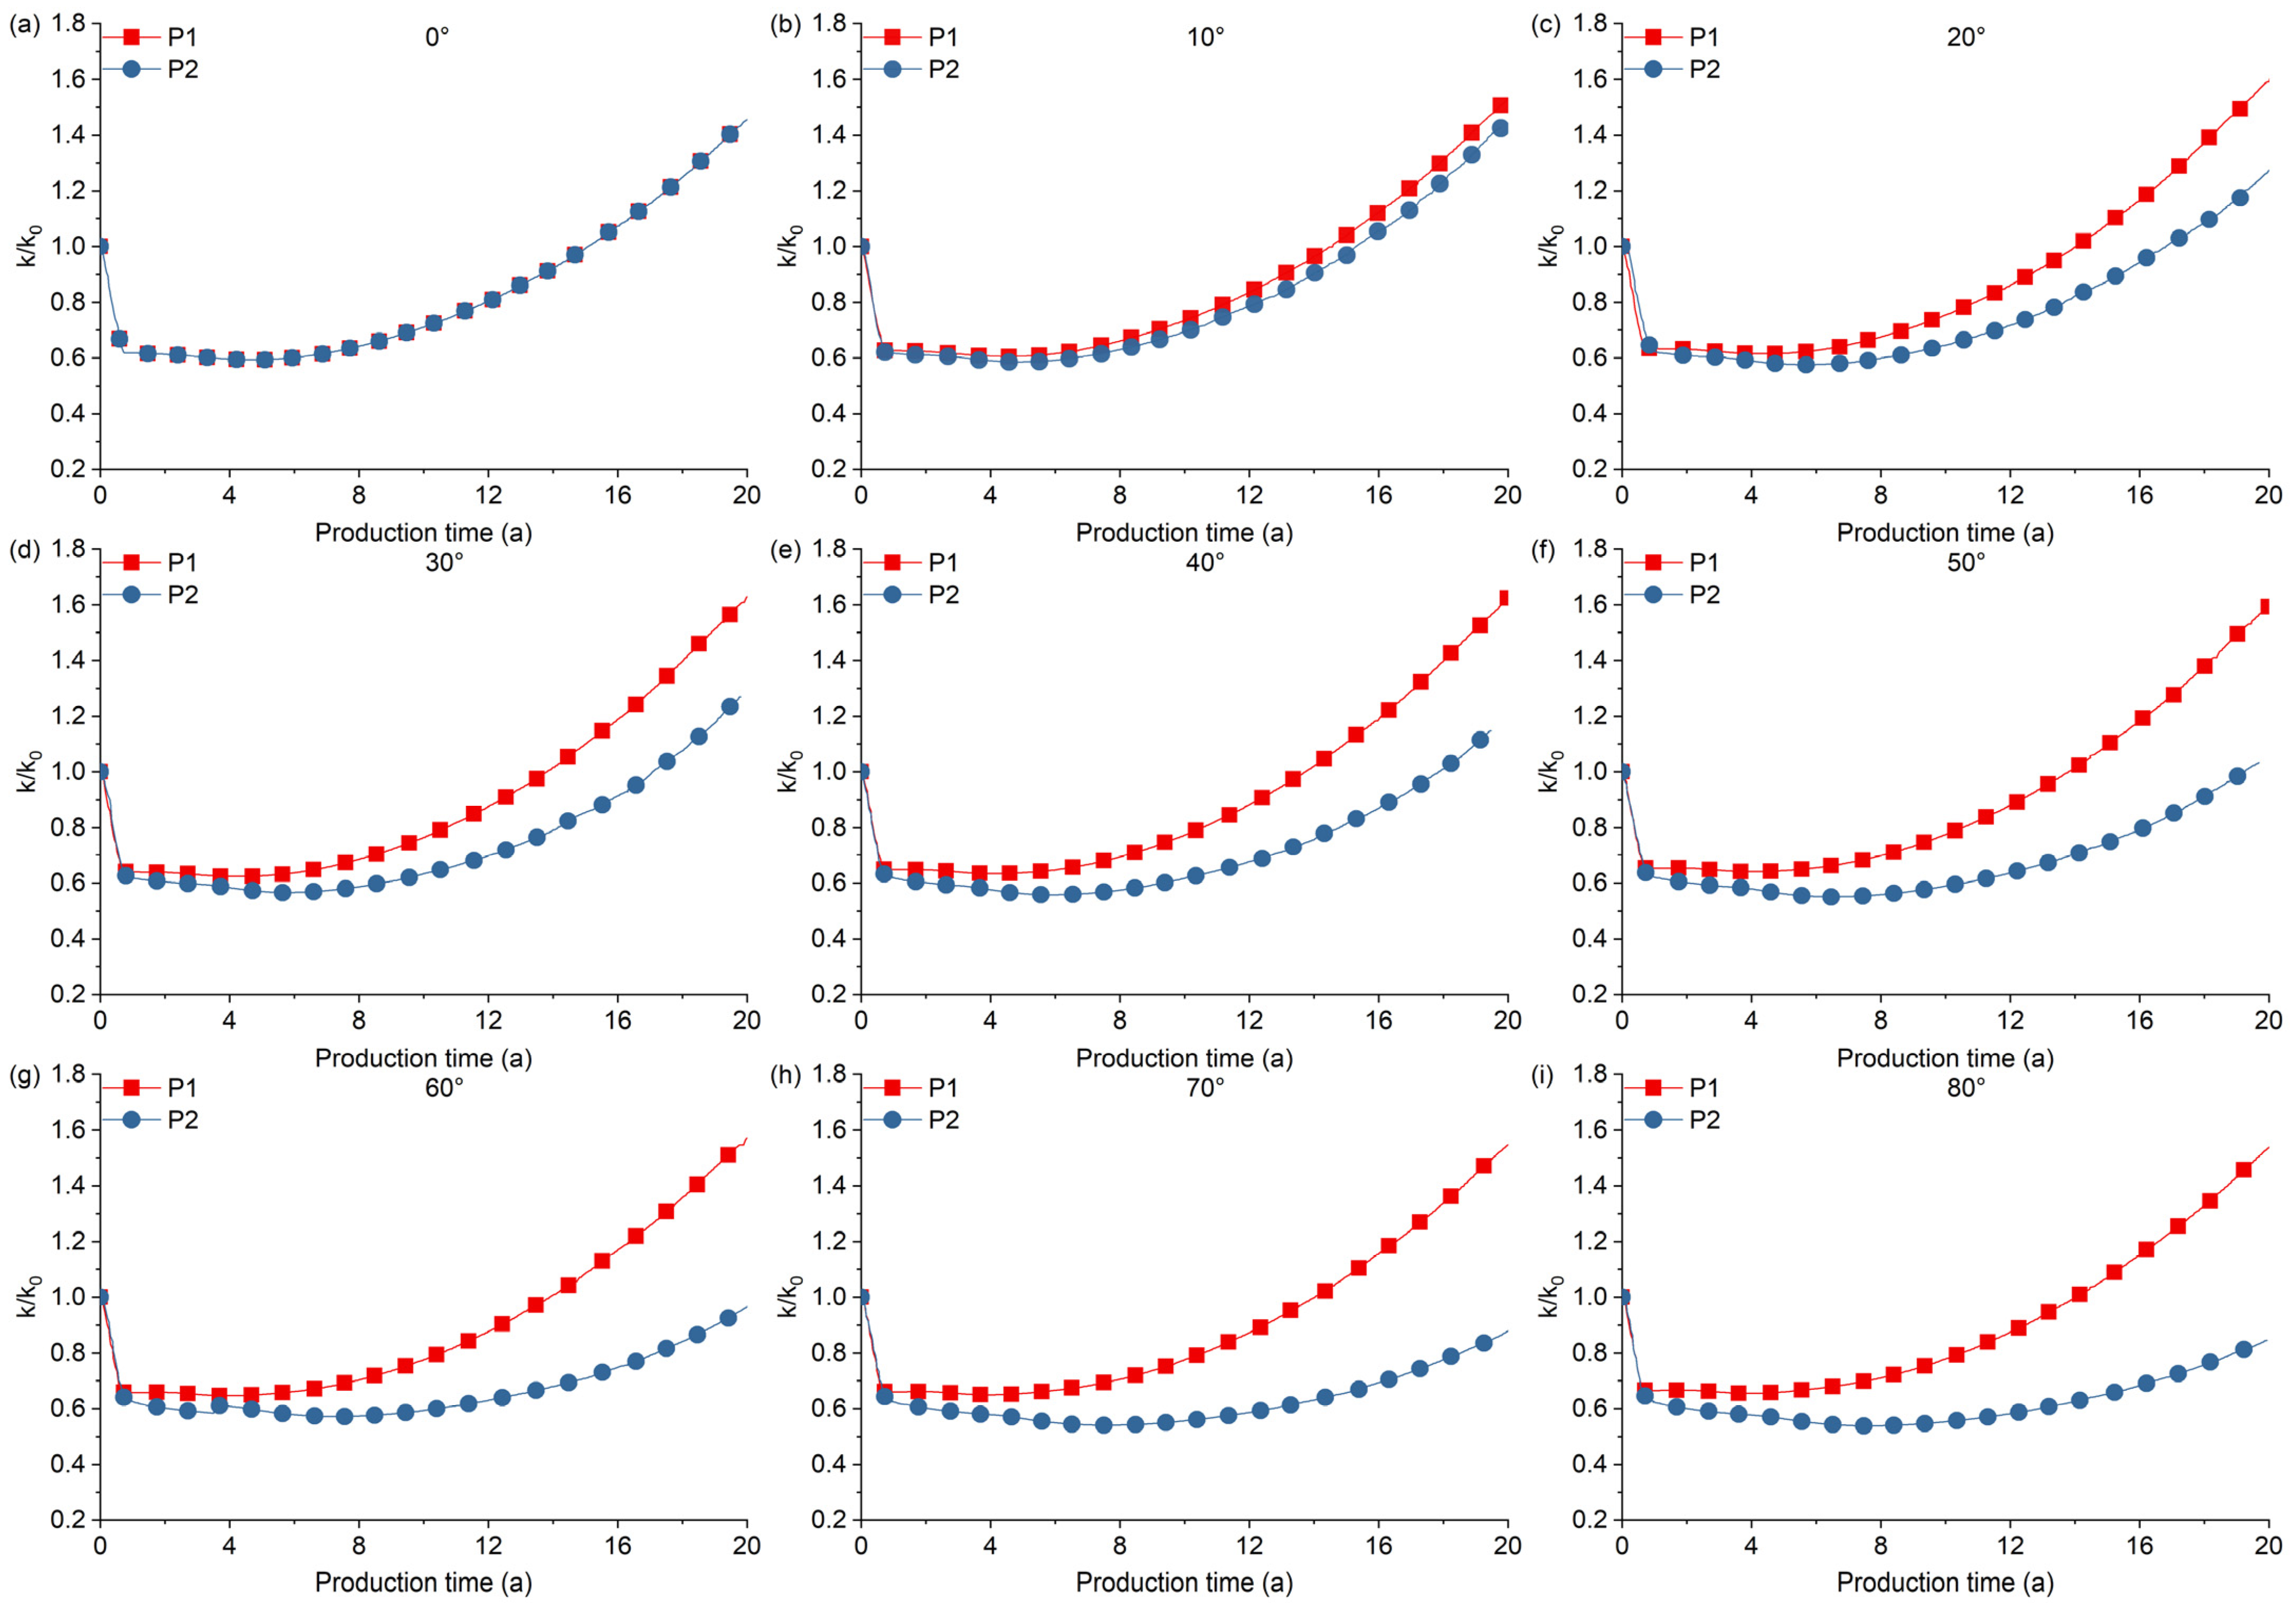
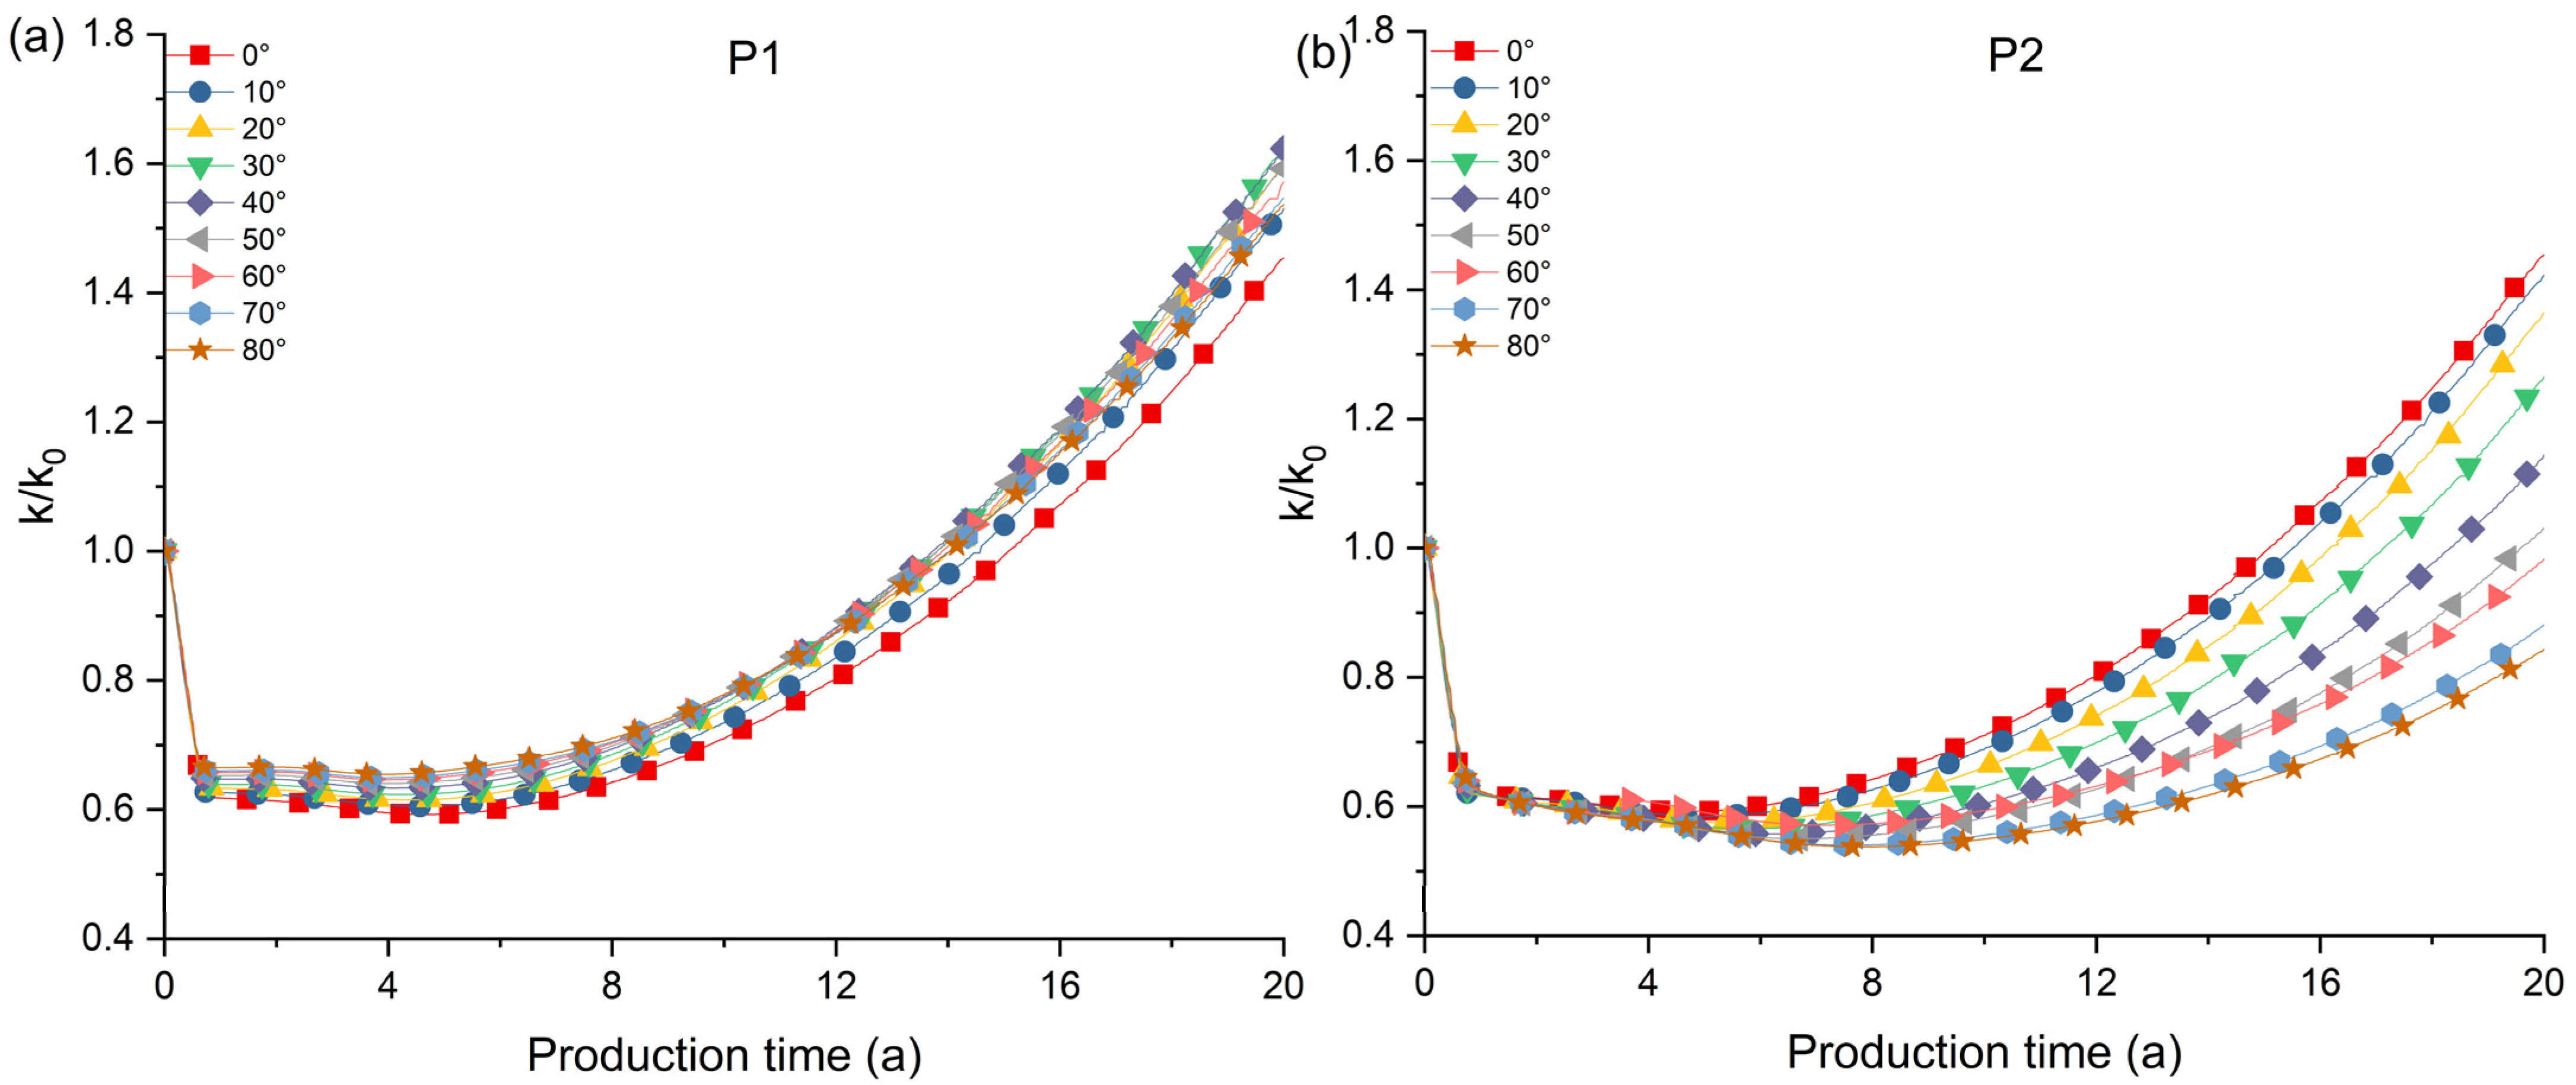
4.1. Spatio-Temporal Evolution Characteristics of Permeability in SICRs

Using a 50° dipping reservoir as a case study, the spatio-temporal evolution of permeability in SICRs was examined by analyzing the variation in the ratio of the real-time permeability (k) to the initial permeability (k0) (k/k0) (Figure 4). Prior to production, the initial k/k0 was 1. After 0.5 years of production, the rapid decline in the bottomhole pressure led to an increase in the effective stress (ES), and since methane had not yet been produced, the k/k0 at the bottomhole decreased to a minimum of 0.808. A comparison of the UD and DD directions revealed that the k/k0 in the UD was higher, but gradually became more compressed near the wellbore, while in the DD, the opposite occurred (Figure 4a). This suggests that the change in the ES in the DD was greater than in the UD, leading to a lower permeability in the DD. Additionally, the DD exhibited a synchronized overall decrease in permeability (Figure 4a), indicating that the permeability changes were more pronounced in the DD during the initial stage of production. After one year of production, the permeability continued to decrease, with more significant changes observed in the DD (Figure 4b). At this stage, methane began to desorb, and the rate of permeability decrease began to slow. The k/k0 at the bottomhole location was no longer the lowest, but the permeability continued to decline rapidly in other areas. After four years of production, the permeability at the bottomhole location rebounded significantly, reaching the highest k/k0 value. However, the permeability in other regions of both the UD and DD continued to decrease (Figure 4c). This indicates that, by this time, the methane production near the bottomhole was substantial, and the increase in permeability due to the MS outweighed the decrease caused by the ES. In other regions, the permeability was still primarily controlled by the ES.
By the seventh year of production, the permeability of the reservoir began to rise comprehensively (Figure 4d), with the rebound effect caused by methane desorption becoming dominant. A comparison between the UD and DD directions revealed that the permeability in the UD increased more, while in the DD, the increase was less pronounced and exhibited a gradient change near the bottomhole (Figure 4d), which was the opposite of the pattern observed in the first 0.5 years of production. By the 19th year of production, the permeability continued to increase and surpassed the initial value. The k/k0 at the bottomhole location reached 2.278, followed by the UD with an average k/k0 of 1.652, while the permeability in the DD remained relatively low with an average k/k0 of 1.379. This indicates that the permeability changes in SICRs are asymmetrical. During the initial stage, the permeability in the DD decreased more than in the UD. However, in the later stage, the permeability in the UD increased more, while that in the DD increased less, ultimately leading to a greater overall change in the UD compared to the DD.
To better compare the differences in permeability variations between the UD and DD, a cross-section (A-B) along the center of the wellbore was created (Figure 3). After 0.5 years of production, the permeability was in a rapid decline phase, with the k/k0 value in the UD higher than in the DD (Figure 5a). The permeability at the bottom of the well was even lower than in the UD and DD of the reservoir. After one year of production, the permeability across the entire reservoir continued to decline, but the bottom of the well no longer exhibited the lowest permeability due to the inhibition of methane desorption. After four years of production, the permeability began to rebound, with the strongest rebound occurring at the bottom of the well and being significantly greater than in the UD and DD (Figure 5a). The permeability in the UD slightly increased, while that in the DD continued to decrease, indicating that methane desorption in the DD lagged behind that in the UD. Subsequently, the permeability of the reservoir continued to increase. After 19 years of production, compared to the initial value, the permeability in the UD had increased by 1.73 times, while in the DD, it had increased by 1.45 times. By calculating the difference in the k/k0 value between the initial and final years, the annual change rate of k/k0 was obtained (Figure 5b). It was found that, during the initial decline in permeability, the DD experienced a greater decrease in permeability than the UD. However, during the rebound phase, the permeability in the UD increased more significantly, indicating that the rebound of permeability in the UD was more pronounced than in the DD.

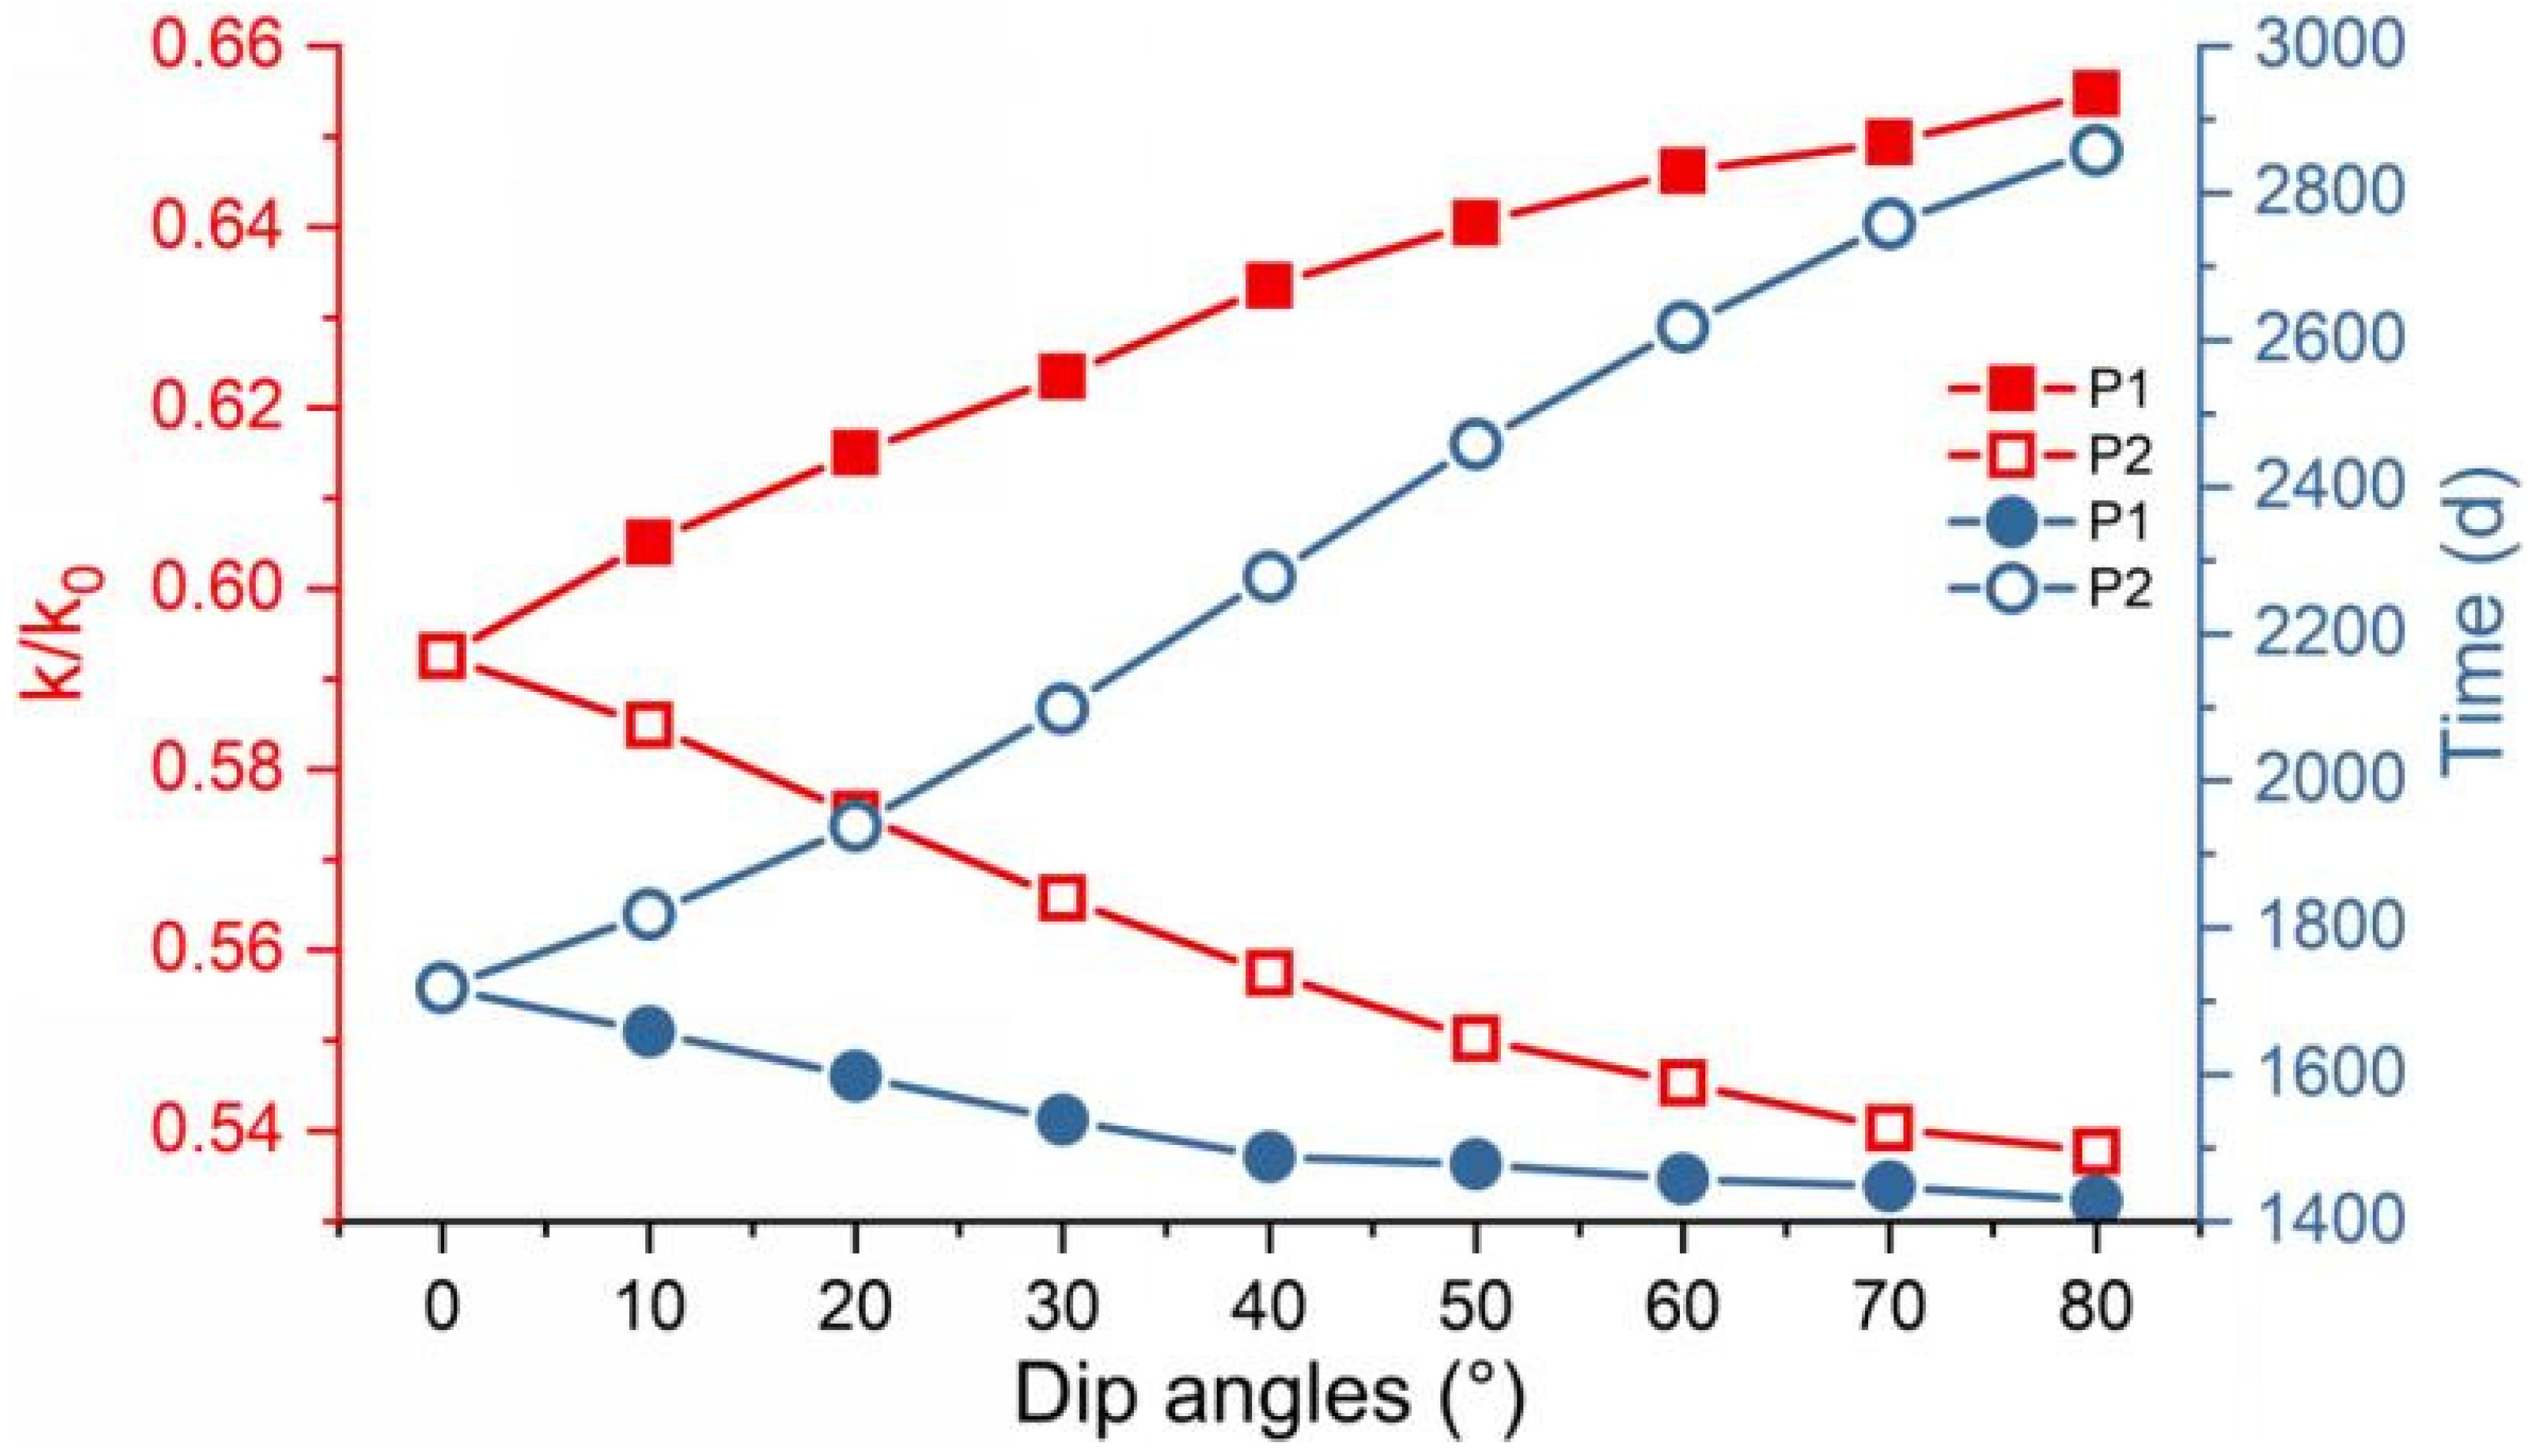
4.2. Different Characteristics of Permeability in Reservoirs with Different Dip Angles

The previous analysis provided a qualitative spatial perspective on permeability changes. To quantitatively demonstrate the differences in permeability changes between the UD and DD directions under variations in the reservoir dip angle, the ratio of the permeability (k/k0) at boundary center points P1 and P2 in the UD and DD of the reservoir was selected to quantitatively characterize these changes (Figure 6). Overall, the permeability at different dip angles exhibited a characteristic change, including a rapid decline, a slow decline, and a subsequent slow rise. These changes resulted from the combined effects of the ES and MS [6]. These three stages corresponded to distinct phases of CBM production: 1) the water production stage, where the ES increases rapidly [9], causing the permeability to decrease sharply; 2) the gas–water two-phase stage, where methane desorption leads to a slower permeability decline [29]; and 3) the stable production stage, where the permeability rises due to desorption dominating [19]. Notably, as the reservoir dip angle increased, the differences between the UD and DD in terms of permeability changes became more pronounced. This was primarily reflected in the rates of permeability decline and rise, as well as the timing of the lowest permeability value (Figure 6). For instance, in a reservoir with a 50° dip angle, the k/k0 value at point P1 decreased rapidly to 0.663 after 228 days of production, while at P2, the k/k0 value decreased to 0.684 after 288 days. The permeability at point P1 continued to decline slowly until reaching its lowest value of 0.640 after 1478 days, whereas at P2, the lowest value of 0.550 was reached after 2498 days. Subsequently, the permeability began to rise continuously, with the k/k0 values at points P1 and P2 reaching 1.592 and 1.033, respectively, after 7300 days. This demonstrates that, during the permeability decline stage, the decline in the UD was slower and shorter in duration, while in the DD, the decline was faster and longer-lasting, consistent with the trends observed in Figure 5. In the permeability rise stage, the UD experienced a faster increase in permeability, while the DD showed a slower increase.
By comparing the minimum values of k/k0 and their corresponding times for points P1 and P2 at different dip angles, it was found that, as the dip angle increased, the k/k0 value at P1 increased linearly from 0.593 at 0° to 0.655 at 80°, representing a 10.49% increase. In contrast, the k/k0 value at P2 decreased linearly by 9.25% (Figure 7). This indicates that increasing the dip angle of the reservoir reduces the permeability decline in the UD and accelerates it in the DD, with similar magnitudes of change in both directions. The corresponding times for the minimum permeability values exhibited an asymmetric distribution, with a linear relationship to the dip angle, but the rate of change was notably different (Figure 7). Specifically, the time for the minimum value at P1 in the UD decreased by 16.88% from 0° to 80°, while the corresponding time at P2 increased by 66.35%, which was approximately four times greater than the decrease at P1. This suggests that, as the dip angle increases, the disparity in permeability changes between the UD and DD becomes more pronounced. This phenomenon primarily arises from the delayed occurrence of the minimum permeability value in the DD, coupled with a larger magnitude of permeability reduction. As a result, a mismatch between permeability and time occurs, further increasing the disparity between the UD and DD.
A comparison of the results revealed that, as the dip angle increased, the change in permeability at P1 remained relatively small, exhibiting a relatively constant overall rate of change (Figure 8a). In contrast, the permeability change at P2 was more pronounced, characterized by a larger decrease in permeability and a smaller subsequent increase as the dip angle of the reservoir increased (Figure 8b). Taken together, these findings suggest that the impact of increasing the dip angle on permeability changes is more pronounced in the DD than in the UD.

4.3. Influence of Permeability Change on Gas Production

Permeability is a critical factor that influences CBM production, and its dynamic changes can significantly affect the sustained production of gas [12]. In this context, the daily gas production and its rate of variation were compared between scenarios with a constant permeability and those with a dynamic permeability (Table 2). The results showed an average growth rate of 20.14% in gas production when the permeability changed dynamically. The methane desorption MS increased the permeability, with the positive impact of the MS on permeability outweighing the negative effect of an increased ES (Figure 6). This led to an overall increase in the permeability, thereby enhancing CBM production.
The effect of dynamic permeability changes varied with the reservoir dip angle (Table 2). Overall, as the dip angle increased, the impact of dynamic permeability on the daily gas production exhibited a gradual decreasing trend. However, the reduction in daily gas production from 0° to 80° was only approximately 1%, indicating that the permeability influences the production capacity similarly across different dip angles, with no significant differences.
Previous studies have demonstrated that increasing the dip angle causes the gas production profile to transition from a single peak to a double peak due to gravitational effects in SICRs [5]. The first peak primarily originates from the UD of the inclined reservoir, while the second peak results from contributions from both the UD and DD. Consequently, the production profiles at different dip angles revealed that the dynamic evolution of permeability predominantly affects the second peak (Figure 9). When the reservoir dip angle was less than 40°, the gas production profile, although transitioning towards a double peak, primarily retained a single-peak shape. In this case, dynamic permeability changes before the peak had minimal influence on the production profile, resulting in only a slight increase in gas production (Figure 9). This occurred because the negative effect of permeability reduction due to a reservoir pressure decline was offset by the positive effect of permeability enhancement from methane desorption, leading to an overall insignificant change in the permeability (Figure 5a and Figure 6). Near the wellbore, the permeability increased rapidly, enhancing gas production. However, farther from the wellbore, the permeability decreased, reducing gas production. As a result, the overall change in gas production remained relatively small.
After the first peak, the permeability reduction caused by the ES diminished, while the permeability enhancement due to methane desorption continued to increase (Figure 5a and Figure 6), leading to higher gas production (Figure 9). Notably, for the second peak, its magnitude increased with the reservoir dip angle (Table 2); however, the overall variation remained modest, ranging from −3.16% at a 0° dip angle to 8.53% at an 80° dip angle. These findings indicate that, for reservoirs with varying dip angles, the permeability changes primarily influence the middle and later stages of CBM production—after the first peak—while exerting minimal impact on the early-stage production during the first peak.

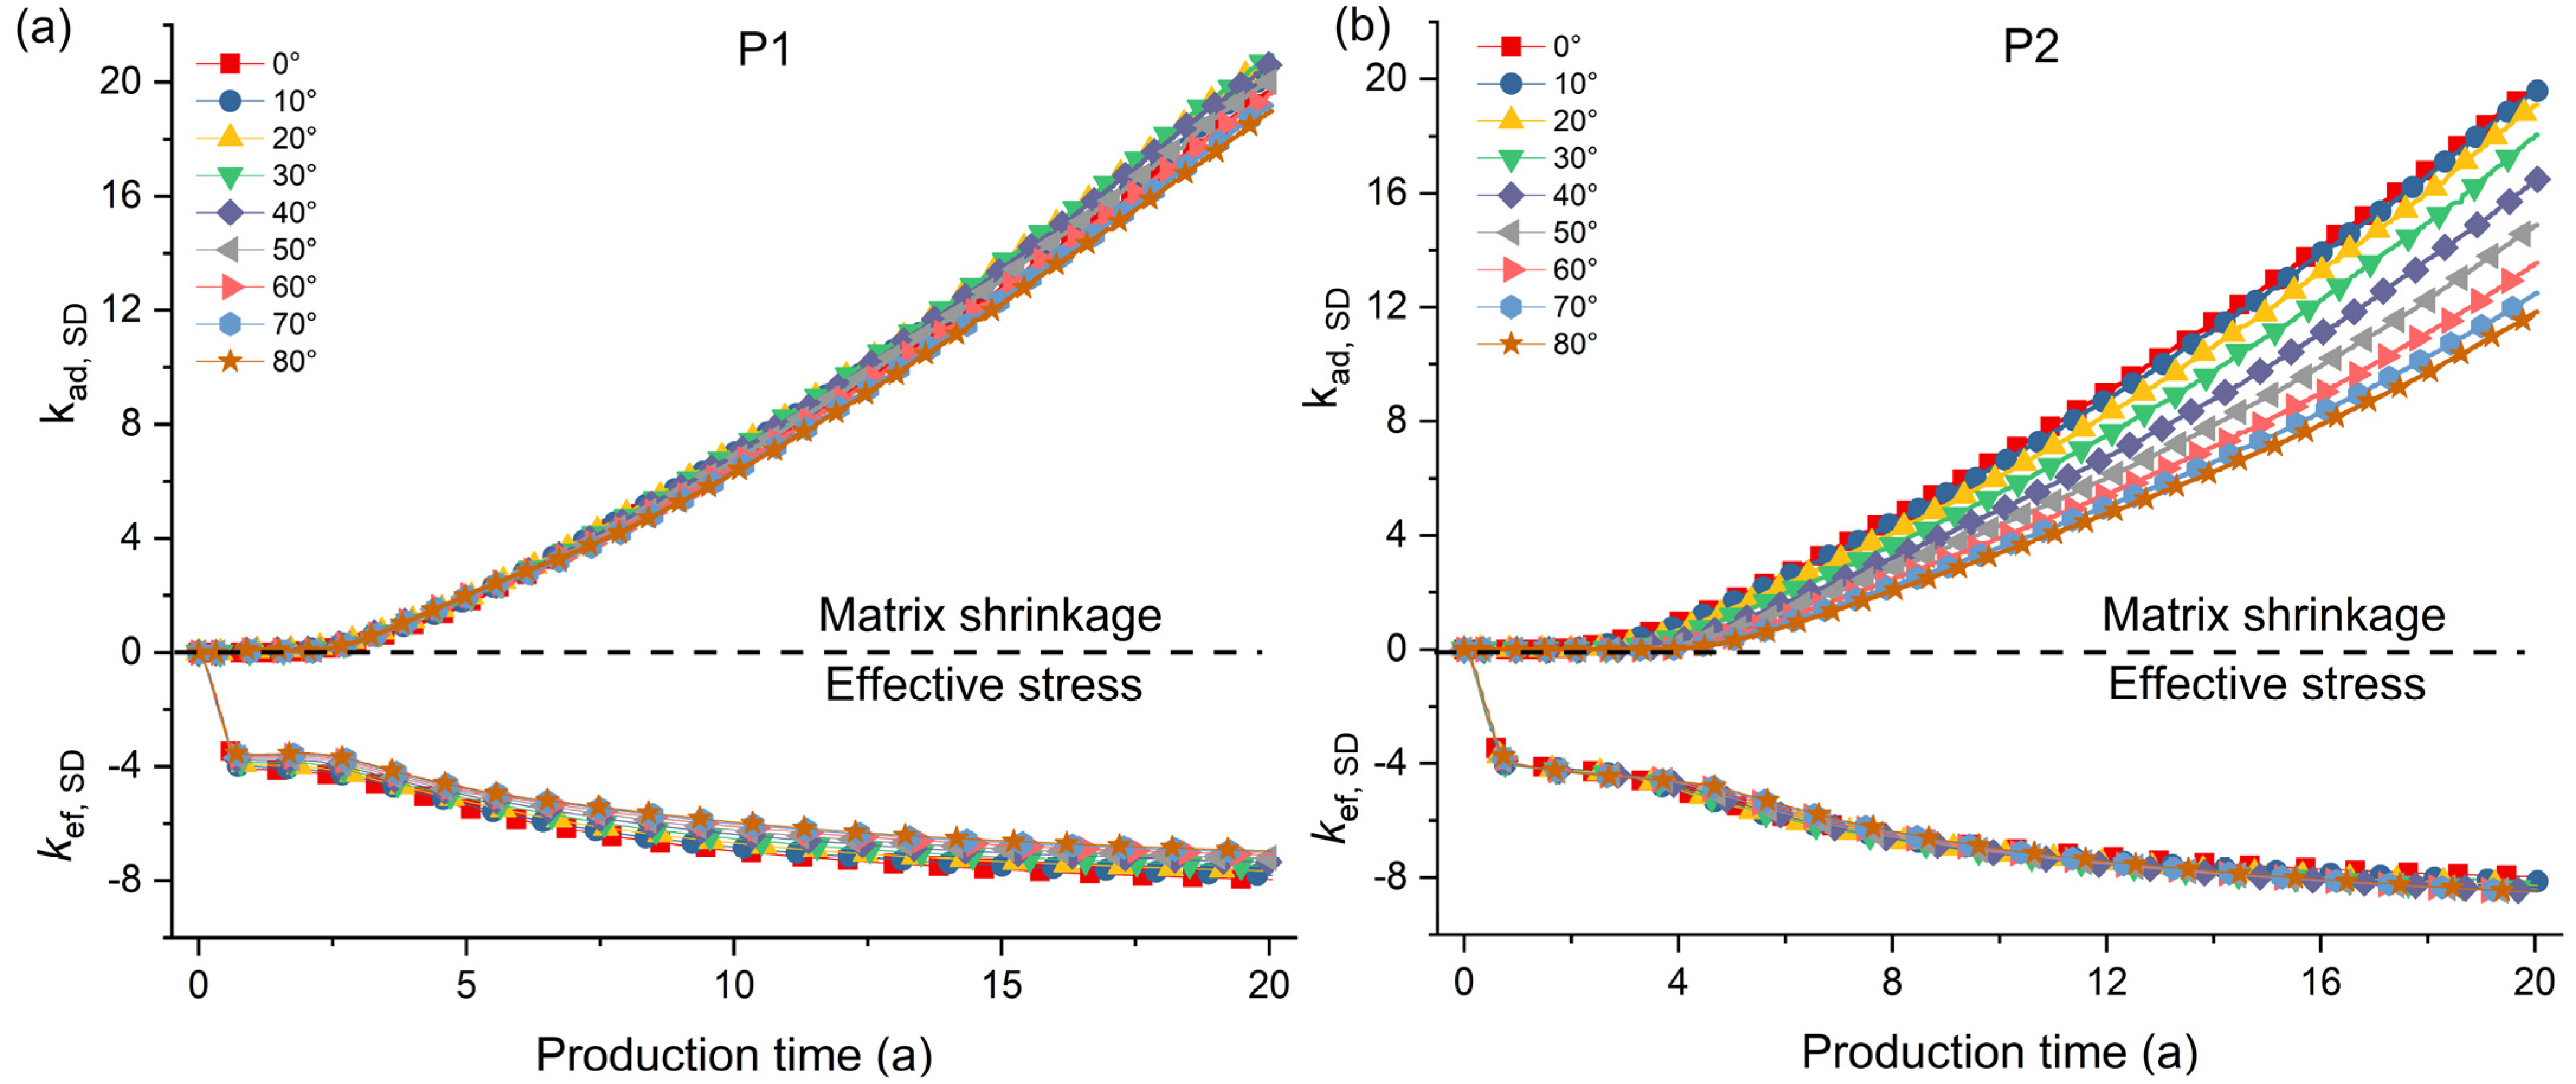
4.4. Evolution Mechanism of Permeability Difference in SICRs

The variation in the permeability during CBM production is primarily governed by the ES and MS [8]. To examine the influence of the dip angle on reservoir permeability changes, a comparative analysis was conducted on the permeability variations induced by the ES and MS at the UD (P1) and DD (P2) in a 50° SICR. According to Equation (1), permeability changes comprise three key components:
k / k 0 = [ 1 Initial   value + 1 ϕ 0 M ( p p 0 ) Stress   part + 1 ϕ 0 ( K M 1 ) ( ε β p 1 + β p ε β p c 1 + β p c ) Matrix   shrinkage   part 3
To analyze the individual contributions to permeability changes, the ES and MS components in Equation (3) were separately defined and evaluated. The permeability reduction due to the ES can be expressed as kef:
k ef = 1 ϕ 0 M ( p p 0 )
The permeability increase induced by the MS was defined as kad:
k ad = 1 ϕ 0 ( K M 1 ) ( ε β p 1 + β p ε β p c 1 + β p c )
With an increasing dip angle, the kef at P1 exhibited a gradually increasing trend (Figure 10a), while that at P2 showed a slight decrease; however, the overall variation remained negligible (Figure 10b). Unlike the permeability reduction induced by the ES, the permeability enhancement caused by the MS resulted in minor fluctuations in kad at P1 (Figure 10a), whereas kad at P2 declined sharply (Figure 10b). The average values of kef and kad over time (kefavg and kadavg) were calculated, revealing that kef at P1 increased rapidly, whereas at P2, it exhibited a slight decline with minimal overall variation (Figure 11). Conversely, kad at P1 decreased sharply, whereas the change at P2 remained relatively insignificant.
A comparison of the variations in kef at P1 and kad at P2 across different dip angles revealed that the influence of the dip angle on the ES in the UD was less significant than its effect on the MS in the DD (Figure 11). When comparing kefavg and kadavg between dip angles of 0° and 80°, kefavg at P1 increased by 13.55%, whereas kadavg at P2 decreased by 45.16%, a reduction approximately 3.3 times greater than the increase in kefavg at P1. This indicates that variations in the dip angle exert a more pronounced impact on the DD of the reservoir compared to the UD (Figure 8). The influence of permeability on gas production was primarily observed after the second peak of the gas production profile, with the peak magnitude gradually increasing (Figure 9).
Numerous permeability evolution models have been developed for CBM production, extending beyond the P&M model, which is based on the assumption of uniaxial strain and incorporates both ES and MS effects [12]. Among these models, the P&M and S&D models are particularly representative [30,31]. The P&M model accounts for porosity changes resulting from variations in the triaxial mean stress induced by water production and desorption-driven MS [21]. In contrast, the S&D model considers horizontal stress variations caused by water production and the MS, integrating these effects with an exponential stress–permeability relationship for permeability calculations [30]. Based on the S&D model, when p < pc, the relative contributions of the ES and MS to permeability evolution during CBM production can be analyzed as follows:
k / k 0 = exp 3 c f [ v 1 v ( p p 0 ) Stress   part + E 3 ( 1 v ) ( ε β p 1 + β p ε β p c 1 + β p c ) Matrix   shrinkage   part
Similar to the P&M model above, the effect of the ES on permeability is also defined as kef,SD:
k ef , SD = v 1 v ( p p 0 )
The influence of the MS is defined as kad,SD:
k a d , SD = E 3 ( 1 v ) ( ε β p 1 + β p ε β p c 1 + β p c )
The results indicate that the effects of ES variation and the MS on the permeability of SICRs, as calculated using the S&D model, are consistent with those derived from the P&M model (Figure 12). This suggests that the choice of permeability model does not significantly influence the observed trends. Specifically, the S&D model results demonstrate that reservoir dip angles exert a stronger influence on the permeability changes induced by desorption in the DD, whereas their effect in the UD is comparatively weaker. These findings align with the results presented in Figure 8. Considering these observations alongside the results in Figure 9, it is evident that the influence of the dip angle on the permeability is primarily exerted through two mechanisms: mitigating the negative impact of the ES in the UD and regulating the positive effect of the MS in the DD, with the latter exhibiting a more pronounced effect. Given that the first peak in CBM production is predominantly controlled by the UD, while the second peak and subsequent phases are influenced by both the UD and DD, permeability changes primarily impact CBM production following the second peak.
The control of the reservoir dip angle on the spatial evolution of permeability is achieved through its differential impacts on the ES and MS. This influence is reflected in the reduction in the negative effect of the ES in the UD, leading to a smaller decrease in permeability, while the effect on the MS remains relatively weak. In contrast, in the DD, reservoir inclination primarily reduces the positive effect of the MS, resulting in a more significant decrease in permeability. This phenomenon occurs because an increase in the dip angle diminishes the magnitude of the reservoir pressure change, which decreases linearly with the dip angle and has a greater effect in the DD [5]. Accordingly, as described by Eq. 6, the reduction in permeability caused by changes in the ES is directly proportional to the reservoir pressure change, which explains why the trend of kef at P1 in the UD aligns with variations in the reservoir pressure. Conversely, the permeability increase induced by the MS follows a Langmuir-type curve, where the greater MS is driven by the pressure reduction (gas desorption) as the reservoir pressure decreases. As a result, the difference in kad at P2 in the DD becomes more pronounced over time, with the effect in the DD being significantly greater than that in the UD.

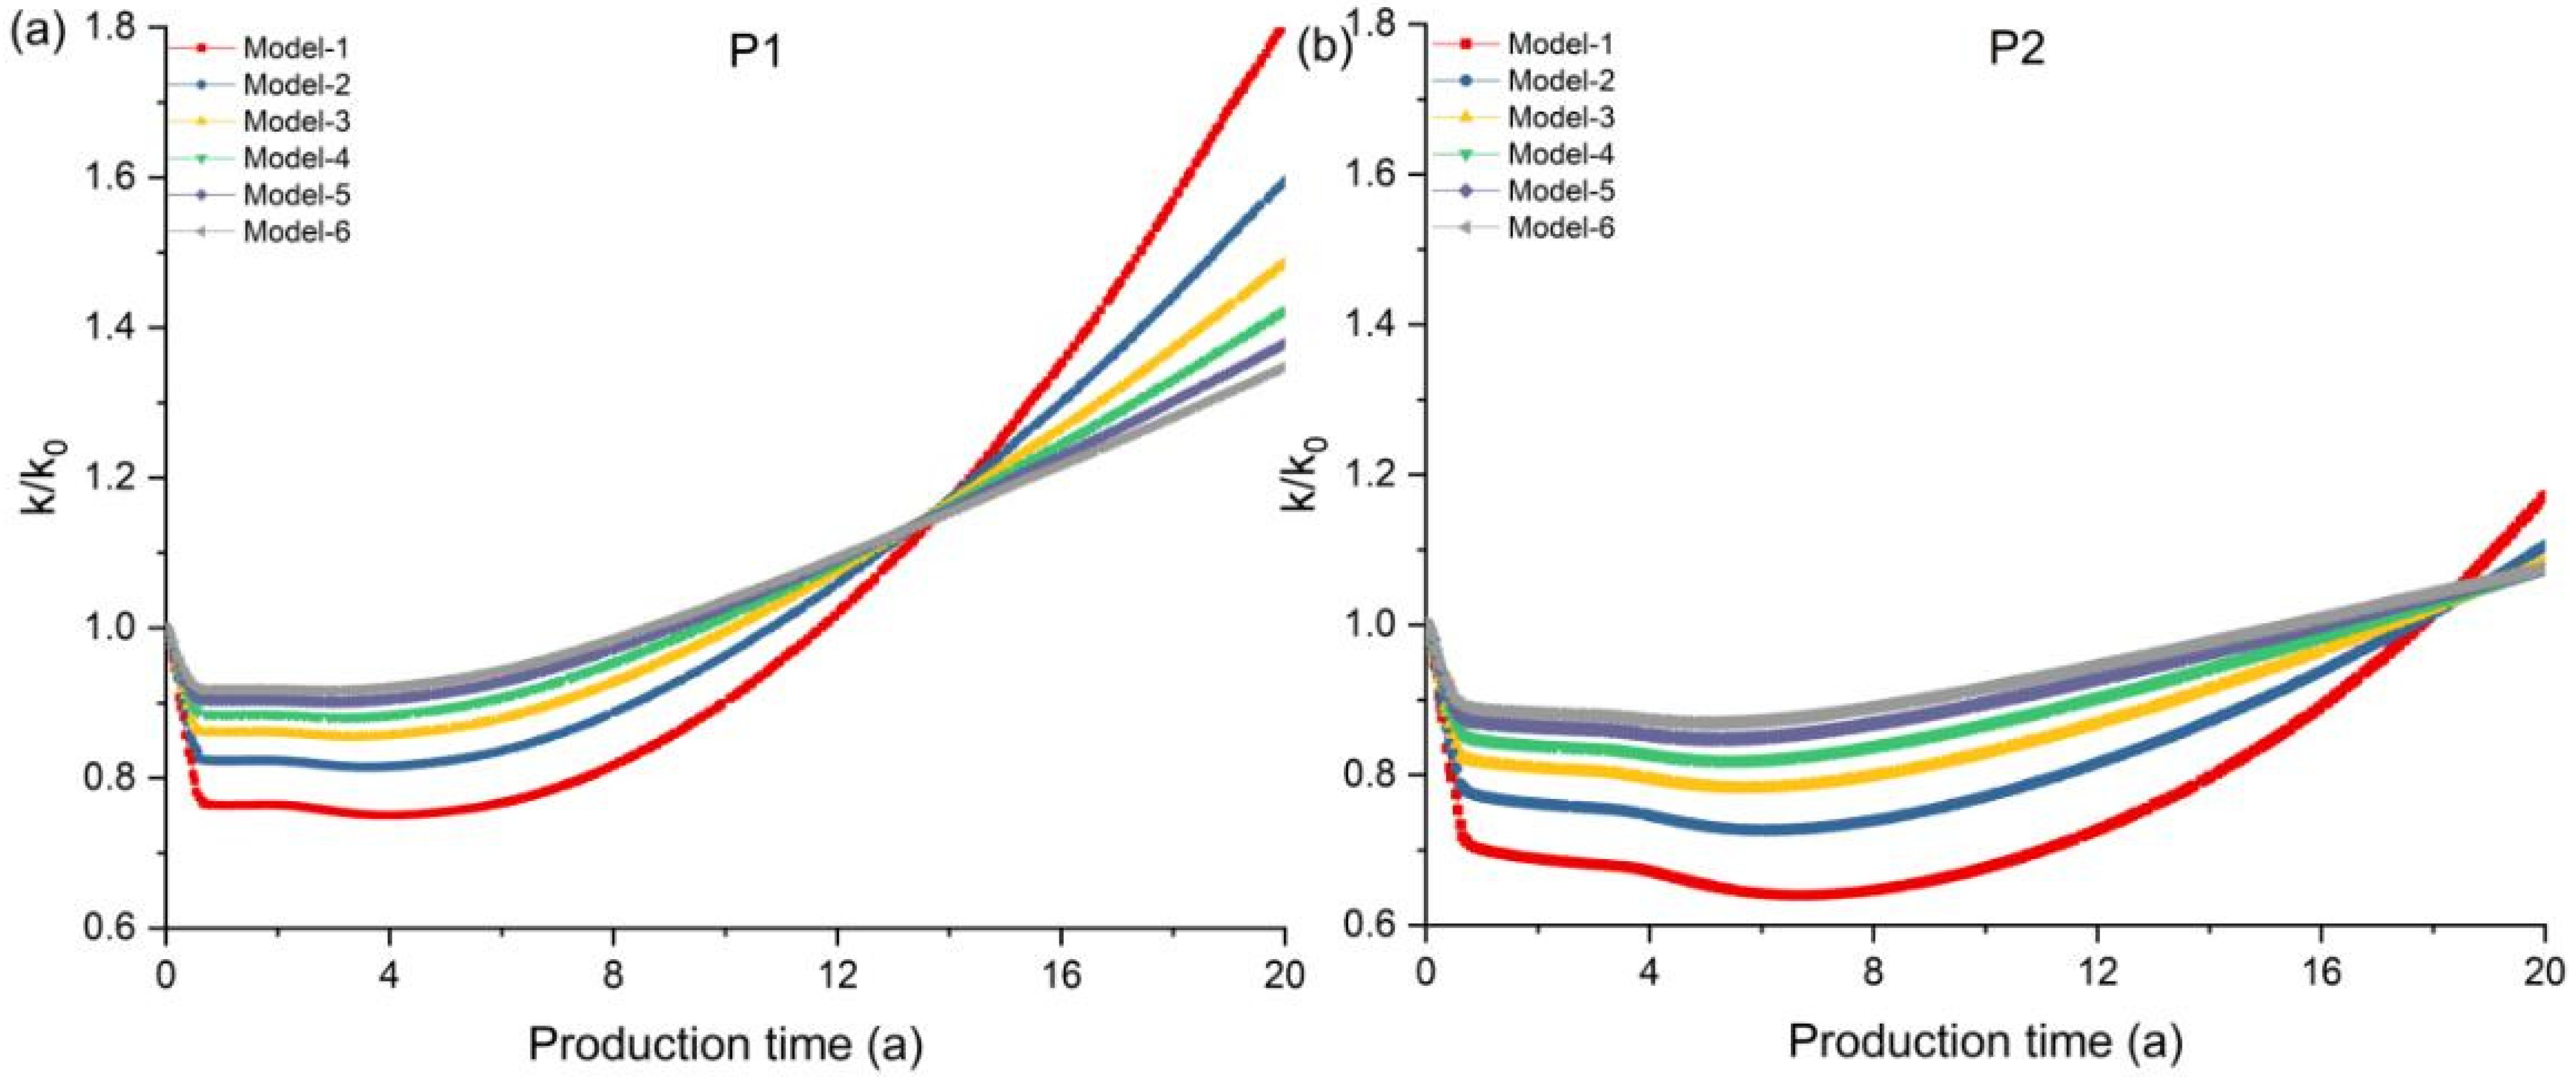
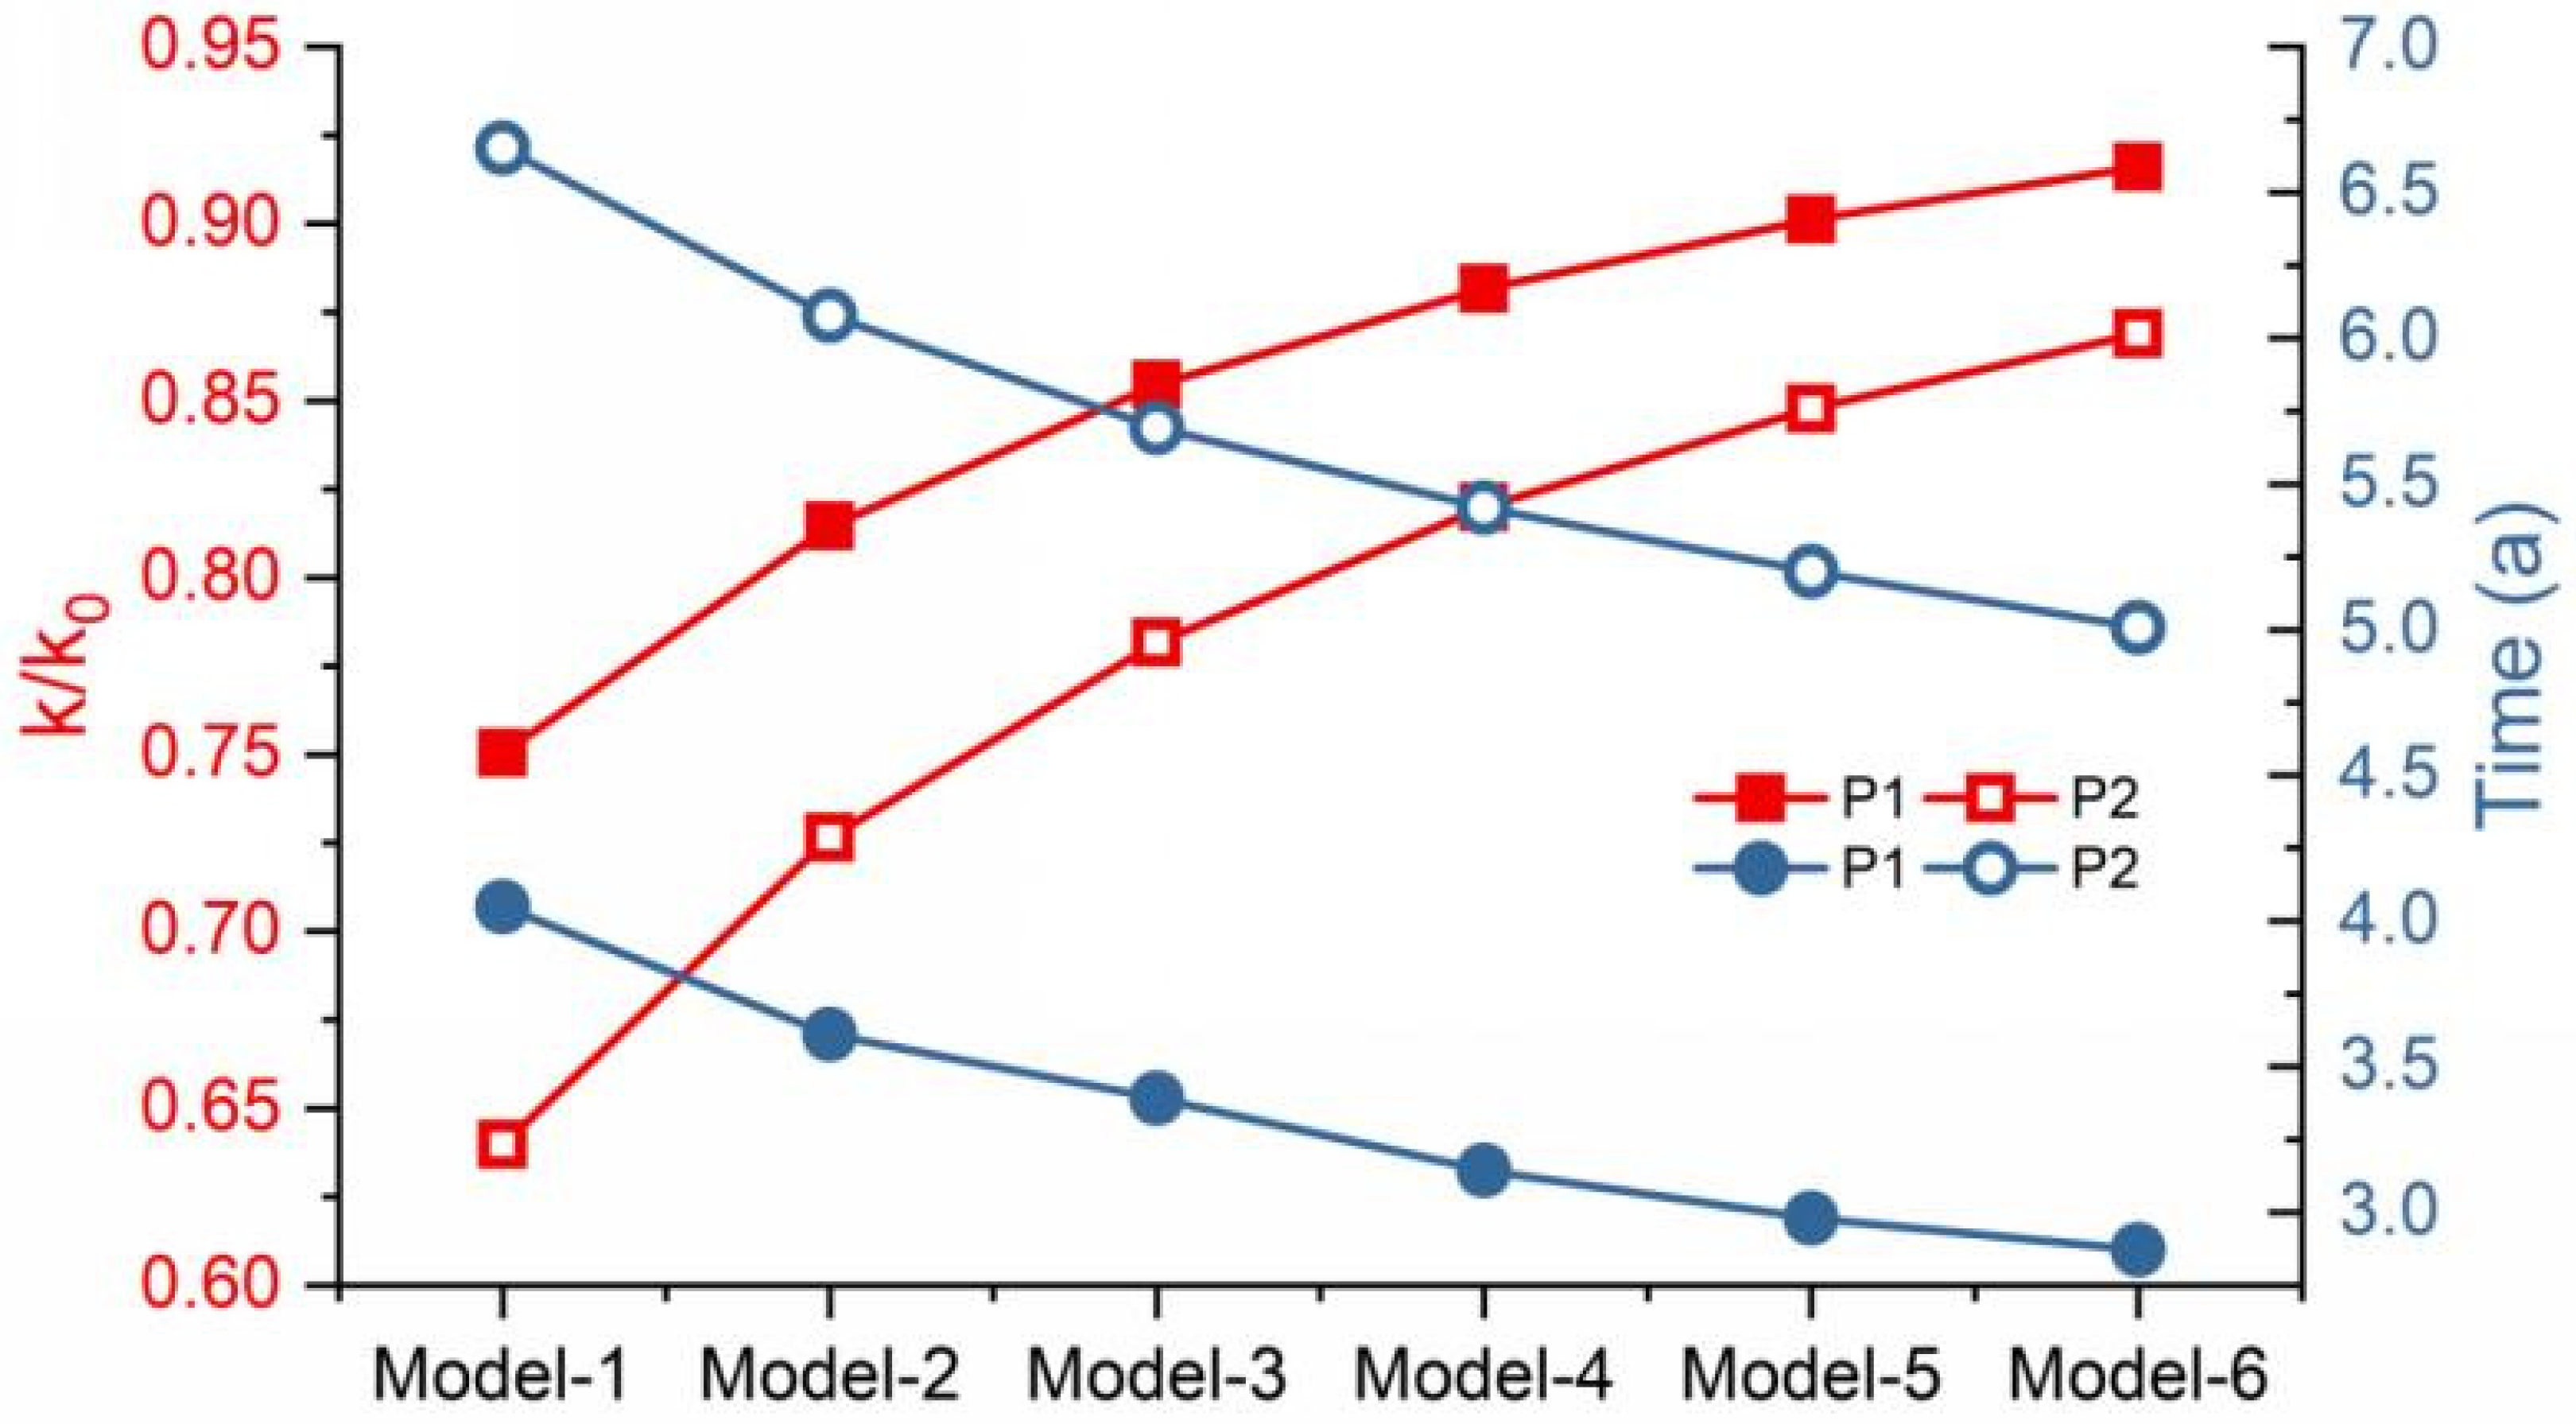
4.5. Influence of Elastic Mechanical Parameters on Permeability

In addition to pressure changes, factors that influence the magnitude of permeability changes include variations in the elastic mechanical properties (Equation (3)), particularly Young’s modulus and the adsorption strain parameter [32,33,34]. Adsorption strain refers to the elastic deformation resulting from adsorption under constant pressure, and its magnitude is inversely proportional to Young’s modulus [35]. Based on this relationship, six reservoir mechanical characteristics with varying Young’s modulus and adsorption strain parameters were designed. Six models were set up: Model-1 to Model-6. Young’s modulus and the strain were 1500 MPa/0.1704, 2000 MPa/0.1333, 2500 MPa/0.1111, 3000 MPa/0.0963, 3500 MPa/0.0857, and 4000 MPa/0.0778, respectively. Poisson’s ratio and the strain pressure were 0.42 and 0.5 MPa−1, respectively. Using a coal reservoir with a dip angle of 50° as an example, the effects of Young’s modulus and the adsorption strain parameters on the permeability were analyzed, with a focus on comparing the differences in the impacts on the UD and DD.
With CBM production, both the UD and DD permeabilities experienced significant changes (Figure 13). The primary manifestation of these changes was an increase in the elastic mechanical strength, leading to a reduction in the magnitude of both the permeability decline and rise, ultimately resulting in a tendency towards stability. The increase in coal strength indicated a smaller strain in the coal rock under the same stress change [36], which reduced the magnitude of both the permeability decrease caused by the increase in the ES and the permeability increase caused by the MS. Furthermore, there were noticeable differences between the UD and DD (Figure 14). As the elastic mechanical strength increased, the minimum permeability exhibited a trend of an initially rapid and then a slower rise, with the UD permeability showing a smaller increase compared to the DD permeability. The time required to reach the lowest permeability gradually decreased, aligning with the trend in the permeability change, with relatively small differences observed between the UD and DD (Figure 11).
To demonstrate the sensitivity of permeability to mechanical parameters, the evolution of the minimum permeability with respect to these parameters during the CBM process was calculated. In low-strength reservoirs with a Young’s modulus of less than 2000 MPa (Model-2), the permeability evolution was significantly influenced by variations in the mechanical parameters (Figure 13). However, when Young’s modulus exceeded 3500 MPa (Model-5), the impact of mechanical strength was substantially reduced (Figure 13). Taking P1 as an example, when Young’s modulus increased from 1500 MPa in Model-1 to 2000 MPa in Model-2, the permeability k/k0 increased from 0.750 to 0.815, representing an 8.7% increase. In contrast, when Young’s modulus rose from 3500 MPa in Model-5 to 4000 MPa in Model-6, the permeability k/k0 increased from 0.901 to 0.906, representing a 1.7% increase—significantly lower than in low-strength reservoirs. Therefore, in the CBM production process in SICRs, the elastic strength of coal plays a critical role in influencing the dynamic changes in permeability.

5. Conclusions

To explore the evolution characteristics of permeability and its control during coalbed methane (CBM) production in steeply inclined coal reservoirs (SICRs), numerical simulation methods were employed to investigate the permeability evolution in reservoirs with varying dip angles. The controlling factors and their effects on CBM production were identified. The results are as follows:
(1) The variation in the permeability in SICRs is asymmetric, with the magnitude of permeability changes in the up-dip direction (UD) being greater than in the down-dip direction (DD). Specifically, the permeability in the DD decreases significantly during the initial stage, while the magnitude of the permeability change in the UD is more pronounced in the middle and later stages.
(2) The dip angle of the reservoir has a greater impact on the permeability in the DD. Increasing the dip angle inhibits the permeability decrease in the UD and promotes it in the DD. It also delays the occurrence of the lowest permeability value in the DD, leading to a progressively larger difference in permeability changes between the upward and downward directions.
(3) The dip angle primarily controls the permeability of the reservoir through differential effects on the effective stress (ES) and matrix shrinkage (MS). Increasing the dip angle reduces the negative impact of the ES in the UD, leading to a smaller decrease in permeability, while it diminishes the positive effect of the MS in the DD, resulting in a greater permeability decrease.
(4) The influence of the elastic mechanical parameters on permeability is particularly evident in reservoirs with a Young’s modulus below 2000 MPa, where permeability changes are significant (8.7%). However, when Young’s modulus exceeds 3500 MPa, the impact of elasticity on permeability becomes weaker (1.7%), indicating that low-rank coal with a lower elastic mechanical strength is more sensitive to permeability changes.

Author Contributions

Conceptualization, J.K.; Methodology, J.K.; Resources, Y.W.; Data curation, C.D.; Writing—original draft, C.D.; Writing—review & editing, X.F., Y.W. and P.L.; Project administration, X.F.; Funding acquisition, J.K. All authors have read and agreed to the published version of the manuscript.

Funding

This work was supported by the National Natural Science Foundation of China (42202198, 42072190), the Natural Science Foundation of Jiangsu Province (BK20221149), Major Science and Technology Projects in Xinjiang Uygur Autonomous Region (2023A01004-3), and the Open Fund of Jiangsu Key Laboratory of Coal-based Greenhouse Gas Control and Utilization (2022KF04).

Data Availability Statement

The original contributions presented in this study are included in the article. Further inquiries can be directed to the corresponding author.

Conflicts of Interest

Authors Wang Yibing and Peng Lai were employed by the Xinjiang Yaxin Coalbed Methane Investment and Development (Group) Co., Ltd.; the remaining authors declare that this research was conducted in the absence of any commercial or financial relationships that could be construed as a potential conflict of interest.

Nomenclature

SICRsteeply inclined coal reservoirvPoisson’s ratioVgas content in wellbore
UDup-dip directionβstrain pressureVgragas content gradient
DDdown-dip directionkDk0x vs. depthVLLangmuir volume
ESeffective stressφf0porositypLLangmuir pressure
MSmatrix shrinkageτdesorption timek0xpermeability in X direction
kreal-time permeabilityεLangmuir strain constantk0ypermeability in Y direction
k0initial permeabilityβLangmuir strain constantk0ypermeability in Z direction
preservoir pressureμgdynamic viscosity of CH4Swinitial water saturation
p0initial reservoir pressureμwdynamic viscosity of waterSwrirreducible water saturation
pccritical desorption pressureHburial depthSgrresidual gas saturation
εmaximum adsorption strainhcoal thicknessηtortuosity coefficient
EYoung’s moduluspgrareservoir pressure gradientρccoal density

References

  1. Luo, X.; Wang, Z.; Zhang, L.; Yang, W.; Liu, L. Overpressure generation and evolution in a compressional tectonic setting, the southern margin of Junggar basin, northwestern China. AAPG Bull. 2007, 91, 1123–1139. [Google Scholar] [CrossRef]
  2. Li, X.; Fu, X.; Yang, X.; Ge, Y.; Quan, F. Coalbed methane accumulation and dissipation patterns: A case study of the Junggar Basin, NW China. J. Asian Earth Sci. 2018, 160, 13–26. [Google Scholar] [CrossRef]
  3. Song, Y.; Liu, H.; Hong, F.; Qin, S.; Liu, S.; Li, G.; Zhao, M. Syncline reservoir pooling as a general model for coalbed methane (CBM) accumulations: Mechanisms and case studies. J. Pet. Sci. Eng. 2012, 88, 5–12. [Google Scholar] [CrossRef]
  4. Kang, J.; Fu, X.; Gao, L.; Liang, S. Production profile characteristics of large dip angle coal reservoir and its impact on coalbed methane production: A case study on the Fukang west area, southern Junggar Basin, China. J. Pet. Sci. Eng. 2018, 171, 99–114. [Google Scholar] [CrossRef]
  5. Kang, J.; Fu, X.; Liang, S.; Li, X.; Chen, X.; Wang, Z. A numerical simulation study on the characteristics of the gas production profile and its formation mechanisms for different dip angles in coal reservoirs. J. Pet. Sci. Eng. 2019, 181, 106198. [Google Scholar] [CrossRef]
  6. Pan, Z.; Connell, L.; Camilleri, M. Laboratory characterisation of coal reservoir permeability for primary and enhanced coalbed methane recovery. Int. J. Coal Geol. 2010, 82, 252–261. [Google Scholar] [CrossRef]
  7. Pan, Z.; Connell, L. Modelling of anisotropic coal swelling and its impact on permeability behaviour for primary and enhanced coalbed methane recovery. Int. J. Coal Geol. 2011, 85, 257–267. [Google Scholar] [CrossRef]
  8. Liu, J.; Chen, Z.; Elsworth, D.; Miao, X.; Mao, X. Evolution of coal permeability from stress-controlled to displacement-controlled swelling conditions. Fuel 2011, 90, 2987–2997. [Google Scholar] [CrossRef]
  9. Tao, S.; Wang, Y.; Tang, D.; Xu, H.; Lv, Y.; He, W.; Li, Y. Dynamic variation effects of coal permeability during the coalbed methane development process in the Qinshui Basin, China. Int. J. Coal Geol. 2012, 93, 16–22. [Google Scholar] [CrossRef]
  10. Liang, S.; Han, H.; Elsworth, D.; Fu, X.; Yao, Q.; Kang, J.; Li, X.; Li, X. Evolution of production and transport characteristics of steeply-dipping ultra-thick coalbed methane reservoirs. Energies 2020, 13, 5081. [Google Scholar] [CrossRef]
  11. Qin, Q.; Li, X.; Peng, R.; Peng, S.; Liu, Y.; Zhou, X.; Yang, J. Coalbed methane reservoir dynamic simulation comparisons using the actual steeply inclined model and ideal steeply inclined model. Front. Earth Sci. 2022, 10, 999516. [Google Scholar] [CrossRef]
  12. Pan, Z.; Connell, L. Modelling permeability for coal reservoirs: A review of analytical models and testing data. Int. J. Coal Geol. 2012, 92, 1–44. [Google Scholar] [CrossRef]
  13. Eclipse. User’s Guide and Reference Guide; Eclipse Version 2013; Eclipse: Brussels, Belgium, 2013. [Google Scholar]
  14. CMG. User’s Guide and Reference Guide; CMG Version 2019; CMG: Beijing, China, 2019. [Google Scholar]
  15. Robertson, E.; Christiansen, R. A permeability model for coal and other fractured, sorptive-elastic media. SPE J. 2008, 13, 314–324. [Google Scholar] [CrossRef]
  16. Meng, Y.; Liu, S.; Li, Z. Experimental study on sorption induced strain and permeability evolutions and their implications in the anthracite coalbed methane production. J. Pet. Sci. Eng. 2018, 164, 515–522. [Google Scholar] [CrossRef]
  17. Wu, Y.; Liu, J.; Elsworth, D.; Miao, X.; Mao, X. Development of anisotropic permeability during coalbed methane production. J. Nat. Gas Sci. Eng. 2010, 2, 197–210. [Google Scholar] [CrossRef]
  18. Zou, M.; Wei, C.; Yu, H.; Song, L. Modeling and application of coalbed methane recovery performance based on a triple porosity/dual permeability model. J. Nat. Gas Sci. Eng. 2015, 22, 679–688. [Google Scholar] [CrossRef]
  19. Sun, Z.; Shi, J.; Zhang, T.; Wu, K.; Feng, D.; Sun, F.; Huang, L.; Hou, C.; Li, X. A fully-coupled semi-analytical model for effective gas/water phase permeability during coal-bed methane production. Fuel 2018, 223, 44–52. [Google Scholar] [CrossRef]
  20. Pashin, J. Variable gas saturation in coalbed methane reservoirs of the black warrior basin: Implications for exploration and production. Int. J. Coal Geol. 2010, 82, 135–146. [Google Scholar] [CrossRef]
  21. Palmer, I.; Mansoori, J. How permeability depends on stress and pore pressure in coalbeds: A new model. In Proceedings of the SPE Annual Technical Conference and Exhibition, Denver, CO, USA, 6–9 October 1996. [Google Scholar] [CrossRef]
  22. Fan, C.; Elsworth, D.; Li, S.; Zhou, L.; Yang, Z.; Song, Y. Thermo-hydro-mechanical- chemical couplings controlling CH4 production and CO2 sequestration in enhanced coalbed methane recovery. Energy 2019, 173, 1054–1077. [Google Scholar] [CrossRef]
  23. Fan, C.; Elsworth, D.; Li, S.; Chen, Z.; Luo, M.; Song, Y.; Zhang, H. Modelling and optimization of enhanced coalbed methane recovery using CO2/N2 mixtures. Fuel 2019, 253, 1114–1129. [Google Scholar] [CrossRef]
  24. Omotilewa, O.; Panja, P.; Vega-Ortiz, C.; McLennan, J. Evaluation of enhanced coalbed methane recovery and carbon dioxide sequestration potential in high volatile bituminous coal. J. Nat. Gas Sci. Eng. 2021, 91, 103979. [Google Scholar] [CrossRef]
  25. Wang, J.; Kabir, A.; Liu, J.; Chen, Z. Effects of non-Darcy flow on the performance of coal seam gas wells. Int. J. Coal Geol. 2012, 93, 62–74. [Google Scholar] [CrossRef]
  26. Ostojic, J.; Rezaee, R.; Bahrami, H. Production performance of hydraulic fractures in tight gas sands, a numerical simulation approach. J. Pet. Sci. Eng. 2012, 88, 75–81. [Google Scholar] [CrossRef]
  27. Salmachi, A.; Sayyafzadeh, M.; Haghighi, M. Infill well placement optimization in coal bed methane reservoirs using genetic algorithm. Fuel 2013, 111, 248–258. [Google Scholar] [CrossRef]
  28. Herckenrath, D.; Doherty, J.; Panday, S. Incorporating the effect of gas in modelling the impact of CBM extraction on regional groundwater systems. J. Hydrol. 2015, 523, 587–601. [Google Scholar] [CrossRef]
  29. Sayyafzadeh, M.; Keshavarz, A.; Alias, A.; Dong, K.; Manser, M. Investigation of varying-composition gas injection for coalbed methane recovery enhancement: A simulation-based study. J. Nat. Gas Sci. Eng. 2015, 27, 1205–1212. [Google Scholar] [CrossRef]
  30. Moore, T. Coalbed methane: A review. Int. J. Coal Geol. 2012, 101, 36–81. [Google Scholar] [CrossRef]
  31. Shi, J.; Durucan, S. A model for changes in coalbsed permeability during primary and enhanced methane recovery. SPE Reserv. Eval. Eng. 2005, 8, 291–299. [Google Scholar] [CrossRef]
  32. Shi, J.; Durucan, S. Modelling laboratory horizontal stress and coal permeability data using S&D permeability model. Int. J. Coal Geol. 2014, 131, 172–176. [Google Scholar] [CrossRef]
  33. Cui, X.; Bustin, R. Volumetric strain associated with methane desorption and its impact on coalbed gas production from deep coal seams. AAPG Bull. 2005, 89, 1181–1202. [Google Scholar] [CrossRef]
  34. Palmer, I. Coalbed methane completions: A world view. Int. J. Coal Geol. 2010, 82, 184–195. [Google Scholar] [CrossRef]
  35. An, F.; Cheng, Y.; Wang, L.; Li, W. A numerical model for outburst including the effect of adsorbed gas on coal deformation and mechanical properties. Comput. Geotech. 2013, 54, 222–231. [Google Scholar] [CrossRef]
  36. Moffat, D.; Weale, K. Sorption by coal of methane at high pressures. Fuel 1955, 34, 449–462. [Google Scholar]
Figure 1. Local stratigraphic profile and dip angle of coal reservoir in different areas in the southern margin of the Junggar Basin, Xinjiang, China.
Processes 13 01147 g001
Figure 2. Well location and topographic distribution in Fukang west area.
Processes 13 01147 g002
Figure 3. Grid model of CBM reservoirs with different dip angles.
Processes 13 01147 g003
Figure 4. Contour map of the k/k0 in the CBM production of a 50° dip reservoir.
Processes 13 01147 g004
Figure 5. Permeability ratio (k/k0) change (a) and permeability ratio annual change rate (b) of inclined section during production of 50° dip reservoir.
Processes 13 01147 g005
Figure 6. Comparison of k/k0 changes in P1 and P2 of reservoirs with different dip angles during drainage and production.
Processes 13 01147 g006
Figure 7. The minimum value and corresponding time of k/k0 in the UD P1 and DD P2 directions of reservoirs with different dip angles.
Processes 13 01147 g007
Figure 8. Comparison of permeability changes during drainage and production in UD P1 and DD P2 directions of reservoirs with different dip angles.
Processes 13 01147 g008
Figure 9. Evolution of gas production profiles under constant and dynamic permeability of reservoirs with different dip angles.
Processes 13 01147 g009
Figure 10. Comparison of ES and MS changes between P1 and P2.
Processes 13 01147 g010
Figure 11. Changes in kef and kad of P1 and P2 under different dip angles.
Processes 13 01147 g011
Figure 12. Comparison of ES and MS changes between P1 and P2 using S&D permeability model.
Processes 13 01147 g012
Figure 13. Change characteristics of reservoir permeability in P1 and P2 under different mechanical parameters.
Processes 13 01147 g013
Figure 14. Minimum value and corresponding time of reservoir permeability in P1 and P2 under different mechanical parameters.
Processes 13 01147 g014
Table 1. Input parameters of numerical simulation.
ParameterUnitValueParameterUnitValue
Hm1143τd10
hm17.6ε10.17
pMPa11.8βMPa−10.5
pgraMPa/m0.01μgPa·s1.03 × 10−5
Vm3/t9.61μwPa·s1.01 × 10−3
Vgram3/t/m0.0032Sw11.0
VLm3/t15.71Swr10.3
pLMPa3.29Sgr10
k0xmD0.205η12.5
k0ymDk0xρckg/m31350
k0ymDk0x/10EMPa1493
kDmDk0x = 18,750 × e−0.008 × Hv10.42
φf010.0423
Table 2. Average daily gas production of reservoirs with different dip angles.
Dip Angle/°01020304050607080Avg
ADGP-C/m31665168616991696167816531628160615911656
ADGP-D/m32006202820452042201919861952192319031989
Change rate/%20.4920.2920.3720.4020.3420.1519.9119.7019.5720.14
Peak-C/m33509352234513312311529072715260024793081
Peak-D/m33398342834093324317830212874276426903120
Change rate/%−3.16−2.65−1.220.362.053.905.876.298.532.22
Note: ADGP-C means average daily gas production with constant permeability; ADGP-D means average daily gas production with dynamic permeability; Peak-C means peak value of daily gas production with constant permeability; and Peak-D means peak value of daily gas production with dynamic permeability.
Disclaimer/Publisher’s Note: The statements, opinions and data contained in all publications are solely those of the individual author(s) and contributor(s) and not of MDPI and/or the editor(s). MDPI and/or the editor(s) disclaim responsibility for any injury to people or property resulting from any ideas, methods, instructions or products referred to in the content.

