Article

Evolutionary Mechanisms of Deep Coal Rock Chemical Structures Under Various Pre-Fracturing Fluids

1
School of Petroleum Engineering, Xi’an Shiyou University, Xi’an 710065, China
2
Engineering Research Center of Development and Management for Low to Ultra-Low Permeability Oil & Gas Reservoirs in West China, Ministry of Education, Xi’an 710065, China
3
Department of Chemical and Petroleum Engineering, University of Calgary, Calgary, AB T2N 1N4, Canada
*
Authors to whom correspondence should be addressed.
Processes 2025, 13(4), 1166; https://doi.org/10.3390/pr13041166
Submission received: 12 March 2025 / Revised: 6 April 2025 / Accepted: 9 April 2025 / Published: 11 April 2025
(This article belongs to the Section Energy Systems)

Abstract

:
Hydraulic fracturing is an effective method for enhancing coalbed methane (CBM) recovery. The injected fluids affect the chemical and physical structures of coal, resulting in diverse stimulation effects. While most current research primarily focuses on alterations in pore-fracture structures, few studies have examined or compared the changes in chemical structures during the fracturing process. This study presents a comparative analysis of the effects of five types of pre-fracturing fluids—slick water, acid solutions, and oxidant solutions—on coal, with the aim of identifying the similarities and differences in how these fluids modify the chemical structure of coal. The results indicate that, after being treated by five pre-fracturing fluids, the aromaticity index (I) increased, and the degree of aromatic condensation polymerization (DOC) decreased. The length of the aliphatic chain (L) increased after being treated by PAM but decreased after being treated by acids and oxidizers. Additionally, the graphitization (g) of all coal samples increased. Among the treatments, the combined acid system of hydrochloric acid (HCl) and hydrofluoric acid (HF) demonstrated a more pronounced effect on enhancing aromaticity and graphitization of the microcrystalline structure compared to HCl alone. Sodium hypochlorite (NaClO) had the most significant impact on the ordering of the macromolecular structure, while hydrogen peroxide (H2O2) exerted the most pronounced effect on the graphitization of the microcrystalline structure. These findings contribute to a deeper understanding of the interaction mechanisms between fracturing fluids and coal, providing theoretical support for the efficient development of CBM.

1. Introduction

Coalbed methane (CBM) is a gas that is generated within coalbeds and primarily depositing in adsorption [1]. The geological resources of CBM are abundant with more than 268 × 1012 m3 distributed globally. More than 50% of in-place CBM are found in coalbeds at depths exceeding 1524 m (5000 feet) [2]. In 2023, global CBM production reached approximately 700 × 108 m3 [3]. The relatively low development rate of CBM is largely due to the poor permeability and high gas adsorption capacity of coal [1,4].
Hydraulic fracturing is a crucial technology for CBM development [5]. The injection of large volumes of fluid during the process induces chemical reactions with coal, significantly altering its chemical and physical structures. These modifications influence gas desorption [6,7,8] and affect the mechanical properties of coal [9], ultimately impacting CBM stimulation and gas production. Currently, most research focuses on changes in the pore-fracture structures and mechanical properties of coal while overlooking the primary cause of these transformations: alterations in coal’s chemical structure.
The chemical structure of coal is highly complex, as illustrated in Figure 1. A significant number of condensed aromatic rings, which exhibit structural similarities but are not identical, constitute the nucleus of the basic structural unit of coal. Additional functional groups, side chains, and heterocycles are attached to the nucleus of these basic structural units via bridge bonds, forming coal macromolecules. Small molecular compounds are embedded within the large molecular networks. Some macromolecules in coal are organized into aromatic layers that resemble graphite structures. These aromatic layers exhibit both short-range disordered and long-range ordered arrangements, contributing to the microcrystalline structure of coal [10,11].
Slick water is the most commonly used fracturing fluid in coal fracturing due to its high efficiency and low cost. Acrylamide polymers are the most frequently used additives in this field. However, no relevant research has yet examined their impact on the chemical structure of coal.
Acidification is considered an effective method to enhance CBM recovery [12]. The effectiveness of acidification depends on the type and concentration of acids as well as the coal type [13]. Zhang’s study demonstrated that acid treatment influences the microcrystalline structure of coal and enhances the aromaticity of coal samples from the Taifeng Coal Mine in China. The ratio of various functional groups changed, and the arrangement of carbon atoms became more orderly after treatment with hydrochloric acid (HCl). However, HCl had minimal impact on the chemical composition of organic matter, inorganic minerals, and other components [14]. Hydrofluoric acid (HF) can dissolve kaolinite and improve coal permeability [15]. HF primarily destroyed the lamellae along the crystal diameter and had a favorable effect on the aliphatic and aromatic groups, but a minimal effect on the hydroxyl groups [16]. However, Larsen et al. concluded that HCl/HF had little effect on the macromolecular structure of coal, with the primary effect resulting from ion exchange and the removal of minerals [17]. Coal type also influences acid sensitivity, with bituminous coal exhibiting higher sensitivity than anthracite [18].
The oxidation method enhances permeability by dissolving organic matter around coalbed cleavages through oxidation reactions. Coal samples exposed to oxidizing fluids were observed to dissolve, swell, and break down, depending on the specific oxidant and its concentration [19]. Sodium hypochlorite (NaClO) solution has been shown to promote aromatic structure decomposition at the coal surface, forming oxygen-containing functional groups [20]. The aliphatic chains and aromatic rings in coal were oxidized after treatment with NaClO, leading to lower aromaticity, longer aliphatic chains, and increased oxygen content [21,22]. Subbituminous coal from the Bowen and Surat basins in Queensland, Australia reacted more vigorously to NaClO than bituminous coal [23]. Hydrogen peroxide (H2O2) has a stronger oxidation capacity than NaClO and can degrade the macromolecular structure of coal [24]. However, Jing’s research showed that the intensity of the reaction between H2O2 and coal was weaker than that of NaClO [25].
As discussed above, different fracturing fluids exert varying effects on the chemical structure of coal, and some results are even inconsistent. Coal samples from different locations and depths may yield different results. Most research has been limited to a single type of fracturing fluid, with few comparing multiple types of fracturing fluids on the same coal rock, particularly for coal rocks deeper than 2500 m. This paper, for the first time, investigates five commonly used pre-fracturing fluids to comprehensively examine the chemical structure evolution of coal samples extracted from the same deep coalbed. The variations in functional groups, macromolecular structures, and microcrystalline structures of coal rocks are analyzed, revealing the mechanisms underlying the evolution of coal rock’s chemical structures. These results are valuable for understanding the mechanisms of chemical structure changes in coal during fracturing and provide guidance for selecting appropriate pre-fracturing fluids.

2. Materials and Methods

2.1. Coal Sample and Fluid Type

Coal samples were obtained from a deep coalbed in Ordos Basin at a depth of approximately 2700 m. The coal samples were crushed, ground, and screened. Samples sized 6–8 mesh were selected as the experimental coal samples. The industrial and elemental analyses of the coal samples are presented in Table 1, with a volatile matter content of less than 6.96% and a hydrogen content of 3.36%. According to GB/T 5751-2009 [26], the coal was classified as grade No. 3 anthracite. Numerous surveys suggest that the current fracturing fluid system primarily utilizes a polyacrylamide (PAM) polymer. The acid system primarily consists of inorganic acids, including hydrochloric acid (HCl), hydrofluoric acid (HF), or their combination. The oxidant system primarily consists of hydrogen peroxide (H2O2) and sodium hypochlorite (NaClO). The optimal concentrations of acid and oxidant are 15% and 10%, respectively. Accordingly, the experimental scheme was designed as outlined in Table 2. Five pre-fracturing fluid systems were selected, namely polyacrylamide (PAM) slick water fracturing fluid (Xunye Chemical Reagent Co., Ltd., Shenzhen, China), HCl acid solution (Xunye Chemical Reagent Co., Ltd., Shenzhen, China), HCl + HF combination acid solution (Xunye Chemical Reagent Co., Ltd., Shenzhen, China), NaClO solution (Xunye Chemical Reagent Co., Ltd., Shenzhen, China), and H2O2 solution (Xunye Chemical Reagent Co., Ltd., Shenzhen, China). The coal samples immersed in the above five systems were labeled as GB, GC, GD, GE, and GF, respectively, while the non-immersed coal samples were labeled as GA.
The experimental procedures are shown in Figure 2. Place the coal samples in a vacuum drying oven (Beijing Kewei Yongxing Instrument Co., Ltd. Beijing, China) and dry them at 60 °C for 72 h. Subject the dried coal samples to a vacuum at room temperature and immerse them in the corresponding liquid for 6 h. Remove the coal samples, wash off all surface liquid with flowing clean water, and remove the retained fluid in the pores using an ultrasonic cleaner (Kunshan Hechuang Ultrasonic Instrument Co., Ltd., Hangzhou, China) for 10 min. Finally, place the coal samples back into the vacuum drying oven and dry them again at 60 °C for another 72 h. Fourier-transform infrared spectroscopy (FTIR), RAMAN, and X-ray diffraction (XRD) are employed to analyze the functional groups, macromolecular structures, and microcrystalline structures of coal rock [27,28].

2.2. Fourier-Transform Infrared Spectroscopy (FTIR)

FTIR is an absorption spectrum primarily used to measure the absorption of infrared light and can be employed to analyze both organic and inorganic components of the material [29]. The treated coal sample was finely ground into a powder with a particle size smaller than 0.074 mm. It was subsequently thoroughly mixed with KBr in a ratio of 1:200 for tablet testing. The Bruker Vertex 70 infrared spectrometer (Bruker Technology Co., Ltd., Beijing, China), manufactured in Germany, was used, with a test range of 400–4000 cm−1 and a resolution of 4 cm−1. Each spectrum consisted of 32 scans, with the air spectrum selected as the background for each sample during testing.

2.3. Raman Spectroscopy (RAMAN)

Raman spectroscopy is a scattering spectrum resulting from the elastic and inelastic scattering of light by materials, enabling the characterization of their macromolecular structure. The Thermo Fisher DXRxi Raman imaging microscope (Thermo Fisher Scientific Co., Ltd., Shanghai, China), manufactured in the United States, was used to scan the powder with a particle size below 0.074 mm. An Ar+ laser light source with a wavelength of 532 nm was selected, and the scanning time was 60 s.

2.4. X-Ray Diffraction (XRD)

XRD is a diffraction technique that verifies the internal structure of a solid material using monochromatic X-rays as the diffraction source. It can penetrate solid materials to acquire information about their crystal structure. The coal samples were scanned using a Rigaku D/max 2500 X-ray powder diffraction instrument (Rigaku Corporation of Japan, Shenzhen, Shanghai) with a scanning range of 5–90° at a rate of 5° per minute.

3. Results and Discussion

3.1. Functional Group Evolution Characteristics

The FTIR spectra of the coal samples after baseline correction and smoothing are presented in Figure 3. The absorbance and peak area exhibit changes under the influence of different pre-fracturing fluids, while the peak position remains relatively stable. Notably, the prominent absorption peak at approximately 1017 cm−1 is attributed to the stretching vibration of Si–O groups in coal samples due to the absence of demineralization treatment.
Due to the complex structure of coal rock, FTIR exhibits multiple absorption peaks corresponding to various functional groups. Therefore, PeakFit v4.12 software (Beijing Huanzhong Ruichi Technology Co., Ltd., Beijing, China) was employed to deconvolute the infrared spectrum of coal. The infrared spectrum can be divided into four primary absorption bands: aromatic structure (700–900 cm−1), oxygen-containing functional groups (1000–1800 cm−1), aliphatic structure (2000–2800 cm−1), and hydroxyl structure (3000–3600 cm−1). Each absorption band is fitted with several Gaussian functions, and the positions and areas of the sub-peaks are used to determine the types and contents of functional groups. According to the literature [30,31] and measured data, the fluctuation range of the main functional group absorption peaks in coal is shown in Table 3. As an example, the peak fitting diagrams for GA are shown in Figure 4.
The contents of the different functional groups were determined based on the peak fitting results, as depicted in Figure 5. Oxygen-containing functional groups are the primary component in raw coal GA, constituting over 40% of the total. Among these, the stretching vibration of Si–O groups make the predominant contribution. The total peak area of GB coal samples increased after treatment with PAM, and the oxygen-containing functional groups exhibited a significant increase, with a growth rate of 239.1%. This is because the addition of polyacrylamide introduced a large quantity of C=O functional groups, resulting in a substantial increase in the number of oxygen-containing functional groups in coal samples. Additionally, there was a decrease in both the aliphatic structure and hydroxyl structure. The total number of functional groups in coal samples treated with the acid and oxidizer system decreased, with the largest decrease observed in the GC (HCl immersion) coal samples. Figure 5b presents the proportions of the different functional groups. It can be observed that the proportion of oxygen-containing functional groups in the coal samples treated with the five pre-fracturing fluids increased, whereas the aliphatic and hydroxyl structures changed conversely. The proportion of aromatic structures increased in GD (HCl + HF immersion) and GF (H2O2 immersion), whereas it decreased in GB (PAM immersion), GC (HCl immersion), and GE (NaClO immersion).

3.1.1. Aromatic Structure

The 700–900 cm−1 region corresponds to the aromatic structure of coal, attributed to the out-of-plane vibration of CH groups in aromatics. It includes one adjacent H deformation, two adjacent H deformation, three adjacent H deformation, and four adjacent H deformation [32,33]. As shown in Figure 6, after immersion in PAM, the content of aromatic structures in GB increases. Conversely, acid and oxidant solutions lead to a decrease in the content of aromatic structures in the coal samples, indicating that acids and oxidants have destructive effects on aromatic rings. The rates of decrease are as follows: GC (71.3%, HCl immersion) > GD (32.6%, HCl + HF immersion) > GE (30.6%, NaClO immersion) > GF (25.8%, H2O2 immersion) > GB (−49.9%, PAM immersion).
The functional group parameters of coal samples were determined from the peak-fitting data, as shown in Table 4.
(1)
The aromaticity index (I) is the ratio of aromatic functional groups to aliphatic functional groups in coal, representing the coal’s degree of aromaticity. It can be calculated as follows:
I =   A ( 700 900 ) A ( 2800 3000 )
where A represents the peak area at a specific wavenumber. The higher the value of I, the greater the degree of aromaticity [34].
I increased after immersion in the five pre-fracturing fluids. The rate of increase is as follows: GD (239.3%, HCl + HF immersion) > GF (197.5%, H2O2 immersion) > GB (168.4%, PAM immersion) > GE (129.8%, NaClO immersion) > GC (75.2%, HCl immersion). The increase in III indicates a higher proportion of aromatic functional groups and a lower proportion of aliphatic functional groups, suggesting the evolution of the coal system towards a state of lower energy and greater stability.
(2)
The degree of aromatic condensation polymerization (DOC) is the ratio of aromatic structure to C=C bonds, which can be calculated as follows:
DOC = A ( 700 900 ) A ( 1600 )
The higher the DOC, the higher the degree of aromatic condensation polymerization, resulting in a more compact coal skeleton structure [35,36]. The DOC values for six coal samples are shown in Table 4, and these values decrease after immersion in five pre-fracturing fluids. The rate of decrease is as follows: GF (33.7%, H2O2 immersion) > GE (26.4%, NaClO immersion) > GD (26.3%, HCl + HF immersion) > GB (24.7%, PAM immersion) > GC (8.1%, HCl immersion).

3.1.2. Oxygen-Containing Functional Groups

The 1000–1800 cm−1 range represents the oxygen-containing functional groups of coal, as shown in Figure 7. The content of GC (HCl immersion) decreased, while the others increased. The rate of increase is as follows: GB (239.0%, PAM immersion) > GF (11.9%, H2O2 immersion) > GD (4.1%, HCl + HF immersion) > GE (1.1%, NaClO immersion) > GC (−34.2%, HCl immersion).
The parameter ‘C’, representing the oxygen-containing functional groups in coal, is defined as the ratio of C=O to C=C. It is calculated as follows:
C = A ( 1650 ~ 1800 ) A ( 1600 ) + A ( 1650 ~ 1800 )
C’ reflects the maturity level of coal. The higher the value of ‘C’, the greater the proportion of stable components and the lower the proportion of unstable ones. As shown in Table 4, the ‘C’ values for GB (PAM immersion) and GF (H2O2 immersion) decreased, while those for the other groups increased. The rate of increase was as follows: GC (64.8%, HCl immersion) > GD (19.2%, HCl + HF immersion) > GE (12.3%, NaClO immersion) > GF (−13.9%, H2O2 immersion) > GB (−55.0%, PAM immersion).

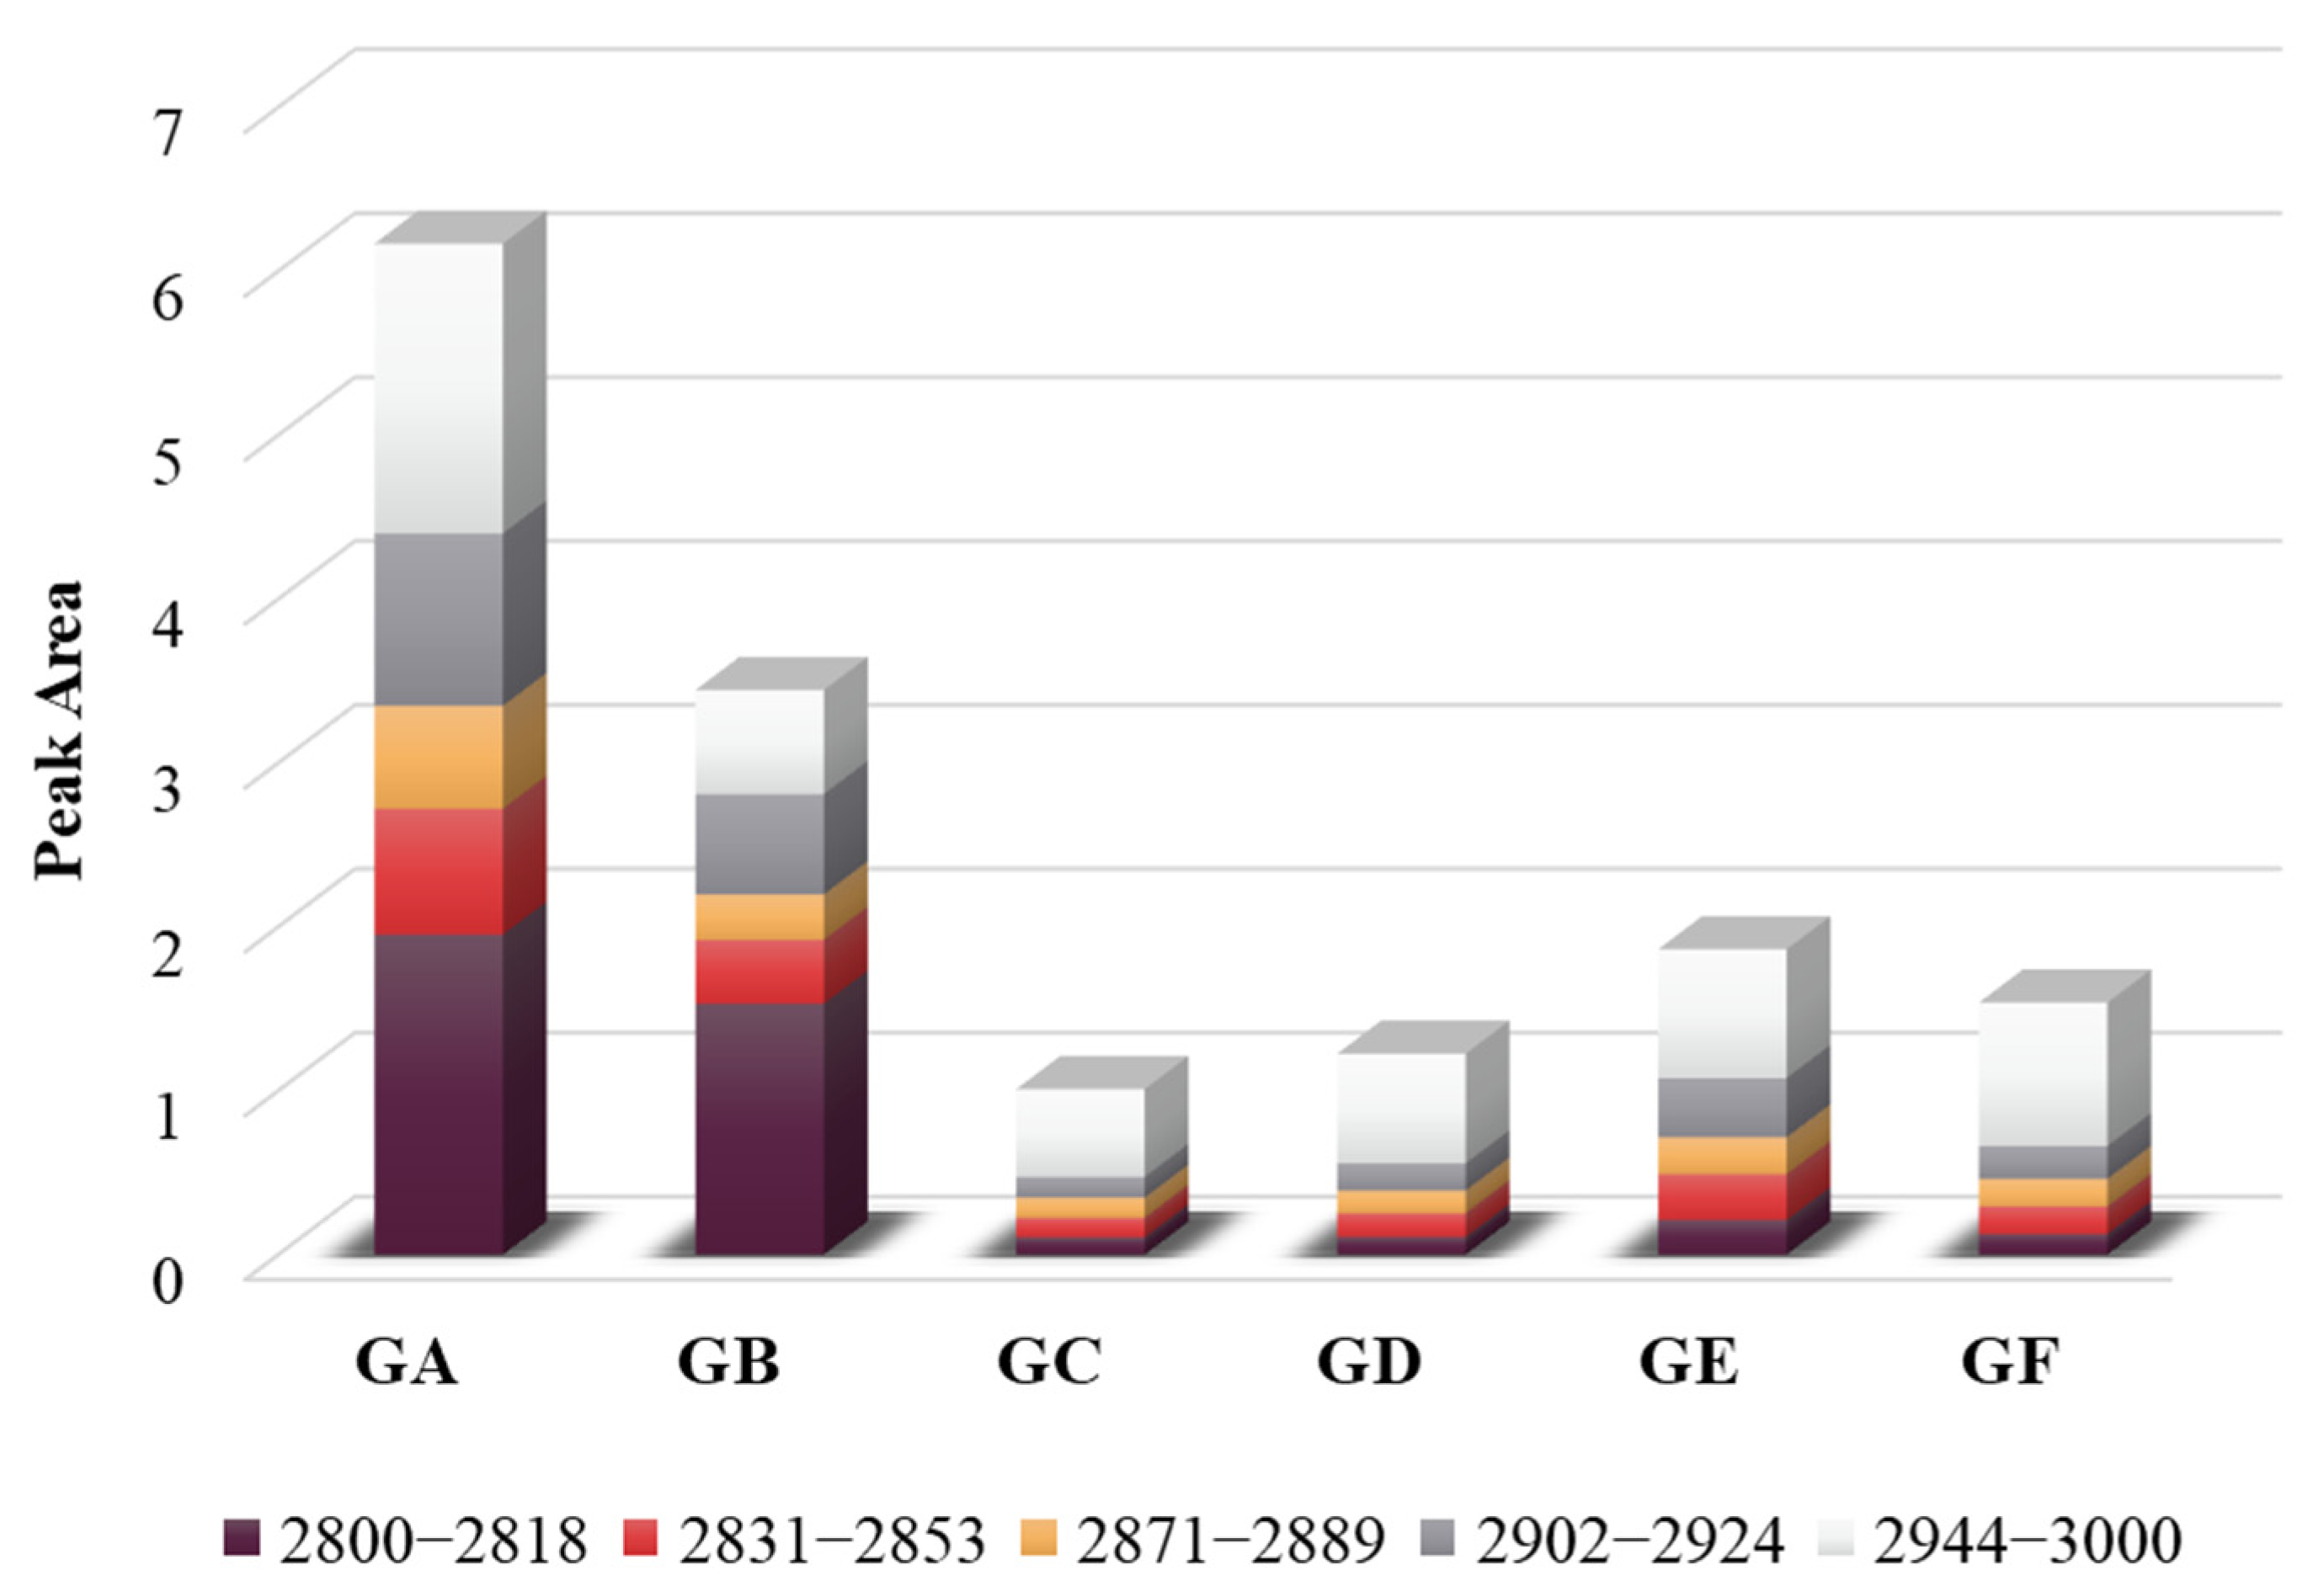
3.1.3. Aliphatic Structures

The 2800–3000 cm−1 range corresponds to the aliphatic structures in coal. As shown in Figure 8, after immersion in the five pre-fracturing fluids, the content of aliphatic structures decreases. The rate of decrease is as follows: GC (83.6%, HCl immersion) > GD (80.1%, HCl + HF immersion) > GF (75.1%, H2O2 immersion) > GE (69.8%, NaClO immersion) > GB (44.2%, PAM immersion).
L represents the length of the aliphatic chain and the degree of branching, which can be calculated as
L = A ( C H 2 ) A ( C H 3 ) = A ( 2900 ~ 2940 ) A ( 2940 ~ 3000 )
The CH2 component primarily consists of the straight chain portion of the aliphatic chain, alicyclic chain, and aromatic side chain, while the CH3 component mainly represents the branched chains of aliphatic hydrocarbons, alicyclic, and aromatic side chains. The larger the value of L, the longer the aliphatic chain and the lower the degree of branching. As shown in Table 4, L increased after immersion in PAM fracturing fluid and decreased after immersion in acid and oxidant solutions. The degree of reduction is as follows: GF (61.7%, H2O2 immersion) > GC (60.4%, HCl immersion) > GD (58.5%, HCl + HF immersion) > GE (22.6%, NaClO immersion). This suggests that the addition of acids and oxidants can break the aliphatic chains, reduce their length, and increase the proportion of methyl groups and the degree of branching in the coal.

3.1.4. Hydroxyl Structure

The 3000–3600 cm−1 range corresponds to the hydroxyl structures in coal, which are among the primary oxygen-containing functional groups that form the outer part of the macromolecular structural unit. This functional group plays a crucial role in significantly influencing the reactivity of coal.
As shown in Figure 9, after immersion in the five pre-fracturing fluids, the hydroxyl content of the coal sample decreased, with the reduction rates as follows: GD (80.9%, HCl + HF immersion) > GC (77.1%, HCl immersion) > GB (73.4%, PAM immersion) > GF (71.1%, H2O2 immersion) > GE (51.5%, NaClO immersion). After the addition of several fracturing fluids, the hydrogen in the hydroxyl group is replaced or oxidized into aldehydes, ketones, and carboxylic acids, resulting in a reduction in their content. Furthermore, the arrangement of the coal macromolecular structural units transitions from disorder to order. The rate of reduction in hydroxyl structure is most pronounced in acid solutions, likely due to nucleophilic substitution by halogenic acids.

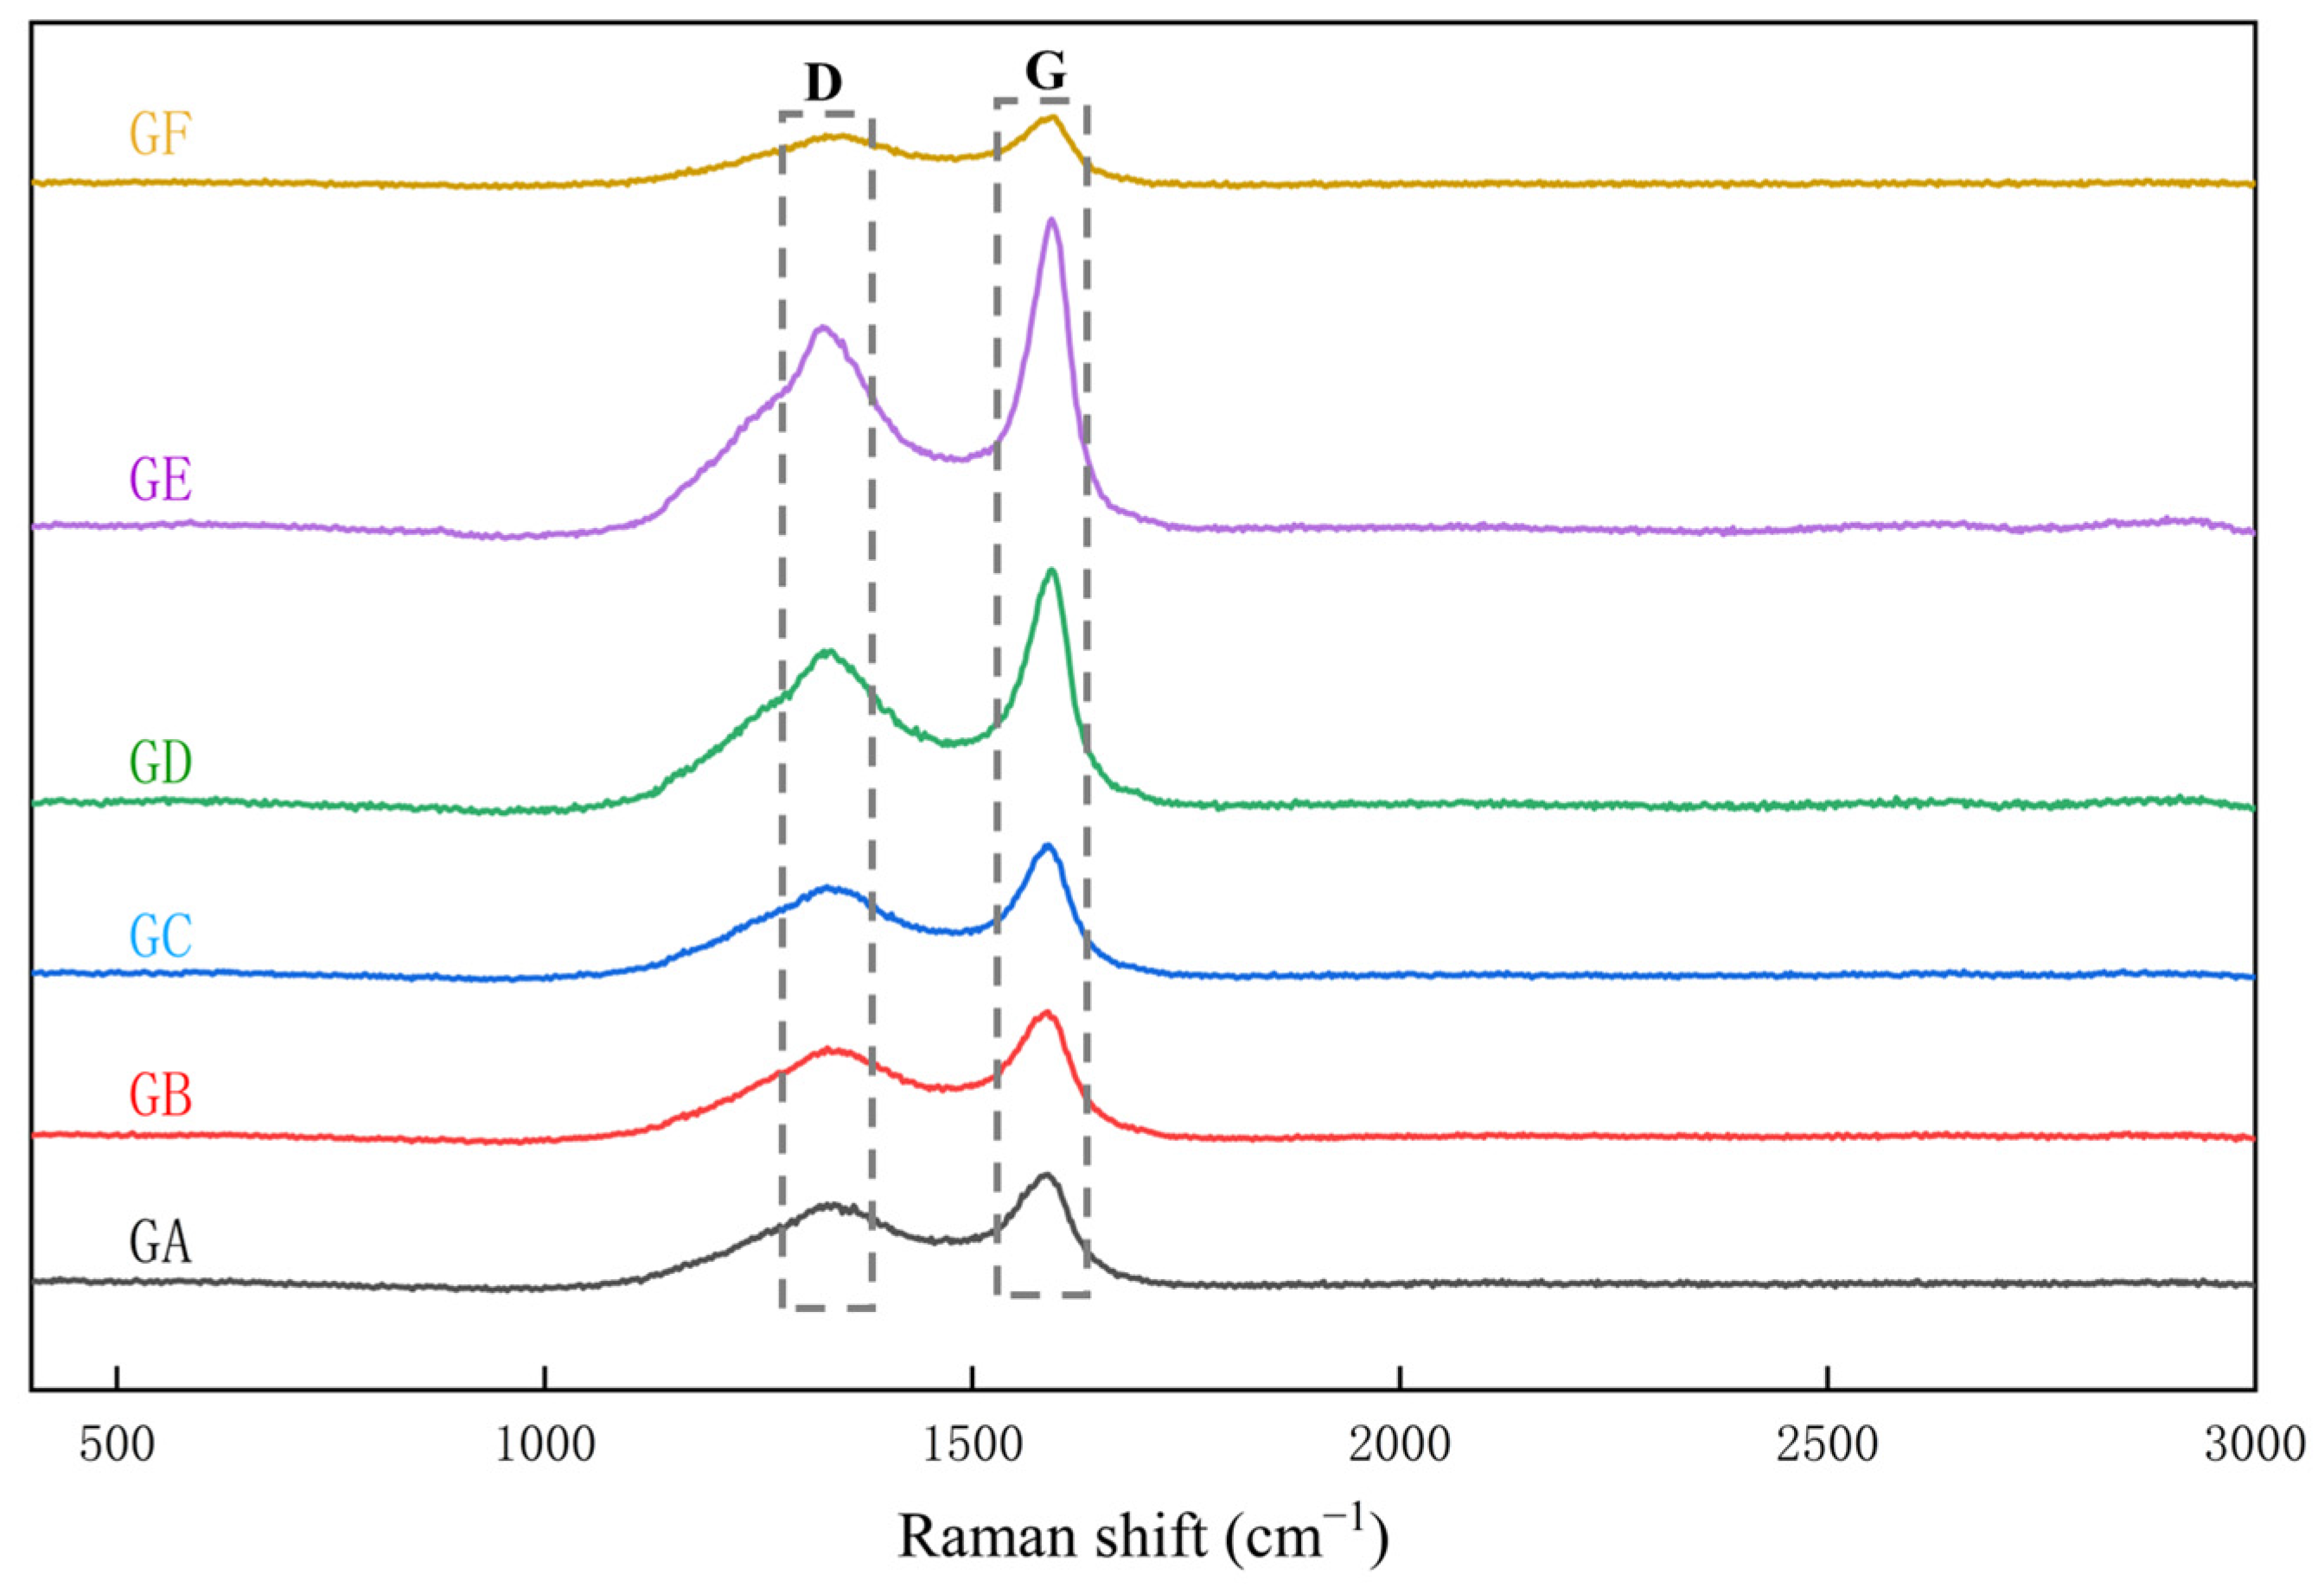
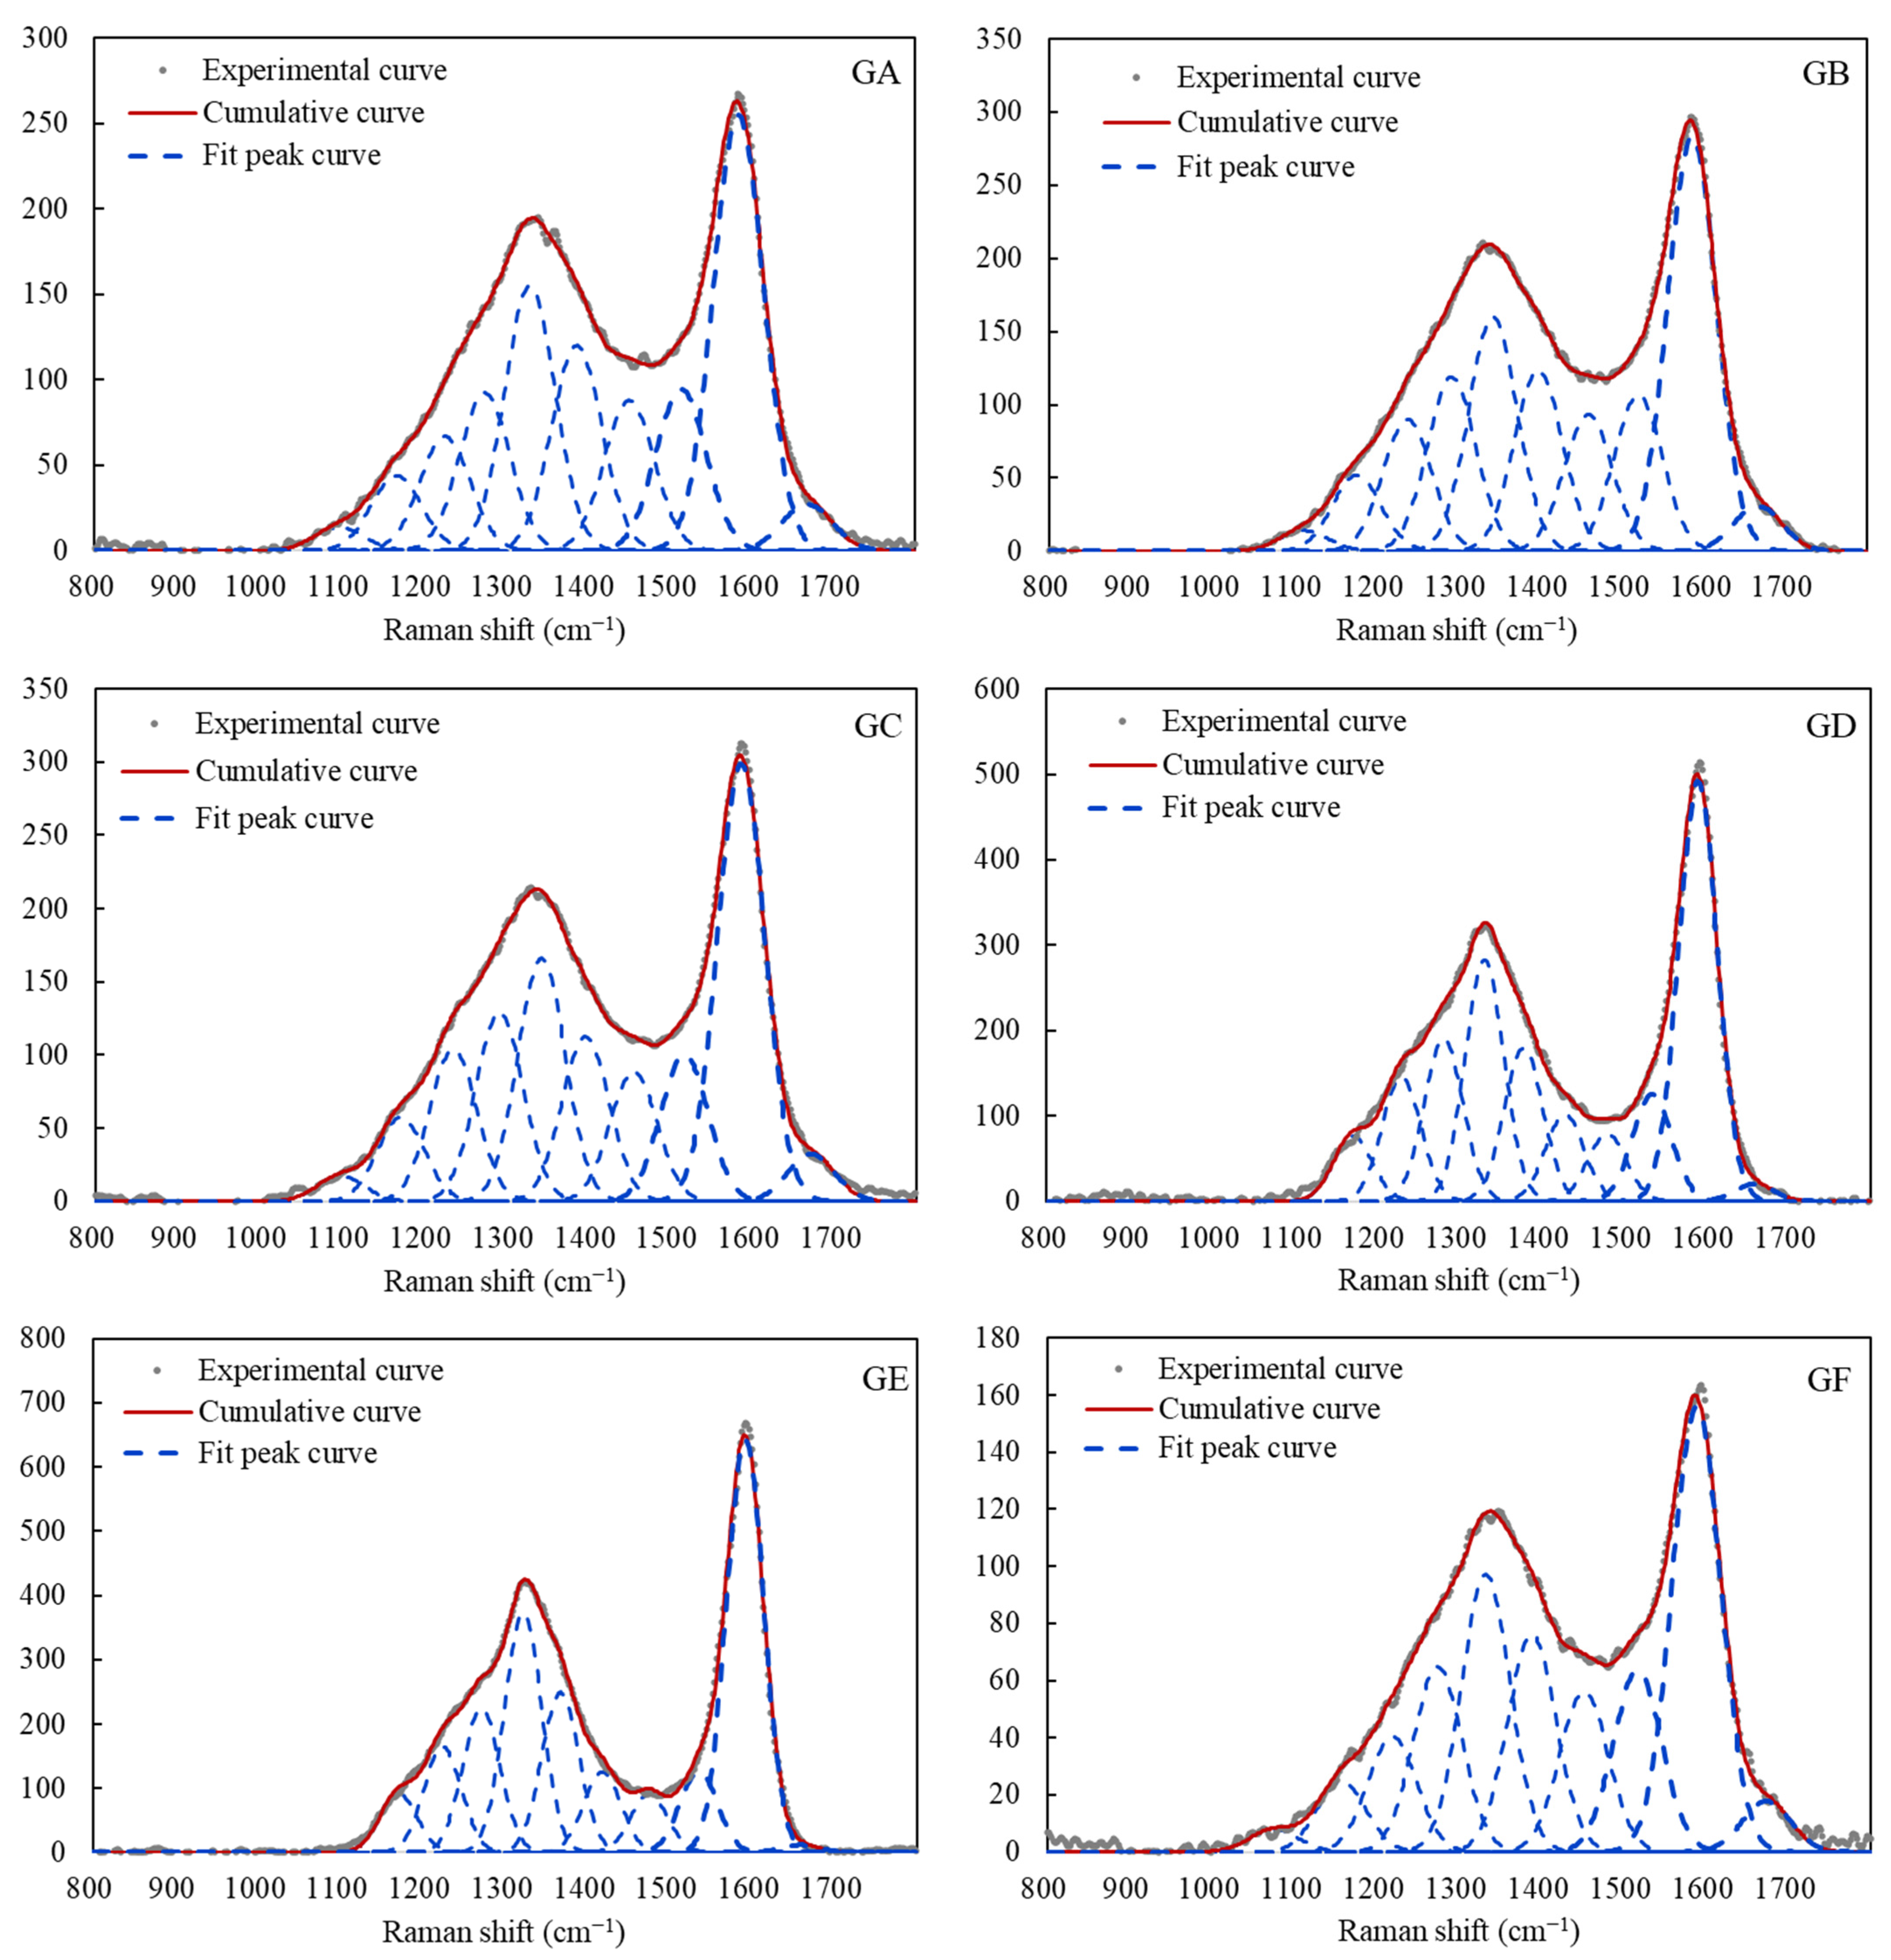
3.2. Macromolecular Structure Evolution Characteristics

Raman spectroscopy is a valuable tool for characterizing the macromolecular structure of materials and serves as a key reference for evaluating the degree of crystallinity or defects in carbon-based materials [37,38,39]. Figure 10 presents the Raman spectra of six coal samples. The Raman spectra display two distinct vibration regions: the D peak around 1340 cm−1 and the G peak around 1590 cm−1. The D peak corresponds to lattice defects, disordered edge arrangements, and low-symmetry carbon structures in graphite, closely associated with plastic deformation in rock. The G peak represents the graphitized carbon content [40,41].
The investigation demonstrated that fitting the Raman spectrum with 10 peaks yields satisfactory results. Consequently, the Raman spectrum within the range of 800–1800 cm−1 was deconvoluted and fitted with 10 Gaussian peaks. The fitting curve is presented in Figure 11. Variations in Raman structural parameters, such as peak position, peak position difference, full width at half maximum (FWHM), and peak area ratio, reflect changes in the orderliness of the coal macromolecular structure.

3.2.1. Peak Position

The D peak reflects the defective structure within the aromatic ring system, particularly in the C–C and graphite structures between aromatic rings with six or more members. This is attributed to the Alg vibration mode of the amorphous graphite’s irregular hexagonal lattice structure. The G peak is associated with the extensional vibration of the carbon–carbon double bond and corresponds to the E2g2 vibrational mode of the aromatic plane. The peak positions of the six coal samples are depicted in Figure 12a. It can be observed that the D peak positions of GB (PAM immersion) and GC (HCl immersion) shift to the high-frequency region by 12–14 cm−1, while the position of GE (NaClO immersion) shifts to the low-frequency region by 8 cm−1. The other coal samples exhibit no significant changes. The changes in the G peak positions of the six coal samples are not significant.

3.2.2. Full Width at Half Maximum (FWHM)

The full width at half maximum (FWHM) represents the width of a spectral line when its peak height is half of the maximum value. It is a crucial parameter for characterizing the structural orderliness of carbon materials. It is generally believed that a smaller FWHM, particularly for the G peak, indicates a higher degree of orderliness in the material.
As shown in Figure 12b, the FWHM of the D and G peaks in each coal sample decreased after immersion in the five pre-fracturing fluids, with the degrees of reduction as follows: GE (26.3%, NaClO immersion) > GD (23.3%, HCl + HF immersion) > GC (6.1%, HCl immersion) > GF (3.6%, H2O2 immersion) > GB (3.4%, PAM immersion). This suggests that the orderliness of GD and GE, immersed in HCl + HF combination acid and NaClO solution, was significantly increased.

3.2.3. Peak Position Difference (dG–D)

The peak position differences are shown in Figure 12c. The dG–D decreases in GB (PAM immersion) and GC (HCl immersion), while it increases in GD (HCl + HF immersion), GE (NaClO immersion), and GF (H2O2 immersion). The increase rate is as follows: GE (6.0%, NaClO immersion) > GD (2.0%, HCl + HF immersion) > GF (0.6%, H2O2 immersion) > GC (−4.3%, HCl immersion) > GB (−4.4%, PAM immersion). The peak position difference reflects the degree of crystallinity of the material, and the increase indicates that the HCl + HF combination acid, NaClO, and H2O2 systems make the coal structure more ordered and enhance the degree of crystallinity.

3.2.4. Peak Area Ratio AD/AG

AD/AG represents the area ratio between the D peak and G peak, reflecting the relative abundance of large aromatic ring structures in coal [42]. The lower the ratio, the more significant the growth of aromatic ring structures, and the higher the degree of structural orderliness. As shown in Figure 12d, the degree of change in AD/AG is small. The peak area ratio decreased in the following order: GC (8.2%, HCl immersion) > GB (7.1%, PAM immersion) > GD (5.2% HCl + HF immersion) > GE (4.6% NaClO immersion). The peak area ratio of GF (H2O2 immersion) showed a slight increase (2.7%).

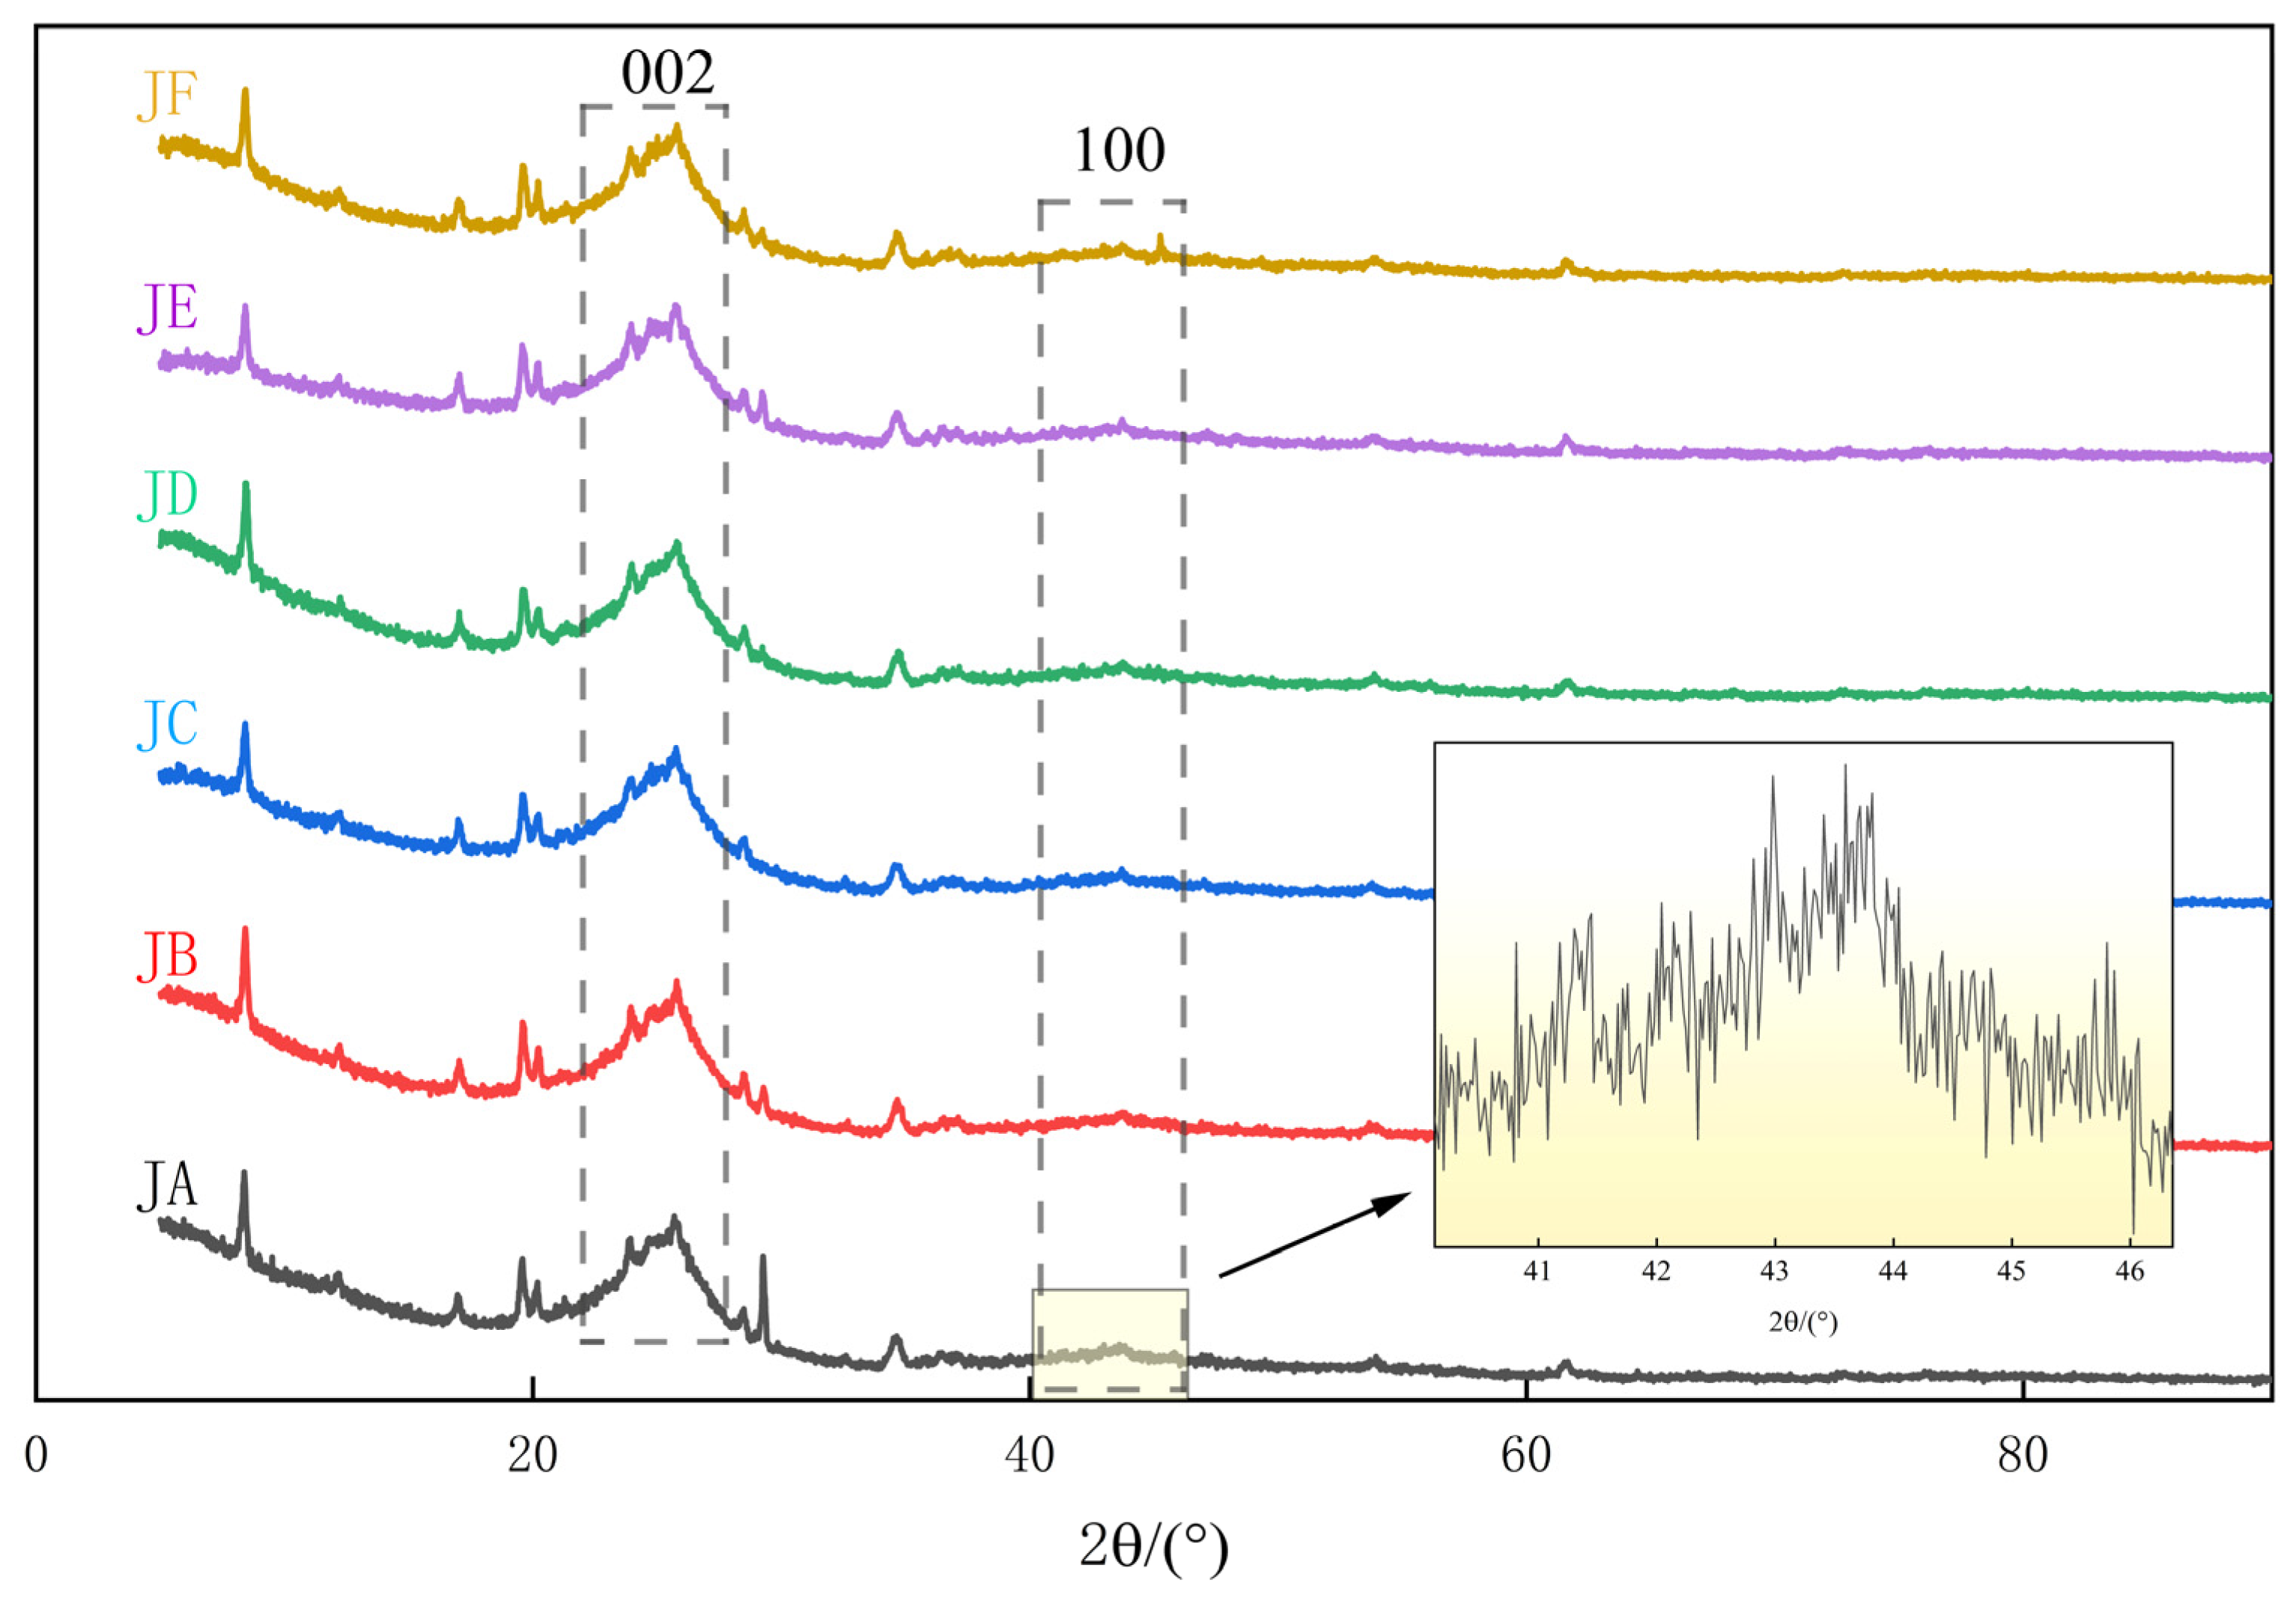
3.3. Microcrystalline Structure Evolution Characteristics

As shown in Figure 13, all spectral lines exhibit distinct asymmetric diffraction peaks near 2θ = 26°, corresponding to the 002 graphite diffraction peaks. The 002 diffraction peak corresponds to the orientation of the aromatic layer carbon mesh in the spatial arrangement, specifically reflecting the stacking height of these laminates. Another typical graphite diffraction peak, the 100 peak, appears near 2θ = 44°. The 100 peak corresponds to the degree of condensation of the aromatic rings, reflecting the size of the aromatic ring carbon mesh. This indicates that, although the coal samples contain significant amorphous structures, they still exhibit characteristics of graphite crystals. Since the coal samples have not undergone demineralization, distinct diffraction peaks indicative of specific mineral compositions are observed in the localized spectral lines. This paper focuses solely on analyzing the microcrystalline structure of coal, so this portion of the peak is manually eliminated before sub-peak fitting, and the baseline is corrected accordingly. Additionally, the Savitzky–Golay method is applied for smoothing to eliminate noise.
It is generally accepted that the 002 diffraction peak results from the superposition of the microcrystalline carbon peak (002 peak) and the amorphous carbon peak (γ peak) [43,44]. The 002 microcrystalline carbon peak is linked to the stacking of aromatic rings, representing microcrystals formed by the condensation of aromatic nuclei (aromatic microcrystalline), while the γ amorphous carbon peak arises from aliphatic side chains, various functional groups, and cycloalkanes (branched microcrystalline) connected to the aromatic nuclei [45]. Accordingly, the XRD spectrum in the diffraction angle range of 18°~32° was subjected to peak fitting, and the microcrystalline structure parameters were calculated from the fitting results. The peak fitting results are shown in Figure 14.
The size of the coal nucleus is primarily determined by structural parameters, such as the interlayer distance (d002), crystal diameter (La), crystal height (Lc), and effective stacking layer number (Nave), and graphitization degree (g) [46]. These parameters can be calculated using the following formulas:
d 002       λ 2 s i n θ 002
L a = 1.84 λ β 100 c o s θ 100
L c = 0.94 λ β 002 c o s θ 002
N ave = L c d 002
g = a 1 - d 002 a 1 - a 2
where λ is the wavelength of the X-ray, 0.15418 nm; θ is the diffraction angle corresponding to diffraction peak,°; β refers to half of the height and width of the diffraction peak; a1 represents the interlayer distance in a completely disordered state (0.3975 nm for coal); and a2 represents the layer distance between graphite crystal structures (0.3354 nm for coal). The calculation results are presented in Table 5.

3.3.1. Interlayer Distance d002

d002 represents the distance between aromatic layers. d002 of coal samples decreased after being treated by different fluids, with the decreasing rates as follows: GF (0.25%, H2O2 immersion) > GD (0.24%, HCl + HF immersion) > GB (0.18%, PAM immersion) > GE (0.16%, NaClO immersion) > GC (0.08%, HCl immersion treatment). The reduction in d002 indicates that the bond between aromatic layers has become closer. The interlayer distance of ideal graphite is 0.3354 nm, suggesting that the coal structure is transitioning toward graphitization.

3.3.2. Crystal Diameter La

La represents the diameter of aromatic ring lamella, the value increased after being treated by five pre-fracturing fluids, except for GE (NaClO immersion). The increasing rates are as follows: GC (12.71%, HCl immersion treatment) > GD (8.07%, HCl + HF immersion) > GF (7.19%, H2O2 immersion) > GB (5.99%, PAM immersion) > GE (−0.60%, NaClO immersion). This suggests that acids are more effective at increasing the crystal diameter of coal.

3.3.3. Crystal Height Lc

Lc represents the packing height of microcrystalline structure. The increasing rates are as follows: GF (3.12%, H2O2 immersion) > GB (0.28%, PAM immersion) > GD (−1.54%, HCl + HF immersion) > GE (−1.63%, NaClO) > GC (−2.91%, HCl immersion). These indicate that H2O2 and PAM can enhance the stacking of microcrystalline structures, while others can disrupt the stacking.

3.3.4. Effective Stacking Layer Number Nave

Nave represents the number of aromatic layers. The increasing rates are as follows: GF (3.38%, H2O2 immersion) > GB (0.46%, PAM immersion) > GD (−1.30%, HCl + HF immersion) > GE (−1.47%, NaClO immersion) > GC (−2.83%, HCl immersion). This suggests that H2O2 and PAM can slightly increase the number of aromatic stacking layers.

3.3.5. Graphitization Degree g

g represents the degree of graphitization, which describes the likelihood of the coal sample exhibiting an ideal graphite crystal structure. Under the influence of the five pre-fracturing fluids, the graphitization degree of all coal samples increased, with the following rates: GF (1.88%, H2O2 immersion) > GD (1.79%, HCl + HF immersion) > GB (1.37%, PAM immersion) > GE (1.17%, NaClO immersion) > GC (0.59%, HCl immersion).

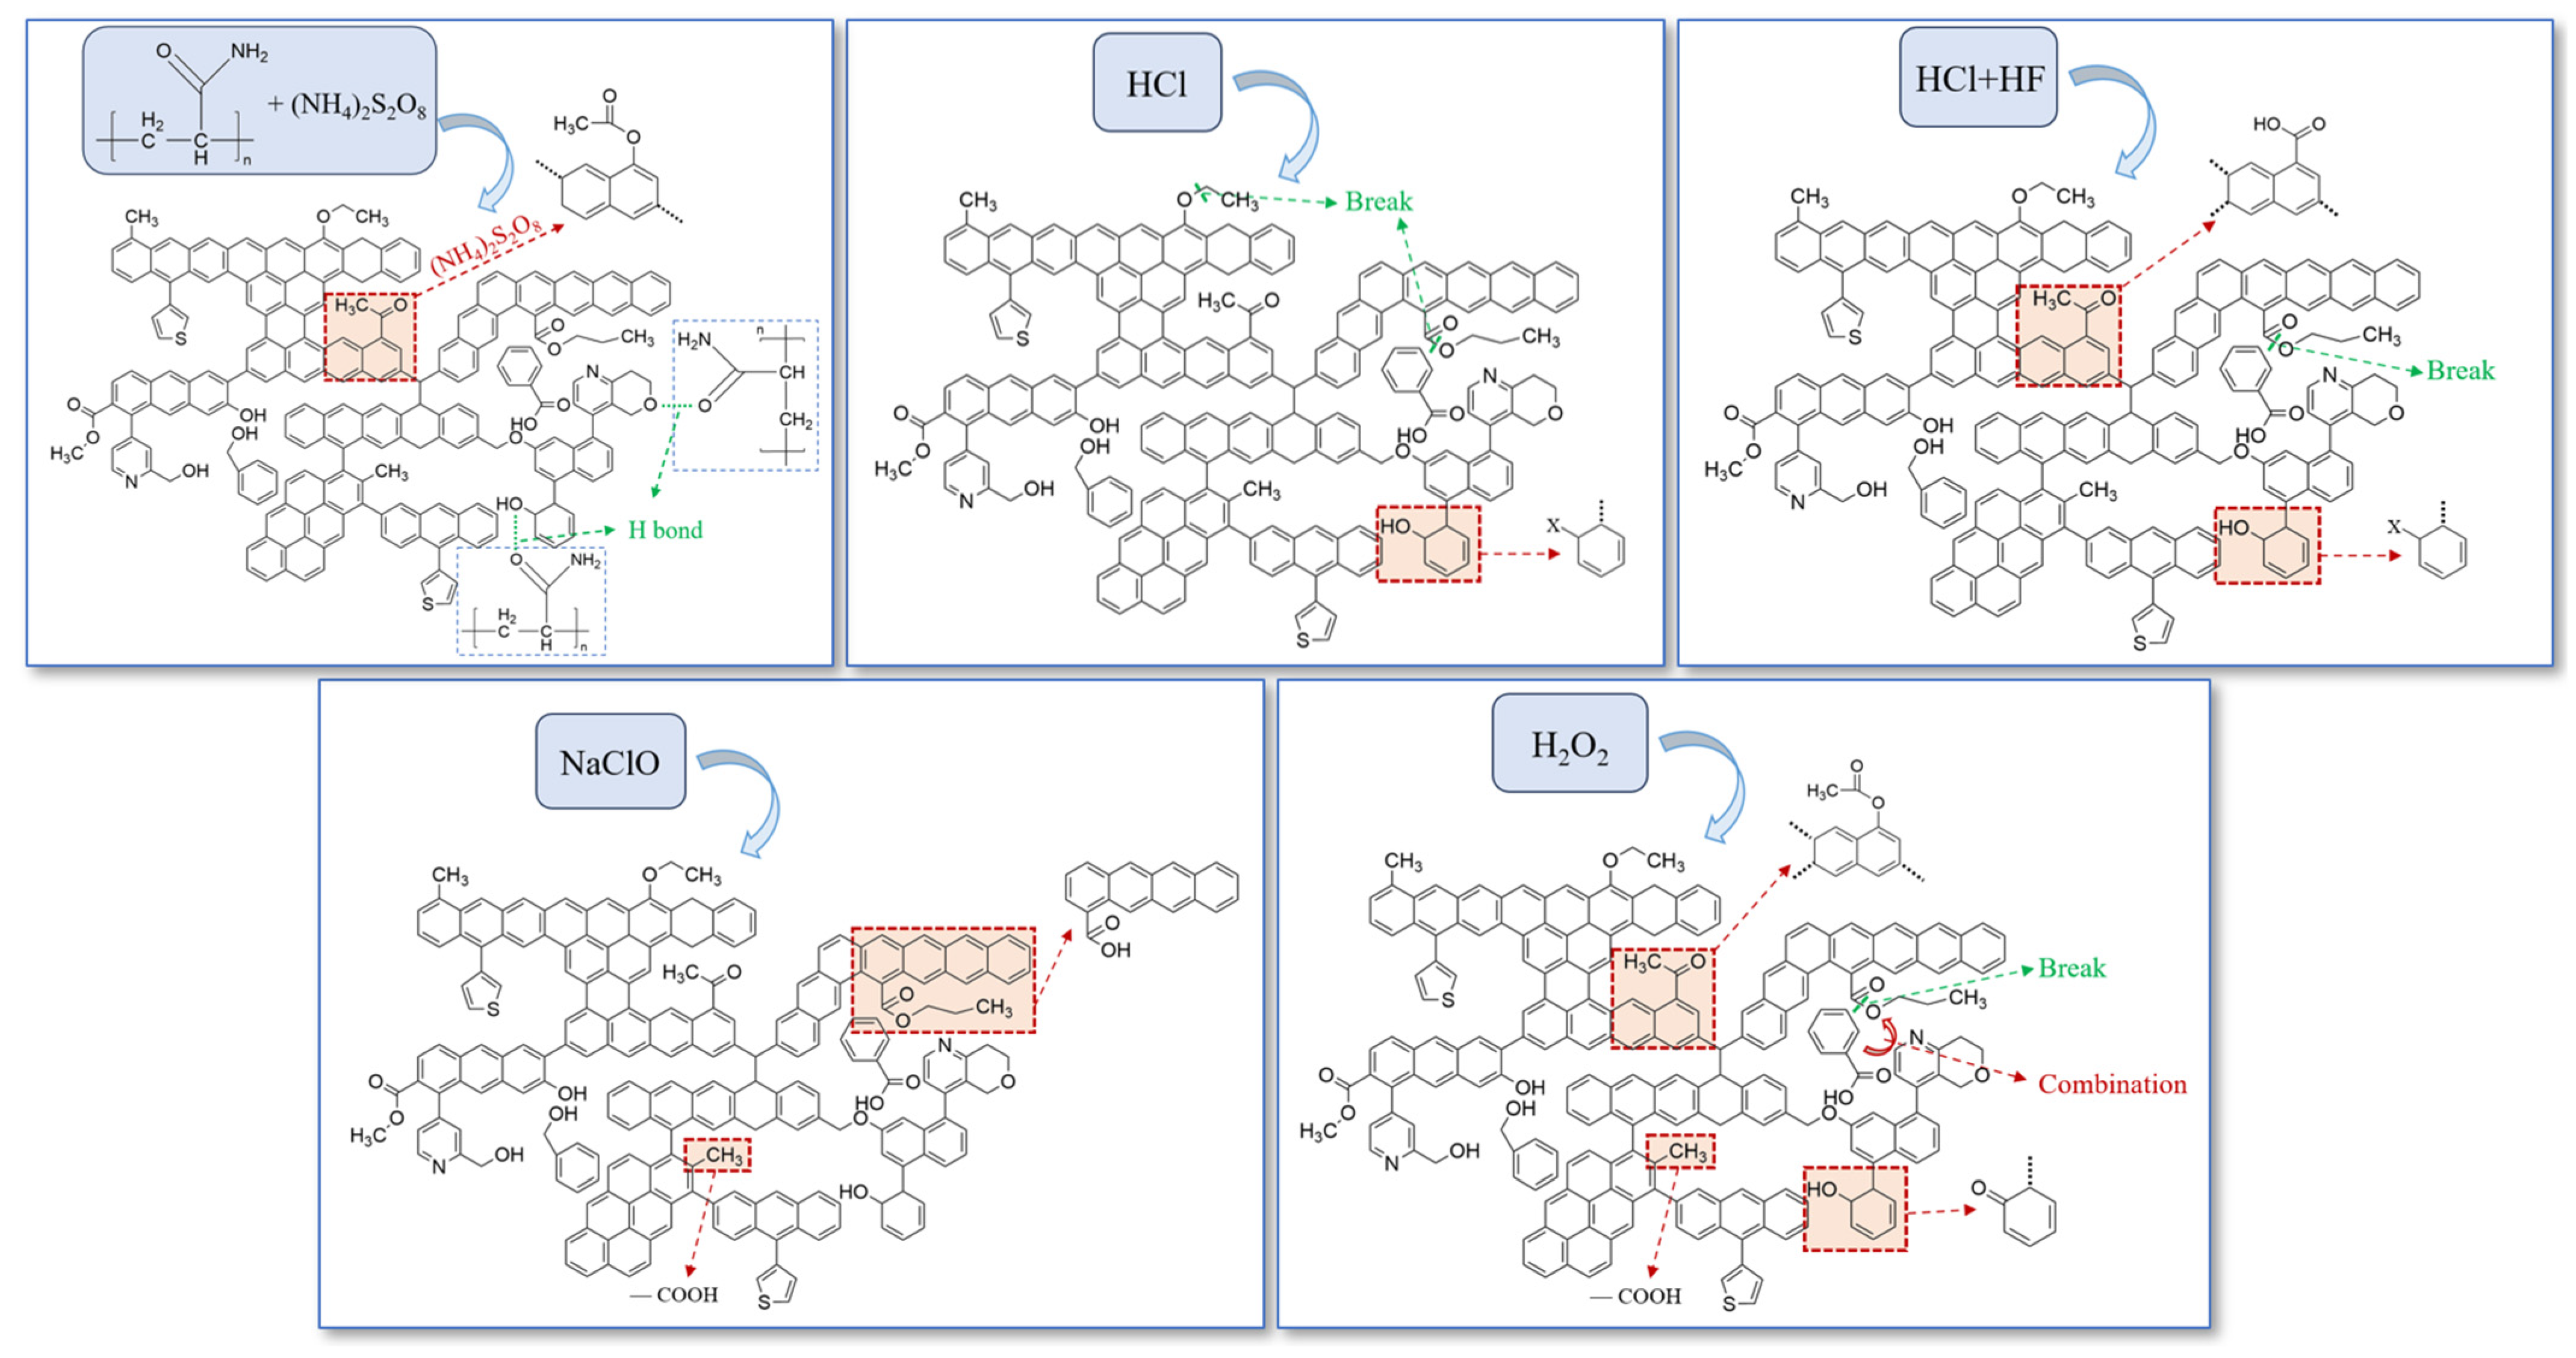
3.4. Mechanisms of Chemical Structure Evolution

A scatter plot was constructed to visualize the relative changes in twelve structural parameters (I, DOC, ‘C’, L, dG–D, FWHMD, FWHMG, AD/AG, d002, La, Lc, and g) for six coal samples, with the baseline values corresponding to the original coal (GA). Positive values indicate an increase in aromaticity, macromolecular structure orderliness, and graphitization degree of the coal samples, as shown in Figure 15. While there is no significant pattern in the changes in FTIR parameters, the aromaticity of all coal samples increased after immersion, suggesting that the coal samples are evolving toward more stable, lower-energy structures. The changes in Raman structural parameters reveal that the GE coal sample exhibits the greatest degree of change, followed by the GD coal sample. This indicates that the NaClO and HCl + HF systems have the most substantial impact on the macromolecular structure of coal, enhancing its orderliness. In terms of XRD structural parameters, GF showed the greatest change rate, suggesting that H2O2 has the most significant effect on increasing the graphitization degree of coal, followed by the HCl + HF system. Based on the FTIR, Raman, and XRD results, the mechanisms through which different pre-fracturing fluids alter the chemical structure of coal rock were analyzed as shown in Figure 16.
The addition of PAM introduces long carbon chains and oxygen-containing functional groups, as evidenced by the substantial increase in the content of CH2 and oxygen-containing functional groups. PAM contains amide groups that readily form hydrogen bonds, thereby enhancing the aromaticity of coal. Ammonium persulfate in the slick water can oxidize ketones to corresponding esters through the Baeyer–Villiger reaction, which is reflected by the increase in the peak area near 1790 cm−1 in the infrared spectrum. The numerous active groups along the PAM molecular chain can adsorb onto the surface of coal macromolecules, leading to an increase in the crystal diameter, crystal height, and effective stacking layer number of the coal. The orderliness of the molecular arrangement also improves, as shown by the increase in AD/AG, La, Lc and Nave, ultimately resulting in a higher degree of graphitization.
HCl hydrolyzes aliphatic structures, thereby shortening the length of aliphatic chains, as evidenced by the decrease in ester groups and the parameter L. Additionally, HCl breaks ether bonds, which is confirmed by the reduction in the peak near 1790 cm−1 in the infrared spectrum. Hydroxyl groups are susceptible to nucleophilic substitution reactions with halogenated acids, forming halogenated hydrocarbons, which is reflected by the reduction in hydroxyl content. These changes reduce defect structures in coal macromolecules and increase macromolecular orderliness, as evidenced by the decrease in FWHM and AD/AG. Although acids disrupt the stacking of microcrystalline structures, they increase the elongation of these structures, reduce the spacing between aromatic layers, and enhance graphitization, which can be proved by the changes of Lc, La, d002, and g.
HF exhibits some of the same characteristics as HCl. Nucleophilic substitution reactions and the breakage of aliphatic chains occur to reduce the defect structures in coal macromolecules. However, the reactivity of HF in the nucleophilic substitution reaction is lower than that of HCl, resulting in fewer hydroxyl groups being reduced in GD compared to GC. Under the influence of HF, some methyl groups may be converted into hydroxyl groups. The combined HCl + HF acid shows a greater effect on the microcrystalline structure of coal, as HF has a more pronounced effect on reducing the distance between aromatic layers.
NaClO can oxidize the aliphatic side chains and bridge bonds to form carboxyl functional groups, resulting in an increase in ‘C’ and I. Simultaneously, the increase in peak position difference and the decrease in FWHM in the Raman spectra indicate a reduction in amorphous structure and an increase in ordering degree. The changes in microcrystalline parameters indicate that NaClO can also reduce the interlayer distance and increase the degree of graphitization, although its effect is weaker than that of H2O2.
H2O2 exerts the most significant effect on the microcrystalline structure of coal due to its higher oxidizing capacity. The oxygen atoms in hydrogen peroxide exhibit high potent oxidizing properties. Hydroxyl groups can be oxidized to carbonyl groups, with the Baeyer–Villiger reaction esterifying the carbonyl group. H2O2 oxidizes and breaks a large number of aliphatic side chains in coal and increases the lattice defects in carbon atom crystals. Both the increase in I, AD/AG, and the decrease in L support this. The active sites formed by the shedding of aliphatic chains facilitate the combination of small aromatic structures to form a new aromatic system, consequently increasing the crystal diameter (La), crystal height (Lc), effective stacking layer number (Nave), and graphitization degree (g) of coal.

4. Conclusions

The evolution of the chemical structure across five types of pre-fracturing fluids was investigated using FTIR, Raman, and XRD. The following conclusions were drawn:
(1)
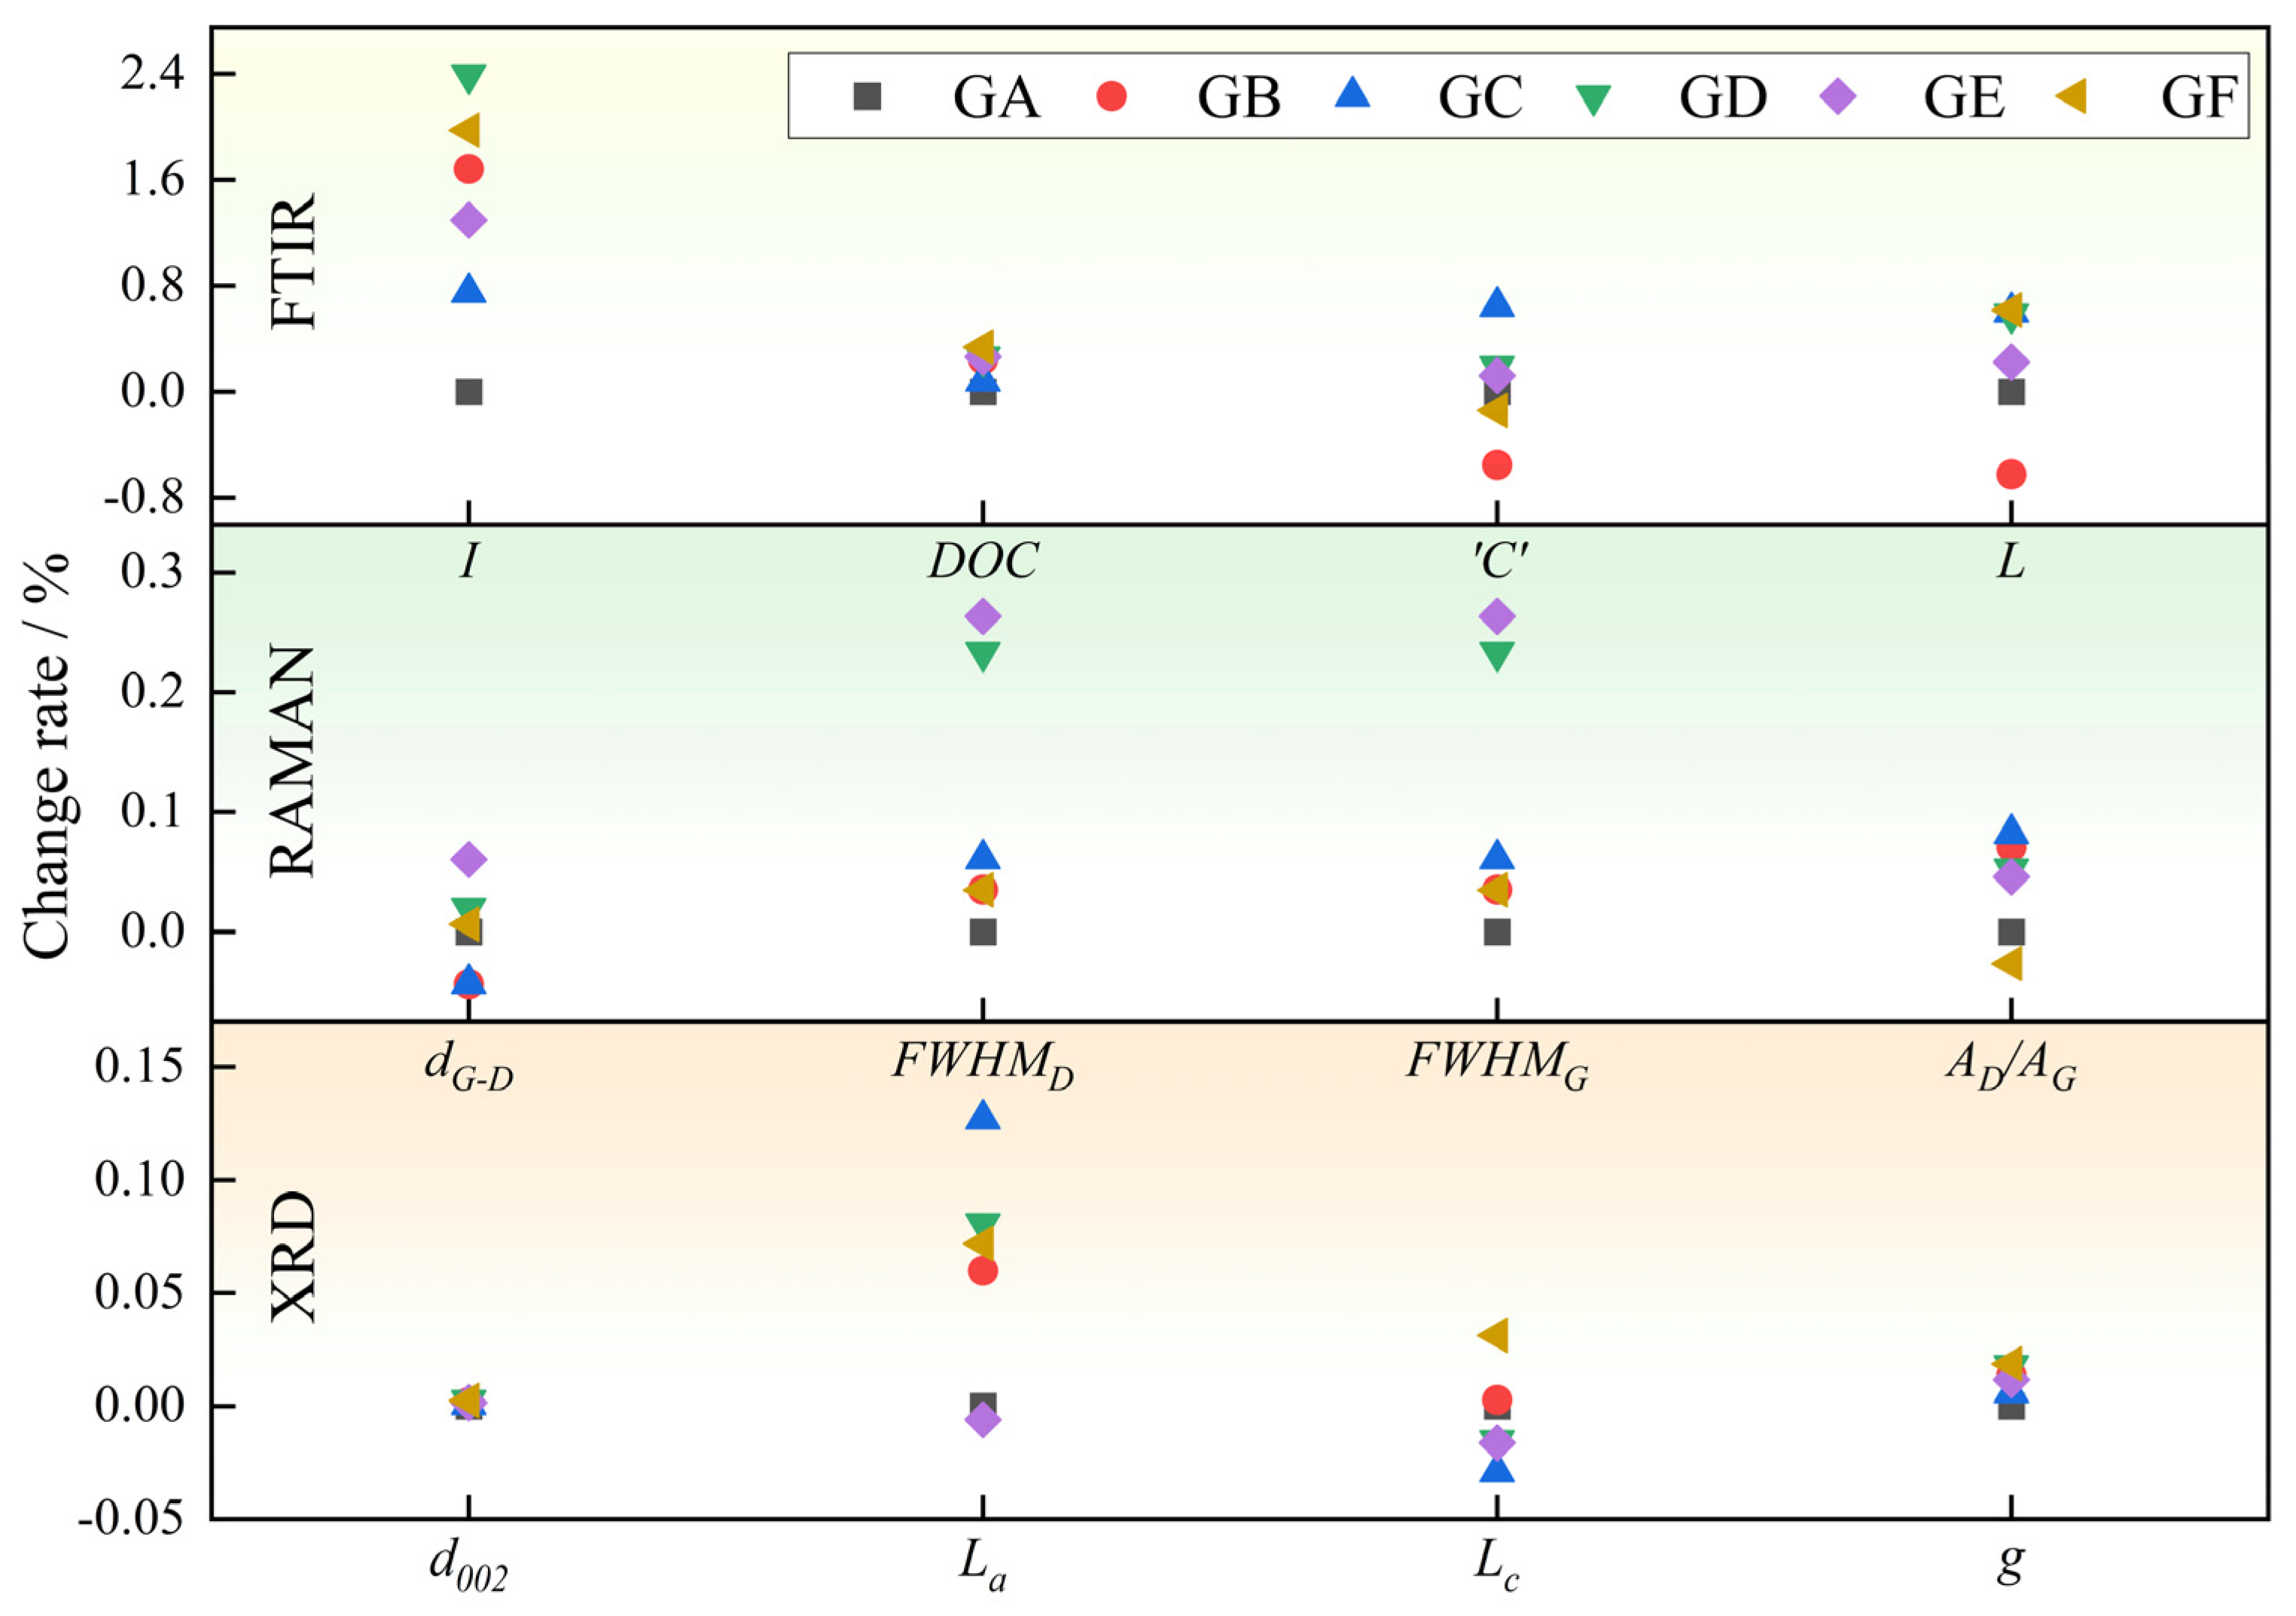
Slick water, acid solutions and oxidizer solutions exert the same effect on the proportion of oxygen-containing functional groups (increase), aliphatic structures (decrease) and hydroxyl structures (decrease). After being treated by the five kinds of pre-fracturing fluids, I increased and DOC decreased. L increased after being treated by PAM, but decreased after being treated by acids and oxidizers.
(2)
Acids have the greatest effect on decreasing the content of functional groups; NaClO and HCl + HF have the most significant influence on the ordering of coal macromolecular structure, while H2O2 and HCl + HF exert the greatest influence on the graphitization degree of coal.
(3)
HCl + HF has a more pronounced effect on increasing the degree of aromaticity and graphitization of microcrystals than HCl.
(4)
NaClO has the most significant effect on the ordering of macromolecular structure, while H2O2 has the most significant effect on the graphitization degree of microcrystalline structure.

Author Contributions

Conceptualization, X.W. and D.Z.; methodology, Z.S.; investigation, Z.W.; writing—original draft preparation, X.W.; writing—review and editing, J.X.; funding acquisition, D.Z. All authors have read and agreed to the published version of the manuscript.

Funding

This research was funded by the National Natural Science Foundation of China, grant number U23B2089.

Data Availability Statement

The original contributions presented in this study are included in the article. Further inquiries can be directed to the corresponding authors.

Conflicts of Interest

The authors declare no conflicts of interest.

References

  1. Moore, T.A. Coalbed methane: A review. Int. J. Coal Geol. 2012, 101, 36–81. [Google Scholar] [CrossRef]
  2. Li, S.; Qin, Y.; Tang, D.; Shen, J.; Wang, J.; Chen, S. A comprehensive review of deep coalbed methane and recent developments in China. Int. J. Coal Geol. 2023, 279, 104369. [Google Scholar] [CrossRef]
  3. Li, G.; Zhang, S.; He, H.; He, X.; Zhao, Z. Coal-rock gas: Concept, connotation and classification criteria. Pet. Explor. Dev. 2024, 51, 783–795. [Google Scholar] [CrossRef]
  4. Clarkson, C.R.; Bustin, R.M. The effect of pore structure and gas pressure upon the transport properties of coal: A laboratory and modeling study. 2. Adsorption rate modeling. Fuel 1999, 78, 1345–1362. [Google Scholar] [CrossRef]
  5. Thomas, L.; Tang, H.; Kalyon, D.M.; Aktas, S.; Arthur, J.D.; Blotevogel, J.; Carey, J.W.; Filshill, A.; Fu, P.; Hsuan, G.; et al. Toward better hydraulic fracturing fluids and their application in energy production: A review of sustainable technologies and reduction of potential environmental impacts. J. Pet. Sci. Eng. 2019, 173, 793–803. [Google Scholar] [CrossRef]
  6. Guo, H.; Yu, Y.; Wang, Y.; Wang, K.; Yuan, L.; Xu, C.; Ren, B. Experimental study on the desorption law and diffusion kinetic characteristics of gas in raw coal and tectonic coal. Energy 2024, 289, 129924. [Google Scholar] [CrossRef]
  7. Kiani, A.; Sakurovs, R.; Grigore, M.; Sokolova, A. Gas sorption capacity, gas sorption rates and nanoporosity in coals. Int. J. Coal Geol. 2018, 200, 77–86. [Google Scholar] [CrossRef]
  8. Crosdale, P.J.; Beamish, B.B.; Valix, M. Coalbed methane sorption related to coal composition. Int. J. Coal Geol. 1998, 35, 147–158. [Google Scholar] [CrossRef]
  9. Sun, G.; Ni, G.; Fu, Z.; Yin, X.; Wang, G.; Wang, Z. Comparative Study of Organic and Inorganic Acids on the Mechanism of Physical Damage to Coal Mechanics. Energy Fuels 2023, 37, 19526–19537. [Google Scholar] [CrossRef]
  10. Haenel, M.W. Recent progress in coal structure research. Fuel 1992, 71, 1211–1223. [Google Scholar] [CrossRef]
  11. Li, X.P.; Zeng, Q. Development and Progress of Spectral Analysis in Coal Structure Research. Spectrosc. Spectr. Anal. 2022, 42, 350–357. [Google Scholar]
  12. Balucan, R.D.; Turner, L.G.; Steel, K.M. X-ray μCT investigations of the effects of cleat demineralization by HCl acidizing on coal permeability. J. Nat. Gas Sci. Eng. 2018, 55, 206–218. [Google Scholar] [CrossRef]
  13. Rui, G.; Shaojie, Z.; Junting, S.; Chengwei, L.; Feng, T.; Zhizhong, J.; Changwei, W.; Shouqing, P.; Zhiyuan, X. Effects of Different Concentrations of Weak Acid Fracturing Fluid on the Microstructure of Coal. Nat. Resour. Res. 2024, 33, 2215–2236. [Google Scholar] [CrossRef]
  14. Zhang, L.; Li, Z.; Yang, Y.; Zhou, Y.; Kong, B.; Li, J.; Si, L. Effect of acid treatment on the characteristics and structures of high-sulfur bituminous coal. Fuel 2016, 184, 418–429. [Google Scholar] [CrossRef]
  15. Balucan, R.D.; Turner, L.G.; Steel, K.M. Acid-induced mineral alteration and its influence on the permeability and compressibility of coal. J. Nat. Gas Sci. Eng. 2016, 33, 973–987. [Google Scholar] [CrossRef]
  16. Xu, Q.; Liu, R.; Ramakrishna, S. Comparative experimental study on the effects of organic and inorganic acids on coal dissolution. J. Mol. Liq. 2021, 339, 116730. [Google Scholar] [CrossRef]
  17. Larsen, J.W.; Pan, C.S.; Shawver, S. Effect of demineralization on the macromolecular structure of coals. Energy Fuels 1989, 3, 557–561. [Google Scholar] [CrossRef]
  18. He, J.; Li, H.; Yang, W.; Lu, J.; Lu, Y.; Liu, T.T.; Shi, S. Experimental study on erosion mechanism and pore structure evolution of bituminous and anthracite coal under matrix acidification and its significance to coalbed methane recovery. Energy 2023, 283, 128485. [Google Scholar] [CrossRef]
  19. Jing, Z.; Balucan, R.D.; Underschultz, J.R.; Steel, K.M. Oxidant stimulation for enhancing coal seam permeability: Swelling and solubilisation behaviour of unconfined coal particles in oxidants. Fuel 2018, 221, 320–328. [Google Scholar] [CrossRef]
  20. Liu, J.; Kang, Y.; Chen, Q.; Jiang, L.; Wang, J.; Gates, I.; You, L.; Sun, L.; Liu, D.; Sun, J. Understanding the interactions of NaClO oxidant with coal for intensified hydraulic fracturing effectiveness. Gas Sci. Eng. 2023, 117, 205082. [Google Scholar] [CrossRef]
  21. Jing, Z.; Rodrigues, S.; Strounina, E.; Li, M.; Wood, B.; Underschultz, J.R.; Esterle, J.S.; Steel, K.M. Use of FTIR, XPS, NMR to characterize oxidative effects of NaClO on coal molecular structures. Int. J. Coal Geol. 2019, 201, 1–13. [Google Scholar] [CrossRef]
  22. Mayo, F.R.; Kirshen, N.A. Oxidations of coal by aqueous sodium hypochlorite. Fuel 1979, 58, 698–704. [Google Scholar] [CrossRef]
  23. Jing, Z.; Mahoney, S.A.; Rodrigues, S.; Balucan, R.D.; Underschultz, J.; Esterle, J.S.; Rufford, T.E.; Steel, K.M. A preliminary study of oxidant stimulation for enhancing coal seam permeability: Effects of sodium hypochlorite oxidation on subbituminous and bituminous Australian coals. Int. J. Coal Geol. 2018, 200, 36–44. [Google Scholar] [CrossRef]
  24. Zhang, J.; Zhou, A.; Zhang, X. Effect of the oxidation coal of H2O2 on the properties of coal-based polyaniline material. Mater. Rep. 2010, 24, 41–44. [Google Scholar]
  25. Jing, Z.; Pan, S.; Wang, X.; Yuan, M.; Jim, U.; Karen, S. Oxidant stimulation to enhance coal seam permeability mechanism and application. J. China Coal Soc. 2022, 47, 3975–3989. [Google Scholar]
  26. GB/T 5751-2009; Chinese Classification of Coals. Standardization Administration of China: Beijing, China, 2009.
  27. Isah, U.A.; Rashid, M.I.; Lee, S.; Kiman, S.; Iyodo, H.M. Correlations of coal rank with the derived Fourier Transform Infra-Red (FTIR) spectroscopy structural parameters: A review. Infrared Phys. Technol. 2024, 141, 105456. [Google Scholar] [CrossRef]
  28. Ibarra, J.; Muñoz, E.; Moliner, R. FTIR study of the evolution of coal structure during the coalification process. Org. Geochem. 1996, 24, 725–735. [Google Scholar] [CrossRef]
  29. Chen, Y.; Zou, C.; Mastalerz, M.; Hu, S.; Gasaway, C.; Tao, X. Applications of Micro-Fourier Transform Infrared Spectroscopy (FTIR) in the Geological Sciences—A Review. Int. J. Mol. Sci. 2015, 16, 30223–30250. [Google Scholar] [CrossRef]
  30. Li, X.; Zeng, F.; Wang, W.; Dong, K.; Cheng, L. FTIR characterization of structural evolution in low-middle rank coals. J. China Coal Soc. 2015, 40, 2900–2908. [Google Scholar]
  31. Okolo, G.N.; Neomagus, H.W.J.P.; Everson, R.C.; Roberts, M.J.; Bunt, J.R.; Sakurovs, R.; Mathews, J.P. Chemical–structural properties of South African bituminous coals: Insights from wide angle XRD–carbon fraction analysis, ATR–FTIR, solid state 13C NMR, and HRTEM techniques. Fuel 2015, 158, 779–792. [Google Scholar] [CrossRef]
  32. Hao, P.; Meng, Y.; Zeng, F.; Yan, T.; Xu, G. Quantitative Study of Chemical Structures of Different Rank Coals Based on Infrared Spectroscopy. Spectrosc. Spectr. Anal. 2020, 40, 787–792. [Google Scholar]
  33. Liang, H.; Wang, C.; Zeng, F.; Li, M.; Xiang, J. Effect of demineralization on lignite structure from Yinmin coalfield by FT-IR investigation. J. Fuel Chem. Technol. 2014, 42, 129–137. [Google Scholar]
  34. Fan, S.; Li, Y.; Song, D.; Zhang, X. Macromolecular structure evolution mechanism of tectonically deformed coal under different deformation mechanisms. Coal Sci. Technol. 2019, 47, 239–246. [Google Scholar]
  35. Wang, Z. Microstructure Evolution and Mechanical Properties of Deep Coal Under the Combined Action of Temperature. Ph.D. Thesis, Chongqing University, Chongqing, China, 2022. [Google Scholar]
  36. Yan, J.; Lei, Z.; Li, Z.-K.; Wang, Z.; Ren, S.; Kang, S.; Wang, X.; Shui, H. Molecular structure characterization of low-medium rank coals via XRD, solid state 13C NMR and FTIR spectroscopy. Fuel 2020, 268, 117038. [Google Scholar] [CrossRef]
  37. Cheng, N.; Shi, M.; Hou, Q.; Pan, J.; Han, Y. Application of Raman spectroscopy in characterization of coal macromolecular structure. J. China Coal Soc. 2023, 48, 1311–1324. [Google Scholar]
  38. Xu, J.; Tang, H.; Su, S.; Liu, J.; Xu, K.; Qian, K.; Wang, Y.; Zhou, Y.; Hu, S.; Zhang, A.; et al. A study of the relationships between coal structures and combustion characteristics: The insights from micro-Raman spectroscopy based on 32 kinds of Chinese coals. Appl. Energy 2018, 212, 46–56. [Google Scholar] [CrossRef]
  39. Zhang, Y.; Li, Z. Raman spectroscopic study of chemical structure and thermal maturity of vitrinite from a suite of Australia coals. Fuel 2019, 241, 188–198. [Google Scholar] [CrossRef]
  40. Li, X.; Hayashi, J.-I.; Li, C.-Z. FT-Raman spectroscopic study of the evolution of char structure during the pyrolysis of a Victorian brown coal. Fuel 2006, 85, 1700–1707. [Google Scholar] [CrossRef]
  41. Wang, S.; Cheng, H.; Jiang, D.; Huang, F.; Su, S.; Bai, H.-J. Raman spectroscopy of coal component of Late Permian coals from Southern China. Spectrochim. Acta Part A Mol. Biomol. Spectrosc. 2014, 132, 767–770. [Google Scholar] [CrossRef]
  42. Wang, S.; Tang, Y.; Schobert, H.H.; Guo, Y.; Gao, W.; Lu, X. FTIR and simultaneous TG/MS/FTIR study of Late Permian coals from Southern China. J. Anal. Appl. Pyrolysis 2013, 100, 75–80. [Google Scholar] [CrossRef]
  43. Zhang, K.; Cheng, Y.; Li, W.; Hao, C.; Hu, B.; Jiang, J. Microcrystalline Characterization and Morphological Structure of Tectonic Anthracite Using XRD, Liquid Nitrogen Adsorption, Mercury Porosimetry, and Micro-CT. Energy Fuels 2019, 33, 10844–10851. [Google Scholar] [CrossRef]
  44. Baysal, M.; Yürüm, A.; Yıldız, B.; Yürüm, Y. Structure of some western Anatolia coals investigated by FTIR, Raman, 13C solid state NMR spectroscopy and X-ray diffraction. Int. J. Coal Geol. 2016, 163, 166–176. [Google Scholar] [CrossRef]
  45. Li, X.; Zeng, F.; Wang, W.; Kui, D. XRD characterization of structural evolution in low-middle rank coals. J. Fuel Chem. Technol. 2016, 44, 777–783. [Google Scholar]
  46. Cheng, J.; Zhu, Y.; Gao, L.; Zhao, X. Evolution of coke microcrystalline structure during calcination process of coal-based needle coke. J. Fuel Chem. Technol. 2020, 48, 1071–1078. [Google Scholar]
Figure 1. Structural diagram of coal.
Processes 13 01166 g001
Figure 2. Experimental procedures.
Processes 13 01166 g002
Figure 3. Fourier Infrared Spectroscopy of coal samples.
Processes 13 01166 g003
Figure 4. The peak fitting diagrams of FTIR for GA coal sample.
Processes 13 01166 g004
Figure 5. Functional group content and proportion of each coal sample. (a) Area of diverse functional groups; (b) Proportion of diverse functional groups.
Processes 13 01166 g005
Figure 6. Content of aromatic structures in coal sample.
Processes 13 01166 g006
Figure 7. Content and proportion of oxygen-containing functional groups in coal sample. (a) Peak area of oxygen-containing functional groups; (b) Proportion of oxygen-containing functional groups.
Processes 13 01166 g007
Figure 8. Peak area of aliphatic structure of coal sample.
Processes 13 01166 g008
Figure 9. Peak area of hydroxyl structure of coal samples.
Processes 13 01166 g009
Figure 10. Raman spectra of coal samples.
Processes 13 01166 g010
Figure 11. Raman spectral peak fitting curves.
Processes 13 01166 g011
Figure 12. Raman parameters of coal samples. (a) Peak position of each coal sample; (b) Full-width at half maximum of each coal sample; (c) Peak position difference of each coal sample; (d) Peak area ratio of each coal sample.
Processes 13 01166 g012
Figure 13. XRD pattern of each coal sample.
Processes 13 01166 g013
Figure 14. XRD peak fitting curve.
Processes 13 01166 g014
Figure 15. Change rate of different structure parameters of coal samples.
Processes 13 01166 g015
Figure 16. Schematic diagram of chemical structure evolution.
Processes 13 01166 g016
Table 1. Industrial analysis, elemental analysis and minerals analysis of coal samples.
Industrial Analysis (wt.%)Elemental Analysis (wt.%, daf)
Moisture,
Mad
Ash yield,
Aad
Volatile matter yield, VdafFixed carbon,
FCdaf
CHONS
1.1611.146.9693.0489.233.364.390.952.08
QuartzCalciteAmmonium micanon-crystalClay mineralsClay Mineral Content (%)
(%)(%)(%)(%)(%)KCII/S
0.70.413.475.310.226.9 13.4 32.7 27.0
K: Kaolinite; C: chlorite; I: Illite; I/S: Illite/Smectite mixed layer.
Table 2. Experimental scheme.
Coal Sample NumberPre-Fracturing Fluid System
GANone
GB0.2%PAM + 2%KCl + 0.04%(NH4)2S2O8
GC15%HCl + 2%KCl + 0.5%EDTA
GD12%HCl + 3%HF + 2%KCl + 0.5%EDTA
GE10%NaClO + 2%KCl
GF10%H2O2 + 2%KCl
Table 3. Attribution of infrared absorption peaks in coal samples.
Functional Group CategoryWavelength Range/cm−1Absorption Peak Form and Corresponding Structure
Aromatic structures730~7504 Adjacent H deformation
750~8103 Adjacent H deformation
810~8502 Adjacent H deformation
850~9001 Adjacent H deformation
Oxygen-containing structures1001~1021Ash, stretching vibration of Si-O group
1072~1077C-O stretching vibration in alkyl ether
1127~1135C-O stretching vibration in aryl ether
1175~1327Aromatic C-O stretching vibration
1373~1378Symmetric bending vibration of CH3
1426~1431Antisymmetric deformation vibration of CH2
1574~1600C=C stretching vibrations in conjugated or aromatic rings
1680~1725Aromatic C=O stretching vibration
1726~1772C=O stretching vibration of ketone, aldehyde, and -COOH
1790~1800C=O stretching vibration of aryl ester
Aliphatic structures2800~2818Methylene symmetric stretching vibration
2831~2853Methyl symmetrical stretching vibration
2871~2889Stretching vibration of methylidene
2902~2924Antisymmetric stretching vibration of methylene
2944~3000Antisymmetric stretching vibration of methyl group
Hydroxyl structure3000~3089Aromatic CH stretching vibration
3109~3232Cyclic association hydroxy-hydrogen bond
3248~3348Hydroxy-ether-oxygen hydrogen bond
3369~3468Hydroxy self-associated hydrogen bond
3488~3549Hydroxy-π hydrogen bond
3558~3600Free hydroxyl group
Table 4. Functional group parameters of coal samples.
Coal Sample NumberIDOC‘C’L
GA0.912.020.220.59
GB2.451.520.100.96
GC1.601.860.360.24
GD3.101.490.260.25
GE2.101.490.250.46
GF2.721.340.190.23
Table 5. Microcrystalline structure parameters of coal samples.
Coal Sample Numberd002/nmLa/nmLc/nmNaveg
GA0.3507055443.2182348662.052621015.8528330860.753533916
GB0.3500639843.4111322852.0583007635.8797844370.763864996
GC0.3504301763.6274047151.9929735885.6872202290.757968176
GD0.3498677393.4778560572.0210443115.776595220.767025131
GE0.3501592593.1987741742.0192048335.7665327390.762330767
GF0.3498279123.4495251982.1167035646.0506994730.76766647
Disclaimer/Publisher’s Note: The statements, opinions and data contained in all publications are solely those of the individual author(s) and contributor(s) and not of MDPI and/or the editor(s). MDPI and/or the editor(s) disclaim responsibility for any injury to people or property resulting from any ideas, methods, instructions or products referred to in the content.

