Abstract
In firefighting operations, the efficiency of centrifugal fire pumps is crucial for effective fire suppression. Designs aiming for lower shaft power enhance not only the pump’s energy efficiency and reliability but also lead to a reduction in size and weight. This research targets a single-stage centrifugal fire pump with a specific speed of 44.5, employing numerical simulations alongside orthogonal experiments to primarily focus on reducing shaft power. Based on a prototype, an L16(44) orthogonal experiment was conducted on four critical parameters: blade outlet angle, wrap angle, outlet width, and blade count. The study analyzed the impact of these parameters on pump performance, clarifying their influence on the hydraulic performance and proposing an optimal power-efficiency scheme. The optimized design successfully reduced the motor power from 18.5 kW to 15 kW, improved the impeller’s internal flow, minimized flow losses, and effectively managed the hump phenomenon. Operating at 1.5 Qn, the optimized pump’s power decreased by 2.67 kW, meeting head requirements while boosting efficiency, reducing resonance frequency, and lowering the pressure amplitude at the tongue. The optimized pump’s blade frequency distribution was more regular than the original, with the first-order mode’s average deformation decreasing from 3.6 mm to 3.3 mm, and average entropy production at rated flow dropping from 424.118 [W·m−3·K−1] to 384.957 [W·m−3·K−1]. These outcomes offer theoretical insights and practical guidance for designing low-shaft-power single-stage centrifugal fire pumps, significantly impacting energy efficiency and operational costs.
1. Introduction
In the fields of industry and firefighting, the performance optimization design of low-shaft-power single-stage centrifugal fire pumps has received extensive attention.
According to the requirements of China’s “Fire Pump (GB 6245-2006) [1]” and the Institute of Electrical and Electronics Engineers’ “Standard for the Installation of Stationary Pumps for Fire Protection (NFPA 20-2010)”, the design of fire pumps must follow these regulations: (1) The flow curve should be flat and smooth without any inflection points; (2) The actual head at the 0 Qn (zero-flow design point) condition of the fire pump must not exceed 1.4 times the rated condition; (3) The actual head at the 1.5 Qn (150% of design flow) condition should not be less than 0.65 times the rated condition; (4) Cavitation should not occur during long-term operation at the 1.5 Qn condition; (5) To ensure the safe and reliable operation of the water distribution network, the vibration intensity of the fire pump should also be limited. Therefore, the design of the fire pump must consider the head at three operating points, 0 Qn, 1.0 Qn, and 1.5 Qn, while also taking into account efficiency, vibration, and cavitation, three important indicators, which poses very high requirements for the hydraulic design of the fire pump.
In the field of centrifugal pump optimization design, scholars have extensively studied the impact of structural parameters on pump performance. Gu Yandong et al. [2] used Kriging models and genetic algorithms to optimize the efficiency of low-specific-speed pumps. Wang Yuqin et al. [3] improved pump efficiency and reduced energy loss with their intelligent design algorithms. Remo et al. [4] and Zhang Yue et al. [5] both optimized impeller design using three-dimensional geometric parameterization methods and simulation and inverse design techniques. Kim B et al. [6] discussed the impact of impeller geometry on fluid viscosity, finding that adjusting the length and wrap angle of the diffuser could improve head. Wang Jianan et al. [7] applied artificial intelligence algorithms to optimize key parameters such as the volute casing cross-sectional area, impeller interference, volute tongue length, and volute tongue angle, effectively enhancing the head, efficiency, and power performance of the centrifugal pump. Lu Rong et al. [8] combined experimental design with radial basis function neural networks to form an optimization platform, achieving automatic optimization of pump design through repeated design and simulation executions. The optimized design resulted in increased efficiency and effective control of channel vortices and hydraulic losses.
Combining numerical simulation with experiments, Han Xiangdong et al. [9] and M. Namazi et al. [10] optimized impeller design, enhancing hydraulic performance. Chen Xiaobin et al. [11] reduced computational costs and improved flow field prediction accuracy with their inverse design method. Ahmed et al. [12] diagnosed cavitation phenomena through vibration technology, analyzing the impact of different operating conditions. Li Xiaojun et al. [13] explored the distribution of total internal pressure, velocity, bubble volume, vortex structure, and entropy change, revealing the relationship between the internal flow characteristics and flow loss patterns of the pump, providing a theoretical basis for cavitation-resistant hydraulic design. Jia Xiaoqi et al. [14] further analyzed the impact of cavitation on pump performance, including total internal pressure, rotational speed, bubble volume, vortex structure, and entropy change, aiming to optimize the cavitation-resistant design of the centrifugal pump and improve its operational efficiency and stability.
Orthogonal testing is widely used in target optimization design. Yi Gao et al. [15], Li Zikang et al. [16], and Wang Yuqin et al. [3] optimized the performance of centrifugal pumps by altering auxiliary blade parameters and blade exit widths. Yang Yang et al. [17] optimized the drainage groove structure, improving hydraulic efficiency. Pei, J et al. [18] studied the impact of impeller geometric parameters on cavitation and optimized the impeller to improve cavitation and hydraulic performance. Ke Qidi et al. [19] used entropy weight optimization on TOPSIS to optimize the geometric parameter structure of grooved blades. Zhang Renhui et al. [20] used orthogonal decomposition to clarify the relationship between pump blade shape and hydraulic performance. Aydin Haci Dönmez et al. [21] and Bellary et al. [22] studied the impact of cavitation performance and blade angle on the performance of different liquids through orthogonal methods and Reynolds equation simulations.
In the field of pressure pulsation research in centrifugal pumps, scholars have achieved a series of important results. Cui Baoling et al. [23] used large eddy simulation (LES) to analyze the unsteady flow characteristics of an 11-stage centrifugal pump, finding significant pressure gradients on the rear edge of the blade pressure side and high vortex intensity on the suction side and rear edge. The pressure pulsation at the impeller inlet is dominated by the blade passing frequency, while, at the outlet, it is dominated by twice the blade passing frequency, with inter-stage interference affecting the main frequency of the second-stage impeller. Du Leilei et al. [24] studied the impact of rotor and stator matching on the flow field and pressure pulsation of centrifugal pumps, finding that increasing the number of blades can reduce pressure pulsation, improve flow field distribution, and stabilize the internal flow of the pump.
In academic research on modal analysis of centrifugal pumps, Wang Qiang et al. [25] used Solidworks Simulation to perform modal analysis on an API C-228D-173-74-type pumping station (manufactured by SJ Petroleum Machinery Company, Jingzhou, Hubei Province, China), determining the first six mode shapes and natural frequencies of the prestressed frame. The lowest natural frequency was 22.39 Hz, with a resonance risk. Peng Guangjie et al. [26] used ANSYS-Workbench 2022 for fluid–structure interaction analysis, calculating the reaction force of the fluid on the rotor and applying it to dry and wet modal analysis. The study found that increasing the shaft length reduces the first natural frequency of the prestressed rotor, and the natural frequency under wet conditions is about 16% lower than under dry conditions. Feron, J. et al. [27] introduced static modal analysis, revising the scientific research on this pin-jointed structure conducted over the past 40 years. The core of this approach lies in solving static equilibrium and compatibility equations in modal space, revealing new aspects of the interrelationship between the force method and the displacement method, thereby enhancing their complementarity.
In addition, Li et al. [28] proposed a two-phase particle flow modeling and particle aggregation control method for snakelike biomimetic microchannels in microfluidic chips based on ultrasound. By coupling the lattice Boltzmann method (LBM) with the discrete element method (DEM), and integrating it with a large eddy simulation (LES) model, the particle flow dynamics model is established. The LBM-LES-DEM model reveals the mixing and mass transfer mechanisms and particle distribution patterns in serpentine channels under different flow and particle conditions. It provides technical support for optimizing mixing efficiency and dynamic process in microfluidic chips. Tan et al. [29] reviewed the latest development of soft abrasive flow finishing (SAF) methods in confined spaces. The multiphase fluid dynamics modeling, material removal mechanism, assisted reinforcement finishing technique, and surface impact effect observation of abrasive particles and cavitation bubbles are briefly introduced. Mao et al. [30] proposed a flexible water pump driven by EHD fluid that utilizes the water–EHD interface to push an immiscible water-based liquid and uses a nozzle diffuser system to propel the process. In addition, a model is developed for the EHD pump and nozzle diffuser system to predict the generated flow rate, taking into account factors such as the asymmetric performance of the EHD pump, pulse frequency, applied voltage, and structural parameters.
This paper takes the XBD7-10G-LPP-X-03 single-stage (manufactured by Lio Group Pump Co Ltd., Hangzhou, China) fire centrifugal pump as the research object, using orthogonal testing to analyze four key parameters of the single-stage fire centrifugal pump: blade exit angle, blade wrap angle, exit width, and number of blades. It clarifies the impact of each parameter on hydraulic performance to determine the optimal scheme, achieving the design goals of optimizing hydraulic performance and reducing energy consumption. Combined with numerical simulation, the flow field of the optimized pump is also analyzed. The research results can provide certain theoretical and technical support for the optimized design of fire centrifugal pumps.
2. Calculation Model and Method
2.1. Calculation Model
The calculation model in this paper is a single-stage single suction centrifugal pump with a high specific speed of 44.5. The design parameters are as follows: flow rate Q = 36 m3/h, head H = 70 m, rotational speed n = 2950 r/min. Table 1 shows the other main geometric parameters of the model.

Table 1.
Main parameters of centrifugal pump impeller.
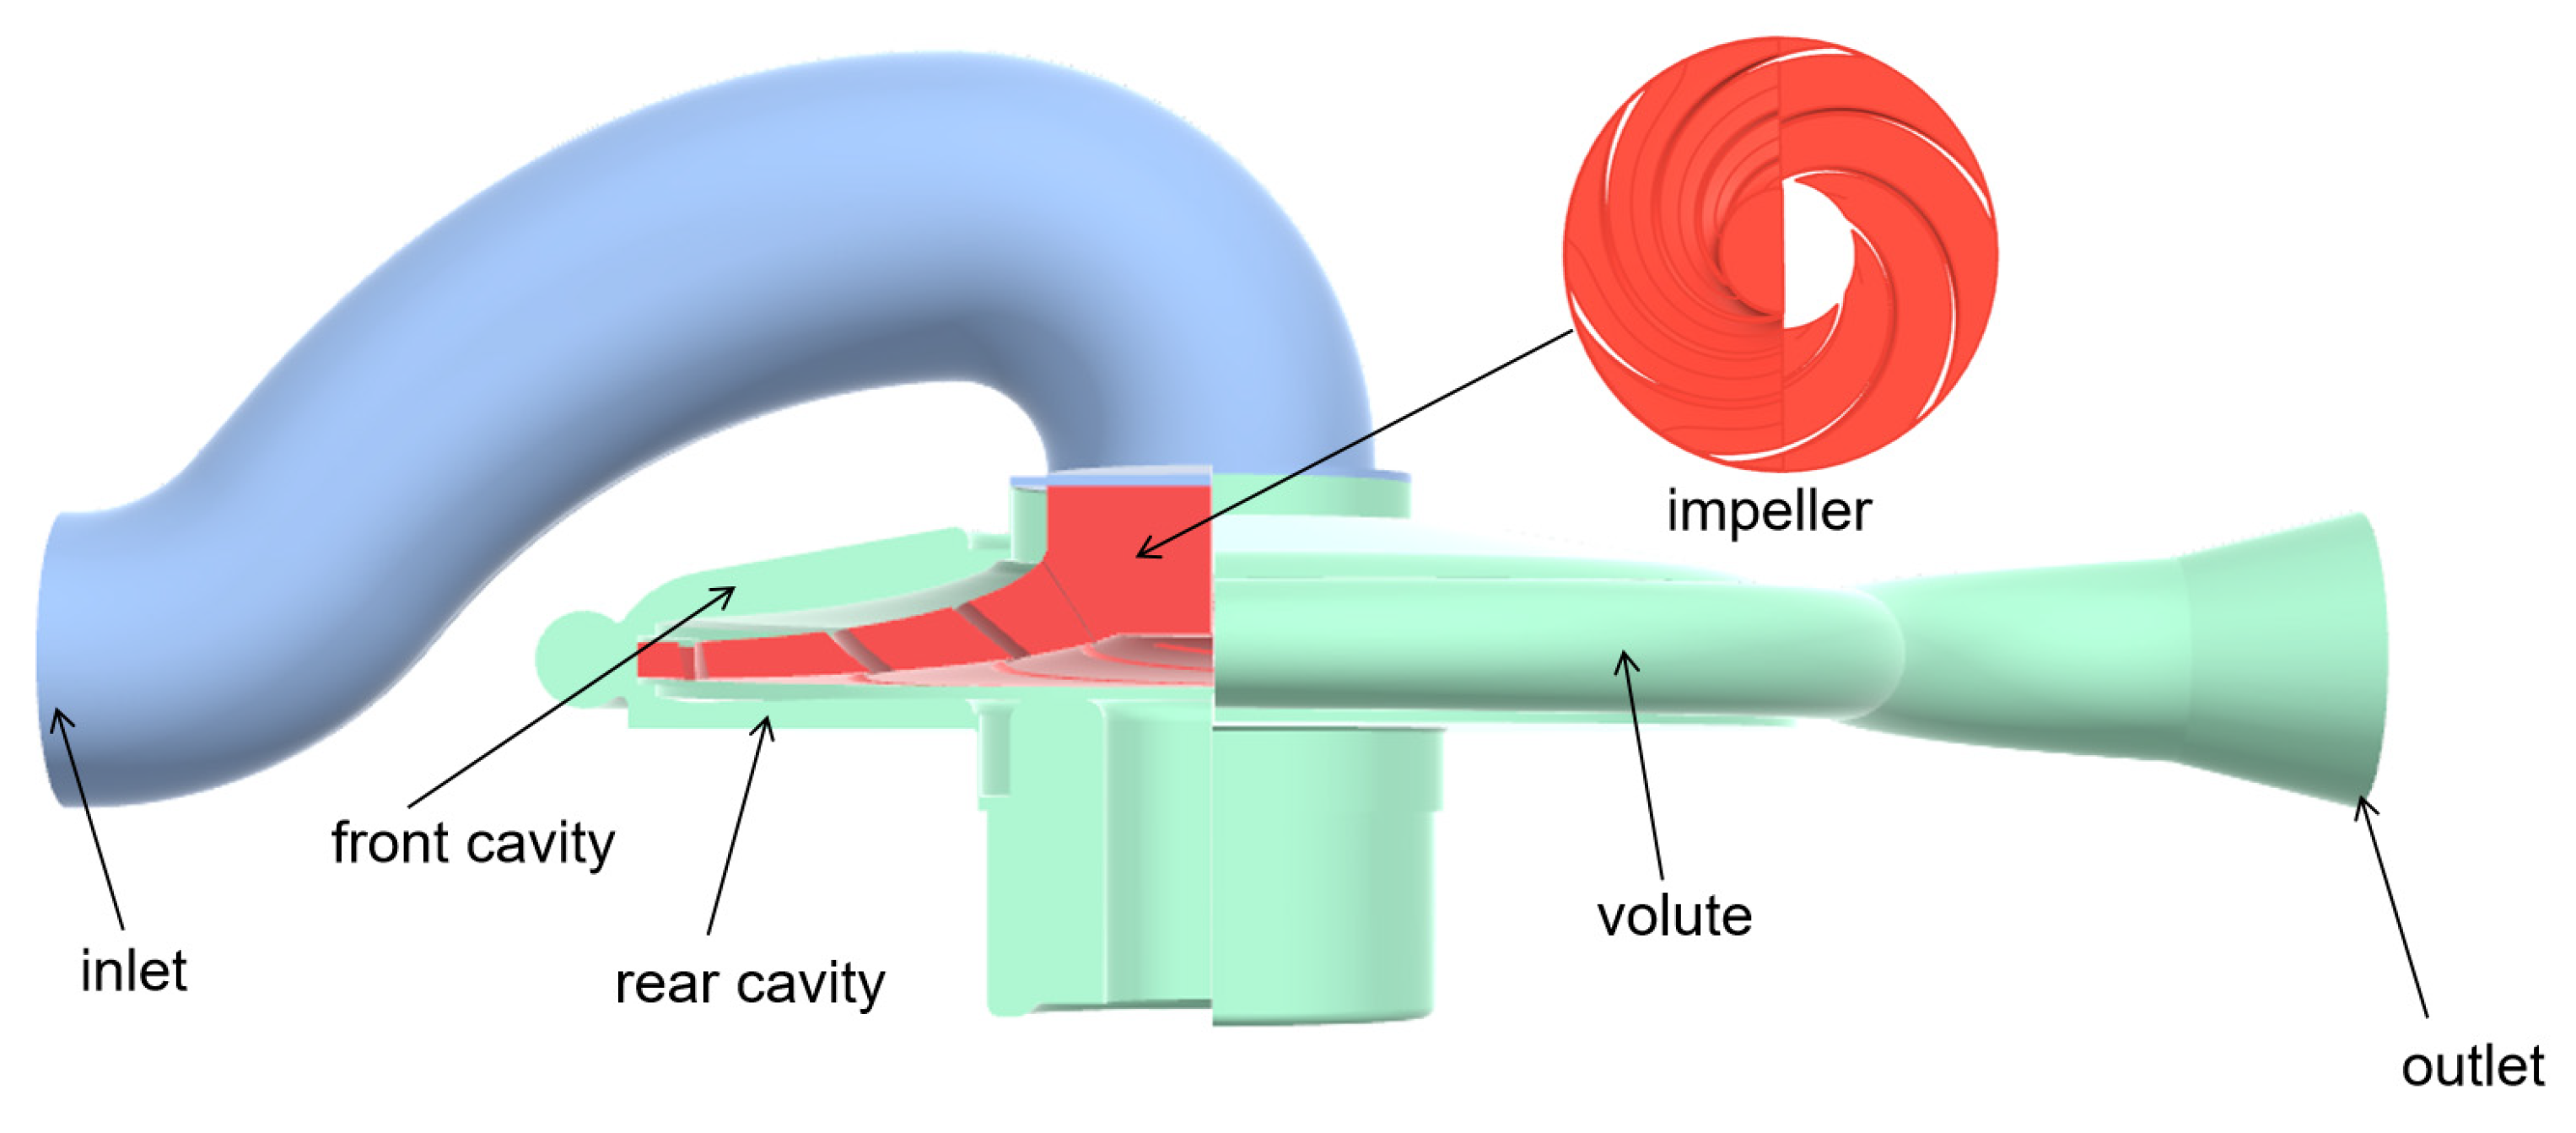
Figure 1 shows the single-stage centrifugal pump water domain model. The computational domain of the single-stage fire centrifugal pump mainly includes the inlet, impeller, volute, front cavity, and rear cavity.

Figure 1.
Computational domain grid.
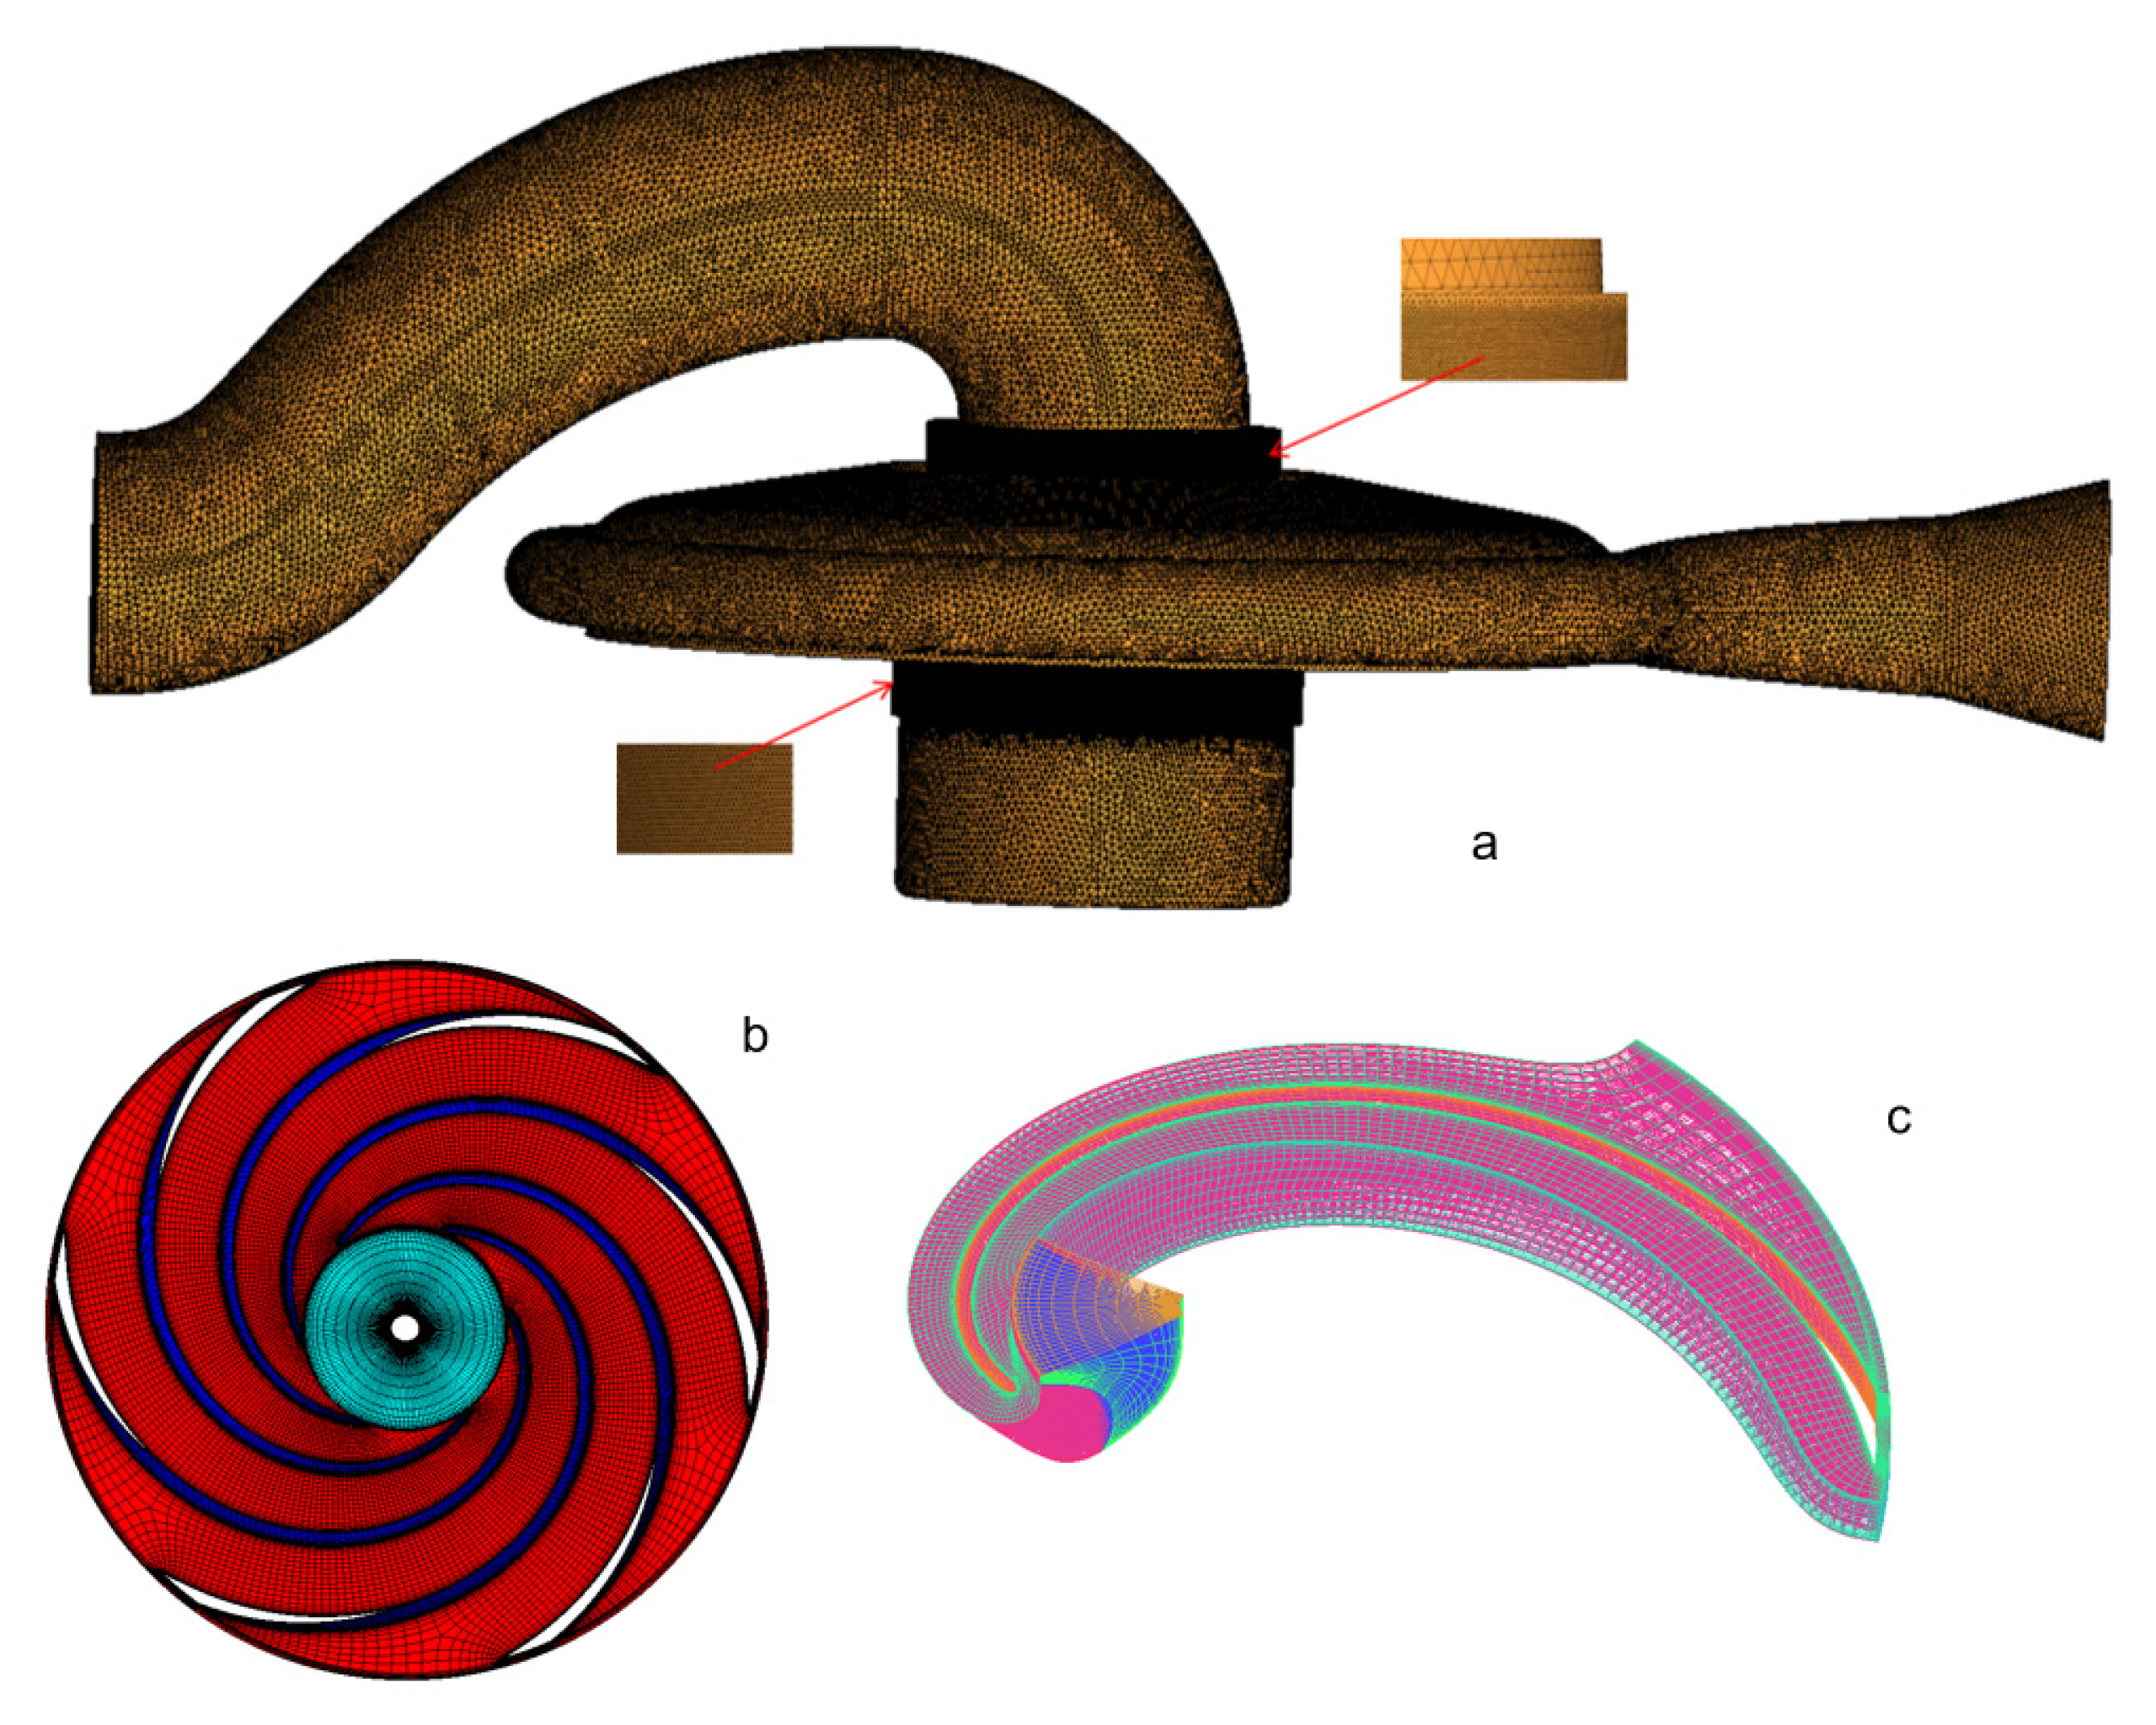
Figure 2 shows the 3D model of the pump established by CFturbo 2022 and SolidWorks 2023 software. It includes an impeller volute geometry model, integral geometry model, and solid model.
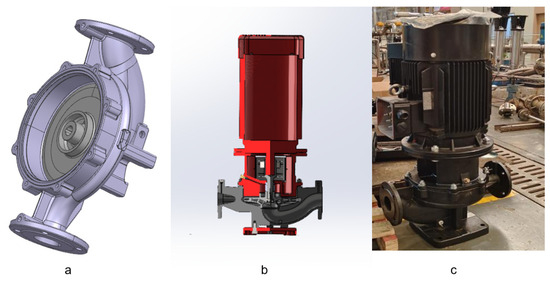
Figure 2.
The 3D model of the pump established by CFturbo 2022 and SolidWorks 2023 software. (a) Geometric model of impeller snail shell; (b) overall geometric model; (c) entity model.
2.2. Turbulence Model
In this study, the SST k-ω model is employed, which utilizes a blending function to achieve a smooth transition between the near-wall region and the region far from the wall. This approach effectively enhances the prediction accuracy of turbulence characteristics within the boundary layer, particularly under conditions of adverse pressure gradients and flow separation.
The SST k-ω turbulence model was selected due to its capacity to integrate the advantages of both k-ε and k-ω formulations, demonstrating exceptional competence in addressing complex flow phenomena including separated flows, rotational flows, and regions with high shear stress gradients. This hybrid model exhibits superior performance in boundary layer resolution, characterized by enhanced adaptability to various flow regimes and computational efficiency.
The fundamental equations of the SST k-ω model are presented as follows:
The transport equation for turbulent kinetic energy (k) is
The transport equation for the turbulent dissipation rate (ω) is
The calculation formula for turbulent viscosity (t) is
In the equation, ρ is the density, t is the time, k is the turbulent kinetic energy, and ω is the specific dissipation rate. The terms β∗, σk, γ, β, σω, σω2, and S are model constants. Additionally, μ represents the dynamic viscosity, μ1 is the turbulent eddy viscosity, and ν1 is the turbulent eddy viscosity coefficient. The functions F1 and F2 are blending functions, while α∗ is the reduction coefficient for turbulent viscosity in the standard model.
2.3. Grid Independence Analysis
The computational mesh was generated using ICEM CFD 2022. To address the complex flow passage structure of the centrifugal pump, the fluid domain of the volute was discretized using tetrahedral unstructured grids, while structured grids were employed for the impeller. To ensure the accuracy of the flow field solution, local refinement was applied to the volute to capture the significant flow gradient variations. Figure 3 illustrates the computational domain mesh of the original pump.

Figure 3.
Computational domain grid. (a) Outer part of the fluid domain; (b) impeller; (c) single flow channel of the impeller.
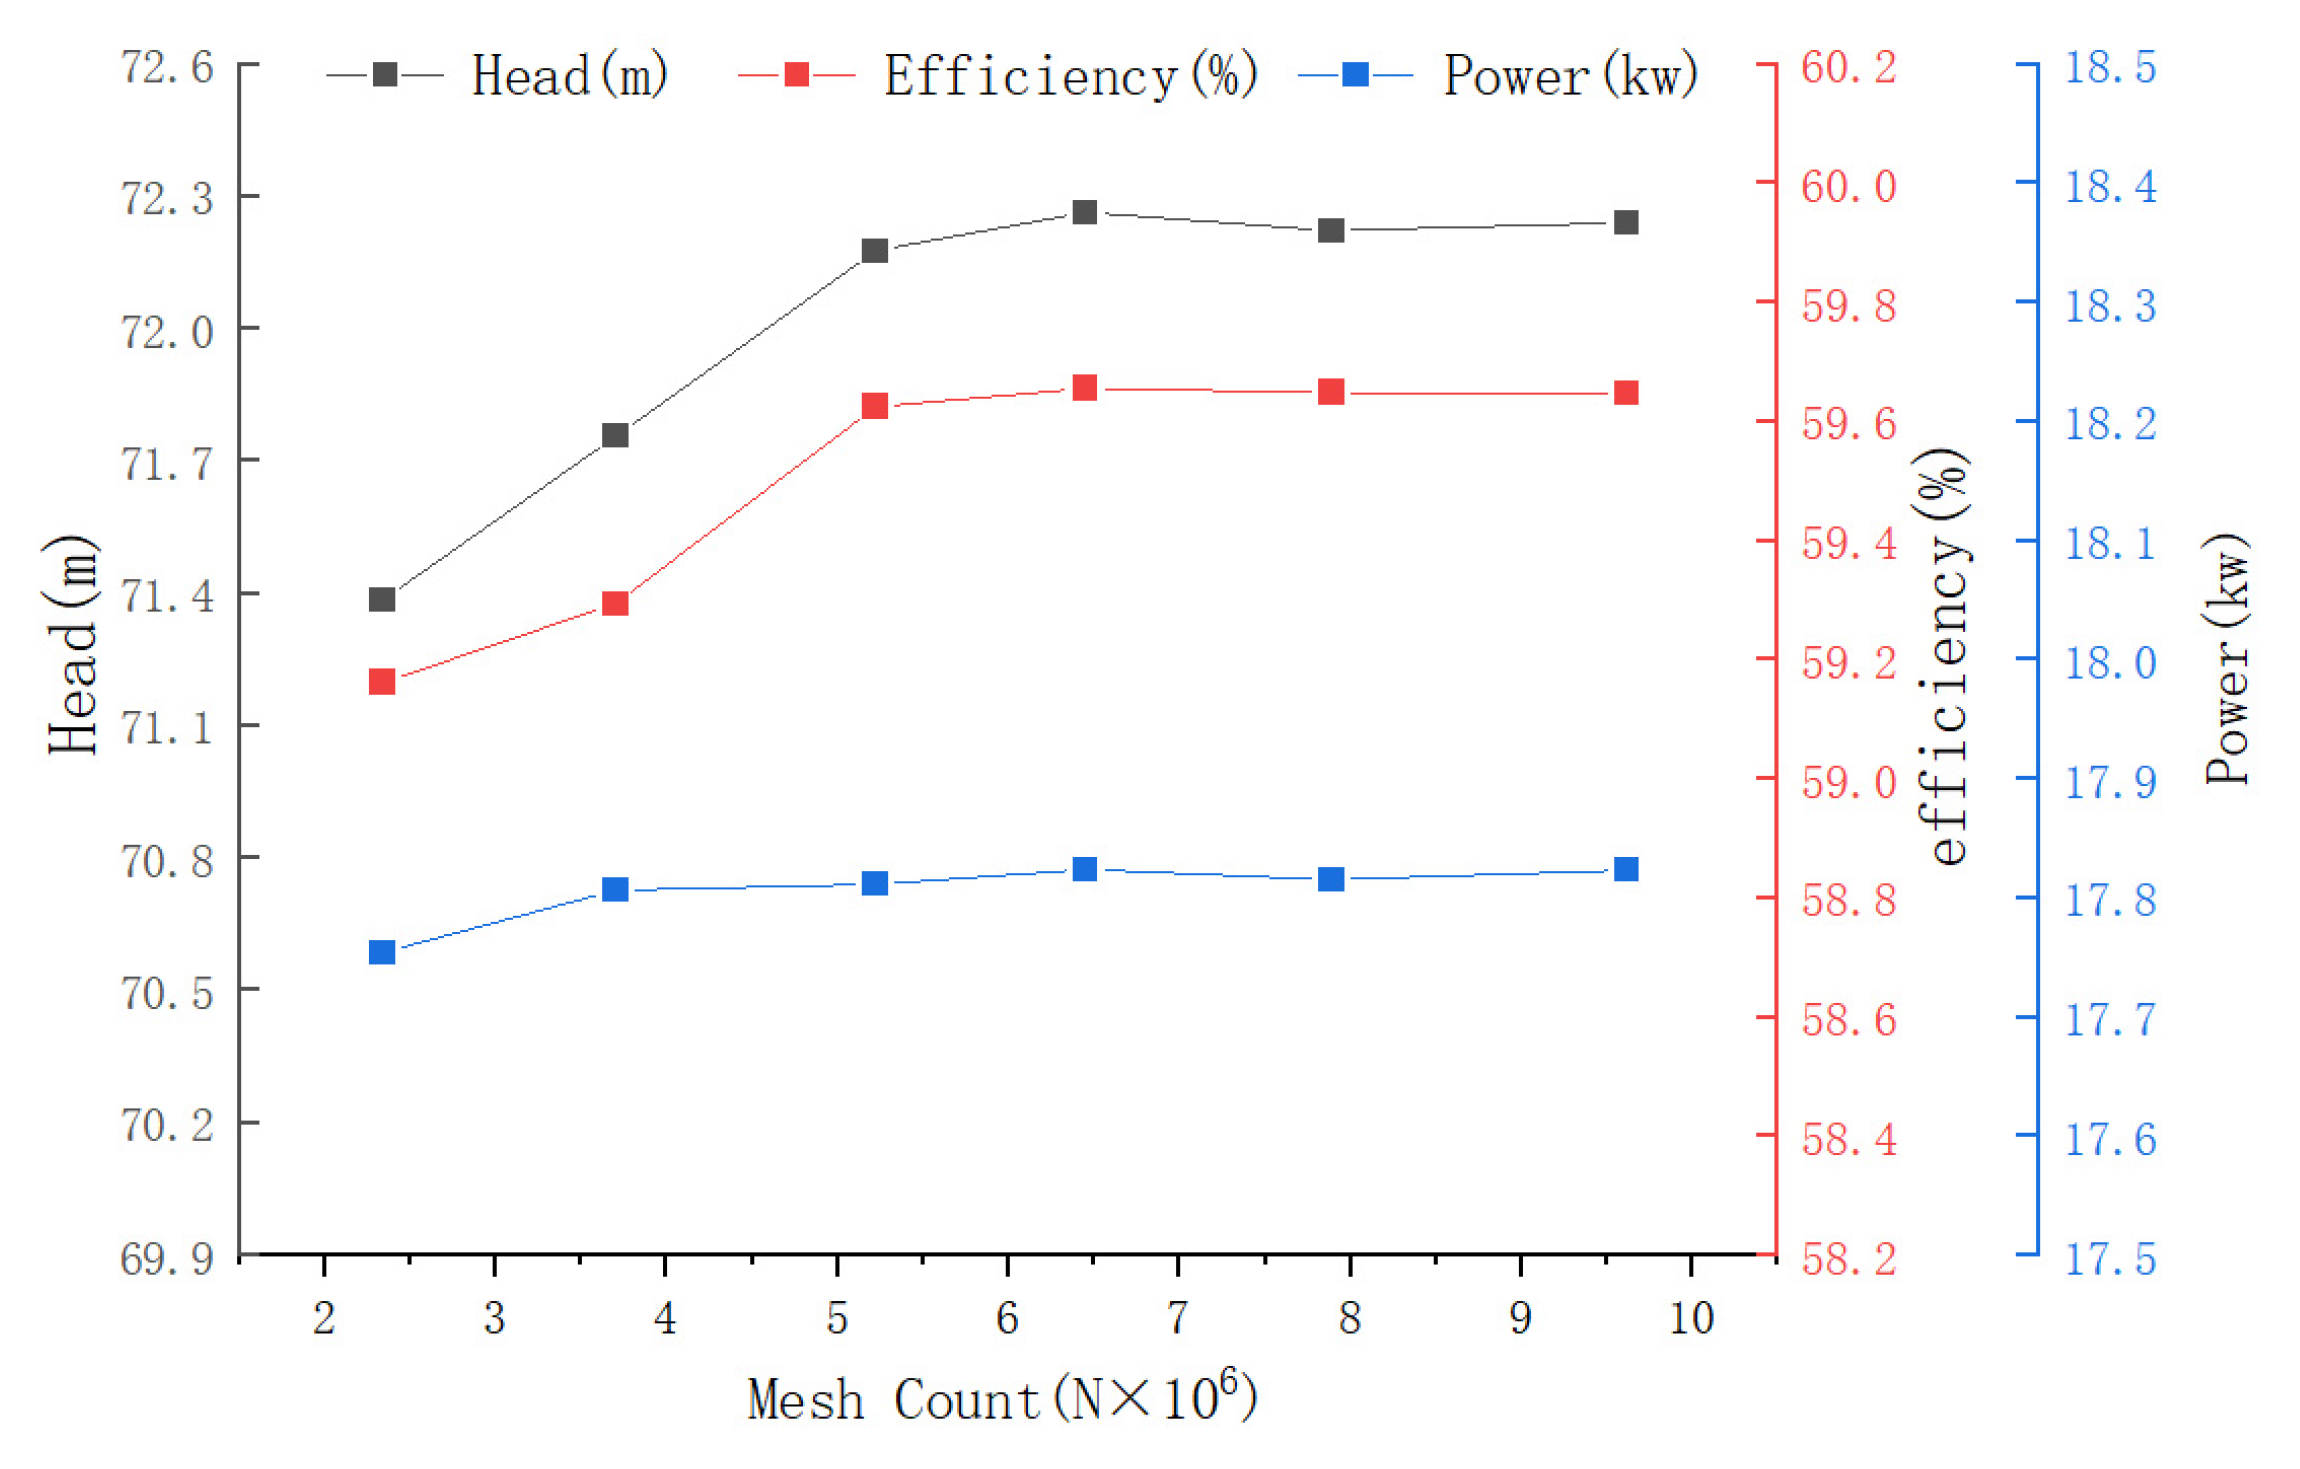
Due to the influence of the number of grid cells on the computational results, a grid independence analysis is required. As shown in Figure 4, six sets of single-stage centrifugal pump models with different grid cell counts were compared under the rated operating conditions in terms of head and efficiency. It can be observed from the figure that, when the number of grid cells exceeds 6.5 million, the computational results for head and efficiency tend to stabilize with the increase in grid cells. This suggests that the efficiency and head are independent of the grid cell count at this point. Considering both computational accuracy and resources, a model with a total of 6,459,276 grid cells is selected for the calculation.
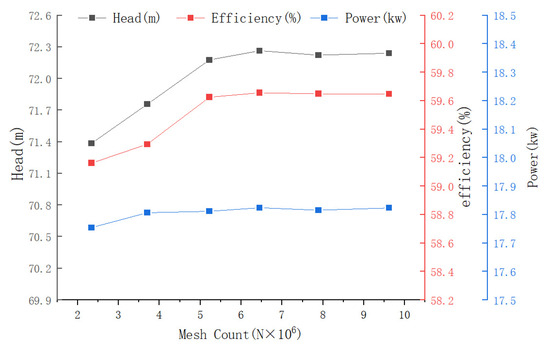
Figure 4.
Grid independence verification.
2.4. Calculation Method
In this study, numerical simulations were performed using ANSYS-CFX 2022. The RNG k-ω turbulence model was employed, and the standard wall function method was applied to handle the near-wall region. The inlet boundary condition was set as a mass flow inlet (10 kg/s), while the outlet boundary condition was defined as a pressure outlet (700 kPa). The impeller region was designated as a rotating domain, and the remaining regions were set as stationary domains. The frozen rotor technique was used for mass transfer across the rotating–stationary interfaces. The walls were treated as adiabatic no-slip boundaries, and the standard wall function method was applied to the near-wall regions. The computational domain was discretized using a second-order discretization scheme. In the solver controls, the maximum number of iterations was set to 1000, and the convergence criterion was defined as an average residual of less than 10−5. Table 2 summarizes all the boundary condition settings.
Table 2.
Boundary condition settings.
2.5. Prediction Algorithm
ANSYS-CFX 2022 simulations do not directly provide parameters such as the head and efficiency of the centrifugal pump; these values need to be calculated using specific formulas. The head, efficiency, and power of the centrifugal pump are obtained through Equations (4)–(6):
In this context, Ps denotes the inlet pressure in MPa; Pd signifies the outlet pressure in MPa; vs represents the velocity of the fluid at the inlet in m/s; Vd indicates the velocity of the fluid at the outlet in m/s; ρ is the density of water, which is 998.2 kg/m3; g is the acceleration due to gravity, which is 9.81 m/s2; Zs is the vertical distance between the horizontal plane and the inlet pressure measurement plane in meters; Zd is the vertical distance between the horizontal plane and the outlet pressure measurement plane in meters; Q signifies the volumetric flow rate in m3/s; H represents the head in meters; n denotes the rotational speed in revolutions per minute (r/min); Mn is the torque in Newton-meters (N·m); η represents the efficiency of the water pump, %.
2.6. Model Verification
The characteristic curve of the model pump is measured on the experimental platform in order to verify that the model can simulate correctly, as shown in Figure 5. Pressure meters are installed in the inlet and outlet pipe of centrifugal pump. Before starting the centrifugal pump, the pump and the inlet pipe should be filled with water to discharge the air in the pump.
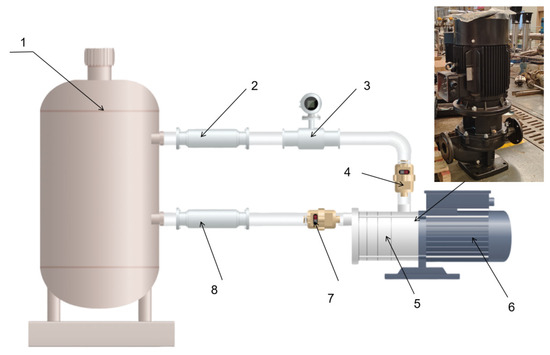
Figure 5.
Experimental setup: (1) water tank; (2) outlet valves; (3) electromagnetic flowmeters; (4) outlet pressure gauges; (5) centrifugal pumps; (6) motors; (7) inlet pressure gauges; (8) inlet valves.
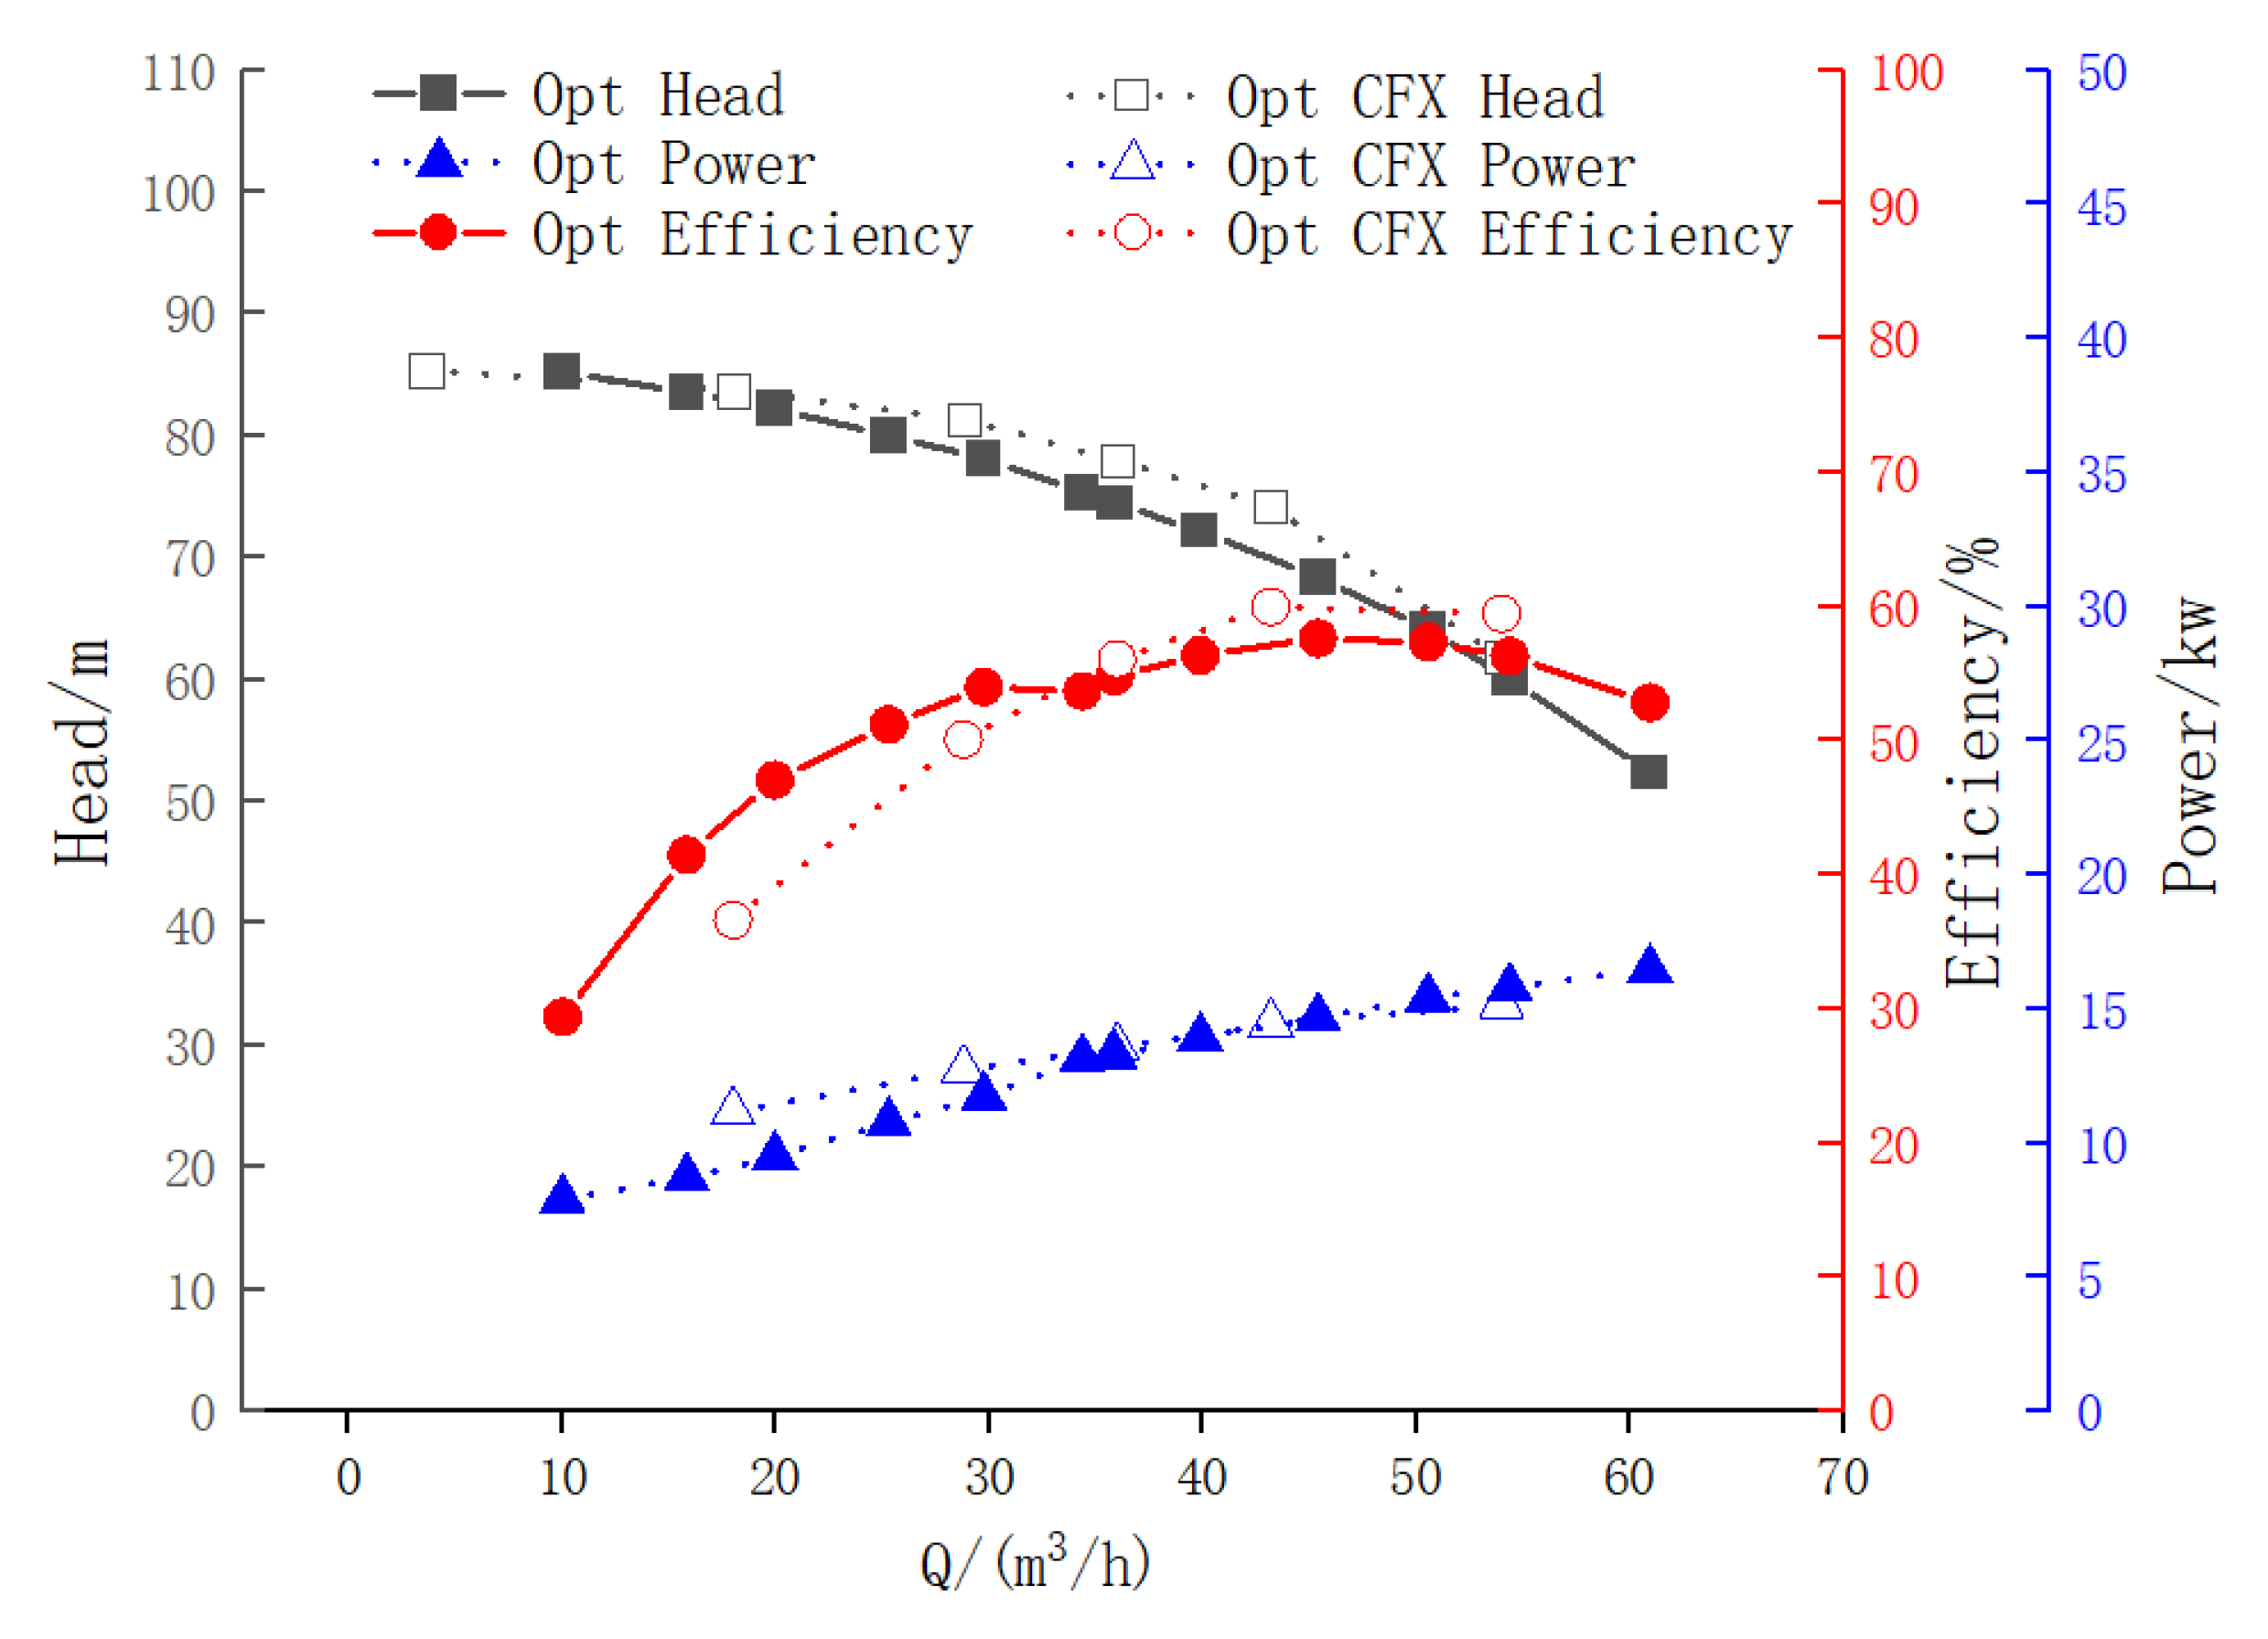
As shown in Figure 6, the trends of head and efficiency versus flow rate for the optimized pump are in good agreement between experimental and simulation results. However, under high-flow conditions, the numerical simulation results are slightly higher than the experimental values. This discrepancy arises because the simulation does not account for clearance flow due to limitations in the original pump geometry and computational resources. Additionally, various frictional and hydraulic losses present in the experimental process are neglected in the numerical simulation, leading to overestimated head and efficiency in the simulation results. Nevertheless, the overall trends of the performance curves are consistent, and the highest efficiency points align well. The errors are within an acceptable range, with a maximum error of less than 5%. This indicates that the model can accurately predict the pump’s performance characteristics and is suitable for flow field analysis and orthogonal experiments. Since the error in the performance curves is relatively low near the rated operating point, the numerical simulation results at the 1.5 Qn operating condition were selected for further analysis in this study.

Figure 6.
Optimal pump simulation and experimental data.
3. Orthogonal Experimental Scheme
The primary objective of this study is to optimize the centrifugal pump through orthogonal experimental design. Orthogonal experimental design is a method that utilizes orthogonal arrays to analyze the influence of multiple factors on overall performance. The principle of this method is to select a set of representative level combinations from all possible factor combinations based on orthogonality, and then simulate the experimental results for these combinations. Ultimately, the impact of each parameter on the overall performance can be determined, and the optimal level combination can be identified. This approach is an efficient and convenient optimization design method. The roughness standard is selected, and the impeller is 3D printed, which minimizes the influence of manufacturing tolerances on the optimal design.
3.1. Factors Selection
The specific speed of the prototype pump is 12, classifying it as a low-specific-speed centrifugal pump. Based on the unique structure of single-stage centrifugal pumps and industry design experience, the number of blades for low-specific-speed centrifugal pumps typically ranges from 4 to 7. For low-specific-speed single-stage centrifugal pumps, when the number of blades is small, the blade wrap angle Δφ should be appropriately increased. Considering both computational cost and experimental accuracy, the main factors affecting pump efficiency and head were selected as optimization variables, including the blade outlet angle β2, blade wrap angle Δφ, impeller outlet width b2, and number of blades z, all of which are related to the impeller design. Thakkar et al. [31] identified three candidate parameters and calculated the influencing factors of the three parameters. The results show that the blade envelope angle (Δφ), blade outlet angle (β2), and impeller outlet width (b2) have significant effects on the efficiency, head, and shaft power of the low-specific-speed centrifugal pump. Considering the need to limit the impeller outlet diameter (D2) but not the blade number z in the new product compatibility study, four parameters were selected: the blade number (z), the blade outlet angle (β2), the impeller outlet width (b2), and the blade envelope angle (Δφ).
3.2. Orthogonal Table Design
Table 3 presents the factors and their corresponding levels for the orthogonal experiment on the single-stage centrifugal pump. In Table 3, the four variables of the orthogonal experiment are represented by A, B, C, and D, where A denotes the number of blades, B represents the blade wrap angle, C corresponds to the impeller outlet width, and D signifies the blade outlet angle. Four levels were assigned to each variable for simulation-based optimization. The settings of the parameter levels were determined based on preliminary simulation and experimental results and were designed to cover the range of possible optimizations while avoiding excessive computational and experimental costs.
Table 3.
Levels of factors in the orthogonal experiment.
With power and efficiency as the optimization objectives, an orthogonal experiment was conducted based on the prototype pump, as shown in Table 4. The four key parameters—blade outlet angle, blade wrap angle, outlet width, and number of blades—were designed into an L16(44) orthogonal array, resulting in a total of 16 test cases.
Table 4.
Orthogonal test factor values.
3.3. Orthogonal Analysis
Through numerical simulations using ANSYS CFX 2022, the head, efficiency, and power of the centrifugal pump for the 16 orthogonal design schemes were obtained, as shown in Table 5. These results can be used to identify the optimal parameter combination.
Table 5.
Numerical calculation results: scheme, efficiency, and power.
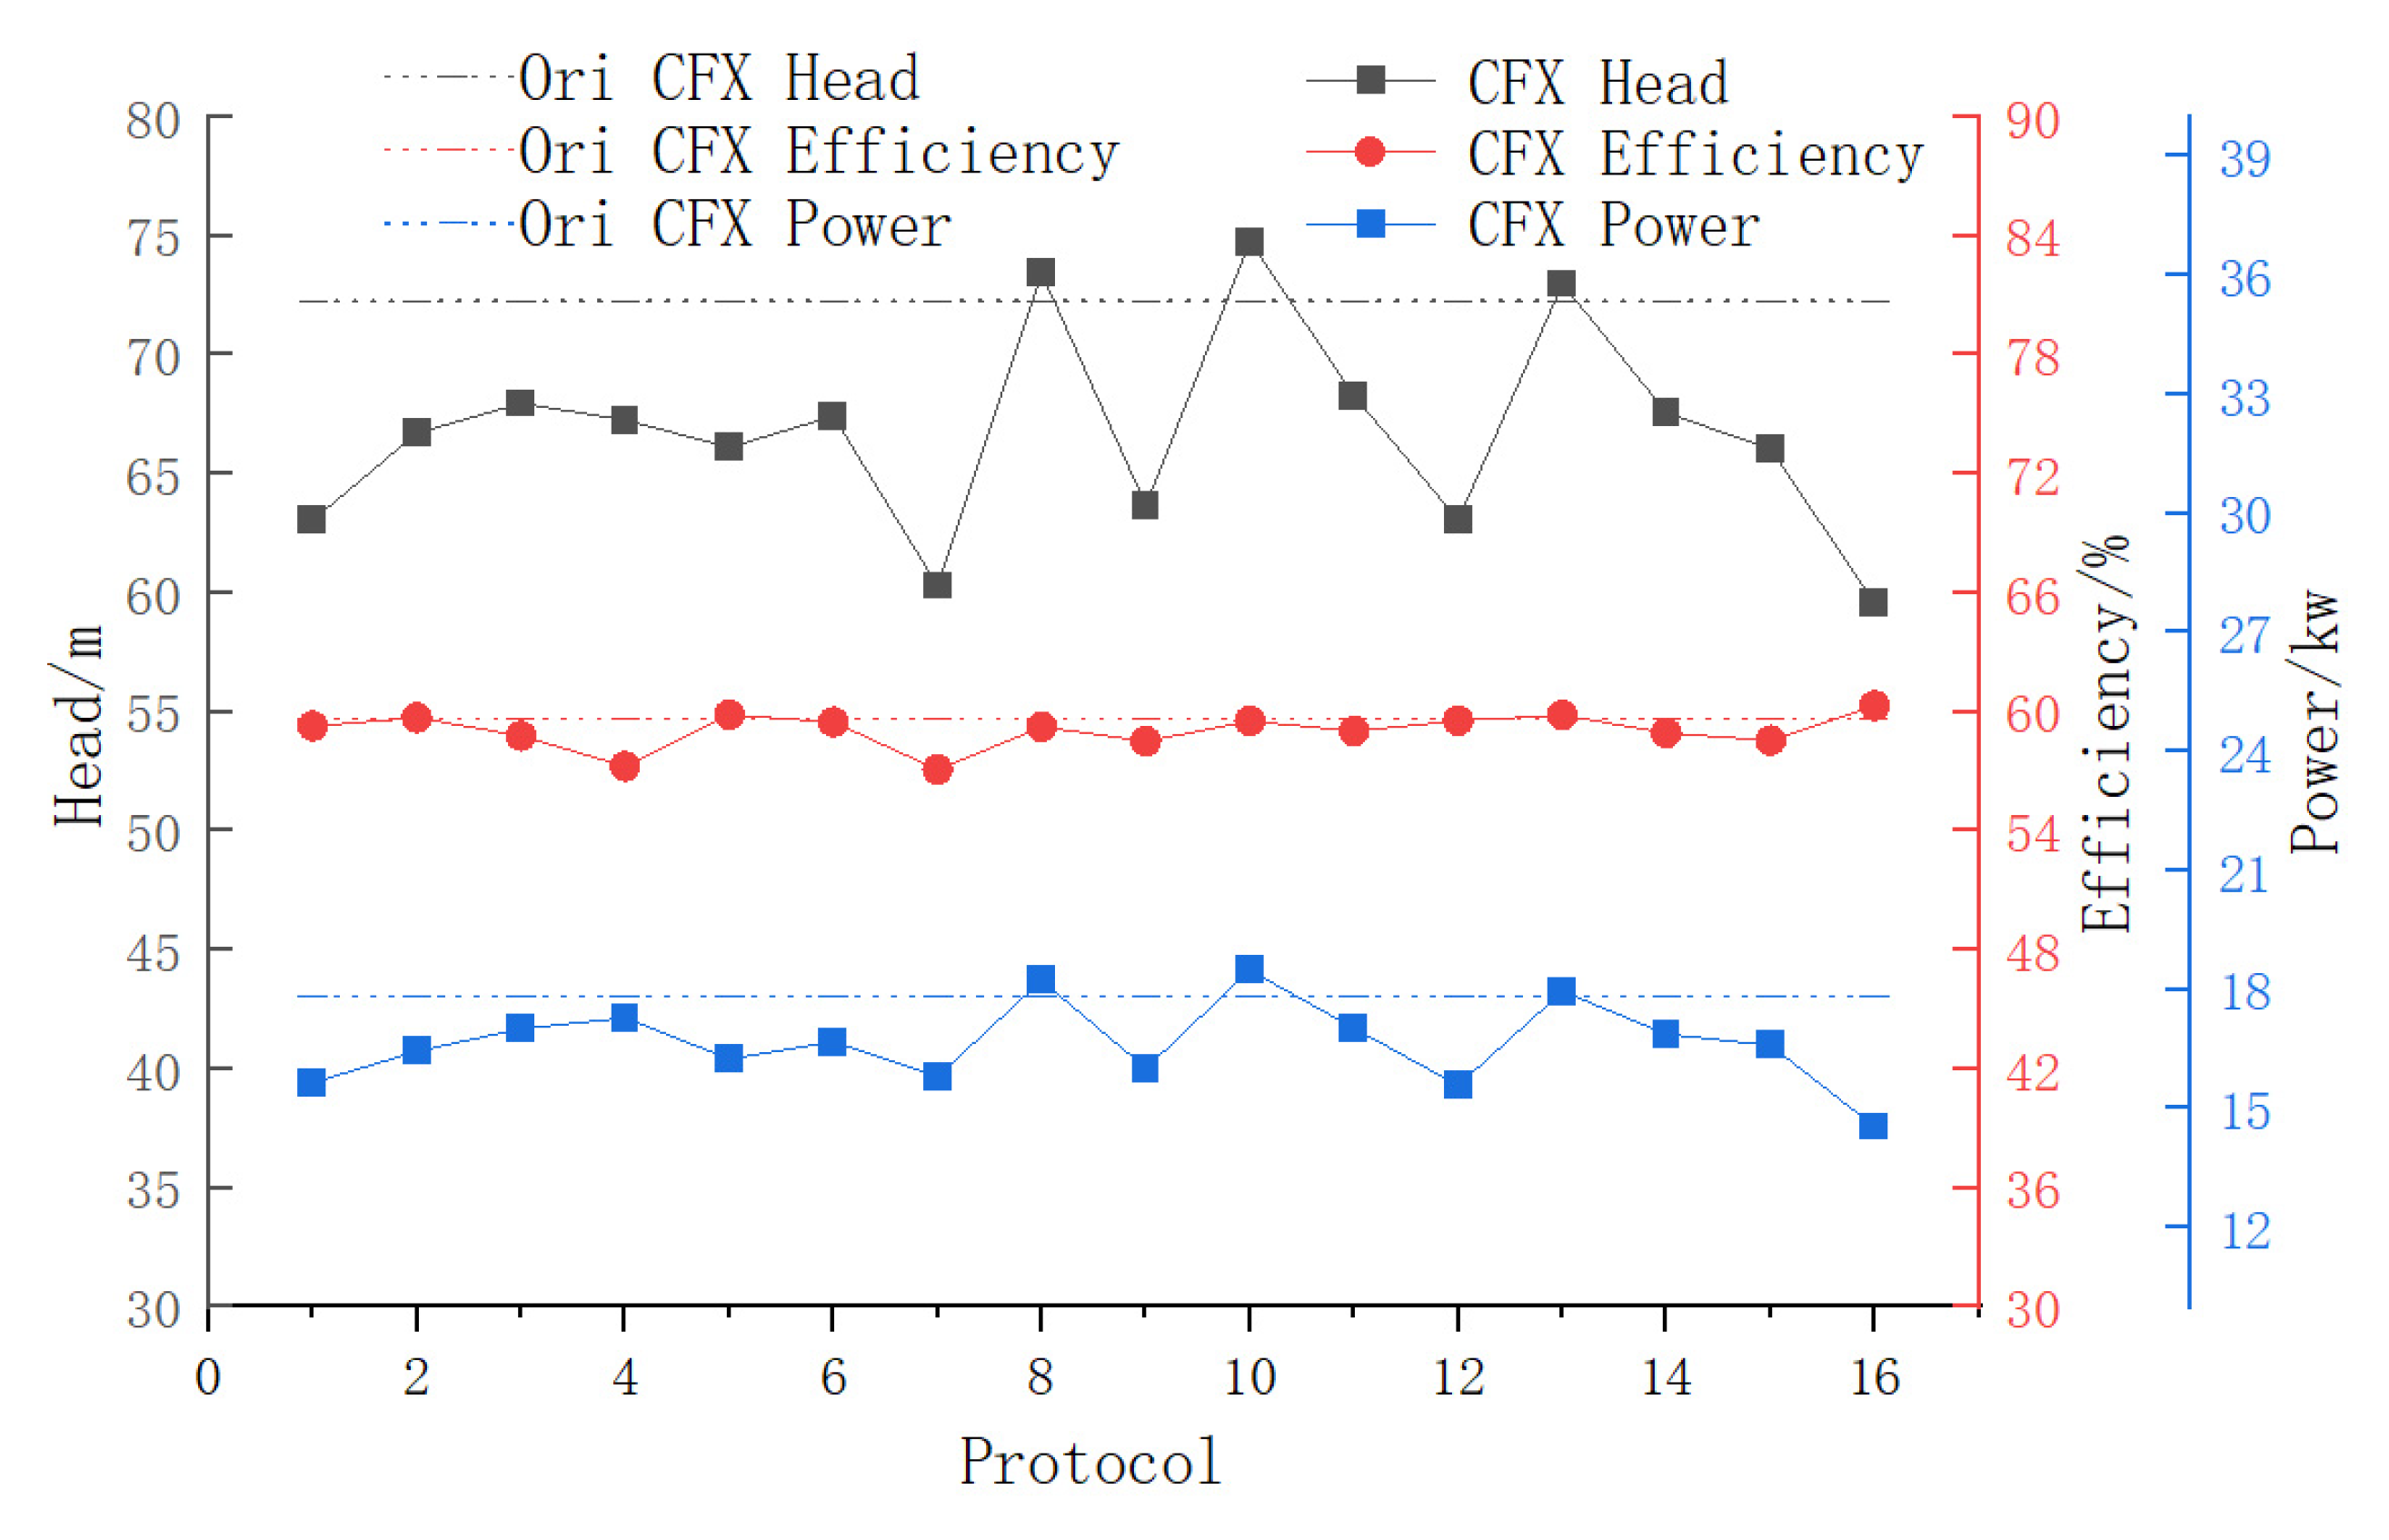
The simulation results from Table 5 are plotted in Figure 7 for comparison with the prototype pump’s performance. As shown in the figure, Schemes 4 and 7 failed to achieve the goal of efficiency optimization and were thus directly excluded. Schemes 8, 10, and 13 exhibited higher head values but at the cost of significantly increased energy consumption. On the other hand, Schemes 5, 13, and 16 showed higher efficiency but with relatively lower head values. To quantify the influence of each factor on the optimization objectives, a range analysis was conducted for further evaluation.
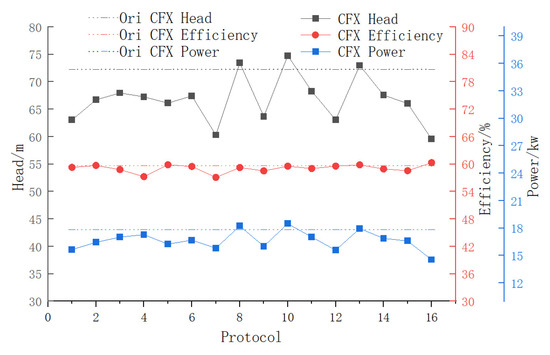
Figure 7.
Original pump simulation and orthogonal experimental simulation data.
3.4. Range Analysis
Range analysis was applied to further scrutinize the outcomes of the numerical computations. The mean and range values in the orthogonal experiments were derived using Equations (7) and (8):
In this context, in the equations, Ki and ki (i = 1, 2, 3…) denote the sum and the average value of the levels for each factor i, respectively. R represents the range, which reflects the degree of influence of each factor.
The mean values and range values of each factor in the orthogonal experiment are shown in Table 6. In the orthogonal experiment, we considered the interaction between parameters and evaluated the impact of each parameter and its interaction on performance indicators through variance analysis. An analysis was conducted on the range values of head and efficiency under high-flow working conditions. The influence order of factors on head is B > C > A > D, so the optimal combination for head is A4B1C4D3. The influence order of factors on efficiency is A > B > C > D, so the optimal combination for head is A1B1C3D3. The influence order of factors on power is A > B > C > D, so the optimal combination for head is A1B4C3D1.
Table 6.
Orthogonal experimental mean and range difference values of each factor.
The lowest power of the centrifugal pump was prioritized as the evaluation criterion, with the optimal power configuration identified as A1B4C3D1. As shown in Table 5, an increase in the blade wrap angle leads to a larger range for head, efficiency, and power, with the most pronounced effect on head. Therefore, appropriately reducing the blade wrap angle can simultaneously improve head and efficiency. Considering that increasing the blade wrap angle in practical manufacturing also increases processing difficulty, the optimal design combination was determined as A1B3C3D1, corresponding to four blades, a blade wrap angle of 240°, an impeller outlet width of 7.9 mm, and a blade inlet angle of 6.6°.
4. Results and Discussion
4.1. Numerical Simulation of Optimal Model
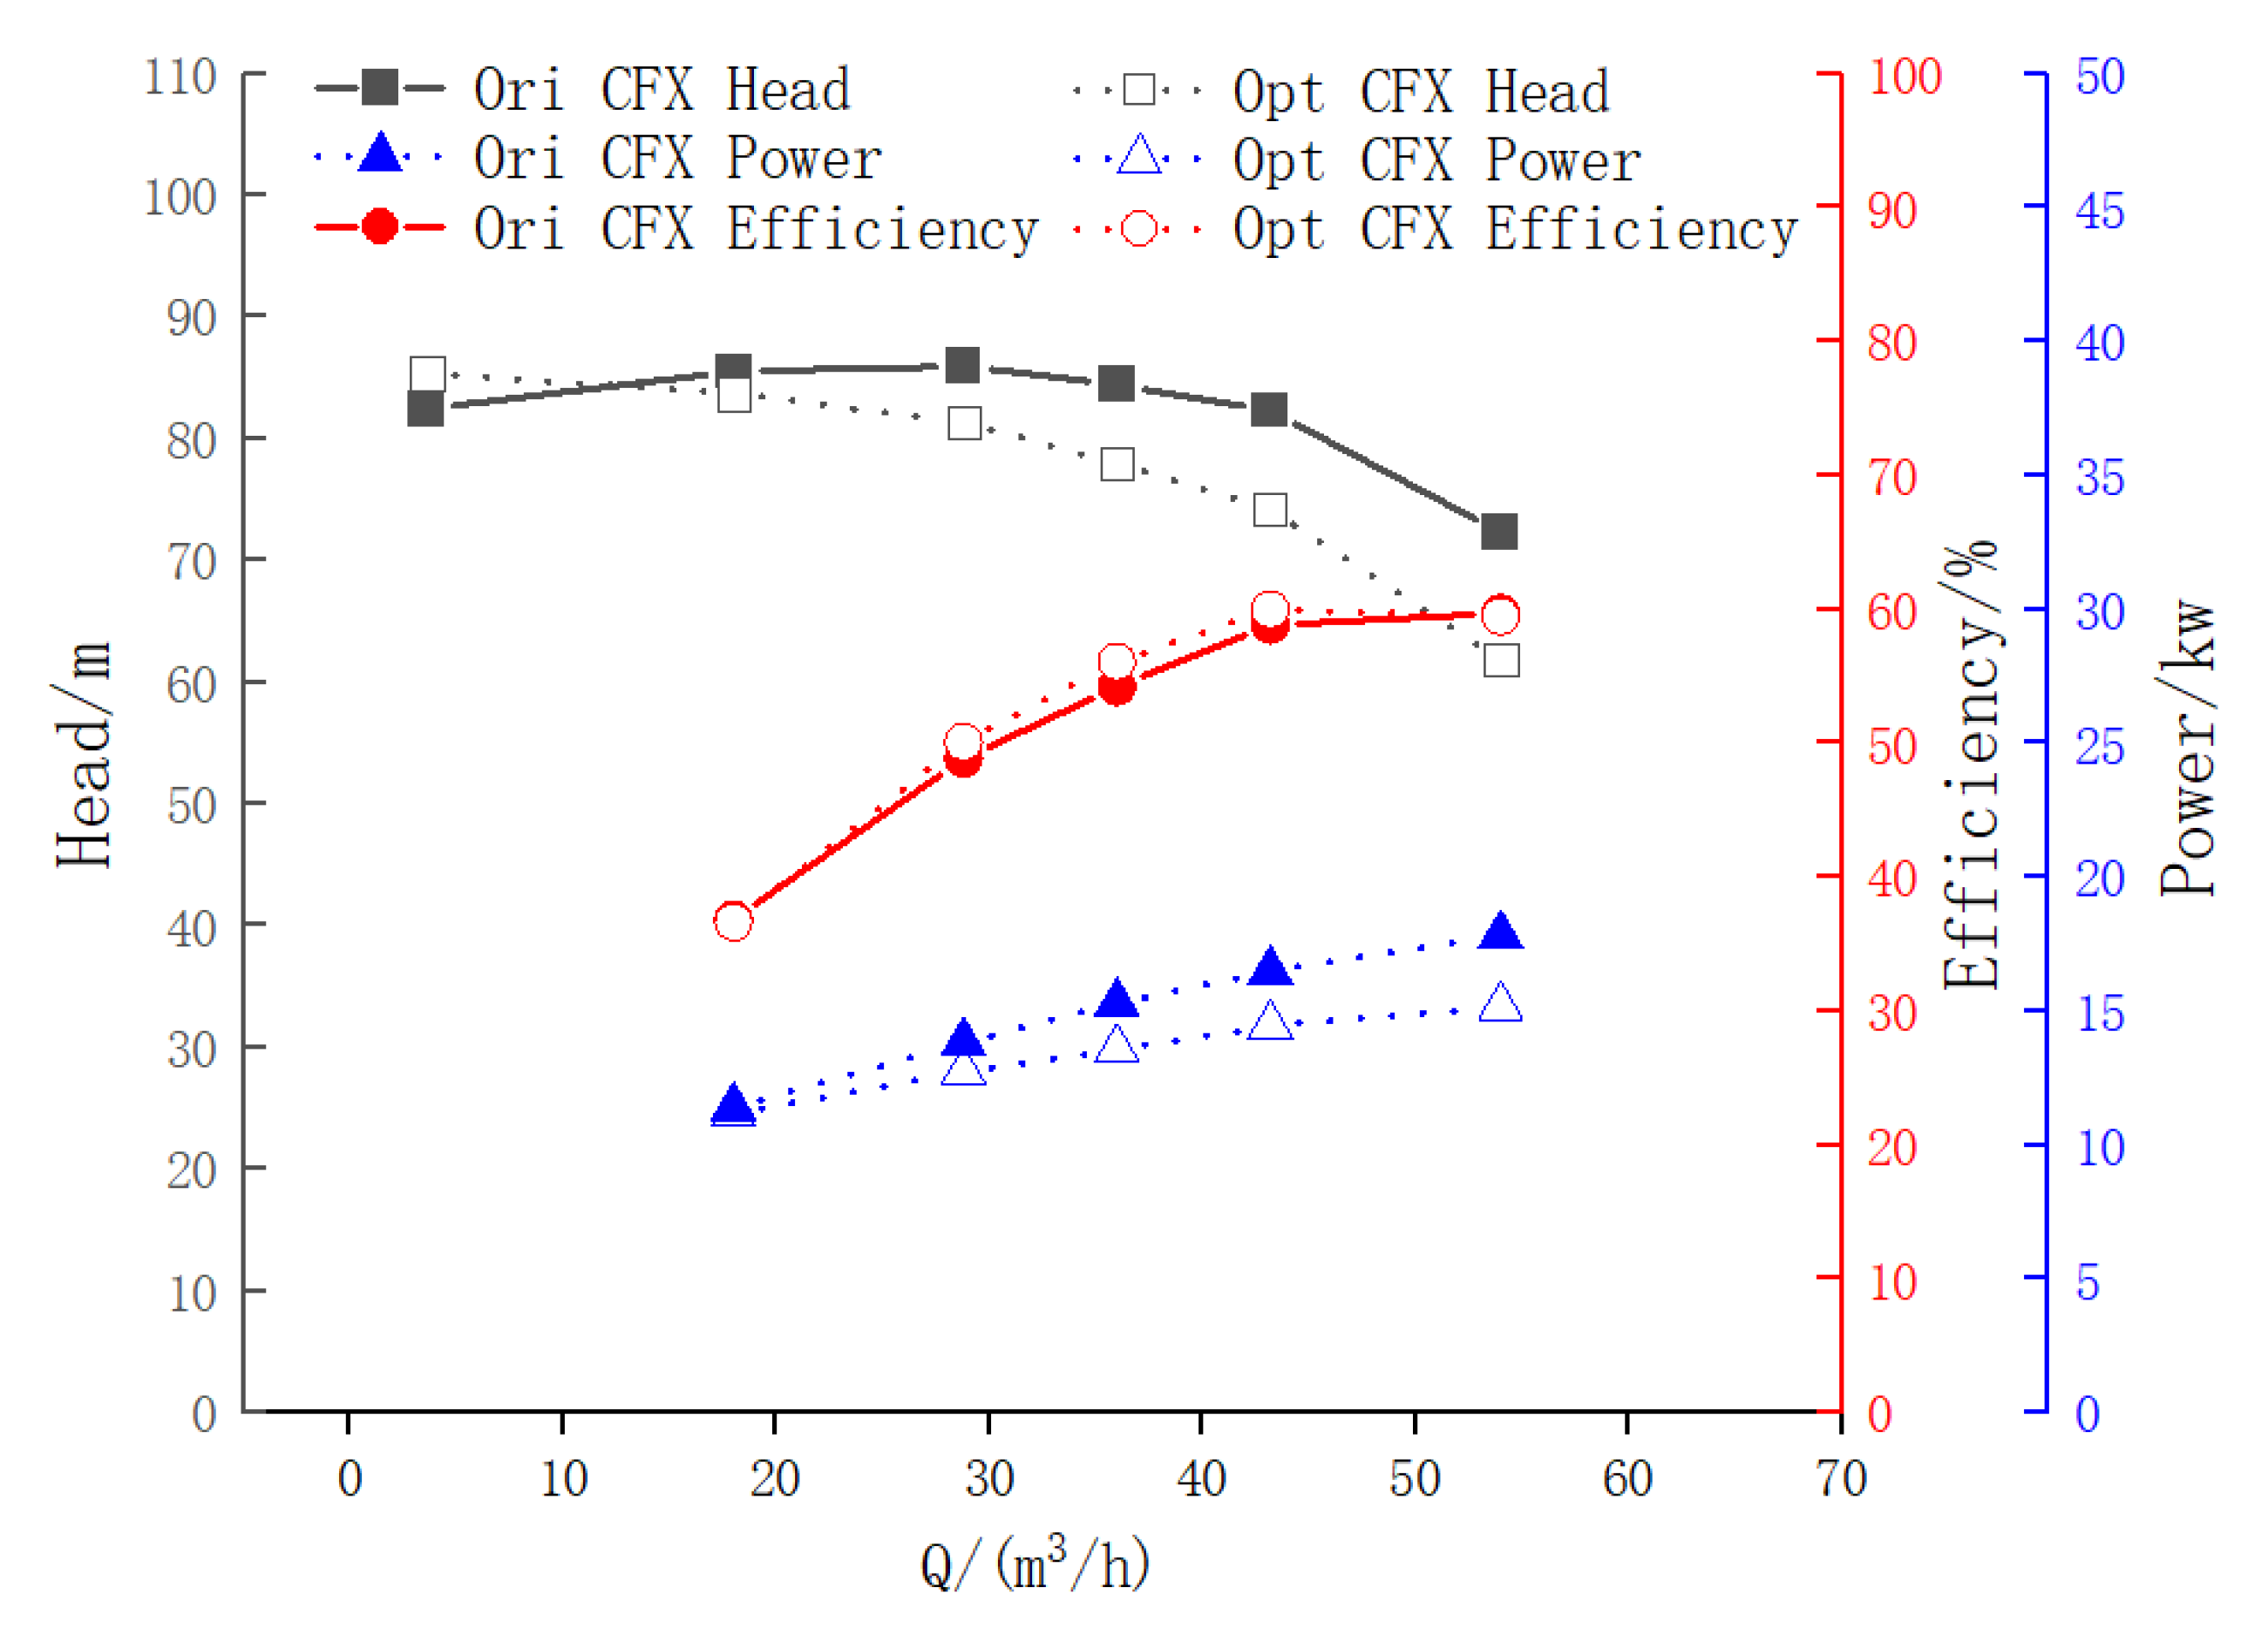
For the A1B3C3D1 configuration, a simulation analysis was conducted, and the performance curves before and after optimization were compared. As shown in Figure 8, which presents the results of the full flow field simulation, at the 1.5 Qn condition, the pump power of the optimal design scheme was reduced by 2.67 kW compared to the original model, dropping below 15.75 kW. This achievement fulfills the power optimization goal and enhances operational efficiency. The overall efficiency curve of the optimized single-stage centrifugal pump model is positioned above that of the original model, and it also extends the high-efficiency region, significantly improving the pump’s performance to meet the objectives of the optimization design.
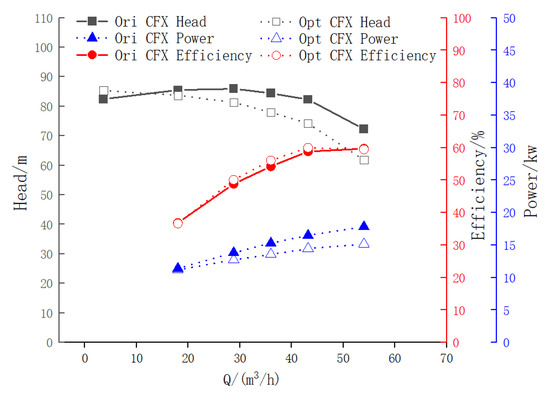
Figure 8.
Full flow field simulation data of the original pump and the optimized pump.
4.2. Internal Flow Analysis
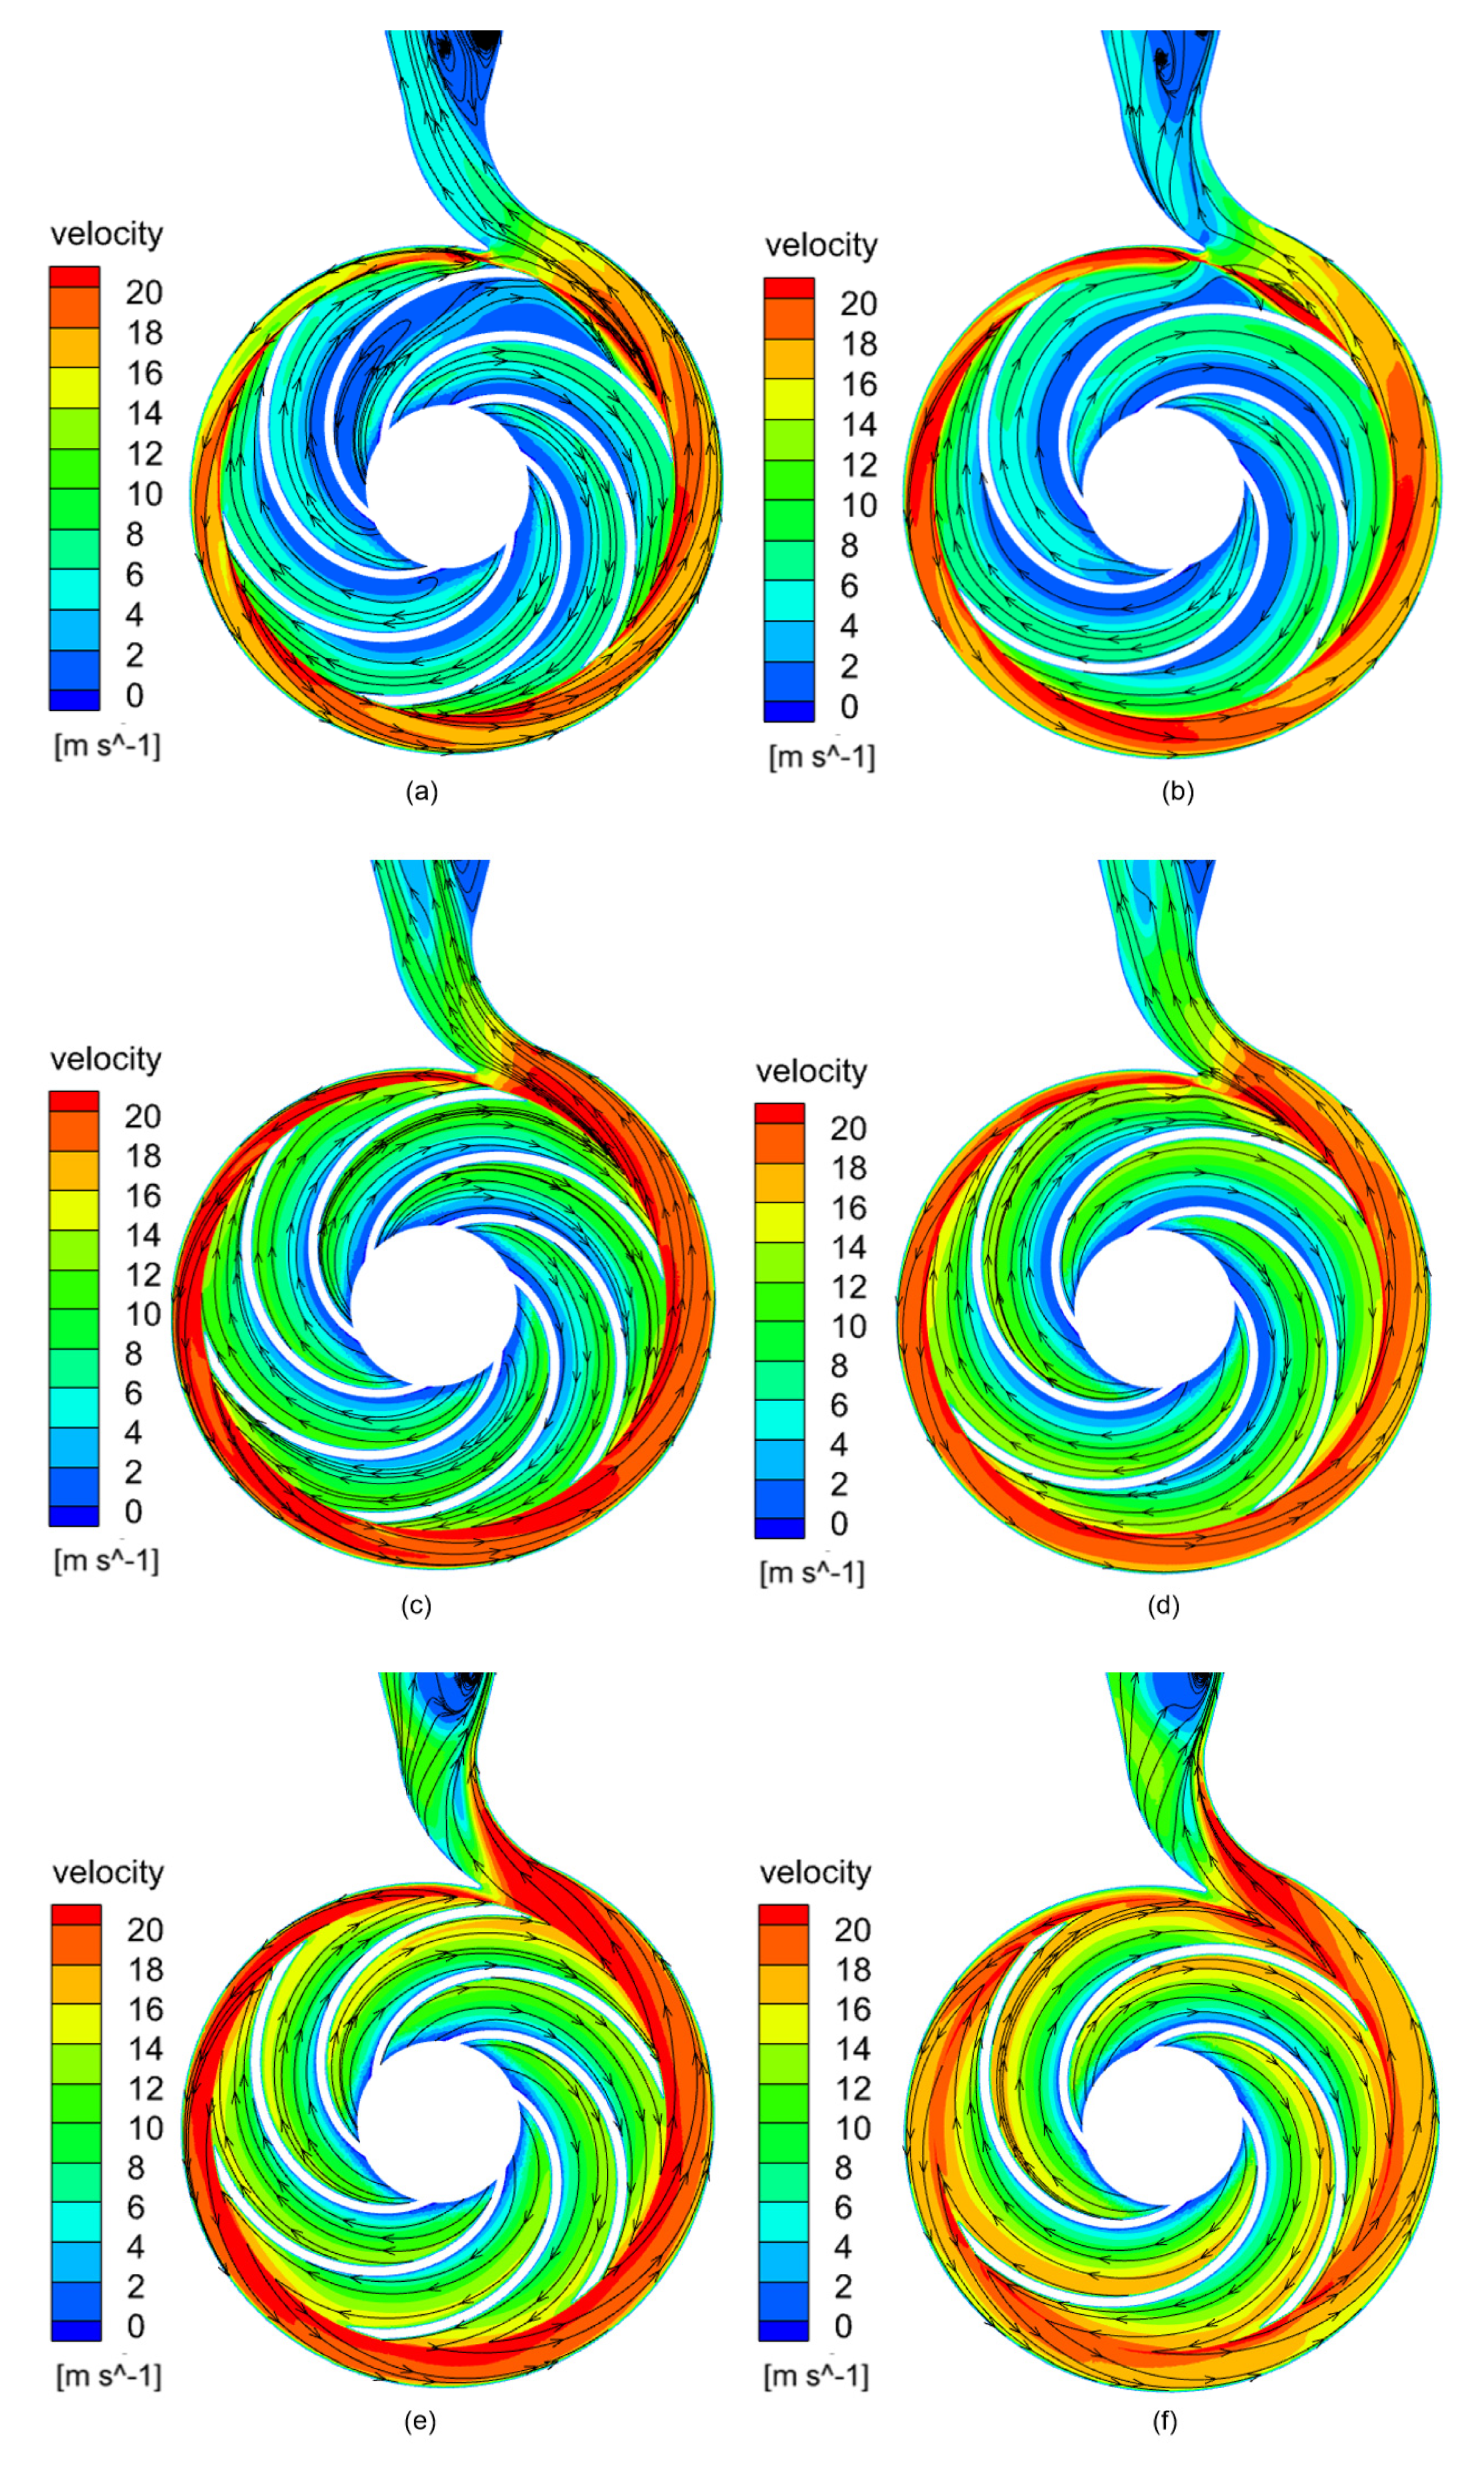
Figure 9 shows the mid-span flow line and flow velocity distribution of the original pump and the optimized pump under three different flows of 0.5 Qn, 1.0 Qn, and 1.5 Qn. At 0.5 Qn (Figure 9a,b), the velocity vector of the original pump has an obvious velocity gradient at the impeller outlet, resulting in increased hydraulic loss, while the velocity vector distribution of the optimized pump is smoother, which proves that the optimized design reduces flow separation and eddy current phenomenon, and successfully reduces hydraulic loss. At 1.0 Qn (Figure 9c,d), the velocity distribution of the original pump under the designed flow rate is not uniform, and there is a vortex that reduces the stability of the internal flow. Compared with the original pump, the optimized pump has a more uniform flow rate distribution and smoother flow line, which proves that the efficiency and stability of the optimized pump are improved. At 1.5 Qn (Figure 9e,f), at 1.5 times the design flow, the original pump speed distribution becomes more chaotic, and the vortex and recirculation zones increase, which leads to a decrease in pump efficiency. The optimized pump also guarantees a smooth velocity vector distribution at high flow rates, and both the vortex and recirculation zones are reduced compared to the original pump, indicating that the optimized design can better adapt to flow changes and ensure efficient pump operation.
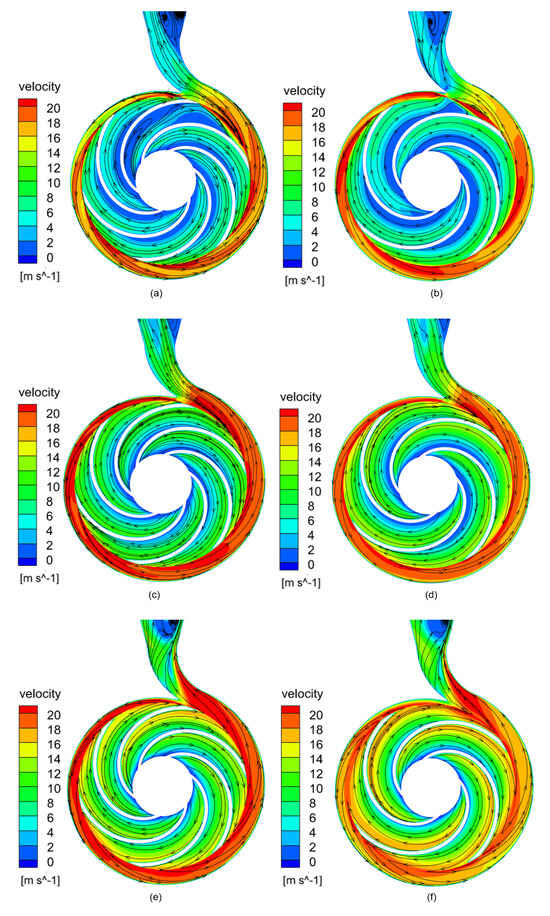
Figure 9.
Velocity and streamline distributions in impeller of original and optimal pumps. (a) 0.5 Qn (original); (b) 0.5 Qn (optimal); (c) 1.0 Qn (original); (d) 1.0 Qn (optimal); (e) 1.5 Qn (original); (f) 1.5 Qn (optimal).
Optimized pumps show better flow characteristics in all operating conditions. The lower the proportion of low-speed zone, the lower the hydraulic loss, which is conducive to reducing hydraulic loss and improving the efficiency of the pump. In this respect, the optimized pump performs better than the original pump. Under the test flow condition, the flow line distribution of the optimized pump is smoother, the eddy current in the impeller is significantly reduced, and the flow state is significantly improved compared with the original pump.
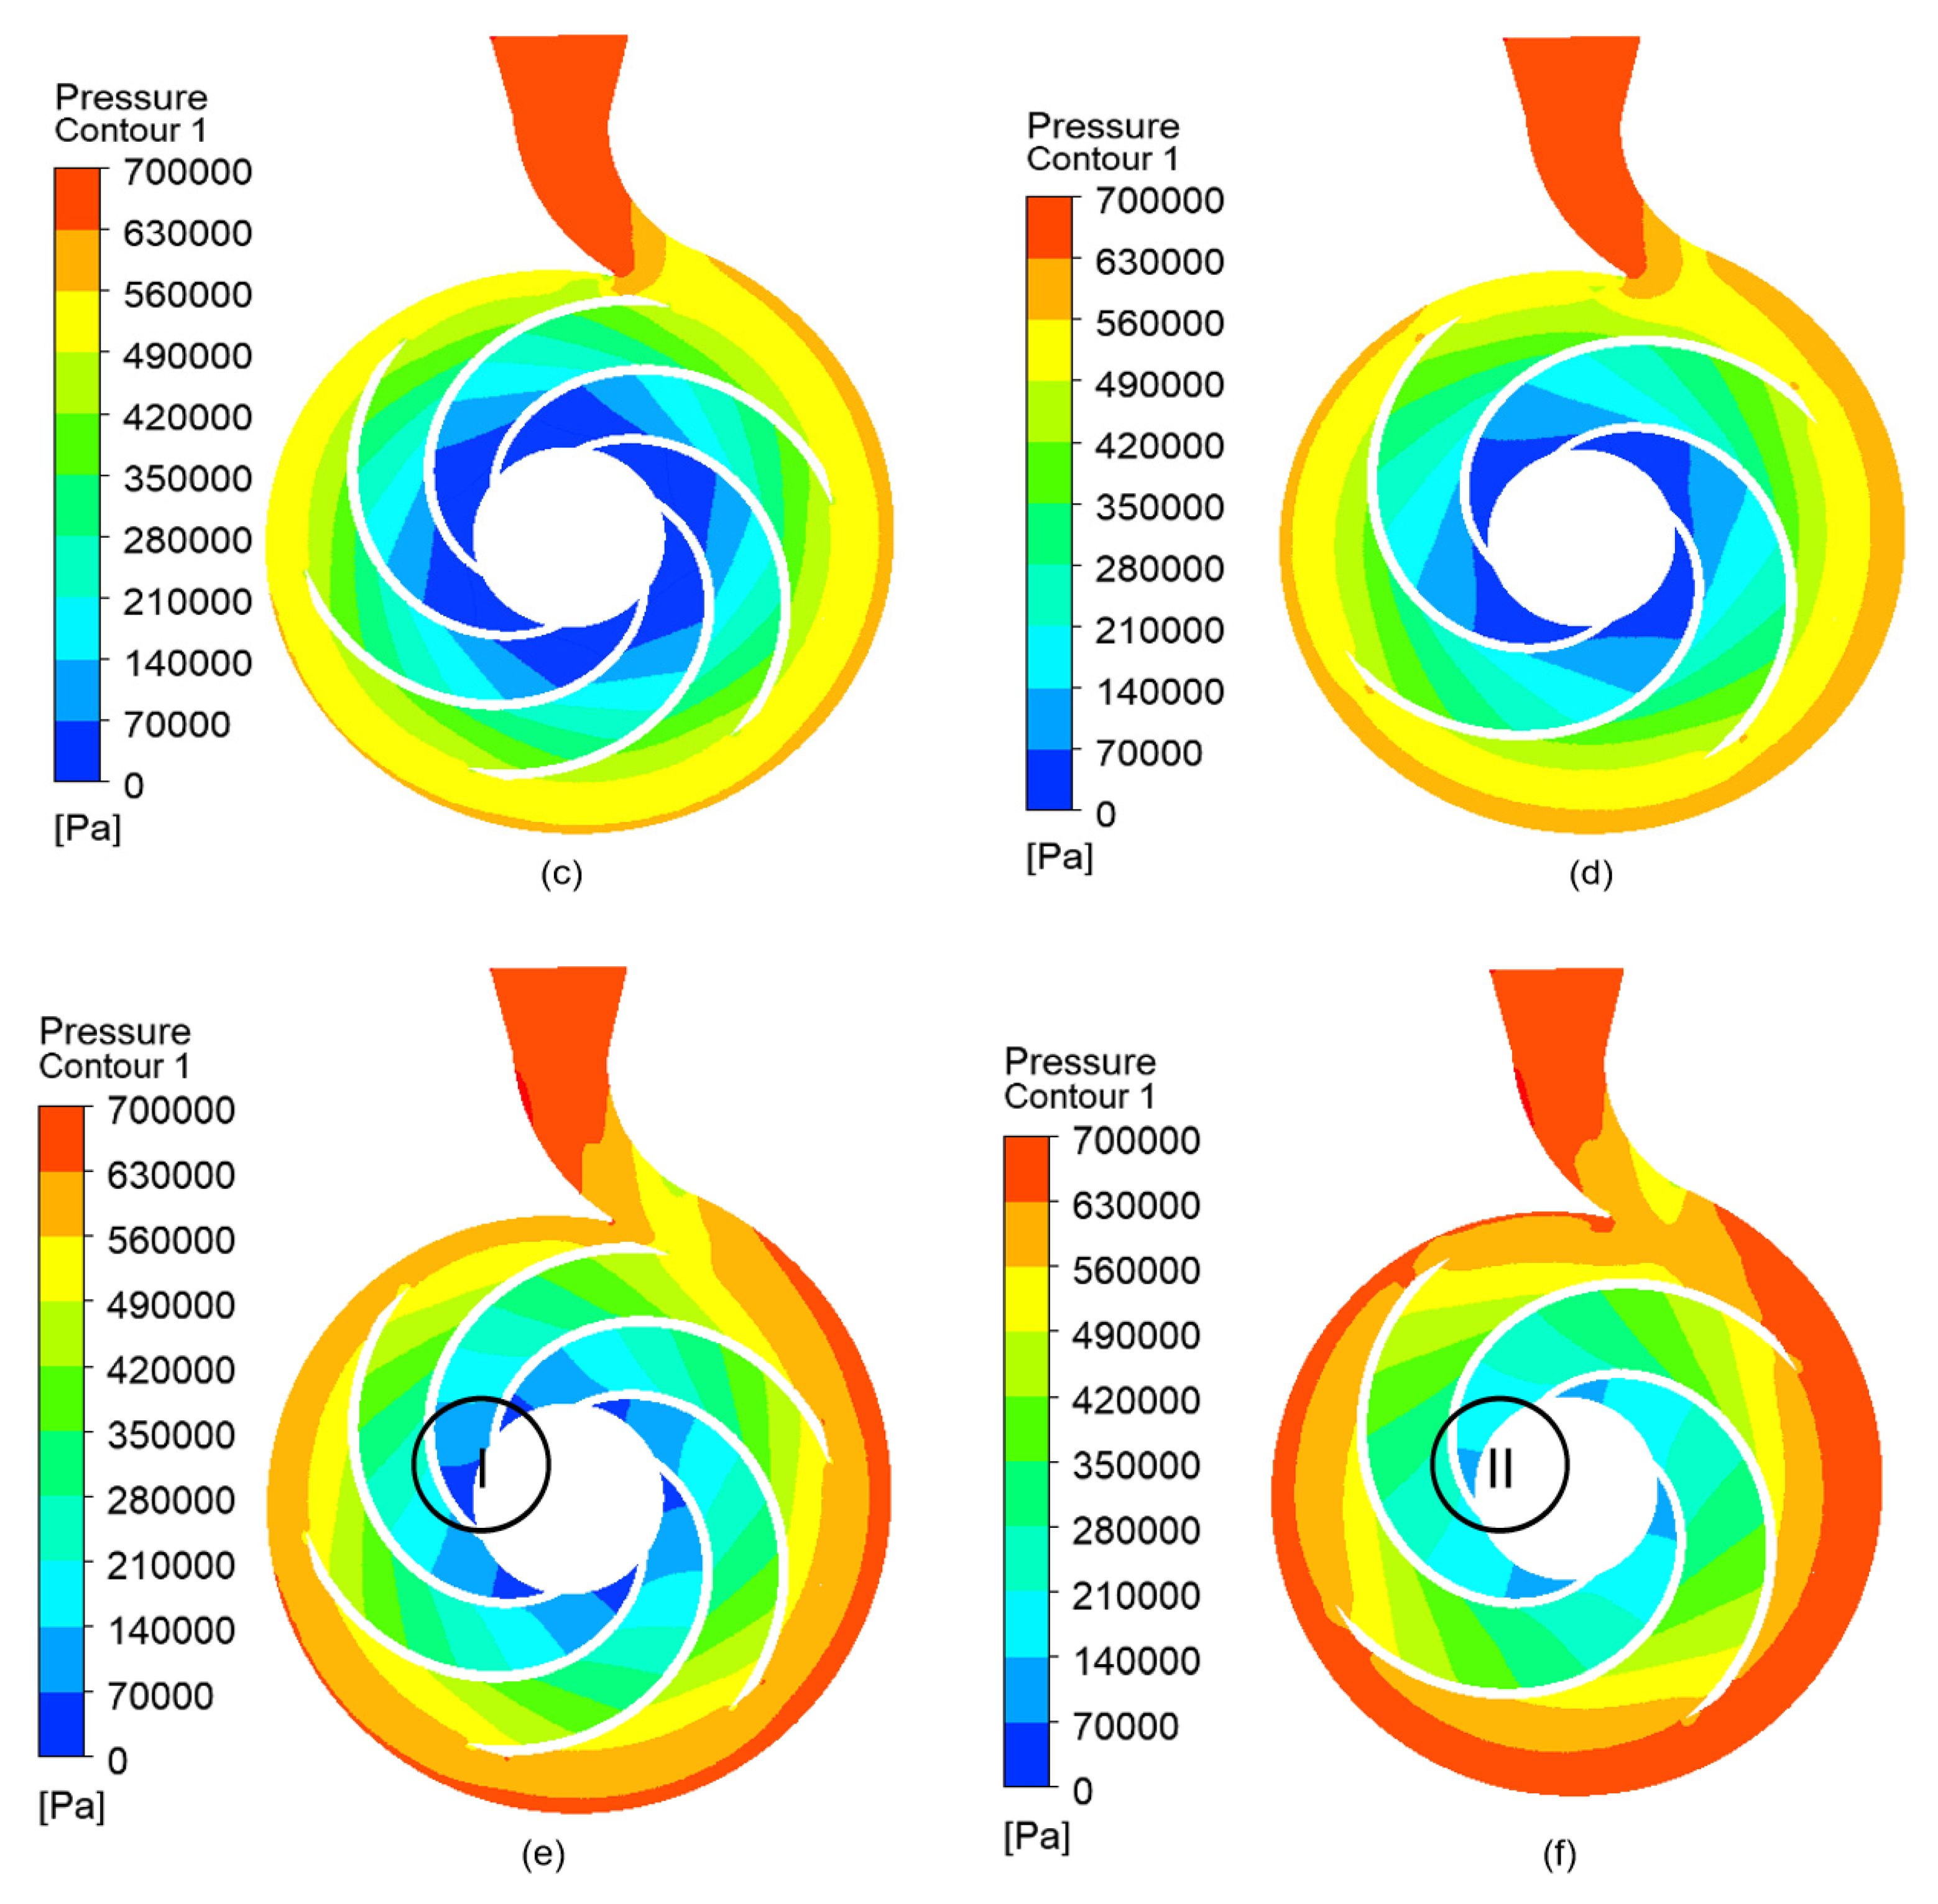
Figure 10 shows the pressure distribution of the original pump and the optimal pump under three different flow rates (0.5 Qn, 1.0 Qn, 1.5 Qn). Under the low-flow condition of 0.5 Qn, the leading-edge pressure of the suction side of the original model pump is 70 kPa due to the cavitation phenomenon, and, with the advance of the flow, the pressure begins to rise, and the trailing edge of the impeller is 560 to 700 kPa. Compared with the original model, the pressure distribution of the optimized pump is more uniform, and the minimum pressure area is significantly reduced, which effectively reduces the risk of cavitation and improves the efficiency of the pump. Under the normal flow rate of 1.0 Qn, the original pump impeller is unstable, and the pressure gradient fluctuation is more intense, ranging from 490 to 700 kPa, while the pressure gradient distribution of the optimized pump is more uniform, which can effectively reduce the occurrence of the eddy current phenomenon. Under the over-design flow rate of 1.5 Qn, the inlet pressure of the original pump impeller drops to about 420 kPa, and the eddy current and reflux area increase. The pressure distribution and gradient of the optimized pump remain uniform, and the eddy current and reflux conditions are significantly reduced compared with the original pump. Overall, the optimized pump exhibits a more stable pressure distribution and fewer vortices in all operating conditions, especially at high-flow conditions, because the smaller the minimum pressure area, the lower the probability of cavitation when the pump is operating.
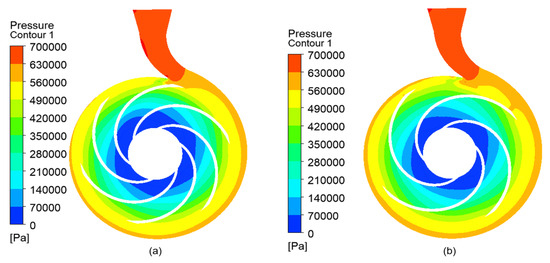

Figure 10.
Pressure distributions in impeller of original and optimal pumps. (a) 0.5 Qn (original); (b) 0.5 Qn (optimal); (c) 1.0 Qn (original); (d) 1.0 Qn (optimal); (e) 1.5 Qn (original); (f) 1.5 Qn (optimal).
Figure 11 shows the entropy generation distributions of the original pump and the optimized pump under three different flow rates (0.5 Qn, 1.0 Qn, and 1.5 Qn).
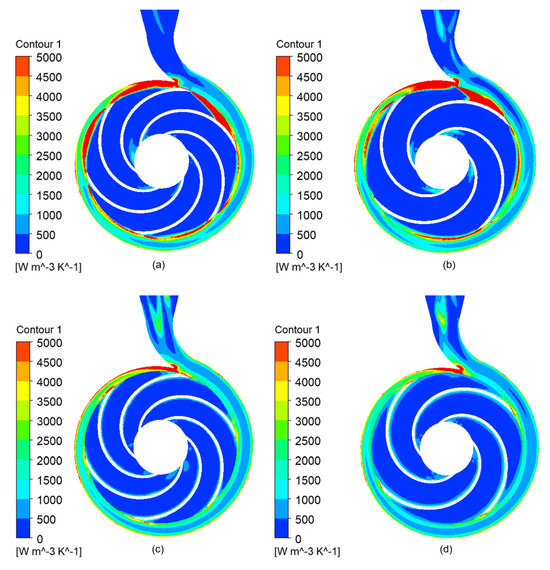
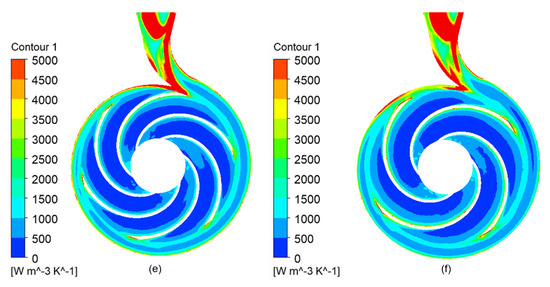
Figure 11.
Entropy generation distributions in impeller of original and optimal pumps. (a) 0.5 Qn (original); (b) 0.5 Qn (optimal); (c) 1.0 Qn (original); (d) 1.0 Qn (optimal); (e) 1.5 Qn (original); (f) 1.5 Qn (optimal).
In the impeller part, entropy production is mainly generated from the suction surface of the blade, the impeller flow path near the tongue, and the exit of the impeller. The entropy production of the blade surface is due to the friction between the blade and the fluid caused by the impeller of the high-speed centrifugal pump in the process of rotation. On the other hand, the relative sliding of the fluid and the blade can easily cause unstable flow near the blade surface and cause energy loss. The reason for the flow channel entropy production near the tongue is that, when the fluid enters the volute, due to the narrow position of the throat of the tongue, part of the fluid cannot smoothly develop into the volute, and the reflux formed at the tongue and the unsteady flow of the fluid developed from the inlet of the impeller to the outlet cause energy loss and entropy production. The entropy production at the exit of the impeller is caused by the wake flow formed by the uneven velocity at the exit. It can be seen from Figure 11a,b that the entropy production caused by dynamic and static interference under low-flow conditions is larger than that under both the design flow condition and high-flow condition, while the entropy production on blade surface changes little, indicating that high-flow conditions can improve the flow of the flow channel at the tongue and make it more uniform.
As can be seen from Figure 11c,d, under standard working conditions, the high-entropy-production region of the original pump impeller and volute is obvious, and the value is between 2000 and 3000 [W·m−3·K−1]. The distribution of entropy production in the impeller and volute region of the optimized pump is more uniform, and the value range is 1000 to 2000 [W·m−3·K−1]. Under standard working conditions, the average entropy production after optimization is reduced from 424.118 [W·m−3·K−1] to 384.957 [W·m−3·K−1]. It is proved that the optimized design can effectively reduce the flow loss of the whole pump.
It can be seen from Figure 11e,f that, under large flow conditions, an entropy output value of 4000–5000 [W·m−3·K−1] appears in the outlet region of both the impeller and volute, indicating that the flow loss of the pump increases under a large flow rate. Compared with the optimized pump, the regional distribution of the high entropy production of the original pump is unbalanced. The distribution of entropy production in the impeller and volute region of the optimized pump is concentrated, and the backflow phenomenon is successfully reduced.
4.3. Modal Analysis
The impeller is made of ZG07Cr19Ni10, and the volute is made of QT400-18. The physical properties of the corresponding materials are listed in Table 7.
Table 7.
Impeller and volute materials.
The natural frequencies of the original model were numerically solved using the Simulation Premium plugin in SolidWorks. Changes in natural frequencies can reflect variations in structural stiffness. As shown in Table 8, the natural frequencies of the optimized pump are slightly lower than those of the original model for most modes, indicating that the optimized design results in a more flexible impeller structure, which helps reduce the risk of resonance.
Table 8.
Original model and natural and simulated frequencies for optimized pumps: order, original model intrinsic, original model simulation, optimized pump intrinsic, optimized post-simulation.
The model calculation results at the operating point of 1.5 Qn were imported into the Static Structural module of ANSYS Workbench. The impeller loads were applied to the model to calculate the equivalent stress, shear stress, and stress intensity of the impeller’s static structure. The results of the static structural analysis were then imported into the Modal Analysis module to determine the simulated vibration frequencies and the total deformation of the impeller.
The simulated frequencies, obtained under actual working conditions, account for the influence of external loads. The simulated frequencies of the optimized pump are close to those of the original model for most modes, suggesting that the optimized design maintains the dynamic response characteristics of the impeller while potentially improving structural stability.
After optimization, the resonance frequency decreased from 1006.4 Hz to 976.9 Hz, indicating that the optimized design effectively reduces the dynamic response of the impeller in this mode. Overall, the natural frequencies of the optimized pump are lower than those of the original model for most modes, which helps mitigate the likelihood of resonance. The stability of the simulated frequencies demonstrates that the optimized design enhances structural stability while preserving the impeller’s dynamic performance.
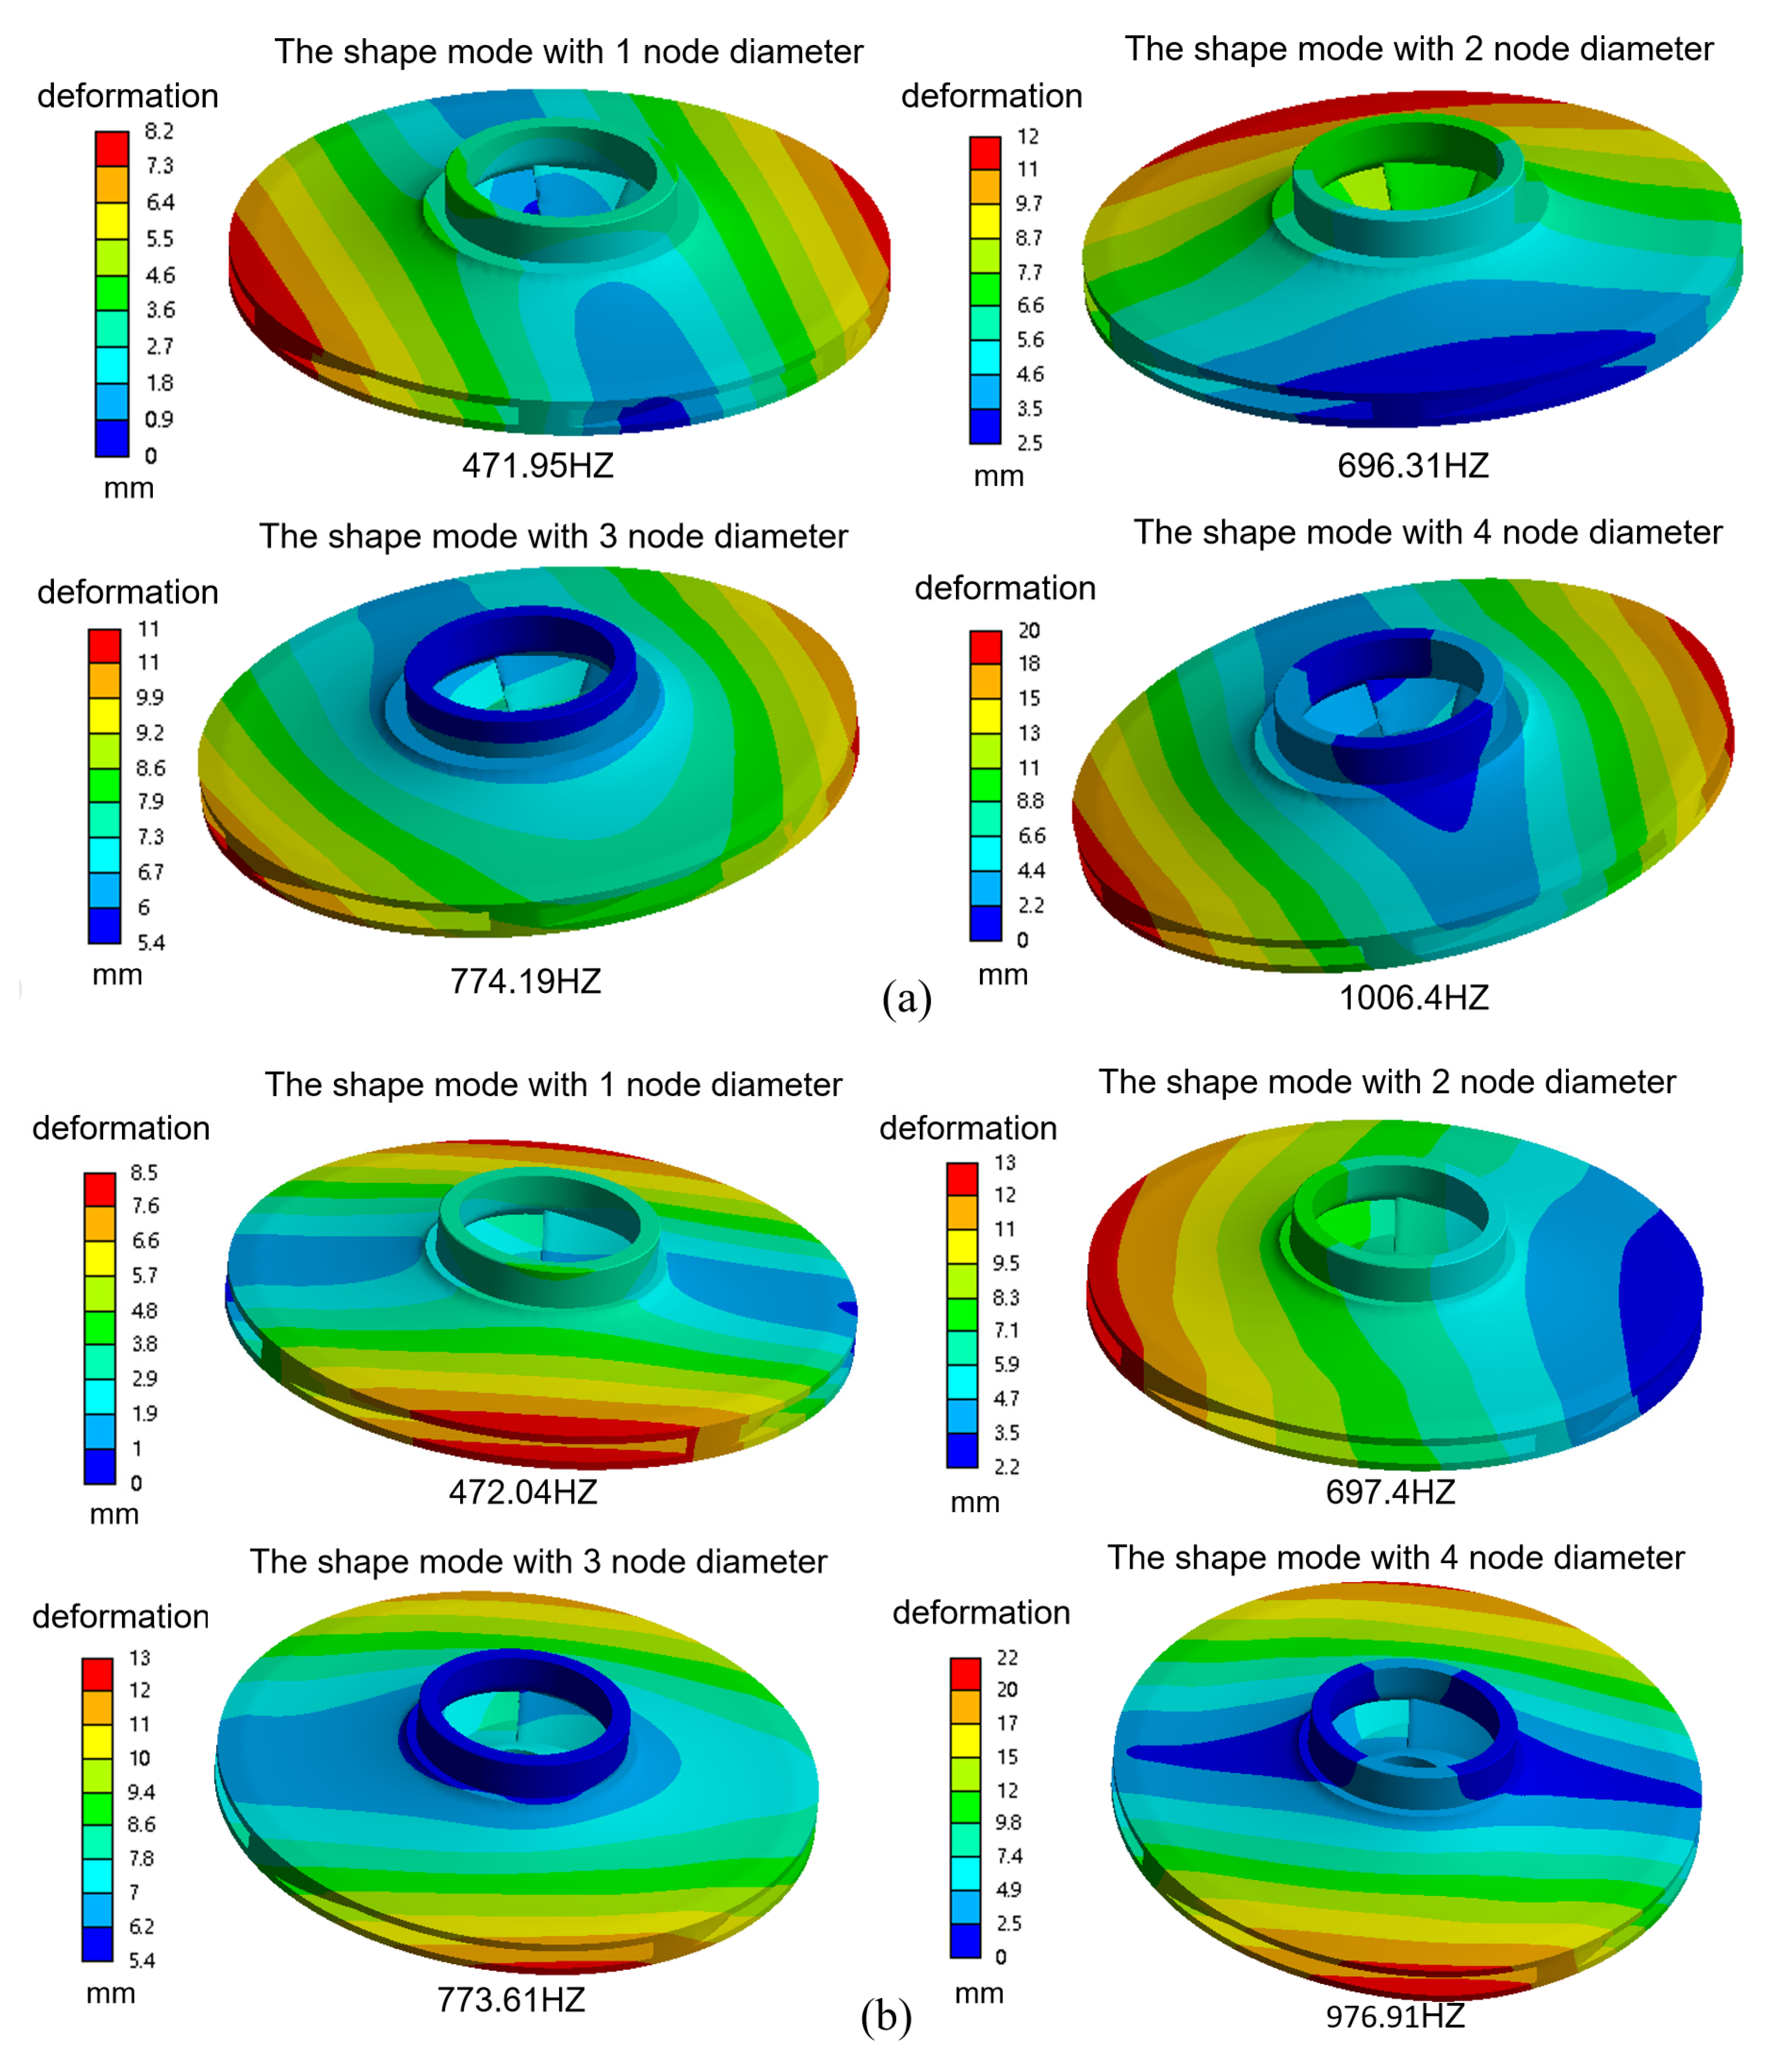
As shown in Figure 12, the optimized pump has better structural characteristics in modal analysis than the original model pump.

Figure 12.
Natural vibration modes and deformation magnitudes of the original pump and optimized pump: (a) original pump; (b) optimized pump.
Compared with the original model, the first-order frequency of the optimized pump is increased from 471.95 Hz to 472.04 Hz, the second-order frequency is increased from 696.31 Hz to 697.4 Hz, and the third-order frequency is reduced from 774.19 Hz to 773.61 Hz. The fourth-order frequency is reduced from 1006.4 Hz to 976.91 Hz compared to the original model.
In terms of deformation, the first-stage average deformation of the optimized pump is reduced from 3.5935 mm to 3.319 mm, which is 0.2745 mm less than that of the original model pump. In the fourth mode, the average deformation is 8.1966 mm, which is 1.0954 mm less than the original model pump.
Under the 1.5 Qn condition, the fluid tends to be stable, the simulation and experiment errors are minimal, and the deformation distribution of the optimized pump under various modes is more uniform under large flow conditions, mainly concentrated in the outer edge of the impeller and the blade area. In the first mode, the deformation of the optimized pump is mainly concentrated on the outer edge of the impeller. Under the second-order mode, the local deformation of the outer edge of the impeller is relieved. In the third-order mode, the deformation is concentrated in the outer edge of the impeller and the blade area, and the local stress is reduced. In the fourth-order mode, the deformation is concentrated in the blade region, which effectively controls the local deformation.
The reduction of deformation and resonance frequency proves that optimized design can effectively improve the vibration and stress concentration of pumps under high flow conditions.
4.4. Pressure Fluctuation Analysis
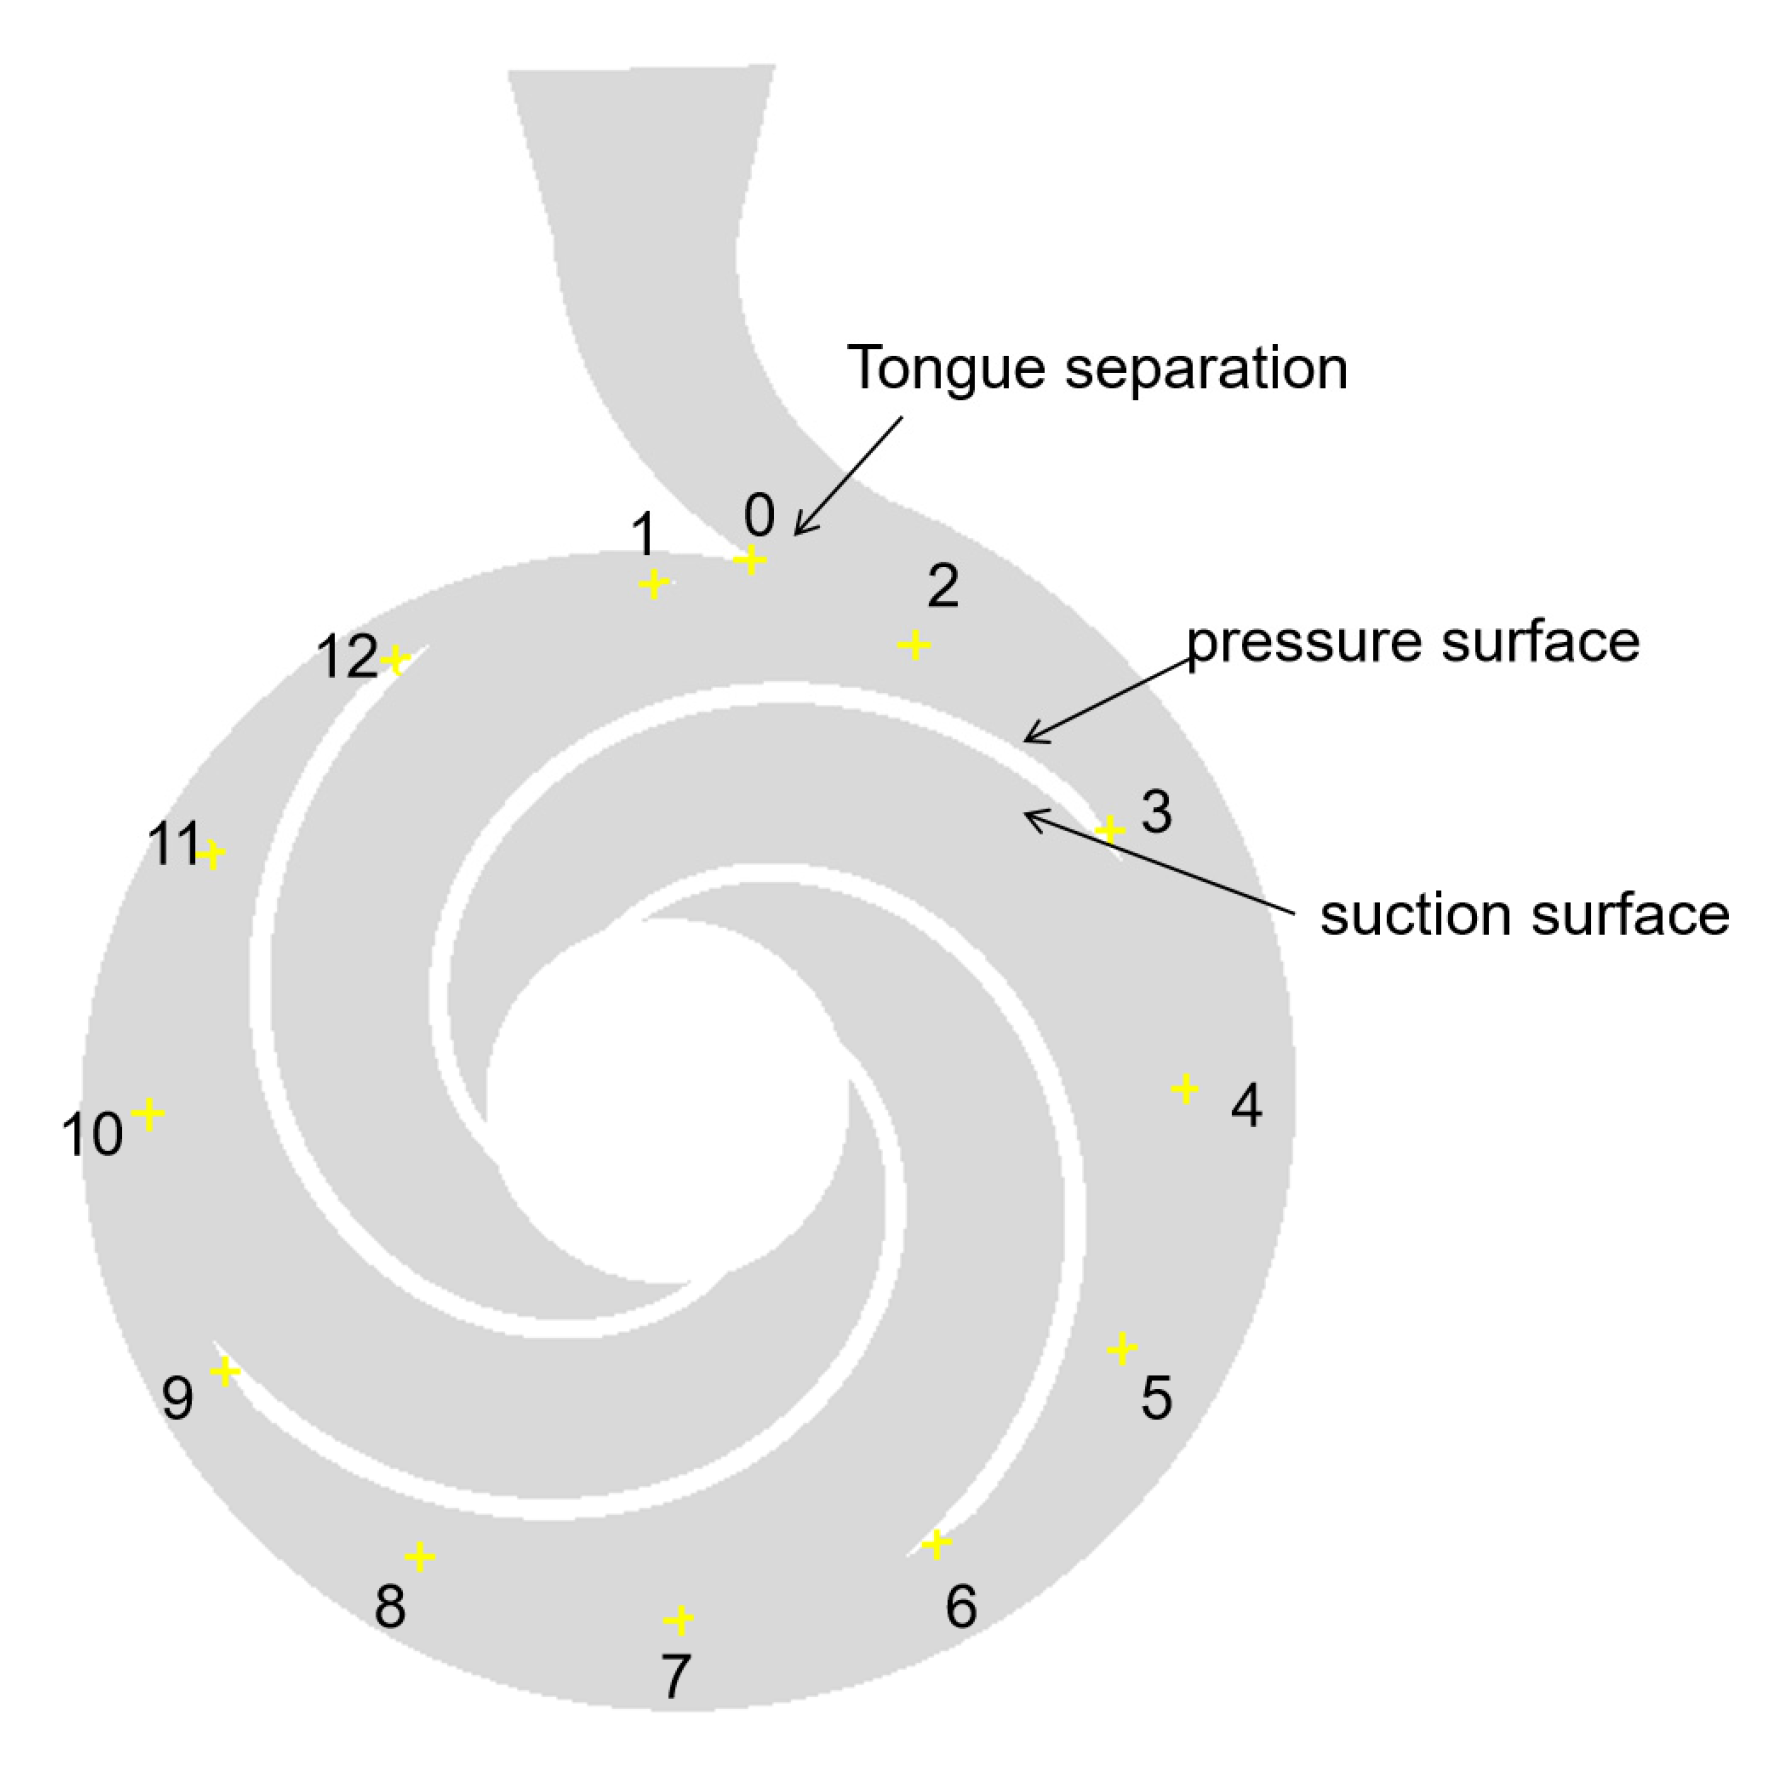
Pressure pulsation in a centrifugal pump refers to the periodic or non-periodic fluctuations in pressure at the pump outlet caused by the non-uniformity and instability of the internal flow during operation. Pressure pulsation data can reflect the characteristics of the internal flow in the centrifugal pump, including flow stability and efficiency. By analyzing pressure pulsation, the performance of the pump can be evaluated, and the design can be optimized to improve operational efficiency. During the CFX 2022 simulation, as shown in Figure 13, 13 monitoring points were set up: 1 at the volute tongue and 12 at the interface between the volute and the impeller, arranged clockwise at 30° intervals.

Figure 13.
Pressure pulsation monitoring points of the optimized pump. (Numbers (1, 2, 3…) indicate the monitoring point indices; yellow symbols highlight their physical locations).
To conduct the analysis, the obtained pressure signals were rendered dimensionless, and the pressure fluctuation coefficient Cp is defined as follows:
μ2 is the circumferential velocity of the outer edge of the impeller, which is calculated as follows:
where ρ represents the medium density, 998.2 kg/m3, n is the impeller rotational speed, 2950 r/min, and D2 is the outer diameter of the impeller, 249 mm.
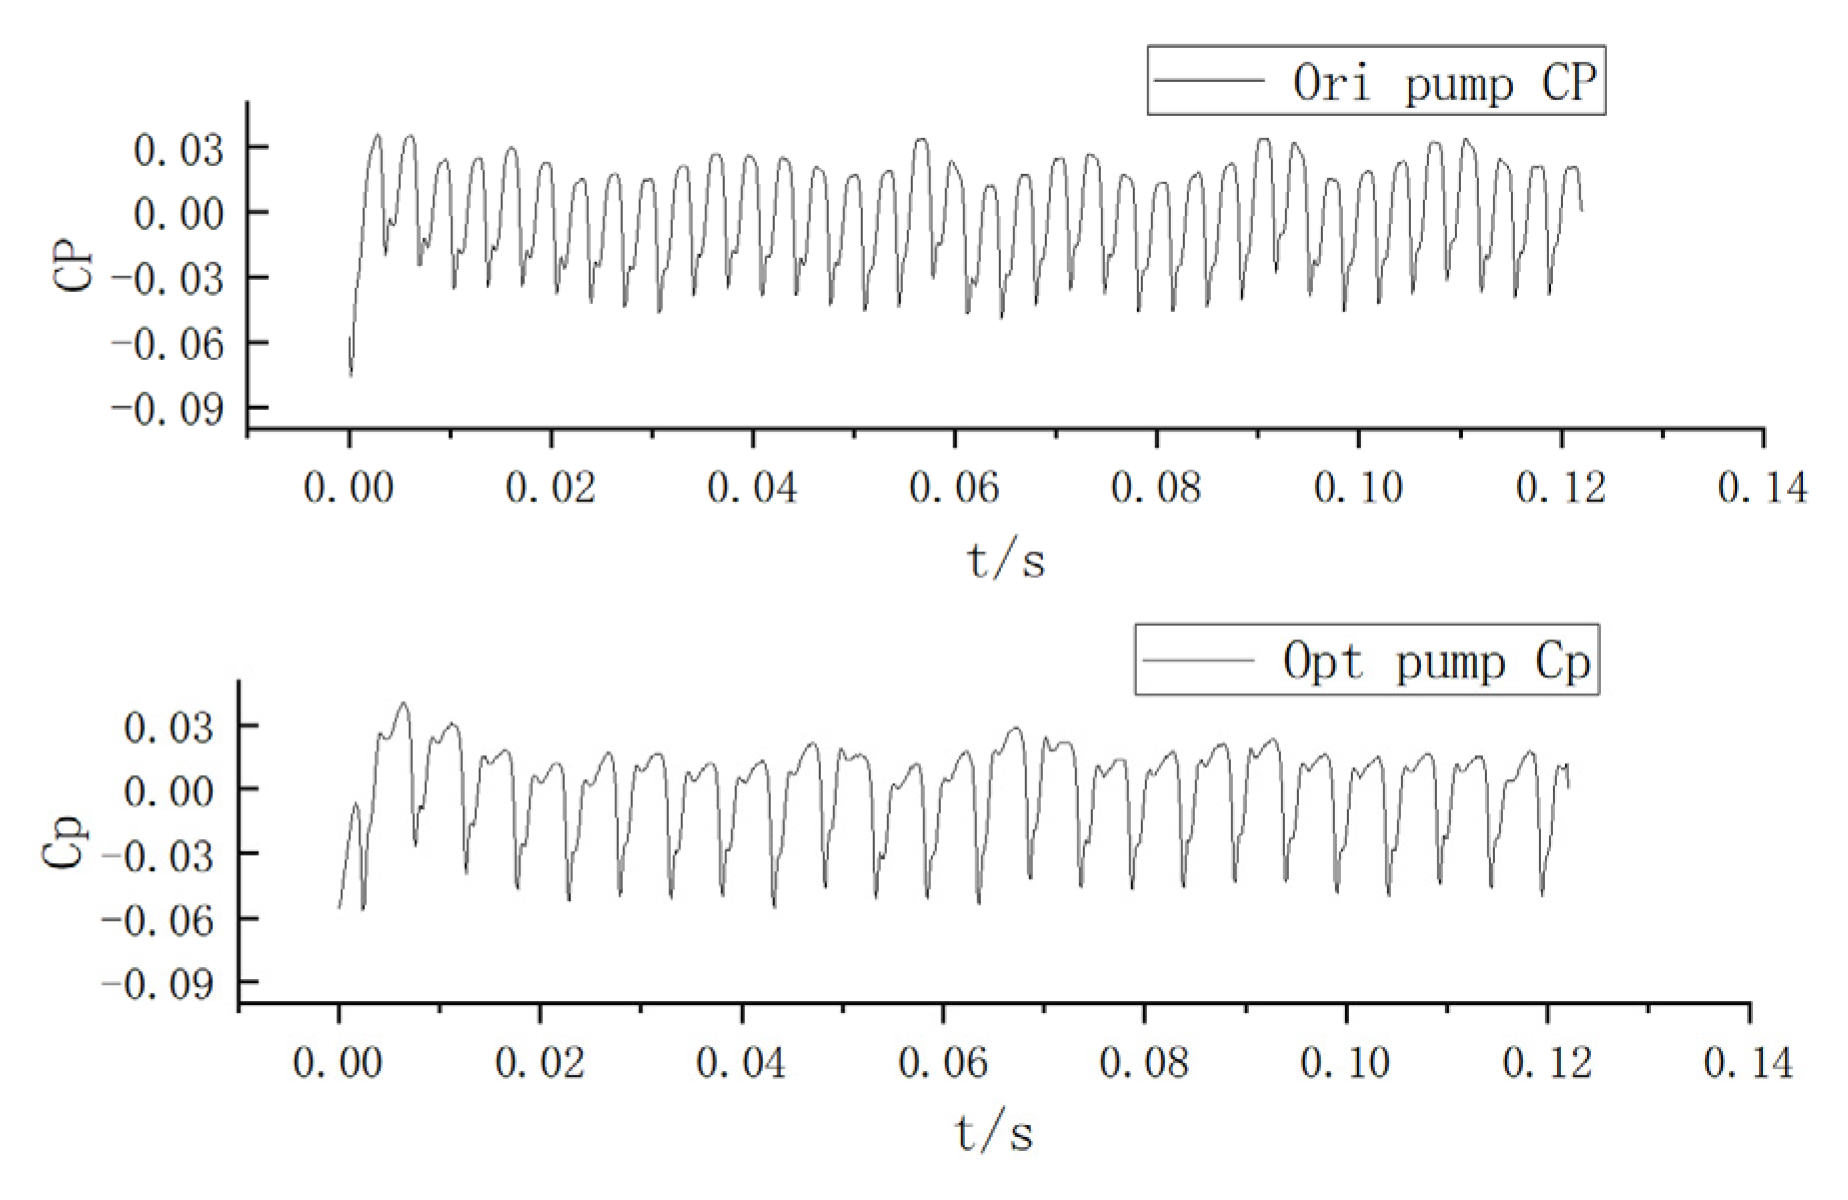
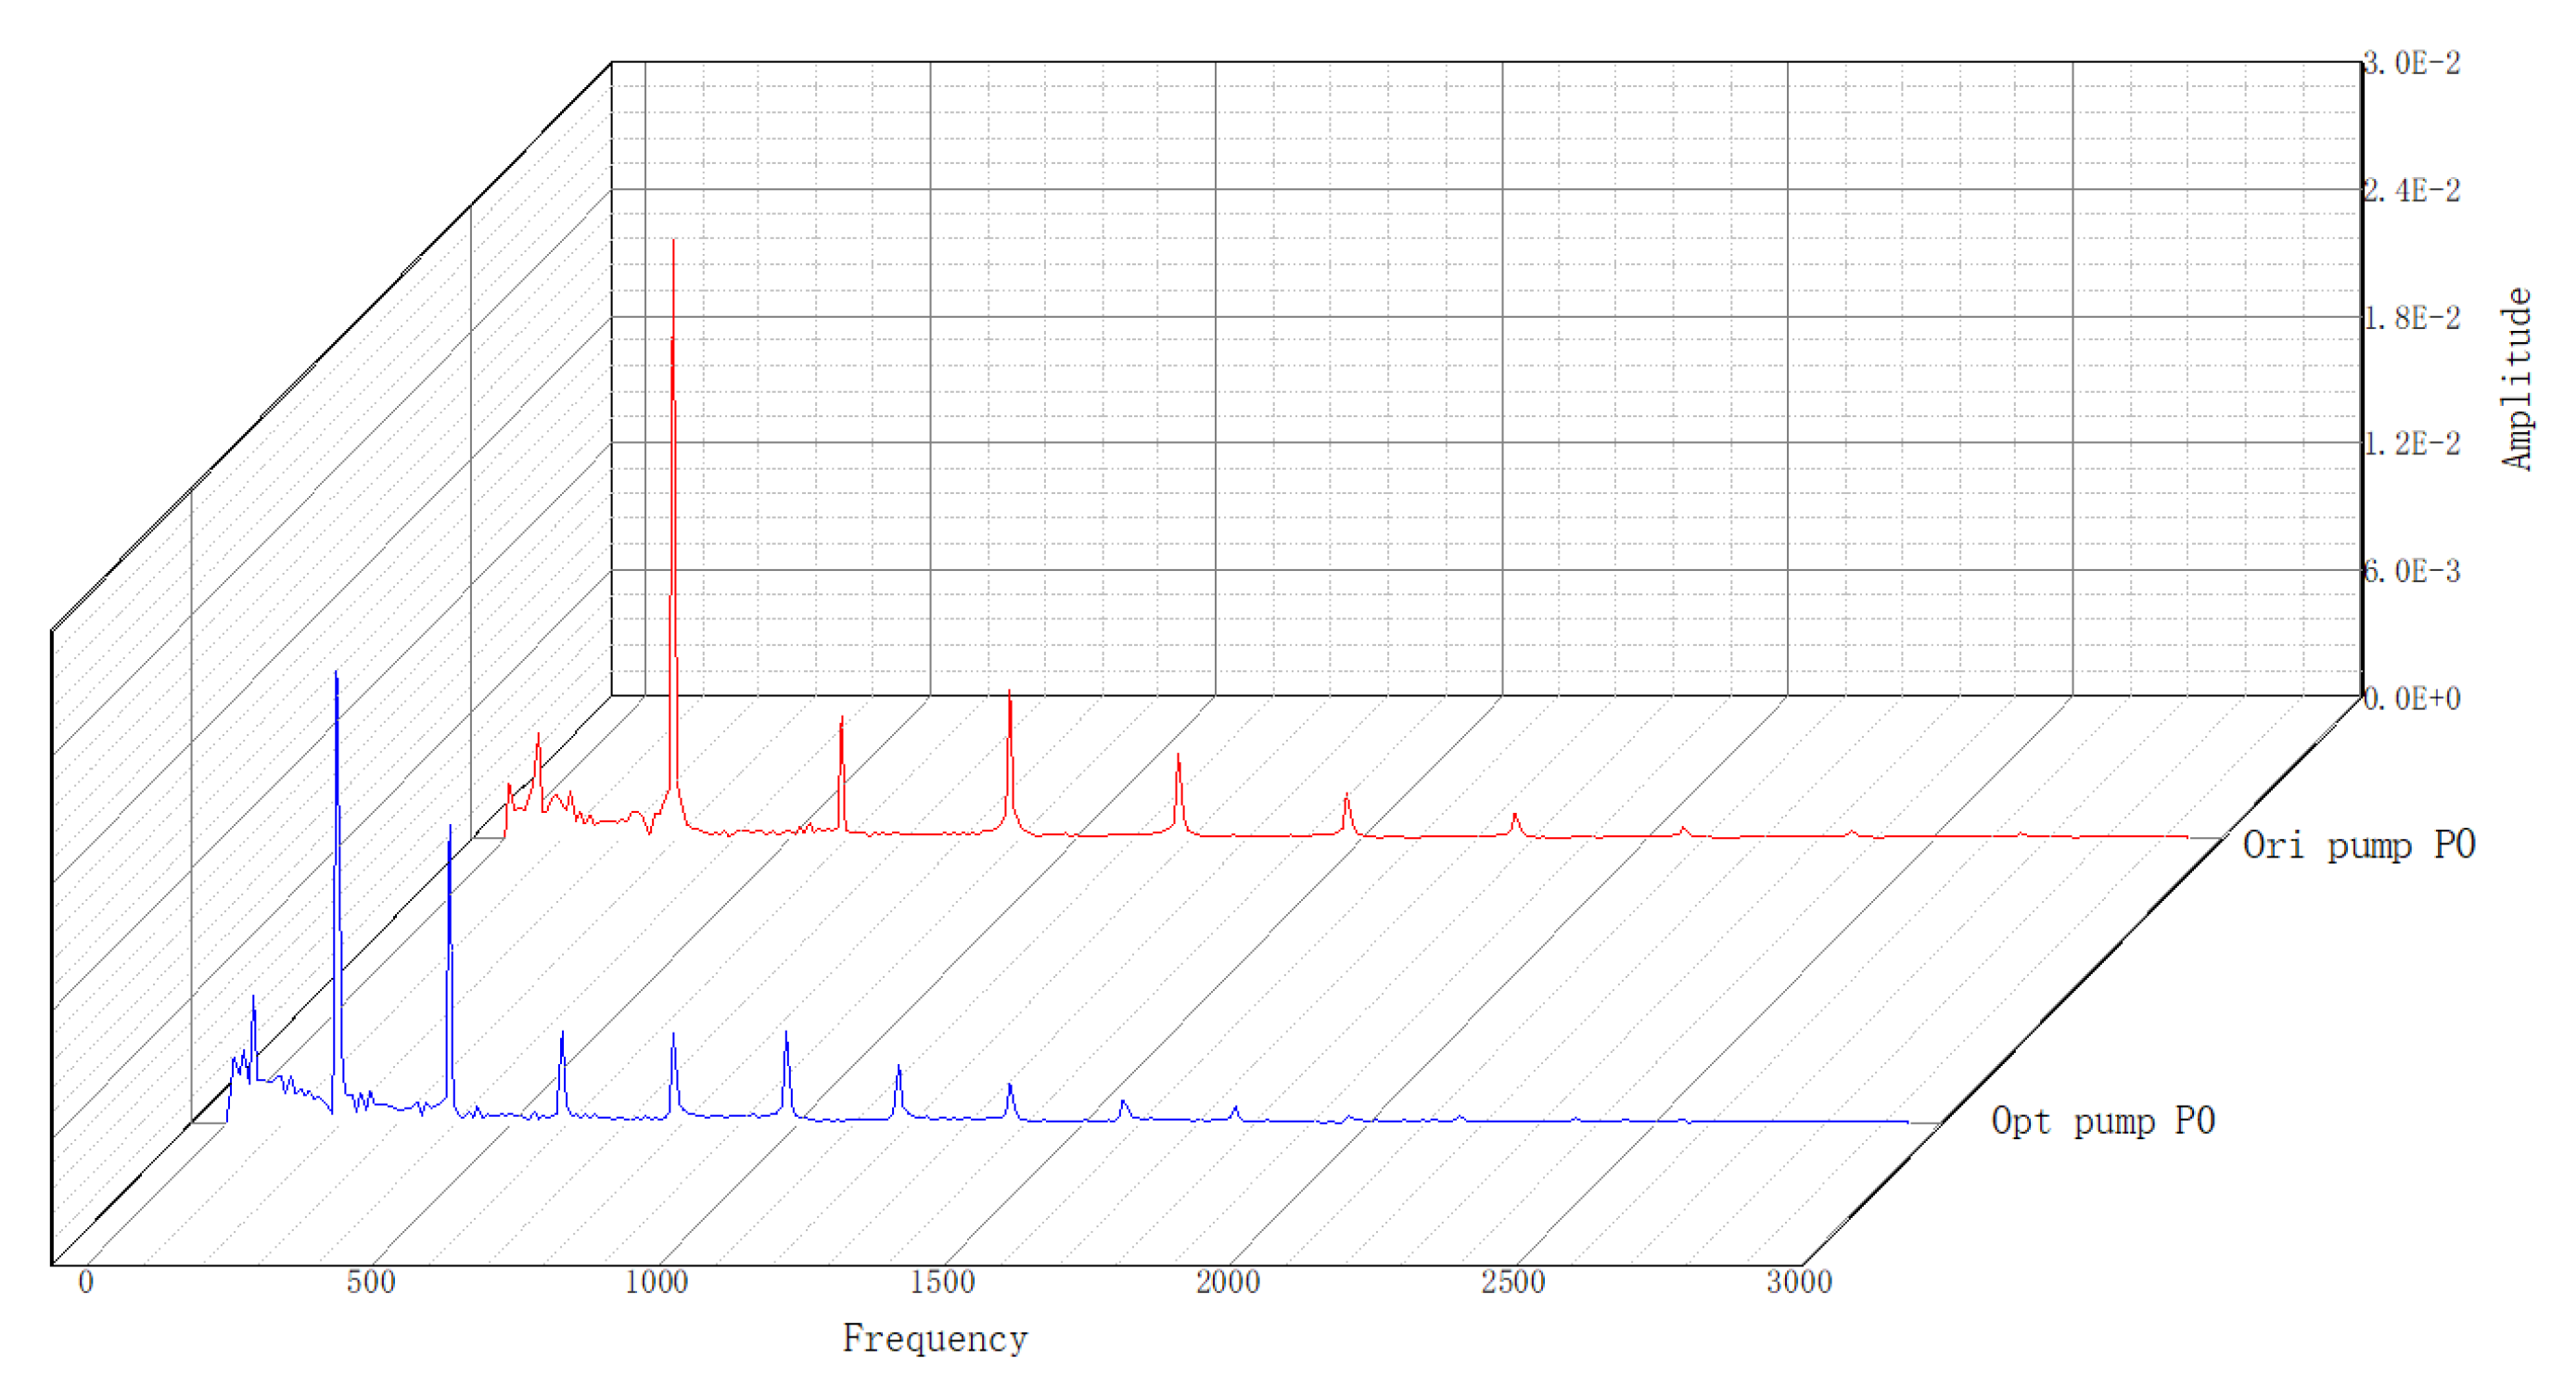
As shown in Figure 14 and Figure 15, the monitoring point at the volute tongue reveals that the optimized pump exhibits lower pressure pulsation amplitudes in the time-domain plot compared to the original pump. This indicates that the optimized design effectively reduces pressure fluctuations during operation. Additionally, the frequency-domain plot shows that the amplitudes of the primary frequency components are reduced in the optimized pump model, and the pressure pulsation attenuation characteristics in the volute tongue region are significantly improved.
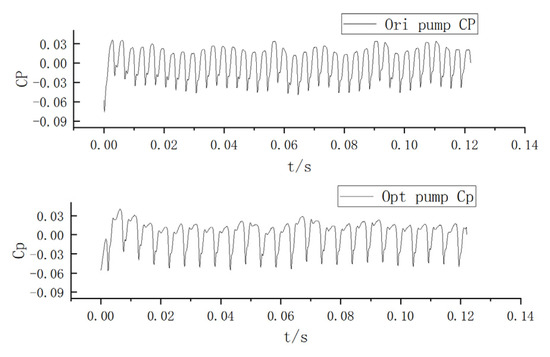
Figure 14.
Time-domain plot of pressure pulsation at the monitoring point near the volute tongue of the impeller.
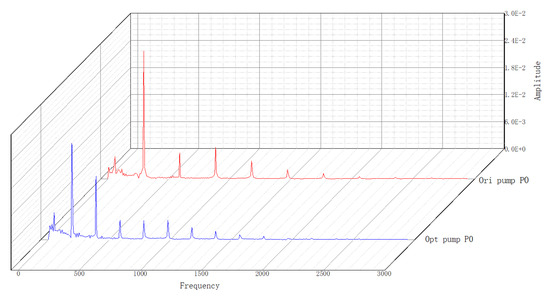
Figure 15.
Frequency-domain plot of pressure pulsation at the monitoring point near the volute tongue of the impeller.
By analyzing the results from both the time-domain and frequency-domain plots, it can be concluded that the optimized design not only reduces the pressure pulsation levels within the impeller but also helps mitigate vibration issues caused by pressure pulsation. This is of significant importance for improving the reliability and extending the service life of the centrifugal pump.
As shown in Figure 16, by comparing the distribution characteristics of the circumferential angle and pressure pulsation coefficient (CP value) in the radar chart, the performance improvement strategy of the optimized pump in key areas is fully reflected.
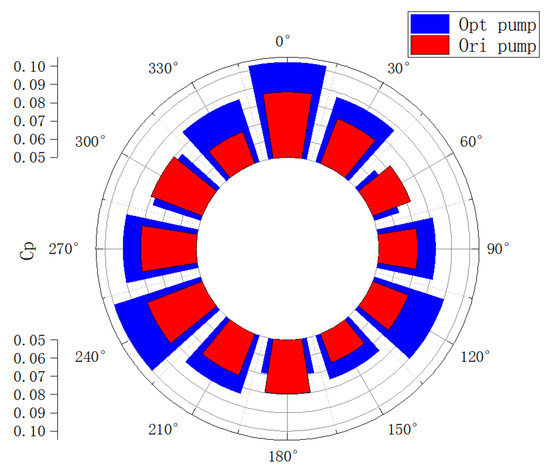
Figure 16.
Circumferential distribution characteristics of the blade passing frequency at the interface monitoring points of the original pump and the optimized pump.
The CP value of the optimized pump is more regular, and a cycle is completed every 120°, which decreases first and then increases, reaching peak values at 0°, 120°, and 240° respectively. At the 60°, 180°, and 300° monitoring points, CP values of the optimized pump are generally lower than those of the original model. This means that the flow characteristics of the optimized pump in these areas are improved, the hydrodynamic losses are reduced, and the pressure pulsation is reduced, resulting in a more regular pressure distribution.
At non-critical angles such as 180°, the CP value of the optimized pump further rises to 0.10, which is significantly higher than that of the original pump, indicating that the secondary flow disturbance in the volute diffusion section is significantly enhanced, which conforms to the design principle of “focusing in the main bearing area and sub-regional unloading”. In terms of engineering maintenance, the high CP area (0°, 30°, and 330°) of the pump is optimized to match accurately with the leading edge of the blade near the volute tongue to achieve directional strengthening of the pressure load, which can effectively reduce CP values in other areas. However, the high CP value of the original pump is scattered in multiple angles and has no regularity, so it cannot be adjusted accordingly, resulting in increased operation and maintenance costs.
The optimized pump achieves multi-objective collaborative optimization of structural reliability, maintenance efficiency, and flow stability by focusing the pressure pulsation energy in the critical region and improving the energy distribution in the non-critical region.
5. Conclusions
In this study, an orthogonal experimental method was employed to optimize the design of a single-stage centrifugal pump, leading to the following conclusions:
(1) Using the L₁₆(44) orthogonal array, an optimization experiment was conducted on four parameters: the blade outlet angle β₂, blade wrap angle Δφ, impeller outlet width b₂, and number of blades Z. Based on comprehensive considerations of power, head, and pump efficiency, the optimal parameter combination was determined to be as follows: blade outlet angle of 6.6°, blade wrap angle of 240°, impeller outlet width of 7.9 mm, and four blades.
(2) The range analysis revealed that the blade wrap angle exerts the most significant influence on the pump head, whereas the blade outlet angle has the least impact on the pump efficiency. Increasing the impeller outlet width and the blade outlet angle initially improves and subsequently reduces the pump efficiency, with the highest efficiency achieved at an impeller outlet width of 7.9 mm and a blade outlet angle of 6.6°. Simultaneously, as the number of blades and the blade wrap angle increase, the efficiency decreases, peaking at four blades and a wrap angle of 200°. Both the head and power exhibit a positive correlation with the number of blades and decrease with an increase in the blade wrap angle.
(3) Under the 1.5 Qₙ operating condition, the resonance frequency of the optimized impeller significantly decreased from 1006.4 Hz to 976.9 Hz, and the average deformation of the impeller was reduced. The first-order deformation decreased from 3.5935 mm to 3.319 mm, and the fourth-order deformation decreased from 9.292 mm to 8.1966 mm.
(4) At the monitoring point set at the volute tongue, the pressure pulsation amplitude of the optimized impeller was significantly lower than that of the original pump. The circumferential distribution of the blade passing frequency in the optimized pump exhibited higher regularity compared to the original model, demonstrating its significant advantages in reducing pressure pulsation and improving operational stability.
(5) The calculation results indicate that the efficiency of the optimized pump significantly improved at all operating points, while the motor power decreased. Under the 1.5 Qₙ condition, the power of the optimized pump was reduced by 2.67 kW. The internal flow state of the impeller was improved, and flow losses were reduced. At the rated flow rate, the average entropy generation also decreased, dropping from 424.118 [W·m⁻3·K⁻1] to 384.957 [W·m−3·K−1] after optimization.
The primary optimization goal of this study was to reduce power consumption while improving efficiency. Based on orthogonal experiments, the pressure fluctuations and modes before and after optimization were also analyzed. However, other unselected parameters also influence the pump’s performance. In future work, more advanced numerical techniques such as large eddy simulation (LES) and direct numerical simulation (DNS) will be used to improve model accuracy. More accurate experimental methods, such as particle image velocimetry (PIV) and laser Doppler velocimetry (LDA), were used to verify the accuracy of the simulation results. A comprehensive approach combining numerical simulation and experimental validation was used to evaluate and optimize pump performance more comprehensively. We will continue to explore more advanced technologies and methods to ensure the accuracy and reliability of the research content and accuracy of model. The effects of these parameters on the resonance frequency and deformation of the centrifugal pump could be further investigated. Additionally, more advanced methods could be adopted for this optimization approach. This study is mainly for this specific type of centrifugal pump optimization, so optimization results may not be applicable to other design parameters or pump conditions.
Author Contributions
Y.W. and X.X. conceived and designed the content structure and experiments; A.Z. performed the experiments; X.X. analyzed the data; X.X. performed the simulation; Y.W. guided X.X. to write the paper. All authors have read and agreed to the published version of the manuscript.
Funding
This research was funded by the Central Guidance for Local Science and Technology Development Fund (project no. 2024ZY01008).
Data Availability Statement
The data cannot be made publicly available upon publication because they contain commercially sensitive information. The data that support the findings of this study are available upon reasonable request from the authors.
Acknowledgments
I would like to express my sincere gratitude to my supervisor, Wang Yanping, for her invaluable guidance and support throughout this research. I am deeply thankful to Wang Yanping for her assistance and to Engineer Zhao for his expert advice. I also extend my appreciation to my colleagues Tang Yunlong, Wu Bing, and Han Lei, as well as my juniors, for their help and collaboration.
Conflicts of Interest
Author Anning Zhao was employed by the company Lio Group Pump Co., Ltd. The remaining authors declare that the research was conducted in the absence of any commercial or financial relationships that could be construed as a potential conflict of interest. The Lio Group Pump Co., Ltd. had no role in the design of the study; in the collection, analyses, or interpretation of data; in the writing of the manuscript, or in the decision to publish the results.
Abbreviations
| Q | Rated flow |
| H | Head |
| n | Rotational speed |
| ns | Specific speed |
| B1 | Inlet blade angle |
| B2 | Outlet blade angle |
| D1 | Pump inlet diameter |
| D2 | Impeller outlet diameter |
| b2 | Impeller outlet width |
| D3 | Hub diameter |
| Z | Number of impeller blades |
| △p | Blade wrap angle |
| D4 | Impeller inlet diameter |
| D5 | Pump outlet diameter |
| ρ | Density |
| t | Time |
| k | Turbulent kinetic energy |
| ω | Specific dissipation rate |
| β∗ | Model constant |
| σk | Model constant |
| β | Model constant |
| σω | Model constant |
| σω2 | Model constant |
| S | Model constant |
| μ | Dynamic viscosity |
| μ1 | Turbulent eddy viscosity |
| ν1 | Turbulent eddy viscosity coefficient |
| F1 | Blending function |
| F2 | Blending function |
| α∗ | Reduction coefficient for turbulent viscosity in the standard model |
| i | Factors |
| ki | The average of Ki |
| Ki | The sum of i levels of each factor |
| p | Pressure |
| P | Pump power |
| Qn | Design flow rate |
| R | Range |
| α | Coefficient of thermal expansion |
| E | Young’s modulus |
| ν | Poisson’s ratio |
| σy | Tensile yield strength |
| σc | Compressive yield strength |
| σb | Tensile ultimate strength |
| Ps | Inlet pressure |
| Pd | Outlet pressure |
| Vs | Velocity of the fluid at the inlet |
| Vd | Velocity of the fluid at the outlet |
| ρ | Density of water |
| g | Acceleration due to gravity |
| Zs | Vertical distance between the horizontal plane and the inlet pressure measurement plane |
| Zd | Vertical distance between the horizontal plane and the outlet pressure measurement plane |
| Mn | Torque |
| η | Efficiency of the water pump |
| μ2 | Circumferential velocity of the outer edge of the impeller |
| Cp | Pressure fluctuation coefficient |
References
- GB 6245-2006; Fire-fighting Pumping Units for Mobile and Stationary Applications. Standardization Administration of China (SAC): Beijing, China, 2006.
- Yang, H.; Liu, S. Multi-objective optimization of centrifugal pump impeller based on kriging model and multi-island genetic algorithm. J. Mar. Eng. Technol. 2020, 19, 1–7. [Google Scholar]
- Wang, Y.-Q.; Deng, Z.-W. Optimization design of hump phenomenon of low specific speed centrifugal pump based on CFD and orthogonal test. Sci. Rep. 2022, 12, 12121. [Google Scholar]
- De Donno, R.; Ghidoni, A.; Noventa, G.; Rebay, S. Shape optimization of the ERCOFTAC centrifugal pump impeller using open-source software. Optim. Eng. 2019, 20, 929–953. [Google Scholar] [CrossRef]
- Zhang, Y.; Song, C. A Novel Design of Centrifugal Pump Impeller for Hydropower Station Management Based on Multi-Objective Inverse Optimization. Processes 2023, 11, 3335. [Google Scholar] [CrossRef]
- Kim, B.; Siddique, M.H.; Samad, A.; Hu, G.; Lee, D.-E. Optimization of Centrifugal Pump Impeller for Pumping Viscous Fluids Using Direct Design Optimization Technique. Machines 2022, 10, 774. [Google Scholar] [CrossRef]
- Wang, C.-N.; Yang, F.-C.; Nguyen, V.T.T.; Vo, N.T.M. CFD Analysis and Optimum Design for a Centrifugal Pump Using an Effectively Artificial Intelligent Algorithm. Micromachines 2022, 13, 1208. [Google Scholar] [CrossRef]
- Lu, R.; Böhle, M.; Gu, Y. Improving the hydraulic performance of a high-speed submersible axial flow pump based on CFD technology. Int. J. Fluid Eng. 2024, 1, 013902. [Google Scholar]
- Han, X.; Kang, Y.; Li, D.; Zhao, W. Impeller Optimized Design of the Centrifugal Pump: A Numerical and Experimental Investigation. Energies 2018, 11, 1444. [Google Scholar] [CrossRef]
- Namazizadeh, M.; Talebian Gevari, M.; Mojaddam, M.; Vajdi, M. Optimization of the Splitter Blade Configuration and Geometry of a Centrifugal Pump Impeller Using Design of Experiment. J. Appl. Fluid Mech. 2020, 13, 89–101. [Google Scholar] [CrossRef]
- Chen, X.B.; Zhang, R.H.; Yang, W.F. Inverse Design and Optimization of Low Specific Speed Centrifugal Pump Blade Based on Adaptive POD Hybrid Model. J. Appl. Fluid Mech. 2022, 15, 453–464. [Google Scholar]
- Dönmez, A.H.; Yumurtacı, Z.; Kavurmacıoğlu, L. Cavitation Performance Enhancement of a Centrifugal Pump Impeller Based on Taguchi’s Orthogonal Optimization. Arab. J. Sci. Eng. 2024. [Google Scholar] [CrossRef]
- Li, X.J.; Ouyang, T.; Lin, Y.P.; Zhu, Z.C. Interstage difference and deterministic decomposition of internal unsteady flow in a five-stage centrifugal pump as turbine. Phys. Fluids 2023, 35, 045136. [Google Scholar]
- Jia, X.; Zhang, Y.; Lv, H.; Zhu, Z. Study on external performance and internal flow characteristics in a centrifugal pump under different degrees of cavitation. Phys. Fluids 2023, 35, 014104. [Google Scholar] [CrossRef]
- Gao, Y.; Li, W.; Ji, L.; Cao, W.; Chen, Y. Optimization Design of Centrifugal Pump Auxiliary Blades Based on Orthogonal Experiment and Grey Correlation Analysis. Water 2023, 15, 2465. [Google Scholar] [CrossRef]
- Li, Z.; Ding, H.; Shen, X.; Jiang, Y. Performance Optimization of High Specific Speed Centrifugal Pump Based on Orthogonal Experiment Design Method. Processes 2019, 7, 728. [Google Scholar] [CrossRef]
- Yang, Y.; Zhou, L.; Zhou, H.; Lv, W.; Wang, J.; Shi, W.; He, Z. Optimal Design of Slit Impeller for Low Specific Speed Centrifugal Pump Based on Orthogonal Test. J. Mar. Sci. Eng. 2021, 9, 121. [Google Scholar] [CrossRef]
- Pei, J.; Yin, T.; Yuan, S.; Wang, W.; Wang, J. Cavitation optimization for a centrifugal pump impeller by using orthogonal design of experiment. Chin. J. Mech. Eng. 2017, 30, 103–109. [Google Scholar] [CrossRef]
- Ke, Q.D.; Tang, L.F. Performance Optimization of Slotted Blades for Low-Specific Speed Centrifugal Pumps. Adv. Civ. Eng. 2023, 9612947, 16. [Google Scholar] [CrossRef]
- Zhang, R.; Chen, X.; Luo, J. Knowledge Mining of Low Specific Speed Centrifugal Pump Impeller Based on Proper Orthogonal Decomposition Method. J. Therm. Sci. 2021, 30, 840–848. [Google Scholar] [CrossRef]
- Al-Obaidi, A. Detection of Cavitation Phenomenon within a Centrifugal Pump Based on Vibration Analysis Technique in both Time and Frequency Domains. Exp. Tech. 2020, 44, 329–347. [Google Scholar] [CrossRef]
- Bellary, S.A.I.; Samad, A. Pumping crude oil by centrifugal impeller having different blade angles and surface roughness. J. Pet. Explor. Prod. Technol. 2016, 6, 117–127. [Google Scholar] [CrossRef]
- Cui, B.; Zhang, Y.; Huang, Y.; Zhu, Z. Analysis of unsteady flow and pressure pulsation of multistage centrifugal pump based on actual size. Proc. Inst. Mech. Eng. Part A-J. Power Energy 2024, 238, 1037–1050. [Google Scholar] [CrossRef]
- Du, L.L.; Zheng, F.; Gao, B.; Gad, M.; Li, D.; Zhang, N. Numerical Investigation of Rotor and Stator Matching Mode on the Complex Flow Field and Pressure Pulsation of a Vaned Centrifugal Pump. Energies 2024, 17, 2416. [Google Scholar] [CrossRef]
- Wang, Q.; Xiao, J.F. Modal Analysis for the Framework of Beam Pumping Unit Based on Solidworks Simulation. Appl. Math. Model. 2013, 37, 439–443. [Google Scholar] [CrossRef]
- Peng, G.; Zhang, Z.; Bai, L. Modal Analyses of Various Length Coaxial Sump Pump Rotors with Acoustic-Solid Coupling. Shock. Vib. 2021, 23, 9. [Google Scholar] [CrossRef]
- Feron, J.; Latteur, P.; Pacheco de Almeida, J. Static Modal Analysis: A Review of Static Structural Analysis Methods Through a New Modal Paradigm. Arch. Computat. Methods Eng. 2024, 31, 3409–3440. [Google Scholar] [CrossRef]
- Li, L.; Xu, P.; Li, Q.; Zheng, R.; Xu, X.; Wu, J.; He, B.; Bao, J.; Tan, D. A coupled LBM-LES-DEM particle flow modeling for microfluidic chip and ultrasonic-based particle aggregation control method. Appl. Math. Model. 2025, 143, 116025. [Google Scholar] [CrossRef]
- Tan, Y.; Ni, Y.; Xu, W.; Xie, Y.; Li, L.; Tan, D. Key technologies and development trends of the soft abrasive flow finishing method. J. Zhejiang Univ.-Sci. A 2023, 24, 1043–1064. [Google Scholar] [CrossRef]
- Mao, Z.; Hosoya, N.; Maeda, S. Flexible Electrohydrodynamic Fluid-Driven Valveless Water Pump via Immiscible Interface. Cyborg Bionic Syst. 2024, 5, 0091. [Google Scholar] [CrossRef]
- Thakkar, S.; Vala, H.; Patel, V.K.; Patel, R. Performance improvement of the sanitary centrifugal pump through an integrated approach based on response surface methodology, multi-objective optimization and CFD. J. Braz. Soc. Mech. Sci. Eng. 2021, 43, 1–15. [Google Scholar] [CrossRef]


Disclaimer/Publisher’s Note: The statements, opinions and data contained in all publications are solely those of the individual author(s) and contributor(s) and not of MDPI and/or the editor(s). MDPI and/or the editor(s) disclaim responsibility for any injury to people or property resulting from any ideas, methods, instructions or products referred to in the content. |
© 2025 by the authors. Licensee MDPI, Basel, Switzerland. This article is an open access article distributed under the terms and conditions of the Creative Commons Attribution (CC BY) license (https://creativecommons.org/licenses/by/4.0/).