Abstract
The jet-type self-cleaning screen filter integrates industrial jet-cleaning technology into the self-cleaning process of screen filters in the drip irrigation system, which has the advantages of low water consumption, high cleaning capacity, and wide applicability compared to traditional filters. However, its commercialization faces challenges as the optimal jet cleaning mode and optimization method have not been determined. This study proposes a framework that combines computational fluid dynamics (CFD), artificial neural networks (ANN), and genetic algorithms (GA) for optimizing jet-cleaning parameters to improve the performance. The results show that, among the main influencing parameters of the nozzle, the incident section diameter d and the V-groove half angle β have the most significant effects on the peak wall shear stress, action area, and water consumption for cleaning. The ANN has a higher accuracy in predicting the performance (R2 = 0.9991, MAE = 9.477), and it can effectively replace the CFD model for predicting the jet-cleaning performance and optimizing the parameters. The optimization resulted in a 1.34% reduction in the peak wall shear stress, a 16.82% reduction in cleaning water consumption, and a 7.6% increase in the action area for the optimal model compared to the base model. The optimization framework combining CFD, ANN, and GA can provide an optimal cleaning parameter scheme for jet-type self-cleaning screen filters.
1. Introduction
Surface water systems supplied by glacial meltwater, which often have high concentrations of particulate impurities, like sediment and algal biomass, are the main source of irrigation water in Xinjiang [1,2,3]. Drip irrigation systems are extremely vulnerable to serious clogging because of these suspended solids. As a core component of drip irrigation systems, filters effectively remove over 95% of suspended impurities from water sources through multi-stage interception [4,5,6]. Their filtration efficiency and self-cleaning capability critically determine the long-term stability of system operation, the service life of emitters, and the irrigation efficiency [7,8].
Conventional self-cleaning screen filters (e.g., backwashing type, steel brush type) currently exhibit limitations, including inadequate contaminant-removal efficiency, incomplete cleaning performance, low operational effectiveness, and susceptibility to screen deformation and damage [9,10]. In contrast, the jet-type self-cleaning screen filter introduces an innovative high-efficiency jet mechanism commonly used in industry [11,12,13,14,15,16] during its self-cleaning cycle, demonstrating significant advantages in reduced water consumption, enhanced cleaning capability, and broad applicability [17,18]. Preliminary experiments have demonstrated that its self-cleaning performance surpasses that of conventional self-cleaning filters. However, its commercialization faces challenges due to an undetermined optimal jet-cleaning pattern. Excessive operational pressure may damage the filter screen, while suboptimal nozzle configurations could compromise cleaning effectiveness [19]. Optimizing the jet-cleaning pattern of the self-cleaning screen filter is imperative to improve the overall operational efficiency of drip irrigation systems and mitigate redundant expenditures, thereby accelerating commercial adoption.
Jet-cleaning technology efficiently utilizes nozzles to generate high-velocity fluid jets (e.g., water, air) to remove surface fouling, such as contaminants and sediments, from substrates like filter screens. The effectiveness of jet-cleaning processes is directly governed by the structural parameters of the nozzle, operating parameters, and operating conditions [20,21]. Some researchers [22,23] have adopted experimental approaches to investigate cleaning parameters in jet-cleaning technology. Representatively, Kim et al. [24] evaluated wall shear stress during jet-impact descaling, utilizing oil-film interferometry to quantitatively map its spatial distribution. Their experimental results revealed a linear correlation between the contaminant removal efficiency and peak wall shear stress magnitudes. The above related physical experiments can obtain more accurate results and phenomena, but they have many limitations in the optimization process of parameters or patterns, such as a long experimental observation period, being time-consuming and labor-intensive, and the inability to exhaustively explore the range of variables. This has prompted researchers to increasingly try to optimize jet cleaning parameters through numerical simulations instead of experiments [25,26,27]. For example, Kawale and Chandramohan [28] employed computational fluid dynamic (CFD) simulations to determine the critical shear stress required for the effective jet-cleaning of flat contaminated surfaces. Huang and Chen [29] conducted a three-dimensional numerical simulation of the hydrodynamic performance in ultra-high-pressure waterjet descaling nozzles, revealing that the standoff distance and jet impingement angle exert the most significant influence on the wall shear stress. While the numerical simulation approach in the above study may provide an alternative to physical experimentation by reducing labor-intensive time requirements, it requires high-performance computational resources; insufficient computational power may result in computations that are too slow or even unable to solve complex model problems.
Given the time-consuming problem of traditional experimental and numerical simulation modeling methods, whether there exists a more efficient and accurate method or framework for optimizing the performance of jet cleaning also needs to be further explored. With advances in computational capabilities, artificial intelligence (AI) algorithms have demonstrated predictive and optimization capabilities across multiple domains [30,31,32]. Xu et al. [33] used a genetic optimization algorithm to optimize the wind resistance of mast inclined structures, and the results show that the optimization algorithm can effectively solve complex structural optimization problems with multiple types of constraints, and the optimization process converges rapidly and stably. Cui et al. [34] proposed a performance optimization method based on the integration of computational fluid dynamic (CFD) numerical simulation and machine learning to predict and optimize the performance of cement decomposition furnaces, and the results show that the inclusion of CFD simulation data makes the prediction model more applicable, with higher stability and accuracy. The above studies have shown that AI algorithms can assist or replace physical tests and numerical simulations to optimize the relevant performance of the research object.
In summary, the current research on jet self-cleaning screen filters is not perfect, such as the design of the nozzle arrangement mainly relies on experimental empirical parameters (e.g., target distance, spray angle, etc.) and the lack of systematic optimization methods or frameworks to ensure that it achieves accurate cleaning and decontamination of the screen. Therefore, this study aimed at a three-dimensional computational fluid dynamics (3D CFD) model with an orthogonal experimental design to determine the key structural parameters of the nozzle. At the same time, the key structural parameters, arrangement type, and operating conditions affecting the cleaning performance of the jet were used as independent variables, and the peak wall shear stress, action area, and water consumption were used as objective functions, and numerical simulation experiments were designed using Latin Hypercubic Sampling (LHS) to generate a database containing 400 data volumes. Nine commonly used artificial intelligence algorithms were systematically evaluated to establish the mapping relationship between the variables and the objective function for the prediction of jet cleaning performance. Subsequently, a data-driven alternative model was developed using artificial neural networks (ANN) and optimized with genetic algorithms (GA) for jet-cleaning performance optimization.
2. Materials and Methods
2.1. Jet-Cleaning 3D CFD Modeling
2.1.1. Model Description
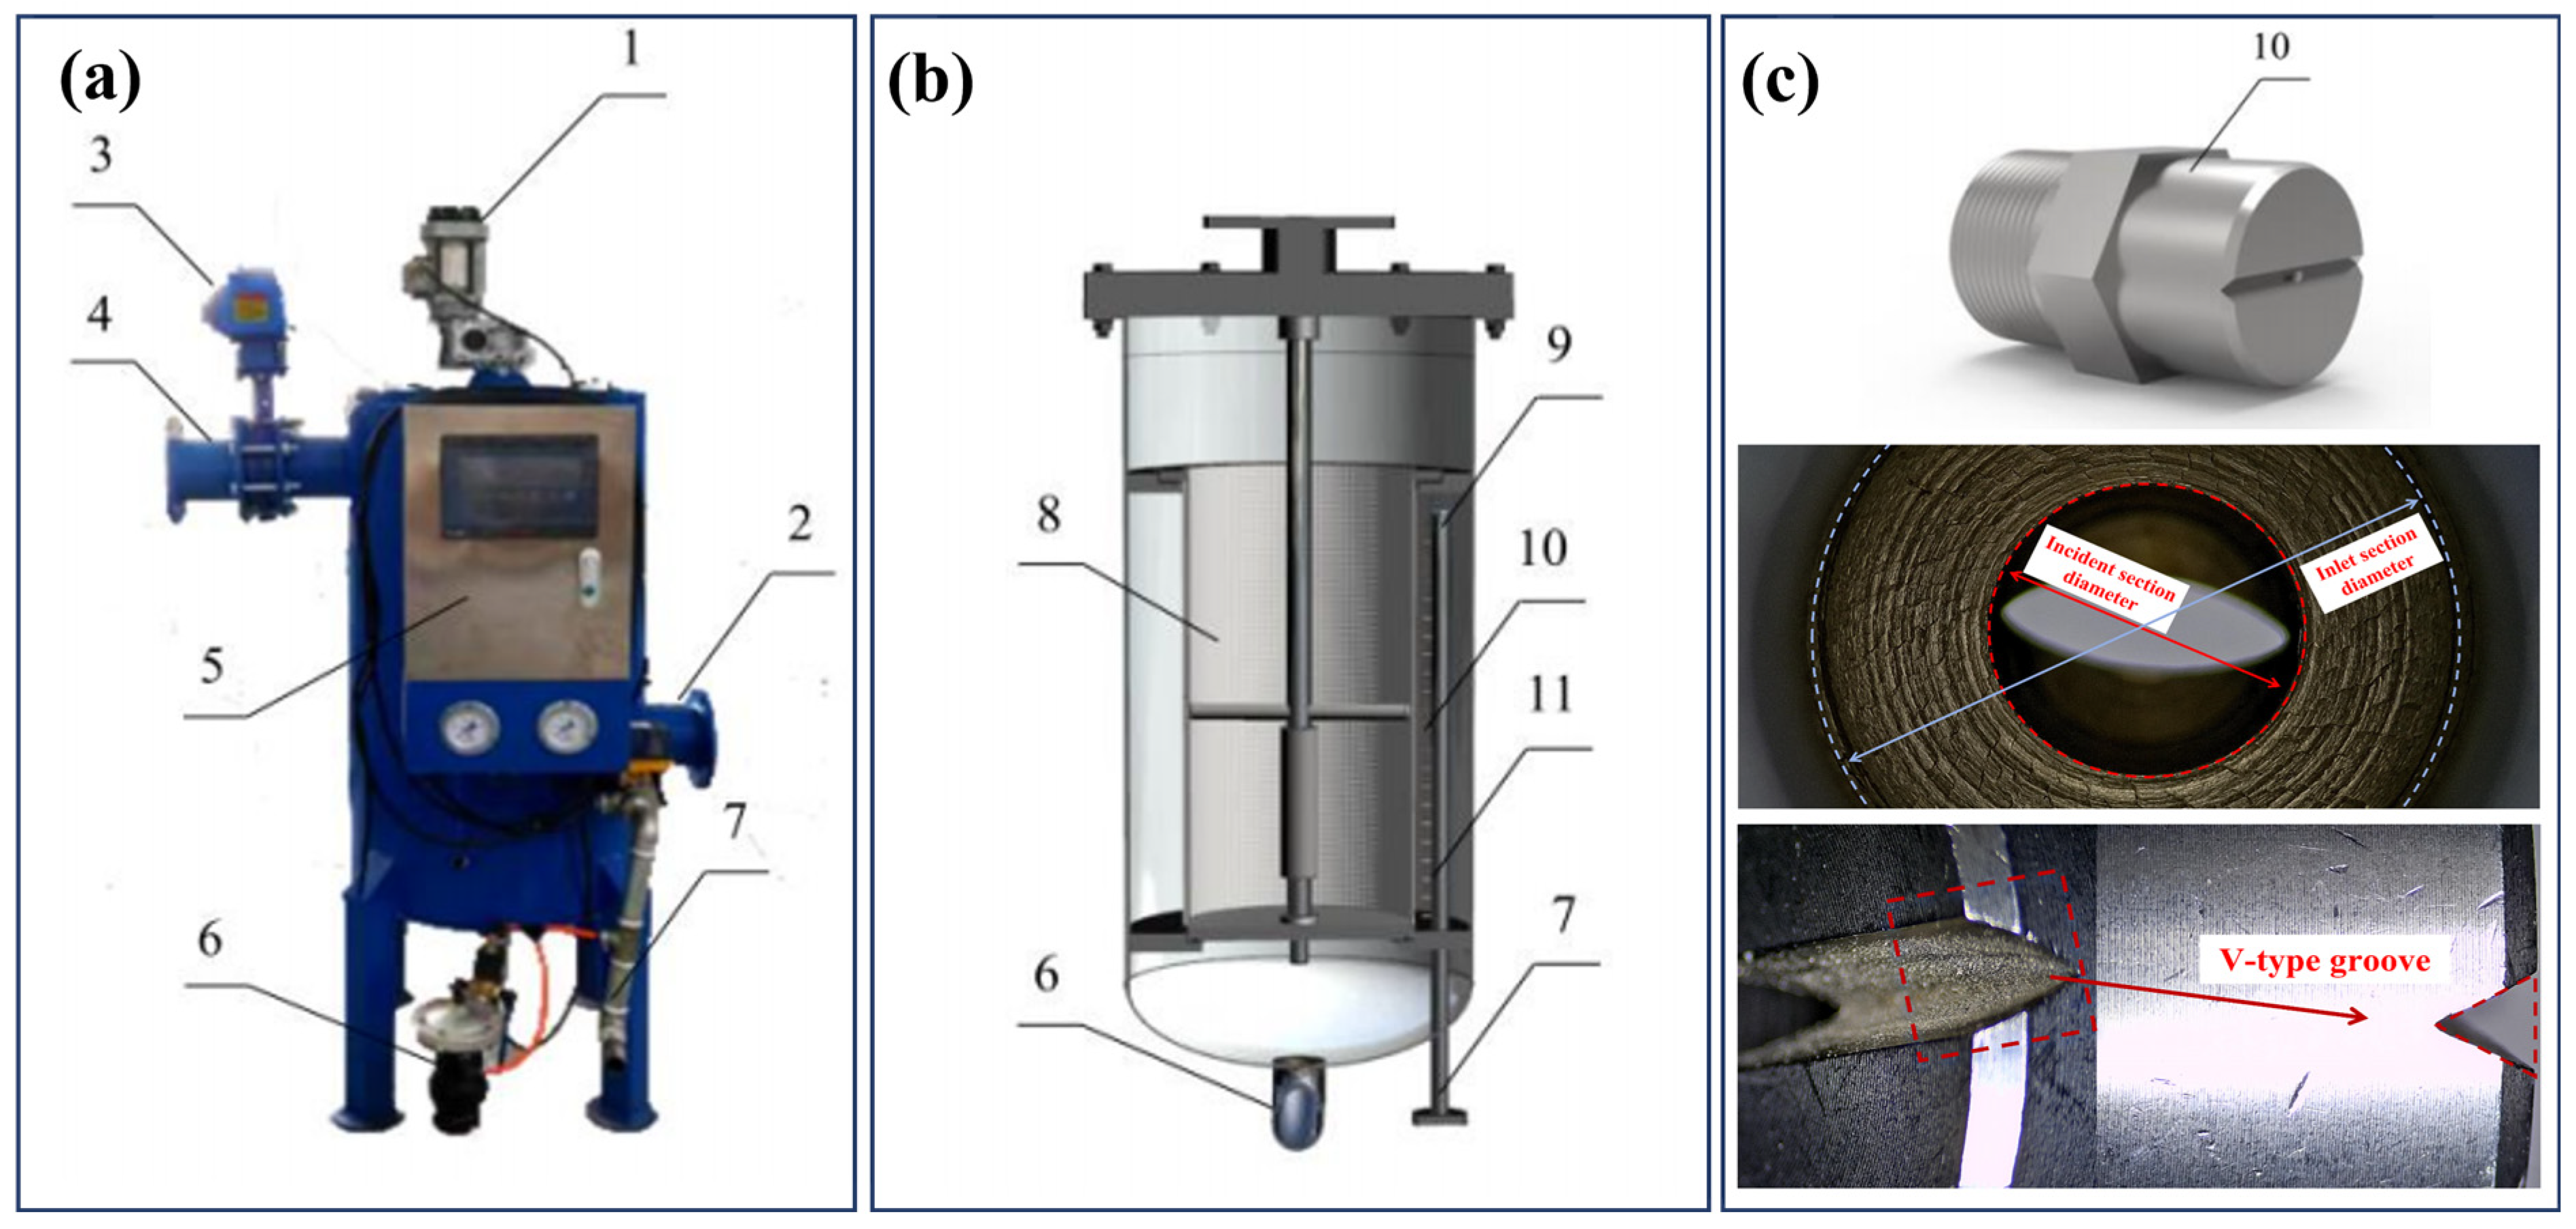
The core technology of the jet-type self-cleaning screen filter lies in its highly efficient jet cleaning, in which the fan-shaped nozzle is the core execution unit, its unique geometric structure enables the cleaning water flow to form a wide-angle fan-shaped water curtain, and through the impact of the water flow to effectively strip the sediment and other impurities adhering to the screen mesh [17,18]. The prototype of the filter is shown in Figure 1a, including the water inlet, water outlet, nozzle, drive motor, control screen, etc.; the cross-section of the filter is shown in Figure 1b, which shows in detail the relative arrangement of the nozzle and the screen; Figure 1c shows the specific structure of the fan-shaped nozzle and the precise measurement of its internal structure under a high-definition microscope (WO-HD228S, AOSVI, Shenzhen, China). As shown by Li et al. [17], the self-cleaning performance of this filter is primarily limited by the internal structure of the nozzle, operating pressure, and other factors. Therefore, to investigate the self-cleaning performance of the filter and optimize it, the key is to accurately describe the effect of the nozzle structure on the jet’s impact on the target surface.
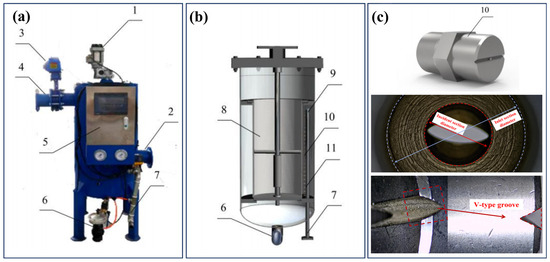
Figure 1.
Structure of jet-type self-cleaning screen filter. (a) overall structure of the filter, (b) section structure of the filter, (c) jet cleaning nozzle and related detail structures. (1: electrical machinery; 2: outlet; 3: pressure gauge; 4: inlet; 5: self-cleaning controller; 6: sewage discharge outlet; 7: clean water inlet; 8: special-shaped filter screen; 9: jet pipe; 10: nozzle; 11: loose joint).
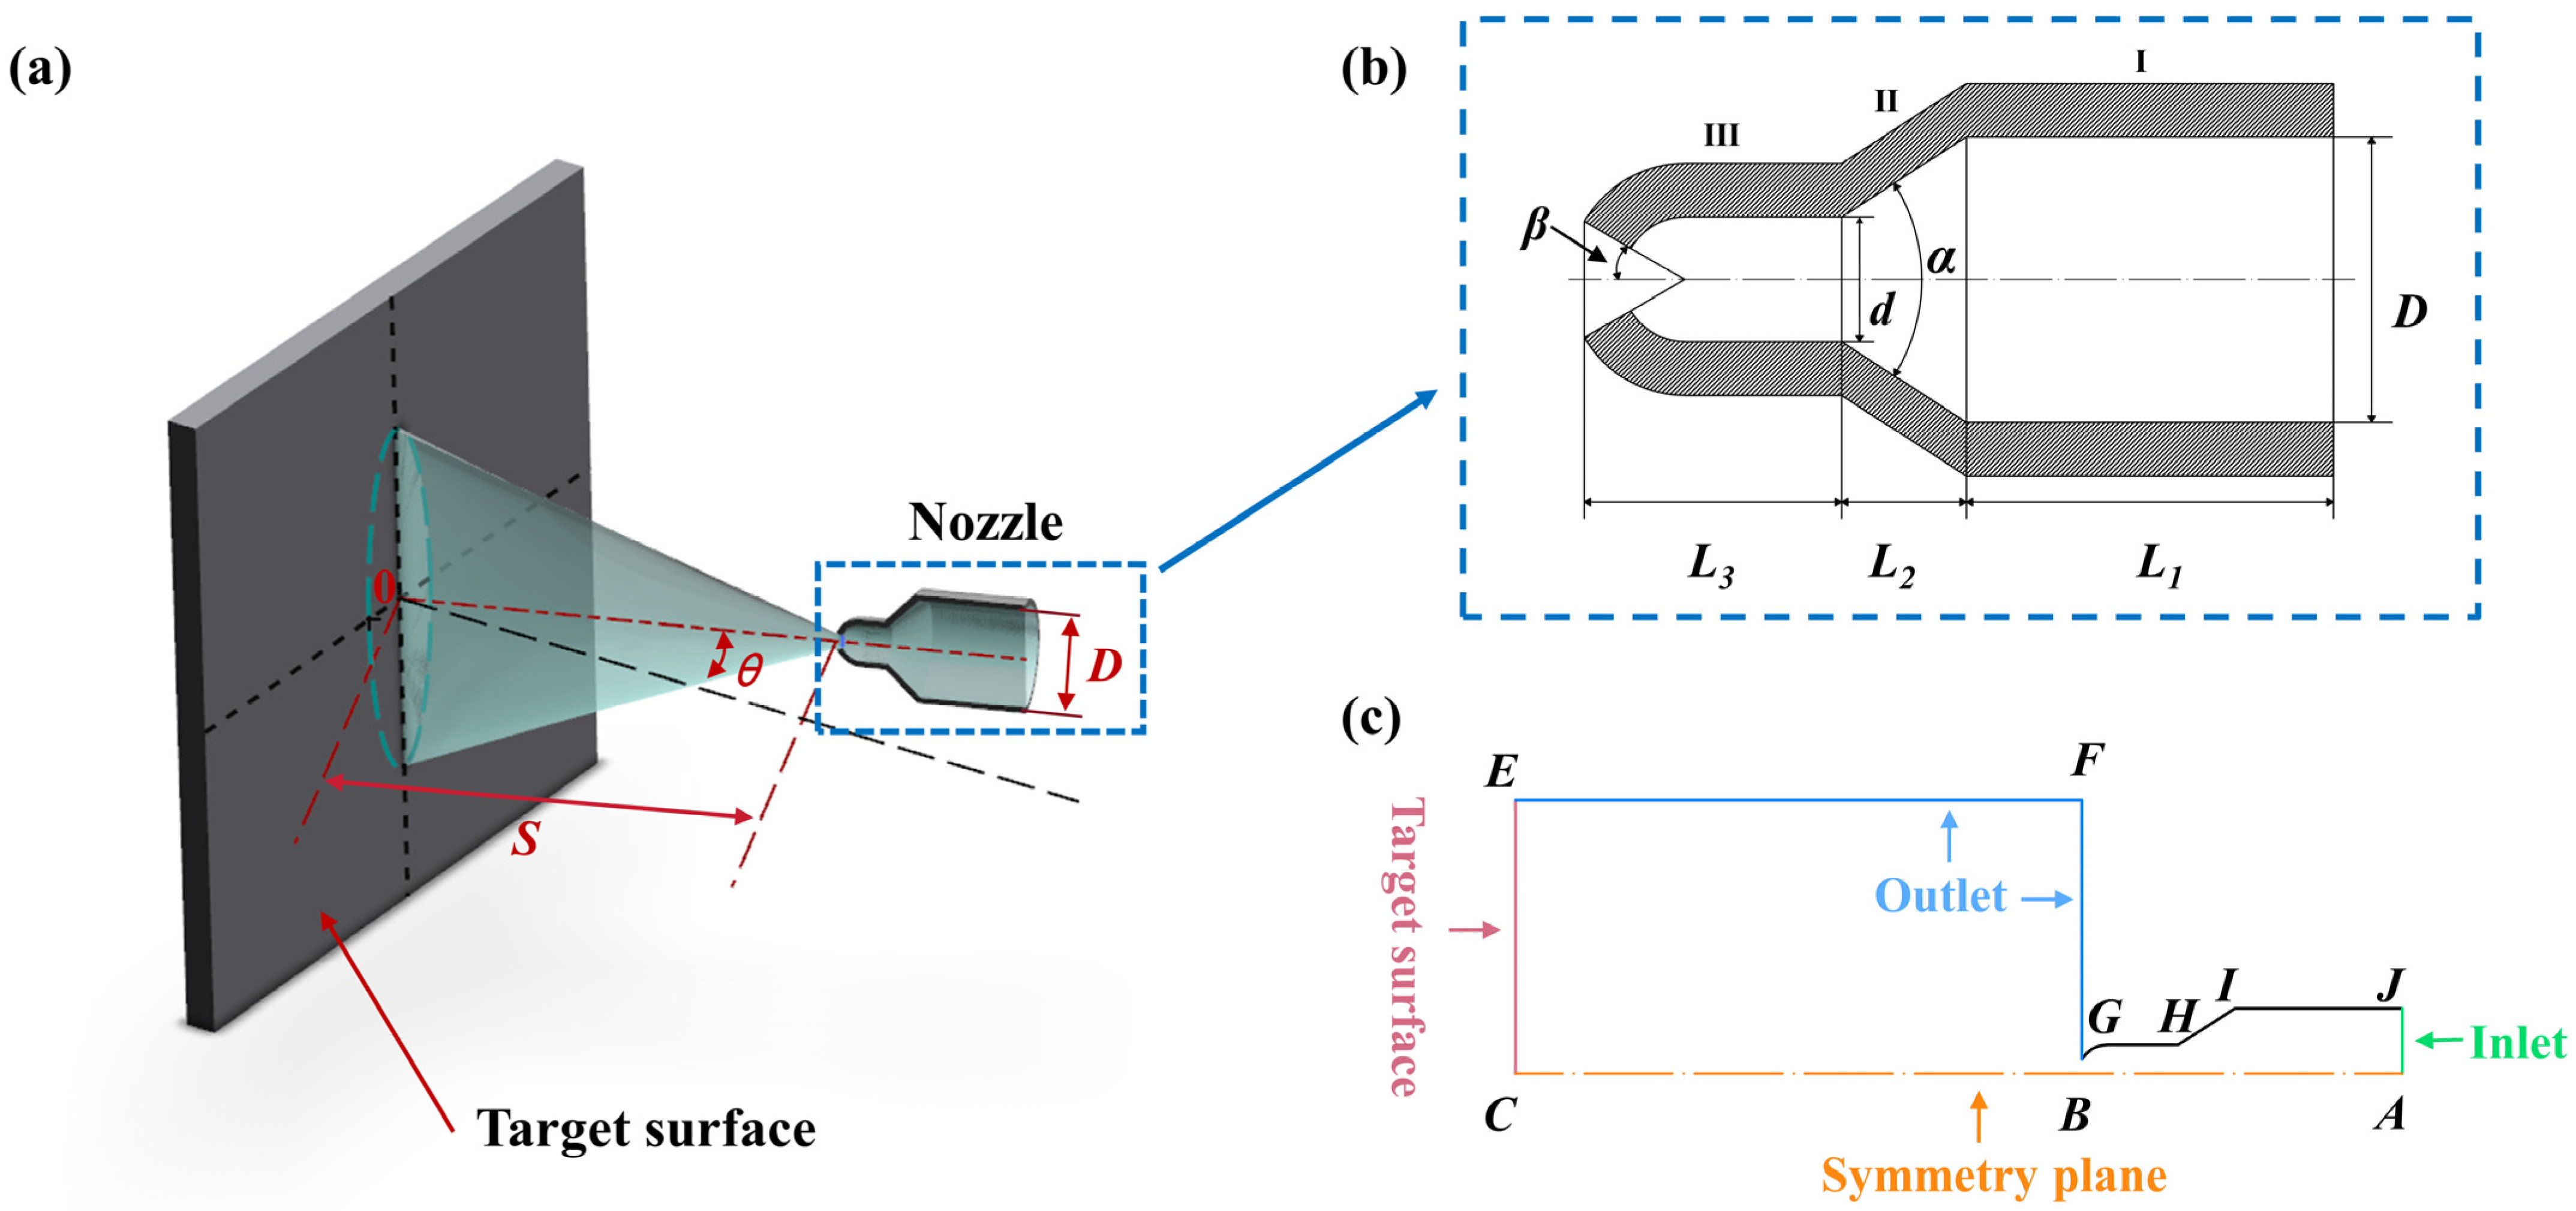
The jet-cleaning model mainly consists of the nozzle inlet section, contraction section, incident section, and nozzle outside the flow field, the target surface, and these five parts of the jet-cleaning geometric structure are shown in Figure 2. Figure 2a shows the schematic diagram of the jet-cleaning model, where the water flow is directed to the target surface through the nozzle to achieve the effect of cleaning; Figure 2b shows the detailed structural diagram of the inside of the nozzle, which describes the structure of the three parts of the inside of the nozzle, which are the inlet section of the nozzle (I), the contraction section (II), and the incidence section (III); and Figure 2c describes the inlet, the outlet, the target surface, etc., of the jet-cleaning model. Under the action of external operating pressure, the fluid (pure water or water mixed with gas) from the nozzle inlet section, after the contraction section of the compression of the development of the fluid in the nozzle through the kinetic energy and other energy exchanges, to reach the incident section of the time, the mixed flow has been a larger velocity of the impact of the fluid; the development of the external flow field, and ultimately reached the target wall, the kinetic energy of the jet is transformed into a target surface (screen) of the pressure of the potential energy, to achieve the cleaning of the target surface (screen).
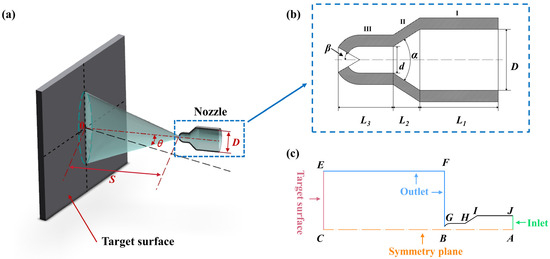
Figure 2.
Schematic of the jet-cleaning model: (a) jet cleaning process and nozzle configuration, (b) nozzle geometry parameters, and (c) jet cleaning model boundary setting. (D: inlet section diameter; d: incident section diameter; α: shrinkage segment angle; β: V-groove half angle; θ: incident angle; S: incident target distance).
In computational fluid dynamics (CFD) modeling, reasonable assumptions are a key means of simplifying complex flow problems [28,29]. The following assumptions were adopted to simplify the modeling and computational processes [35]:
- Both gas and liquid phases are incompressible media, immiscible with each other;
- The temperature remains constant throughout the flow process;
- All wall surfaces are smooth with no-slip conditions;
- Gravitational effects in the flow field are negligible.
2.1.2. Performance Index for Jet-Cleaning Models
There are three main performance index parameters in the jet cleaning model [29], namely the peak wall shear stress τmax, action area Aeff, and cleaning water consumption Qtotal. The peak wall shear stress τmax is the maximum tangential stress generated when the jet impacts the wall, and it directly determines the stripping ability of the jet on the sediment and other dirt. In the numerical model, τmax reflects the comprehensive effect between jet energy, turbulence intensity, and boundary layer interaction, which is the key mechanical parameter to evaluate the efficiency of jet cleaning, and the specific calculation Formula (1) is shown as follows.
where μ is the fluid viscosity, and u is the fluid velocity.
The action area Aeff refers to the effective area where the shear stress τ exceeds the critical stripping threshold τ0 of sediment and other dirt in a single jet operation, which directly reflects the size of the cleaning range of the aerated jet [29]. The calculation Formula (2) is shown as follows.
where is the Heaviside step function expressed as follows:
Water consumption Qtotal is the amount of water consumed per unit of time, which directly reflects whether aerated jet cleaning is water efficient. In the numerical model, Qtotal is obtained by integrating the jet outlet flow with the effective cleaning time.
where Aj is the nozzle outlet cross-sectional area and dj is the nozzle inlet diameter.
The Formulas (1)–(4) described above are all reflected in the jet cleaning numerical model, i.e., the relevant evaluation indexes can be directly obtained through the jet cleaning model to facilitate the subsequent workflow requirements.
2.1.3. Selection of Parameters for Jet Cleaning
In the field of nozzle structural optimization, many scholars usually select key structural variables based on engineering experience or a local analysis [19,29], and such a parameter-selection method relying on subjective cognition may lead to the omission of important variables or the redundancy of non-essential parameters, and the empirical parameter selection is easily limited by the knowledge boundary of the researcher. Therefore, to break through the limitations of the traditional optimization methods and to obtain the optimal nozzle-cleaning performance with relatively few key structural variables, this study carried out a study on the identification of the significance of the influence of the main structural parameters of the nozzle before the optimization of the jet-cleaning performance and selected the parameters that have a significant influence on the evaluation indexes (maximum shear stress on the wall surface, action area, and water consumption) for optimization to achieve the reduction of the complexity of the related work and the improvement of the work. By selecting the parameters with a significant influence on the evaluation indexes (peak wall shear stress, action area, cleaning water consumption), the optimization is carried out to reduce the complexity of the related work and improve the efficiency. To comprehensively study the influence of nozzle structural parameters on the evaluation indexes, after relevant measurements of the nozzle structural parameters, six relatively independent structural parameters, such as the inlet section diameter D, incident section diameter d, inlet length L1, incident length L3, shrinkage segment angle α, and V-groove half-angle β are selected in this study, which are usually included in the parameters used in previous references [17,18,29].
An orthogonal test is a statistical experimental design method based on orthogonal tables, which can efficiently analyze the effects of factors on the results and determine the optimal parameters with a minimum number of experiments through the balanced allocation of multi-factor combinations at each level. The core of the orthogonal test is the orthogonal table, which can cover the balanced matching of factor levels in a limited number of experiments, avoiding redundancy while maintaining the comparability of results. The design needs to first define the target factors and their levels, choose the appropriate orthogonal table to arrange the experimental combinations, and then identify the key factors and the optimal level combinations through extreme deviation or ANOVA. This method is widely used in engineering optimization, manufacturing processes, agriculture, and other fields and can significantly reduce the cost and time of experiments. In the study, the number of levels of each factor (relevant cleaning parameters) was determined to be 3. The orthogonal test factors and the levels set are shown in Table 1.

Table 1.
Orthogonal test related to six parameters and their set of three levels.
Combined with the knowledge of orthogonal tests, the L18 orthogonal test table was chosen for the above 6-factor, 3-level orthogonal test. In the L18 orthogonal test table, 18 combinations of design factors were obtained; each combination represents an independent parameter design scheme, and the orthogonal test table is shown in Table 2.
Table 2.
L18 orthogonal test table.
Therefore, on the basis of the orthogonal tests described above, the independent parameters of the jet-cleaning model selected in this study were the nozzle incident section diameter d, V-groove half angle β, incident target distance s, incident angle θ, incident pressure p, and gas doping volume r. The ranges of the relevant parameters are shown in Table 3.
Table 3.
Detailed geometric parameters of the jet-cleaning mode.
2.1.4. Mathematical Representation
The Mixture model is widely adopted in multiphase flow simulations due to its capability to resolve interphase coupling with high accuracy while maintaining computational efficiency through reduced resource allocation. This approach requires minimal computational overhead [36]. Consequently, the Mixture model was selected as the multiphase formulation in this study.
The jet-cleaning model is typically governed by four governing equations: the mass conservation equation, momentum conservation equation, energy conservation equation, and turbulence model equations [35].
- Mass conservation equation
In the jet-cleaning model, the mass conservation equation is formulated as follows:
where is the density of the mixture, and is the mass-averaged velocity of the mixture. The expression for the density and the mass-averaged velocity of the mixture are given as follows:
where is the volume fraction of the i-th phase.
- 2.
- Momentum conservation equation
The momentum conservation equations govern the equilibrium between momentum variations in fluid parcels and externally applied forces. Within this study, these equations are mathematically expressed as follows:
where is the body force. The mixture viscosity and the drift velocity of the i-th phase are mathematically defined as follows:
- 3.
- Energy conservation equation
The energy conservation equation governs the balance between the total energy variation in a fluid element and the combined effects of heat transfer, mechanical work, and external work contributions. In this study, this governing equation is expressed as follows:
where is the enthalpy of substance j in the i-th phase, is the diffusion flux of substance j in the i-th phase, is the effective thermal conductivity, is the energy of the fluid element, and denotes the volumetric heat source term.
- 4.
- Turbulence model equations
The k-ε mixture turbulence model was adopted in this study [37], with its governing equations mathematically formulated in Equations (8) and (9).
where and are the Prandtl numbers for k and , with and ; , are the model constants, where = 1.44 and = 1.92.
2.1.5. Boundary Conditions and Solver Settings
The meshing is dominated by a tetrahedral mesh, and a boundary layer mesh is created for the nozzle wall area. The average quality of the mesh exceeded 0.6. In numerical simulations, boundary conditions serve as critical factors in determining whether the model accurately reflects real physical phenomena. For the jet-cleaning model, the inlet shown in Figure 2c represents the fluid entry port, through which the jet is expelled toward the target surface. The inlet was assigned varying incident pressures and gas volume fractions. The outlet in Figure 2c was configured as a pressure outlet at 0 MPa, while all other boundaries were defined as stationary walls. A pressure-based and transient solver coupled was employed, utilizing a time step size of 0.001 s for 500 computational steps [35,38,39].
2.2. Predictive Algorithm Selection
2.2.1. Latin Hypercube Sampling
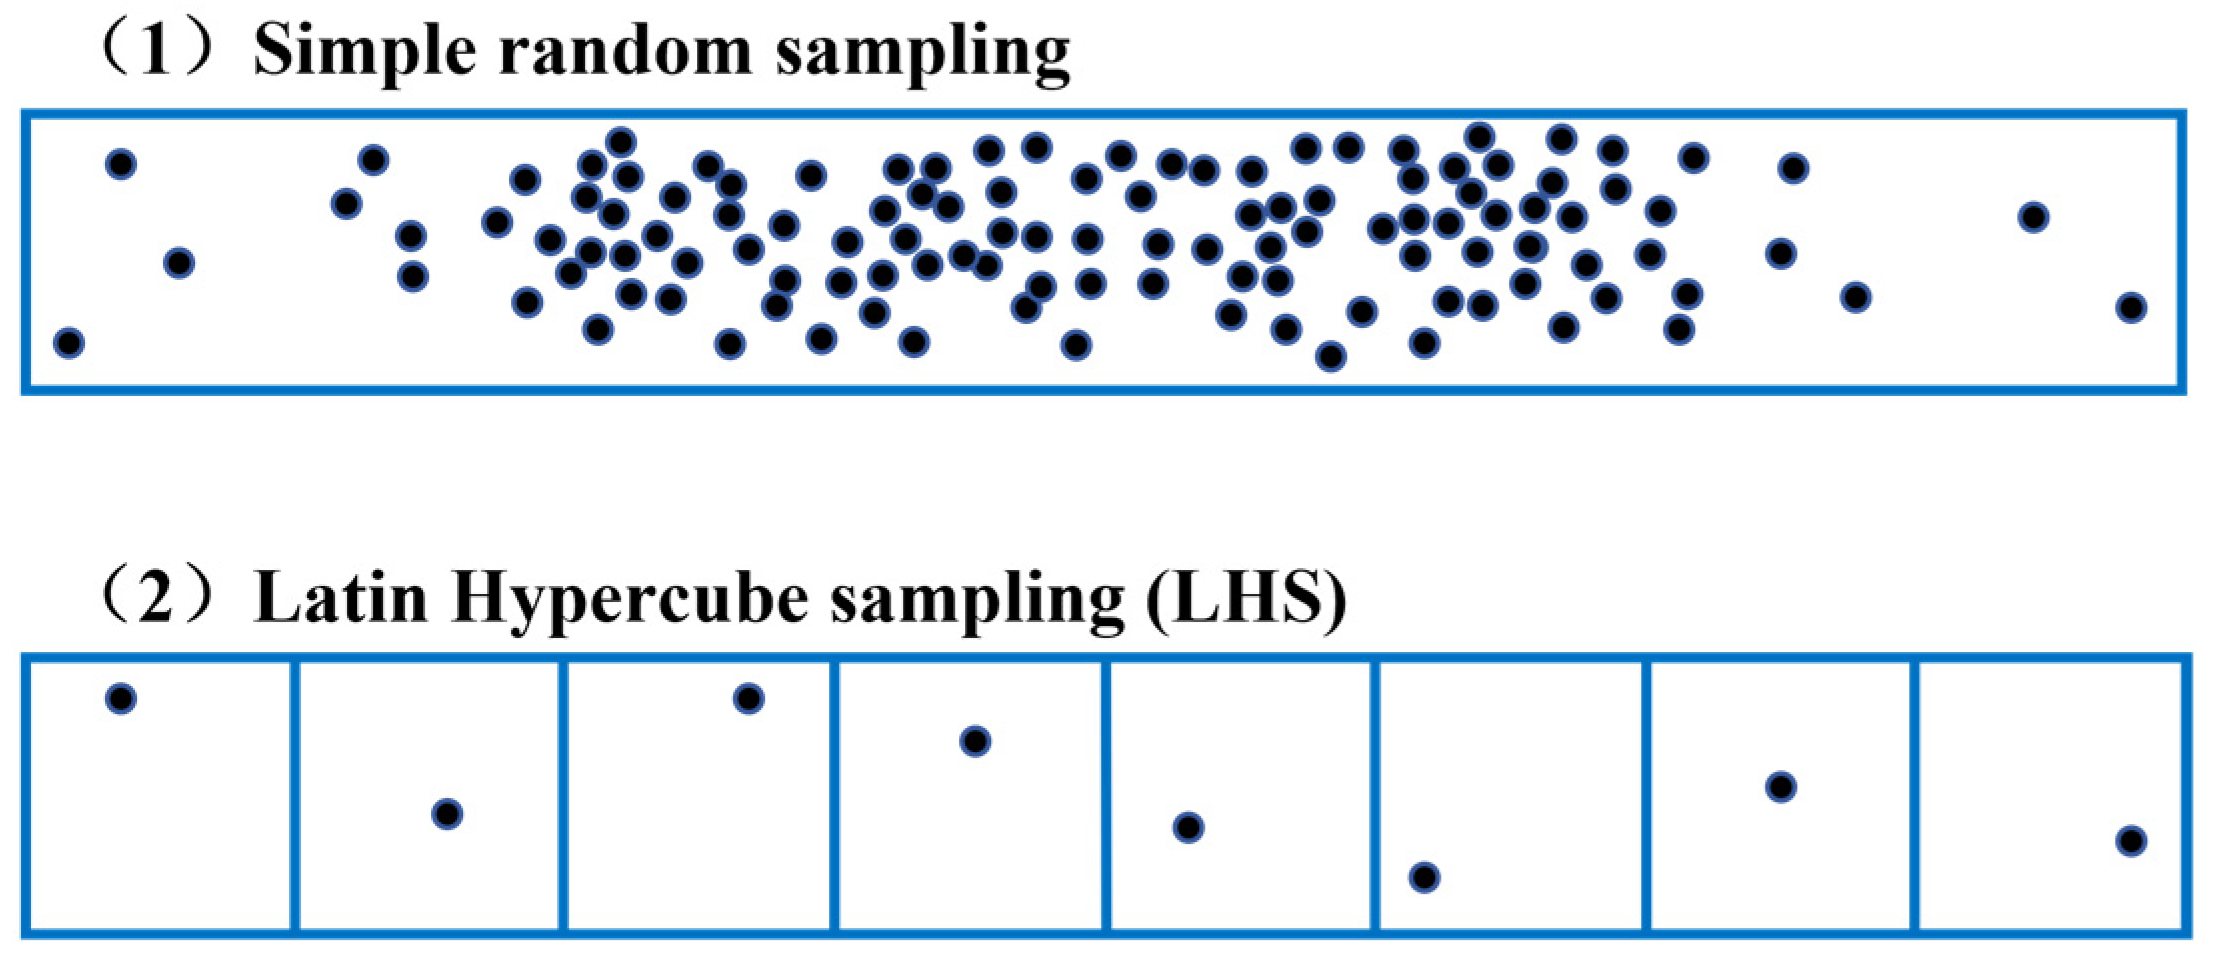
To address the inefficiency of conventional Monte Carlo (MC) methods in high-dimensional spaces, Latin Hypercube Sampling (LHS) employs a stratified sampling strategy to achieve superior spatial coverage uniformity with fewer samples. As the dimensionality increases, LHS maintains a uniform distribution across all dimensions, thereby mitigating the “curse of dimensionality” inherent to MC methods at higher dimensions [40,41,42]. As illustrated in Figure 3, significant disparities exist between simple random sampling and LHS. To ensure sampling consistency and generalizability, this study adopts LHS to alleviate computational burdens.
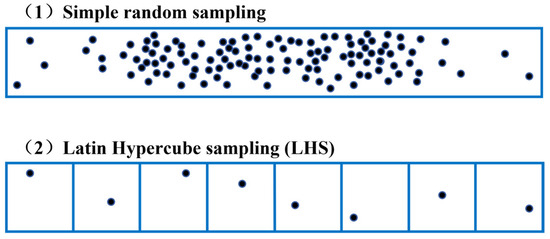
Figure 3.
Simple random sampling and Latin hypercube sampling.
The LHS workflow proceeds as follows:
- For each input variable, partition its cumulative probability range into N equiprobable intervals based on its probability distribution.
- Randomly draw one cumulative probability value from each interval, yielding N stratified samples per variable.
- Convert the sampled cumulative probabilities to actual variable values using the inverse cumulative distribution function.
- Perform random pairwise permutations of sampled values across variables to eliminate spurious correlations.
- The resultant N samples form a multidimensional input space with minimized spatial clustering.
In this study, 400 groups of unrepeated samples are generated through Latin hypercubic sampling based on the number of relevant cleaning parameter variables and the corresponding value range of each variable [29], and the parameterization process of model construction, meshing, and numerical simulation is adopted for each group of samples, to obtain the objective function values corresponding to the samples in each group, i.e., the evaluation indexes (the peak wall shear stress τmax, action area Aeff, and cleaning water consumption Qtotal); all the samples and corresponding objective function values are jointly established into a database of the aerated jet cleaning model for subsequent structural optimization work. All the samples and the corresponding objective function values are jointly established into a database of aerated jet cleaning models for subsequent structural optimization work.
2.2.2. Performance Prediction Using Intelligent Algorithms
Although CFD modeling provides valuable insights for analysis and optimization, conventional approaches often entail prohibitive computational complexity and time constraints. In contrast, artificial intelligence algorithms can establish input–output mappings without explicit reliance on physical laws, enabling rapid predictions with high accuracy [43,44]. Commonly employed algorithms include artificial neural networks (ANN), support vector machines (SVM), random forests (RF), and extreme gradient boosting (XGBoost). To comparatively assess the predictive performance, regression models were developed using nine distinct algorithms. The coefficient of determination (R2) and mean absolute error (MAE), as formulated in Equations (14) and (15), were employed to evaluate the suitability of the regression equations.
where RSS and TSS denote the residual sum of squares and total sum of squares, respectively; is the actual value, is the output value predicted by the artificial intelligence algorithms, and is the mean of the actual values.
The coefficient of determination (R2) ranges between 0 and 1, and when this value is closer to 1, the lower mean absolute error (MAE) indicates superior model fitness.
2.3. Prediction Modeling Combining CFD and ANN
2.3.1. Artificial Neural Network (ANN)
Artificial Neural Networks (ANNs) are computational models inspired by biological neural systems, such as the interconnected neurons in the human brain, designed to emulate synaptic signal transmission for complex data processing and pattern recognition [45]. Compared to other intelligent algorithms, ANN exhibits superior capabilities in handling intricate and nonlinear modeling tasks. As demonstrated in Section 2.2 and Section 3.2, ANN-based predictions of jet-cleaning performance achieve the highest coefficient of determination (R2) and lowest mean absolute error (MAE) among the evaluated methods. The ANN architecture, illustrated in Figure 4, comprises three layers: an input layer, two hidden layers, and an output layer, with structural parameters detailed in Table 4.
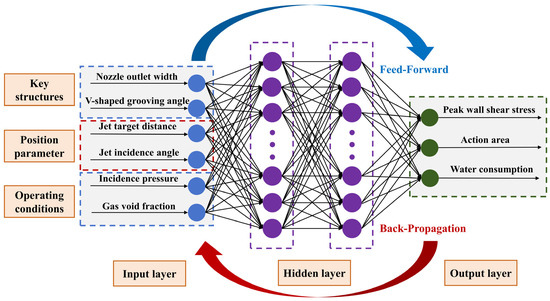
Figure 4.
Artificial neural network structure diagram.
Table 4.
Artificial neural network training and structural parameters.
The activation function, one of the most critical components in an ANN, introduces nonlinear mapping capabilities to the network. The sigmoid function is defined as follows:
is commonly employed due to its differentiable, S-shaped output range (0, 1).
2.3.2. Performance Prediction of Jet-Cleaning Using ANN
In neural networks, data normalization is a critical preprocessing step to accelerate model convergence and enhance training stability [46]. In this study, the Min–Max normalization method was applied to preprocess the dataset. The normalization formula is expressed as follows:
where and are the maximum and minimum of the data, respectively.
During the training of the artificial neural network (ANN), the backpropagation algorithm iteratively adjusts weights to minimize the loss function. In this study, the mean squared error (MSE) formulation shown in Equation (18) was employed as the loss function.
2.4. Optimization Procedure Combining ANN and GA
2.4.1. Genetic Optimization Algorithm (GA)
The genetic algorithm (GA), a self-adaptive global optimization method inspired by biological inheritance and evolutionary mechanisms, is widely recognized in computational mathematics for its efficiency, robustness, and parallel search capabilities [47,48]. Furthermore, GA has demonstrated exceptional efficacy in addressing complex nonlinear problems across diverse domains, including machine learning, signal processing, multi-objective optimization, and artificial life sciences.
2.4.2. Performance Optimization of Jet-Cleaning Using GA
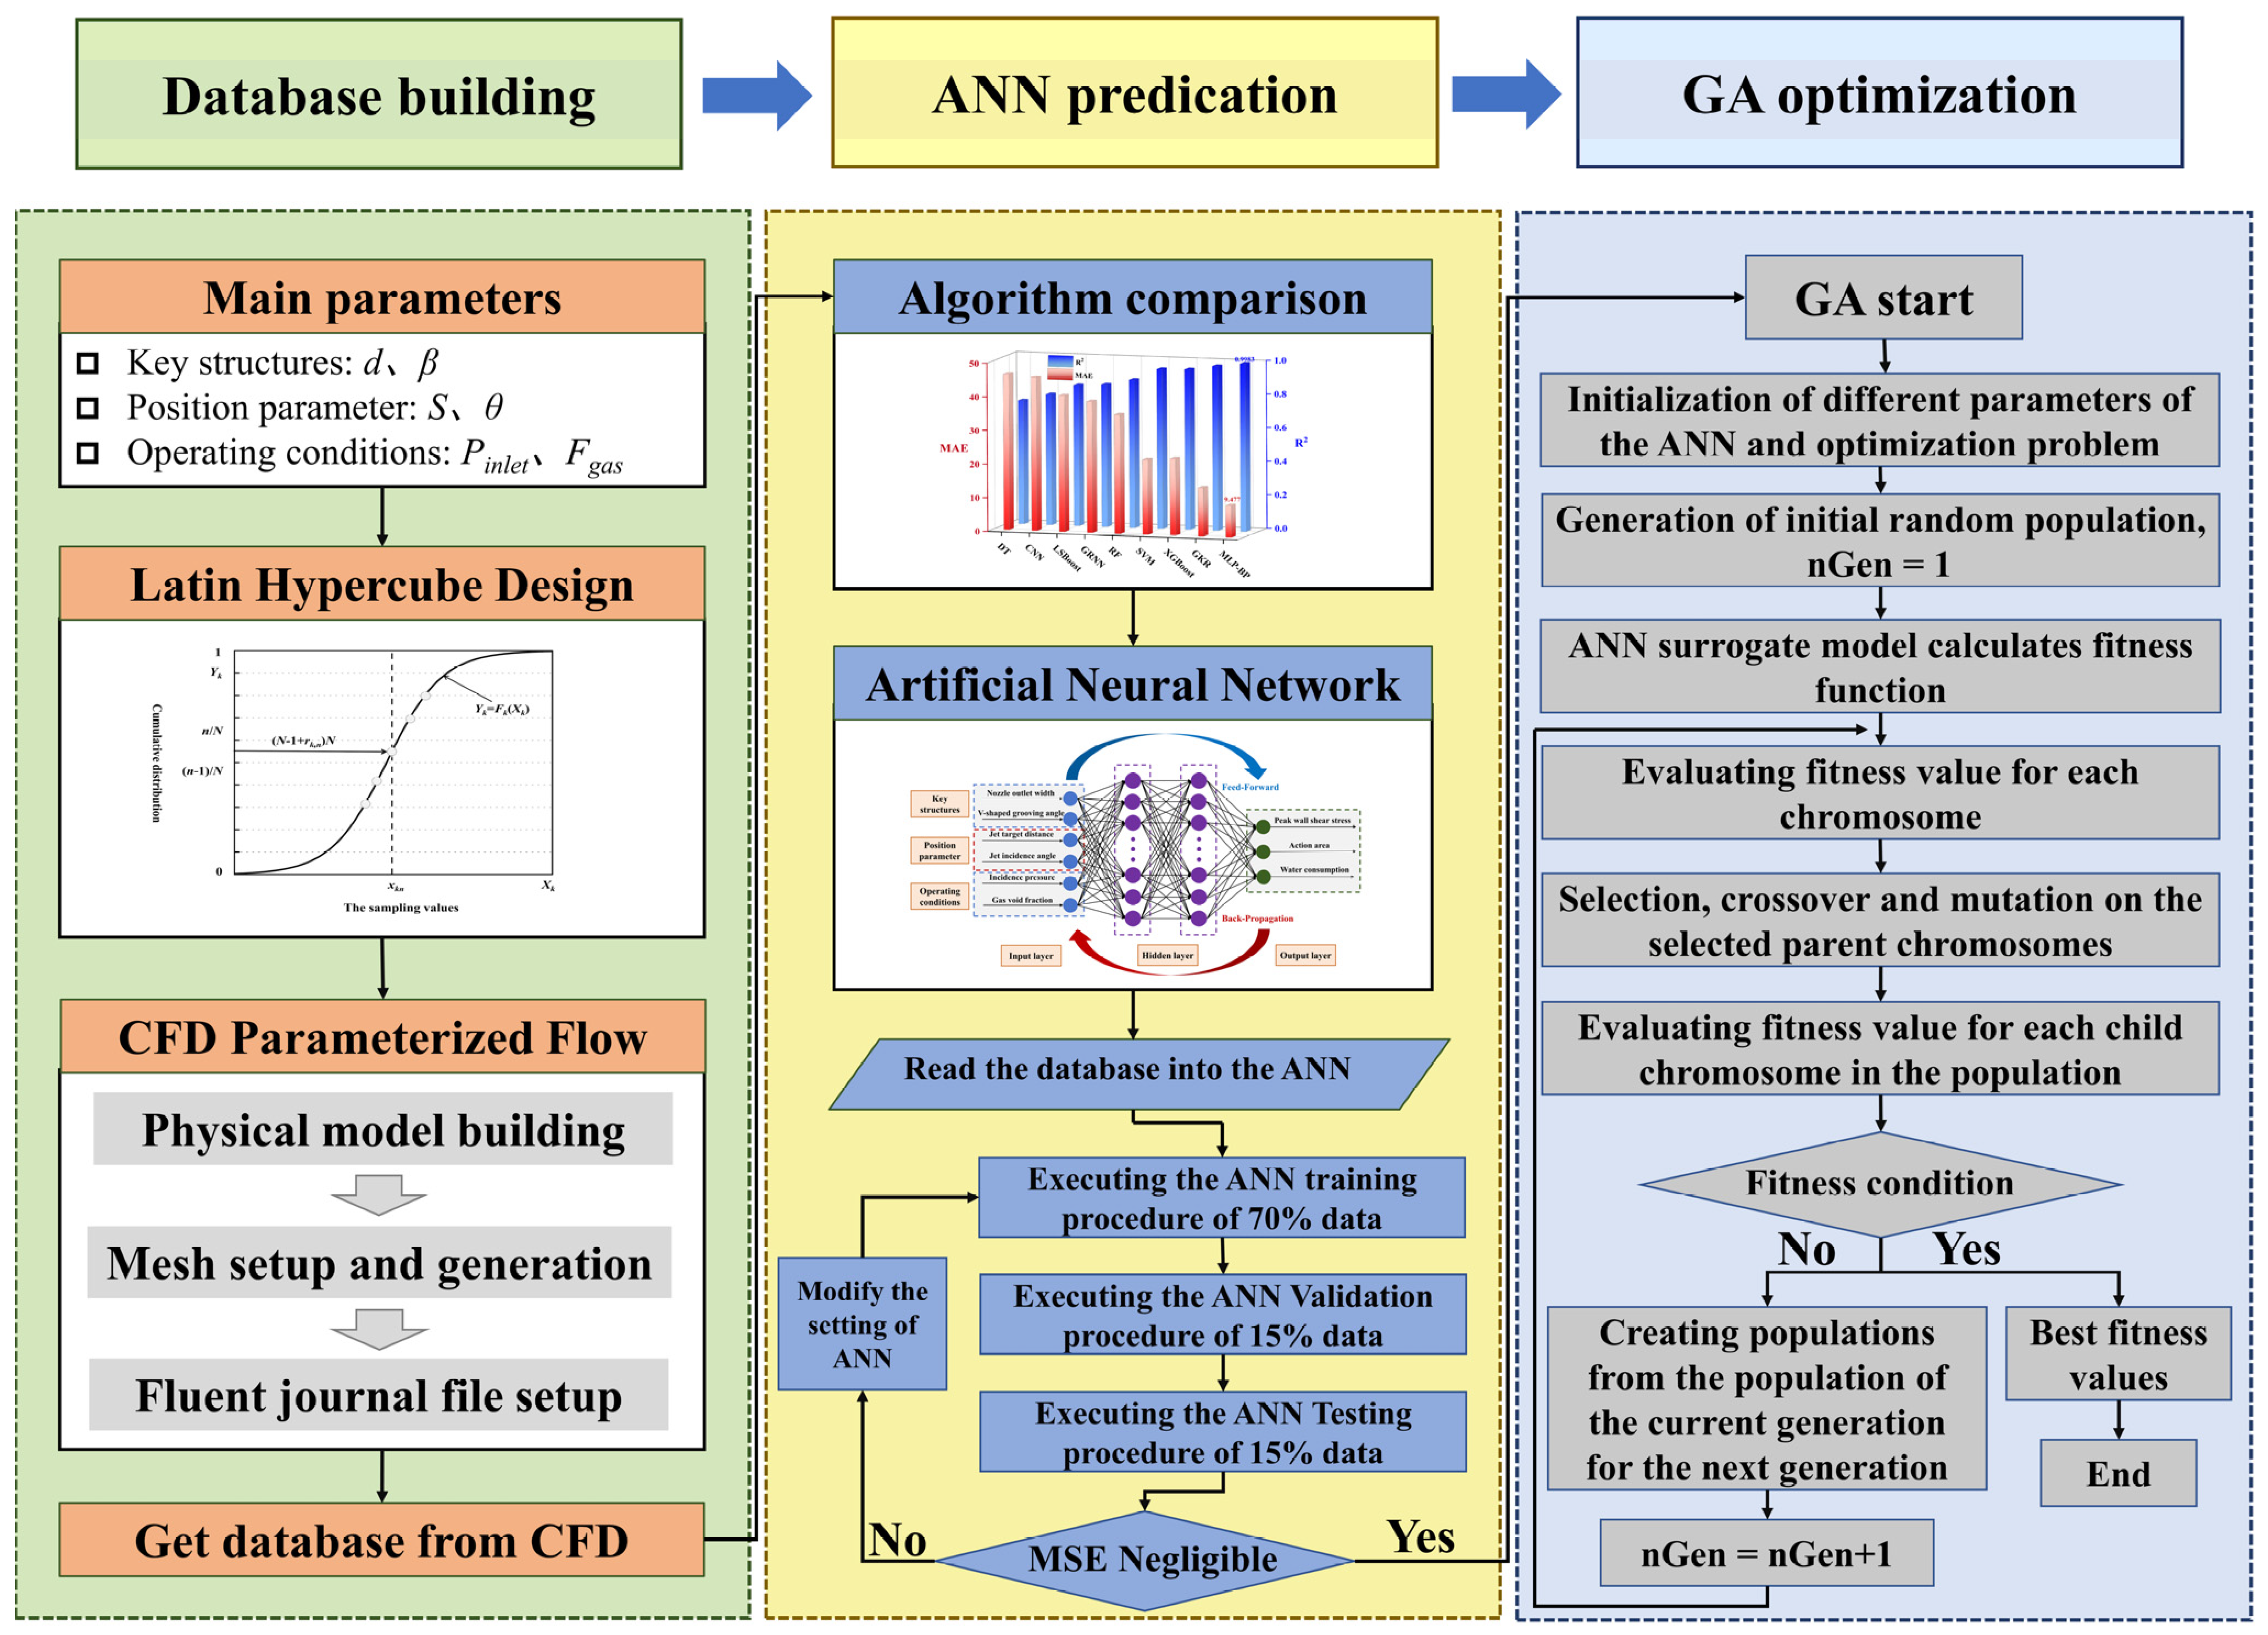
This study developed a collaborative framework integrating computational fluid dynamics (CFD), artificial neural networks (ANN), and genetic algorithms (GA) to optimize jet-cleaning performance. Leveraging the trained surrogate ANN model, this work employs the GA to enhance jet-cleaning performance metrics, with the optimization workflow detailed in Figure 5.
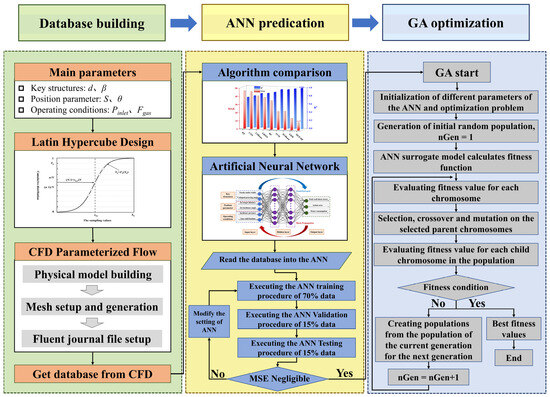
Figure 5.
The optimization workflow via an integrated 3D CFD-ANN-GA approach.
The GA workflow initiates with the generation of an initial population comprising randomly generated individuals, where each individual represents a potential solution within the design space. Subsequently, the developed surrogate ANN model evaluates the fitness of each individual. Individuals exhibiting superior fitness values are selected as parents, from which offspring are generated via crossover and mutation operators. This iterative process progressively enhances the solution quality, as offspring inherit advantageous genetic traits from parent populations, thereby achieving performance improvements across generations.
The genetic algorithm (GA) process is executed utilizing the trained surrogate ANN model, with optimization objectives to maximize the peak wall shear stress and effective action area during jet-cleaning while minimizing water consumption. The genetic algorithm (GA) parameters were configured as follows: population size of 200, maximum generations of 150, crossover fraction of 0.85, mutation rate of 0.01, and the fitness function deviation is . These parameters are systematically tabulated in Table 5.
Table 5.
Optimized design parameters in the GA.
3. Results and Discussions
3.1. Grid Independency Test and Model Validation
In computational fluid dynamics, the mesh structure is an important prerequisite for numerical computation; too few meshes may not necessarily converge and affect the accuracy of the simulation, while too many meshes may lead to a geometrically increasing computation volume and prolonged computation cycle time, which are not conducive to the normal development of numerical simulation computation in both cases [49]. Therefore, mesh-independent verification is the core verification process to ensure that the simulation results are independent of the mesh resolution. To systematically quantify the influence of the number of grids on the performance of the aerated jet-cleaning model, seven sequentially encrypted grid systems (with cell counts of 339,702, 422,542, 791,713, 1,100,756, 1,637,541, 2,378,512, respectively) were constructed based on the ANSYS Meshing module (ANSYS 2024 R1, Commonwealth of Pennsylvania, USA) with the boundary conditions and geometrical structure parameters unchanged, to evaluate their impact on jet-cleaning-performance prediction. As shown in Figure 6, when the number of grids increases, the maximum impact pressure on the wall surface also increases; when the number of grids reaches 1,100,756, the maximum impact pressure on the wall surface is 1.89 × 10⁴ Pa, but with the number of grids continuing to increase, the change is very small. Therefore, in order to save time and costs and ensure the accuracy of the model, the number of grids around 1,100,756 is selected for the mesh division of the jet-cleaning model.

Figure 6.
Mesh independence test using different grid numbers.
Zhang et al. [47] carried out relevant derivation calculations for the theoretical flow rate of the fan nozzle, and the calculated results were highly consistent with the experimental values. To validate the mathematical model, the CFD-predicted water consumption results were rigorously benchmarked against experimental data from Zhang et al. [47]. The basic parameters and operating conditions of the numerical simulation were the same as the experimental settings. As illustrated in Figure 7, the maximum discrepancy between simulated and experimental datasets remains below 5% across all measurement points. It is noteworthy that the simulated water consumption agrees very well with the empirical measurements and the calculation errors are within the permissible limits [29]. This close correlation validates the appropriateness of the selected numerical scheme, mesh topology, and grid resolution density. Consequently, the validated computational modeling provides a reliable basis for parametric optimization studies targeting jet-cleaning efficacy enhancement.
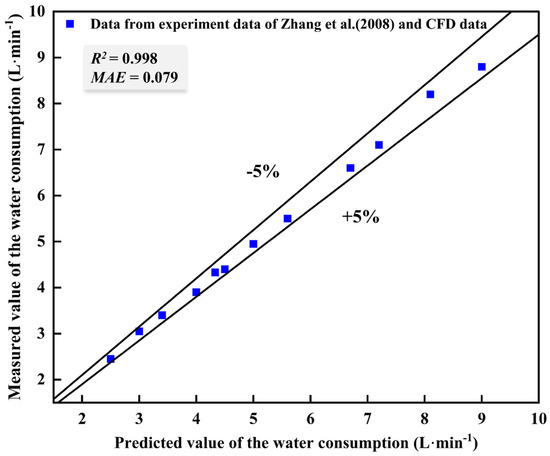
Figure 7.
Model validation using experimental data of Zhang et al. [47].
3.2. Selection of Nozzle Key Structural Parameters
From the L18 orthogonal test, the contribution of the relevant parameters to the performance index can be obtained, i.e., it reflects the degree of influence of the parameters on the performance index. Figure 8 depicts the contribution of decision parameters to the performance indicators (peak wall shear stress, action area, and cleaning water consumption). From Figure 8, it can be seen that the nozzle V-groove half angle β is the most significant effect of the maximum shear stress, and its contribution is 76.78%, followed by the nozzle incident section diameter d, and its contribution is 20.22%. The influence of the nozzle incident section diameter d on the action area is most significant, and its contribution rate is 50.42%, followed by the nozzle V-groove half angle β, and its contribution rate is 48.01%. The influence of nozzle incident section diameter d on the cleaning water consumption is the most significant, and its contribution is 63.81%, followed by the nozzle V-groove half angle β, and its contribution rate is 34.20%. This is consistent with the results of Liu et al. [50]. The reason for the above phenomenon is that the V-groove half angle β and incident section diameter d together determine the size of the contact surface between the nozzle incident section and the external flow field. The increase in the contact surface between the nozzle incident section and the external flow field will lead to an increase in the jet flow rate per unit time, which directly affects the maximum shear stress, the action area, and the cleaning water consumption.

Figure 8.
Contribution of decision parameters to performance indicators.
From Figure 8, it can be also seen that the nozzle incident section diameter d and V-groove half angle β have a more significant effect on the peak wall shear stress, action area, and cleaning water consumption, with a total contribution rate of about 97.00%, 98.43%, and 98.01%, whereas the inlet section diameter D, inlet length L1, incident length L3, and shrinkage segment angle α have a smaller effect on the cleaning performance. Therefore, to reduce the complexity of numerical simulation calculation and to guarantee the accuracy of the calculation, in this study, the nozzle incident section diameter d and the V-groove half angle β are selected as the key structural parameters of the nozzle, which are used as the decision-making independent variables for the construction of the subsequent model, and the other structural parameters that do not have a significant impact on the jet cleaning performance indexes are used as fixed values. Such a calculation mode reduces the number of structural variables from six to two, which greatly shortens the time of numerical simulation calculation and reduces the complexity of the model calculation work.
3.3. Jet-Cleaning Model Prediction
Figure 9 summarizes the R2 and MAE values for predictions generated using the nine artificial intelligence algorithms. As shown, algorithms achieving R2 > 0.90 include support vector machines (SVM), extreme gradient boosting (XGBoost), Gaussian kernel regression (GKR), and artificial neural networks (ANN). In contrast, decision trees (DT) exhibited the lowest R2 value of 0.73. Consequently, the ANN demonstrated optimal regression performance with the minimal MAE and was therefore selected in this study to predict jet-cleaning performance.
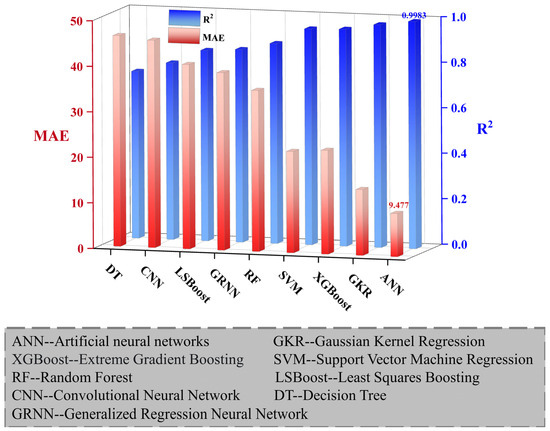
Figure 9.
The R2 and MAE values for predictions generated using the nine artificial intelligence algorithms.
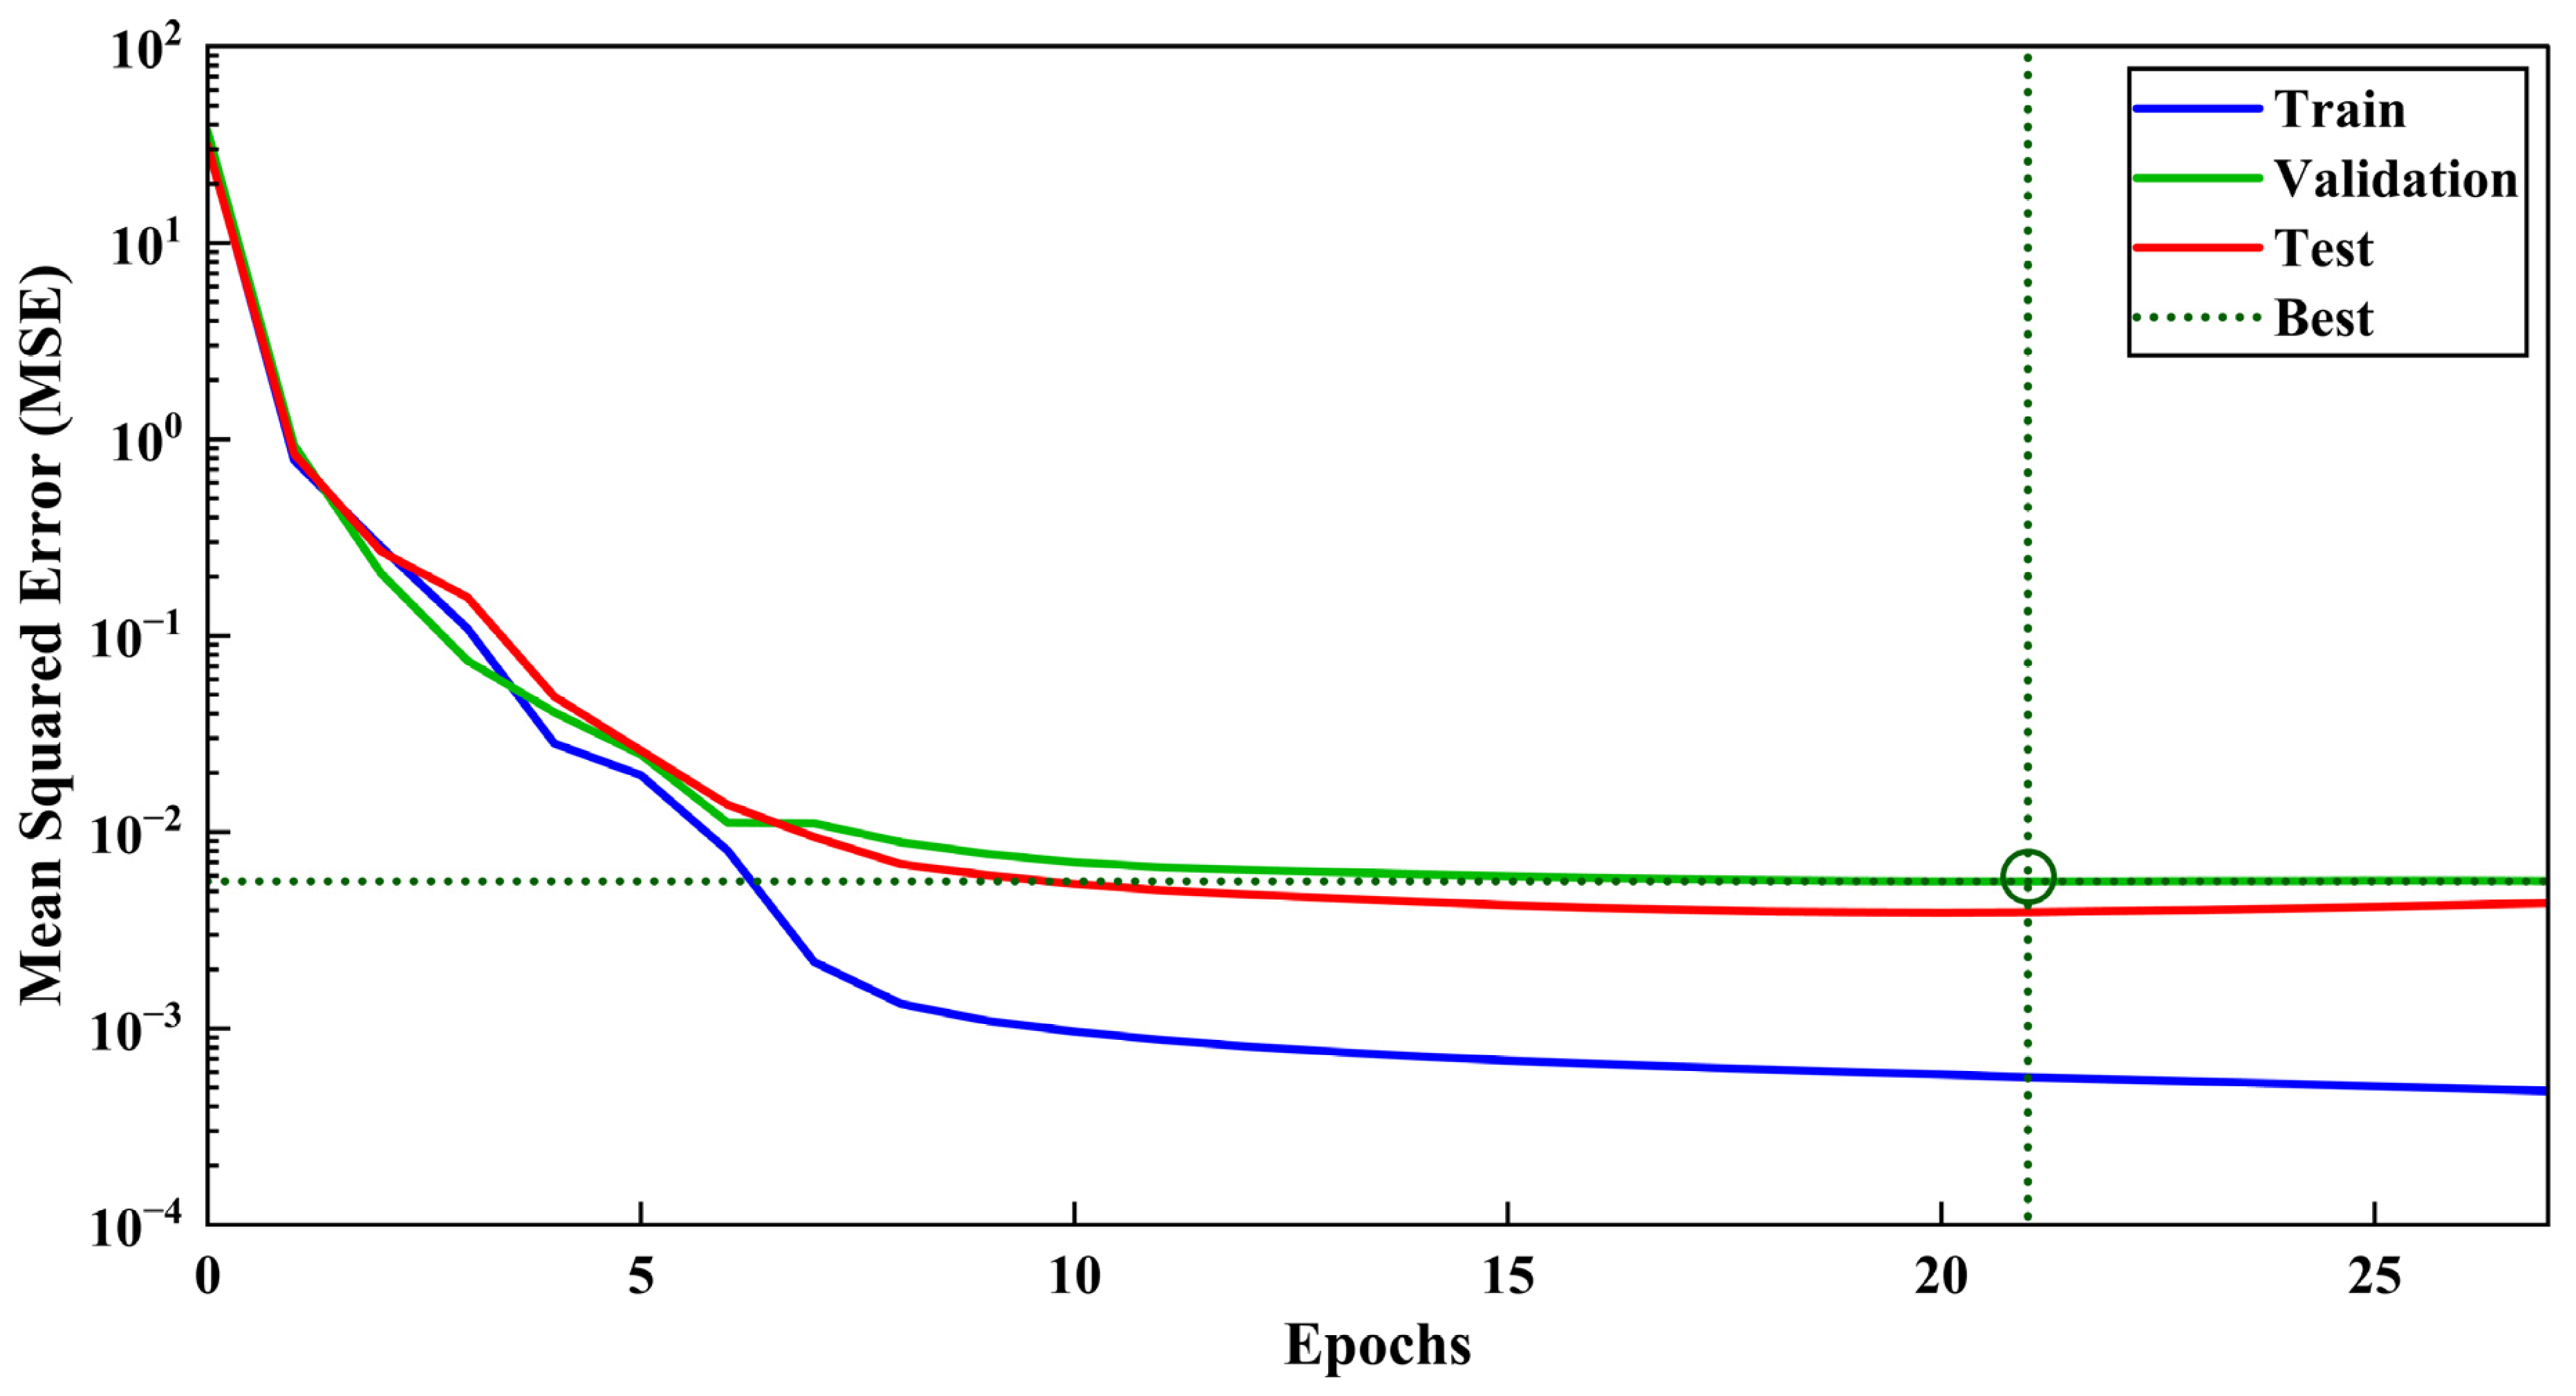
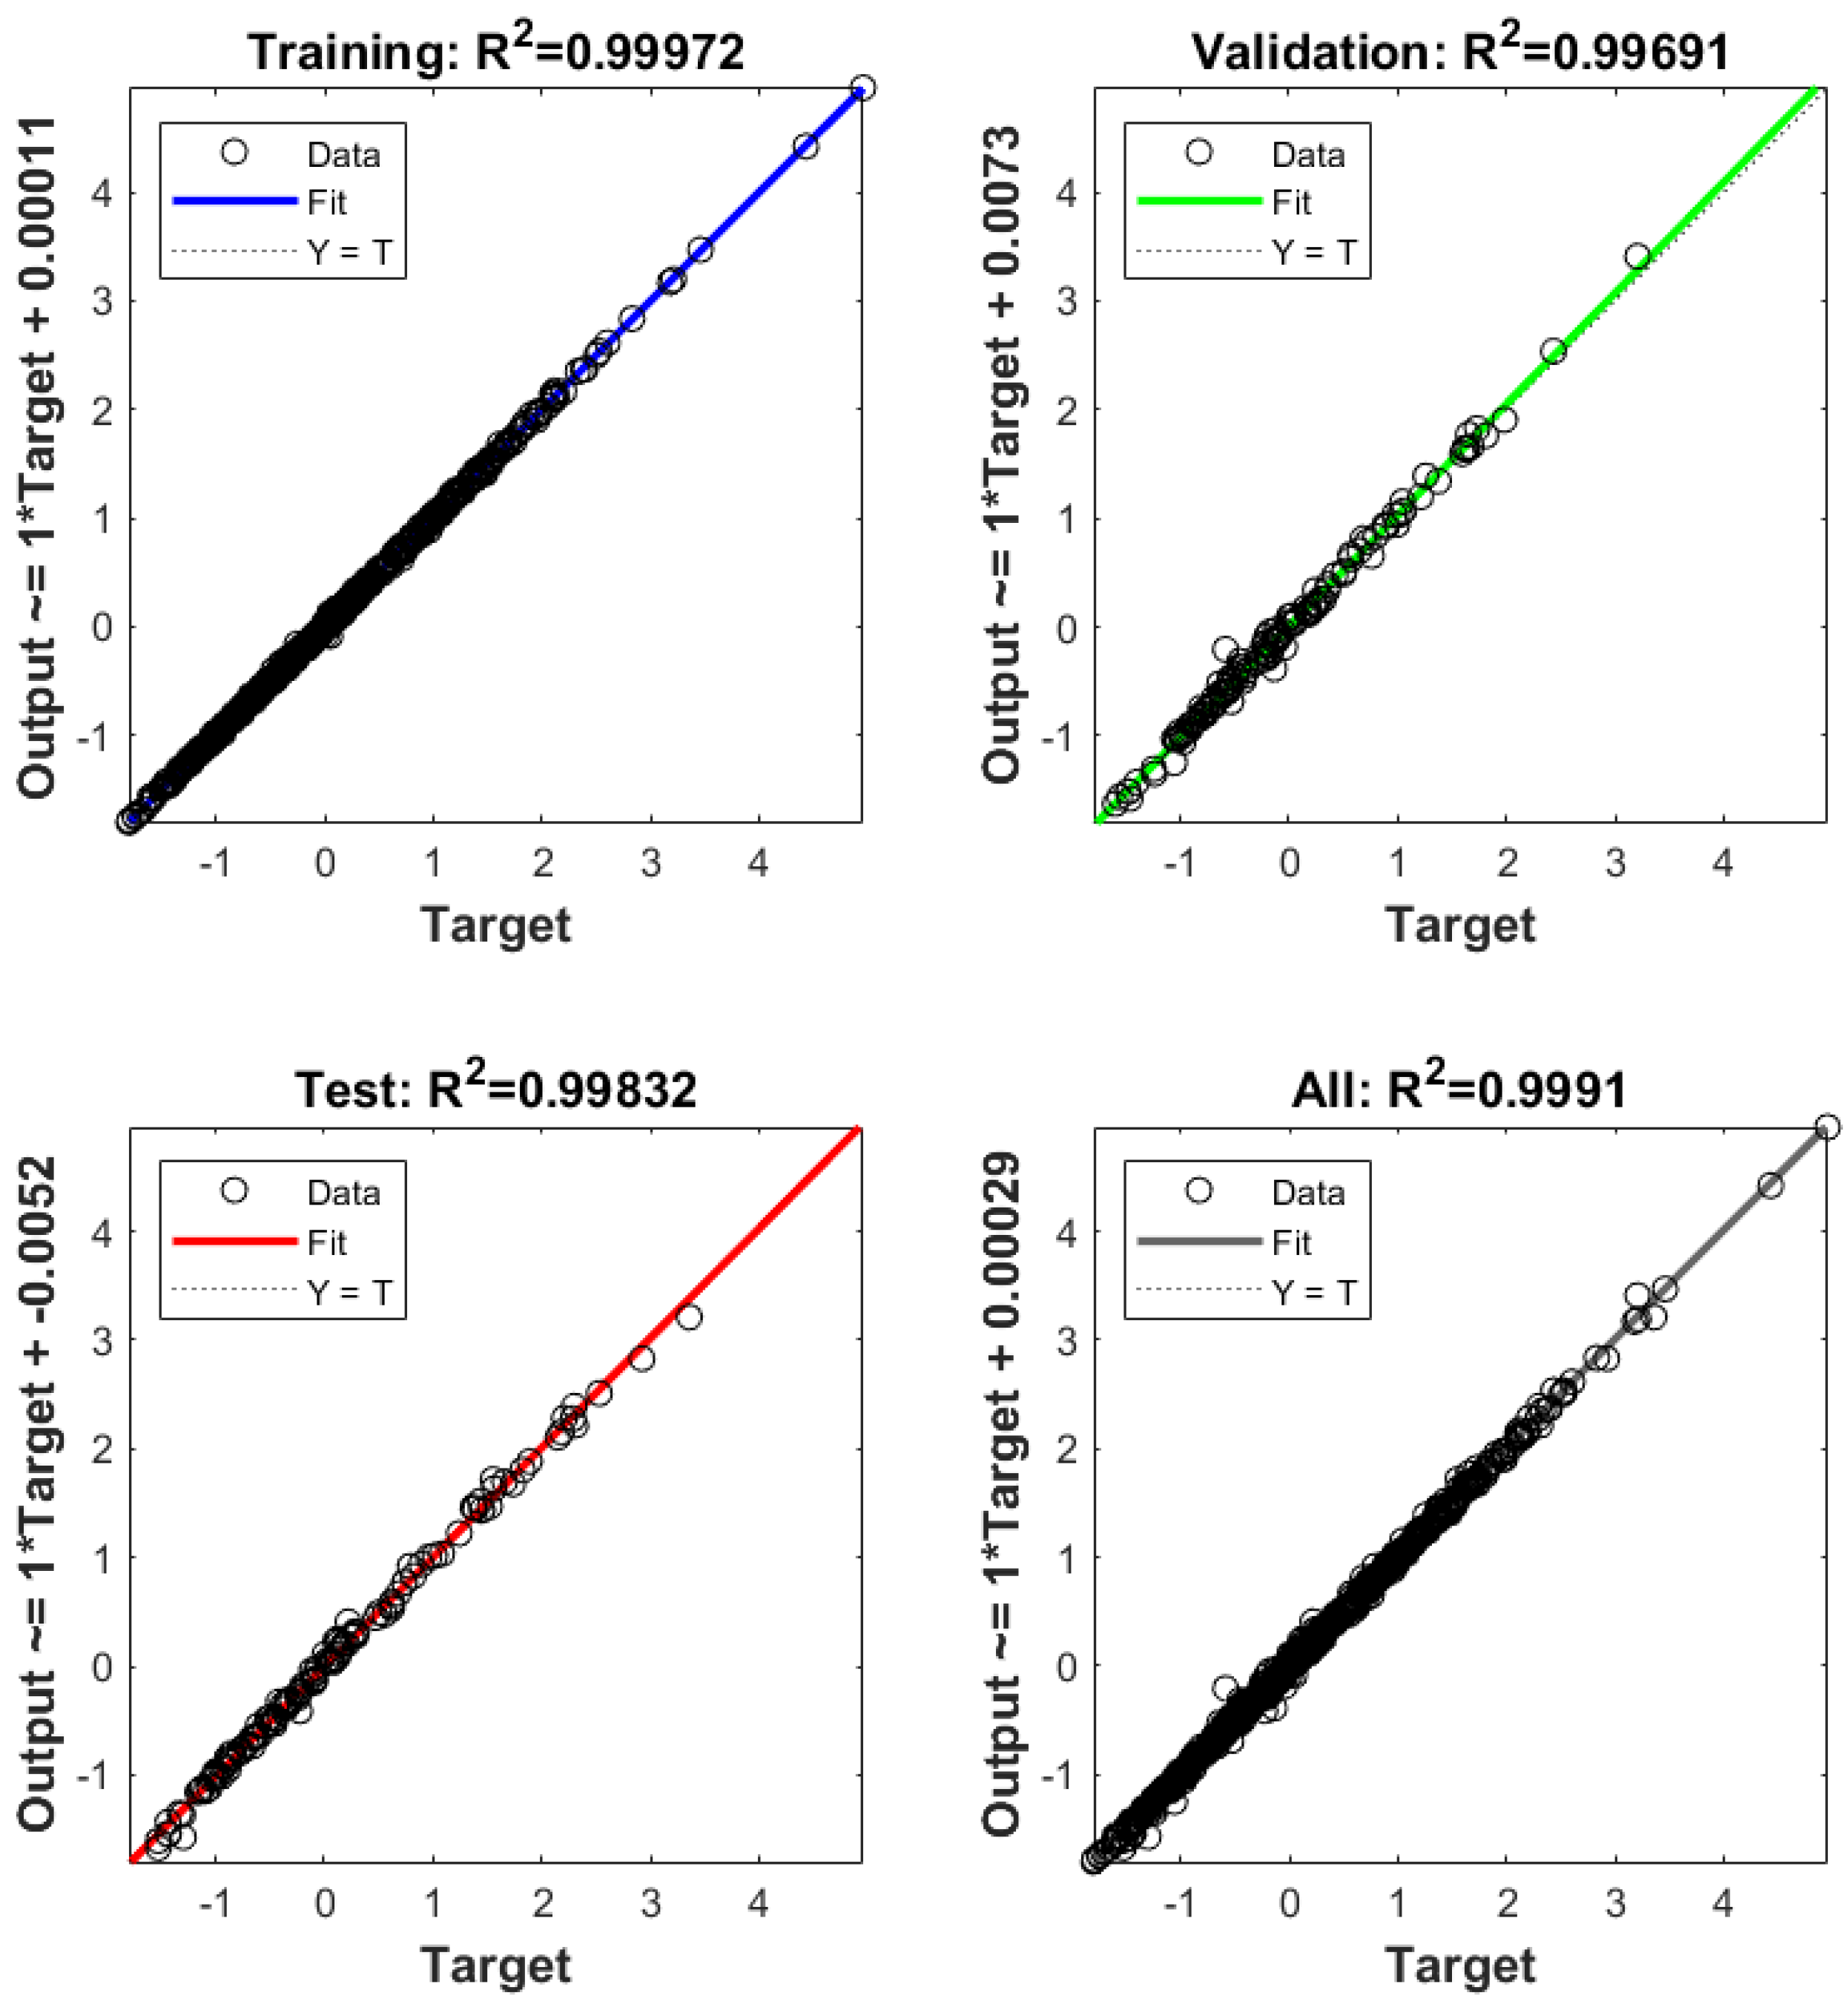
The iteration process of the artificial neural network ANN model after training is shown in Figure 10. In Figure 10, the vertical coordinate is the mean square error MSE, the horizontal coordinate is the number of iterations of the artificial neural network, the blue, green, and red curves represent the whole process of training, validation, and testing, respectively, and the green circle represents the point that satisfies the set condition after 21 iterations. As shown in Figure 11, the coefficient of determination R2 of the training set, validation set, test set, and all sets are 0.99972, 0.99691, 0.99832, and 0.9991, respectively, which are above 0.995, proving that the artificial neural network model can predict with high accuracy. This is consistent with Chen et al. [51], who demonstrated that neural networks can predict with high accuracy. Therefore, the artificial neural network model can replace the CFD numerical model, which is complicated and time-consuming in the calculation process, so as to predict the cleaning performance of aerated jets with different combinations of nozzles’ parameters relatively quickly and accurately.
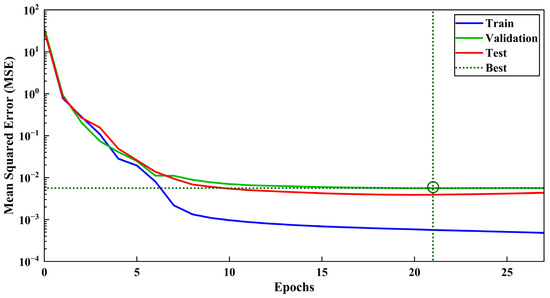
Figure 10.
The variation of the mean squared error (MSE) across 21 training epochs.

Figure 11.
The coefficient of determination (R2) values for the training set, validation set, test set, and all sets.
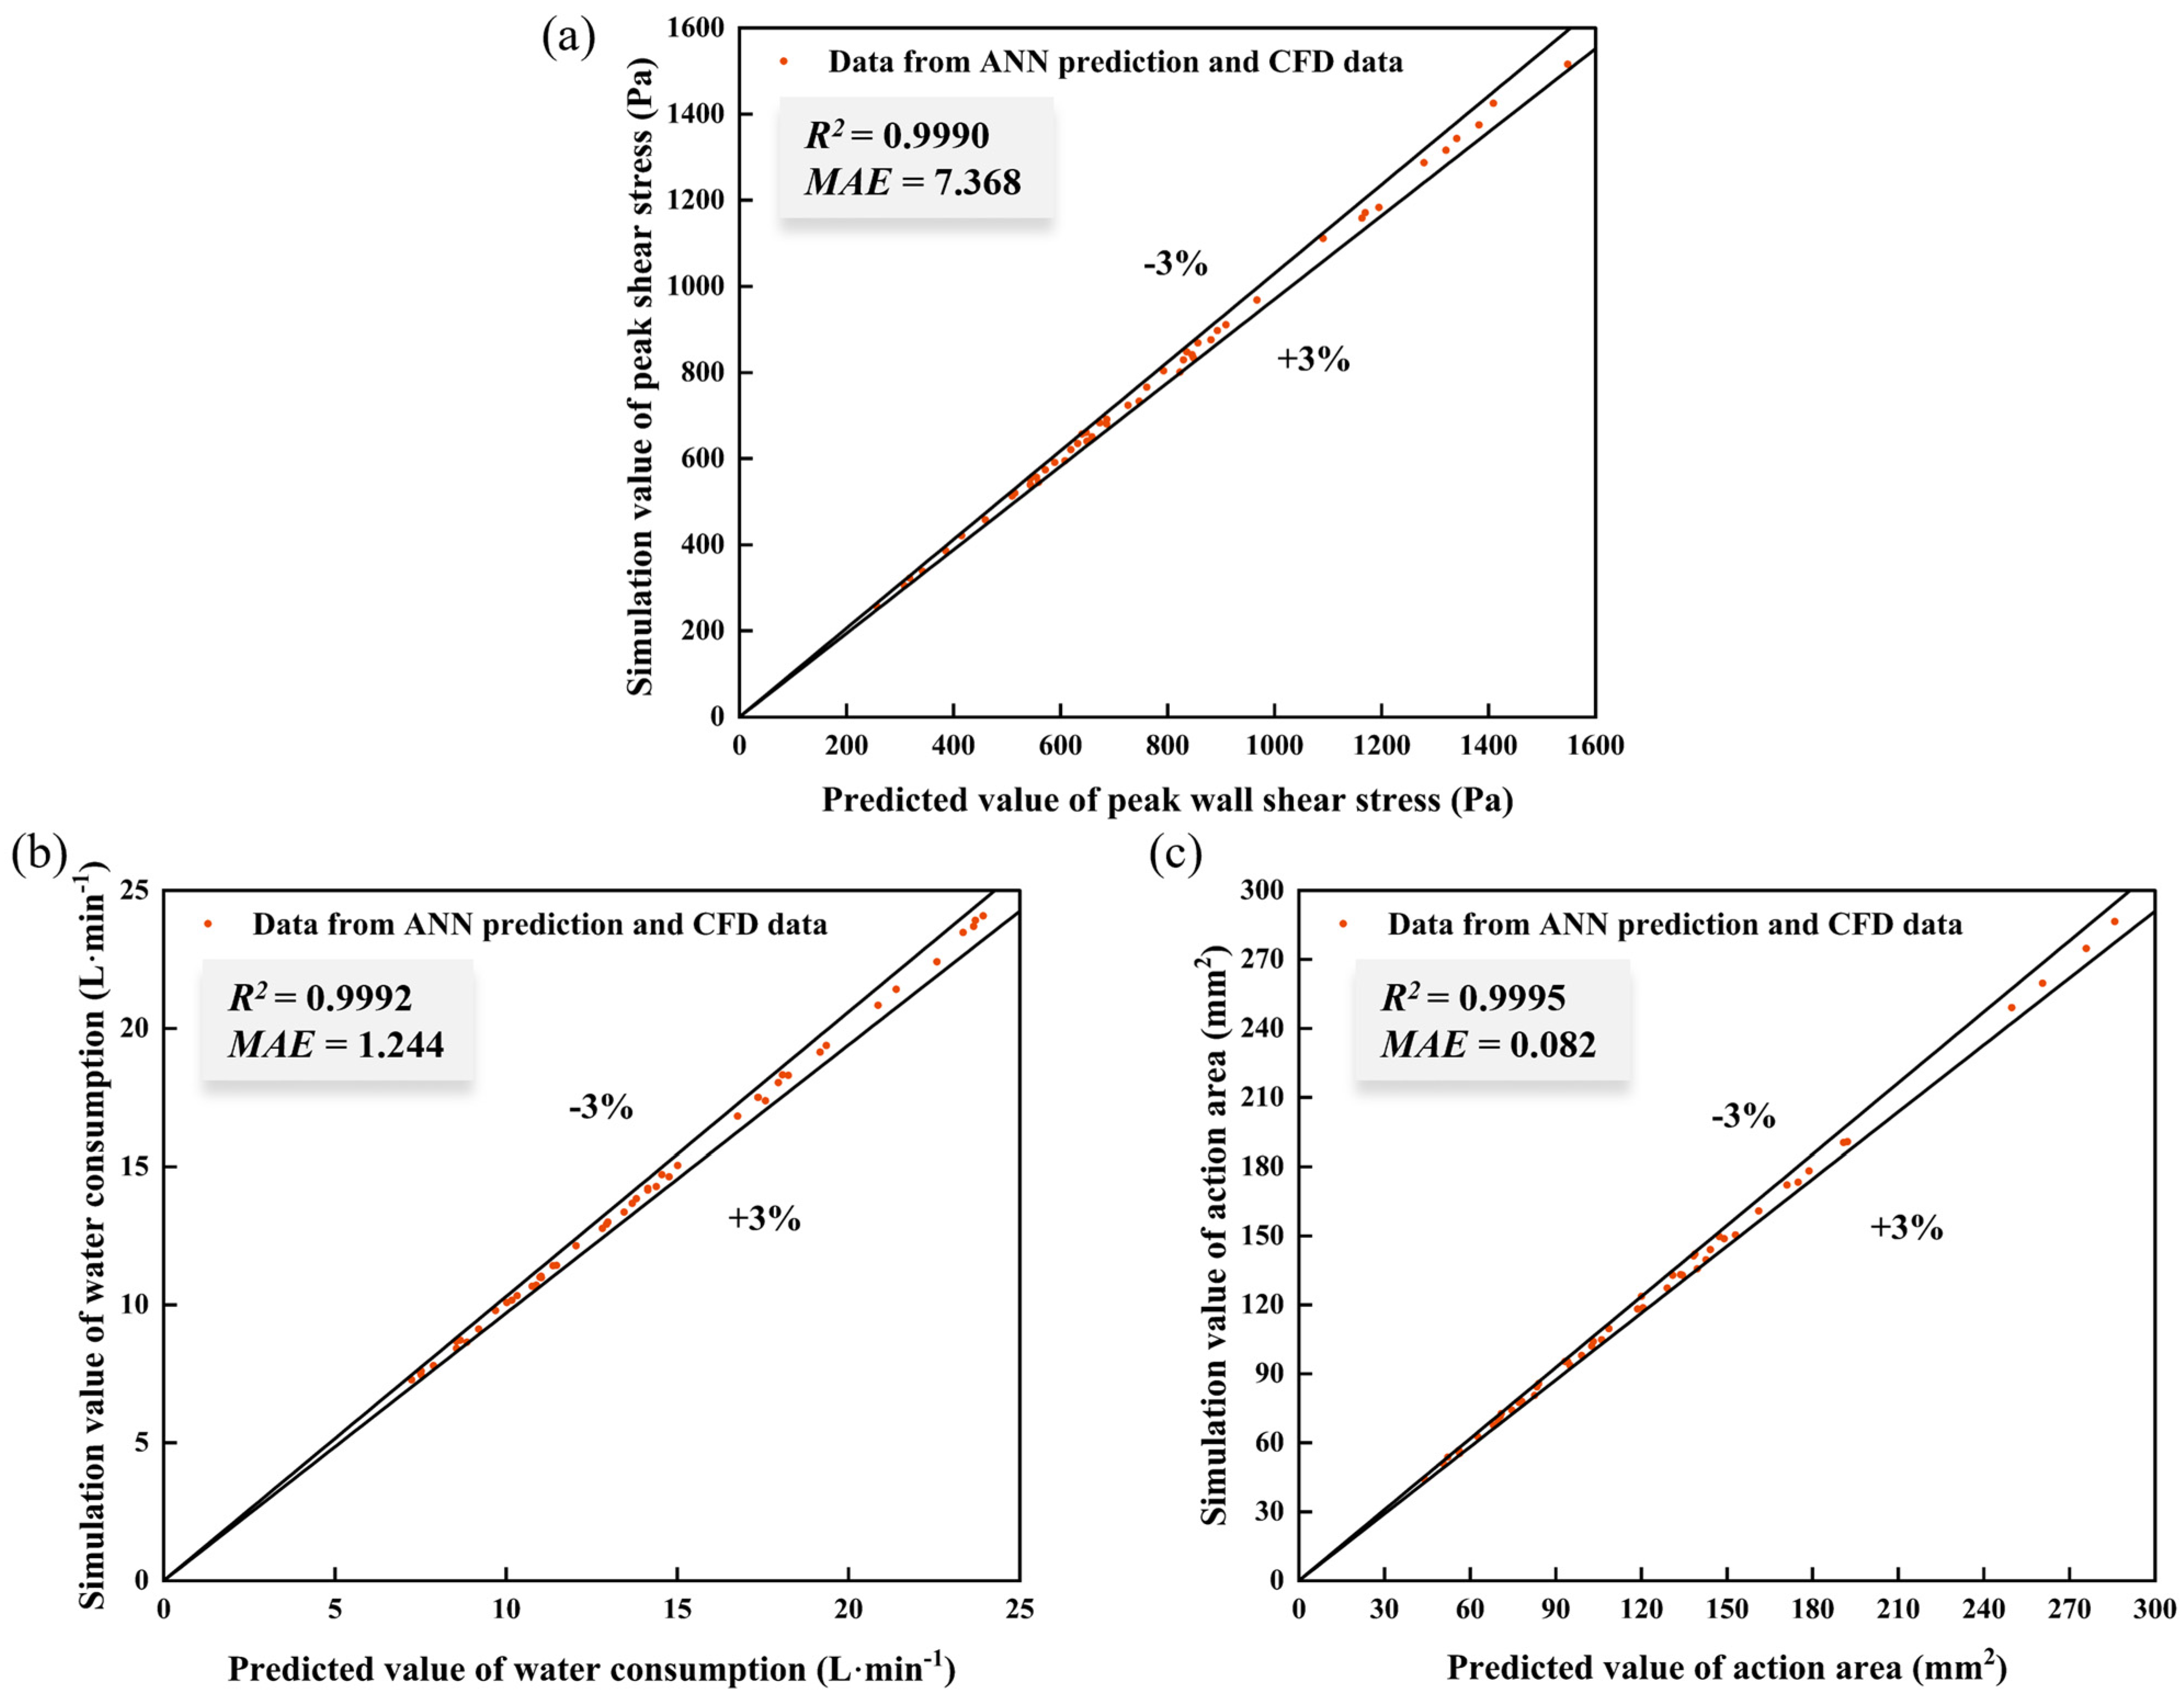
To verify the prediction ability of the artificial neural network ANN agent model on the performance indicators of aerated jet cleaning (peak wall shear stress, action area, and cleaning water consumption), this study selects a variety of parameter combinations of the aerated jet cleaning model to carry out the comparison between the artificial neural network ANN prediction and the CFD numerical simulation to validate the prediction. By systematically comparing the calculation results of the two methods, it is found that the evaluation index values of aerated jet cleaning obtained using the artificial neural network ANN agent model and CFD numerical simulation are in good agreement. Their relative errors are always lower than 3%, as shown in Figure 12, which proves that the model has a high degree of accuracy, validity, and generalization ability. The study confirms that the artificial neural network (ANN) agent model can not only accurately characterize the mapping relationship between the geometric parameters of the injector and the cleaning effect, but also has a significant computational efficiency advantage over traditional CFD numerical simulations. Based on this, the artificial neural network ANN agent model can be combined with genetic algorithms to provide a reliable basis for adaptation assessment for the optimization of the subsequent aerated jet cleaning model.
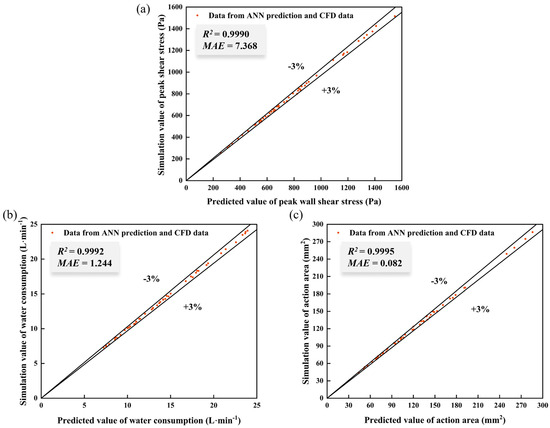
Figure 12.
Comparison of predicted data with CFD numerical simulation data.
3.4. Optimization Procedure Based on ANN with Genetic Algorithm (GA)
Figure 13 illustrates the Pareto front solutions derived from genetic algorithm (GA) optimization, revealing inherent trade-off relationships among the optimal solution sets. As evidenced in Figure 13, the mutually constrained variables demonstrate that increases in the peak wall shear stress and water consumption correlate with a reduction in the cleaning area.
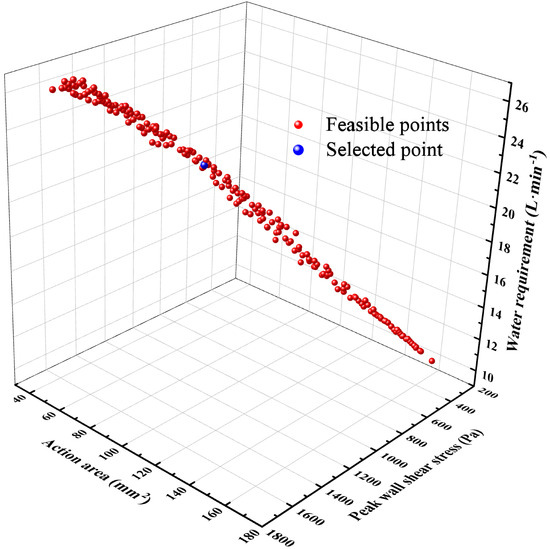
Figure 13.
Pareto optimal solution sets.
A subsequent analysis of the optimized solutions quantifies the discretization intervals for each design variable, as categorized in Figure 14. A parametric analysis revealed distinct optimal solution ratios across critical operational ranges [52]. The nozzle outlet widths range of 5.5–6.0 mm yielded the highest optimal solution ratio (98.5%), while configurations within 4.0–5.5 mm exhibited a markedly lower ratio (1.5%). For V-shaped grooving angles between 20.0° and 27.5°, the optimal solution ratio peaked at 37.5%, surpassing the 25% threshold observed in other angular intervals. Jet target distances of 17.5–20.0 mm achieved a 65% optimal solution ratio, whereas jet incidence angles of 5–10° demonstrated superior performance with 90% optimal solutions. Notably, incidence pressures within 0.35–0.4 MPa and a gas void fraction of 7.5–11.2% attained optimal solution ratios of 49.5% and 99.5%, respectively. Under these constrained boundaries, the objective functions—the peak wall shear stress (951.08 Pa), action area (70.14 mm2), and water consumption (20.80 L/min)—simultaneously reached their optima. The derived parameter combination included the following: d = 5.83 mm, α = 38.36°, s = 17.55 mm, θ = 8.68°, p = 0.29 MPa, and r = 8.91%.
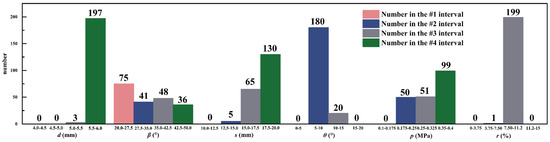
Figure 14.
Number of intervals for each variable.
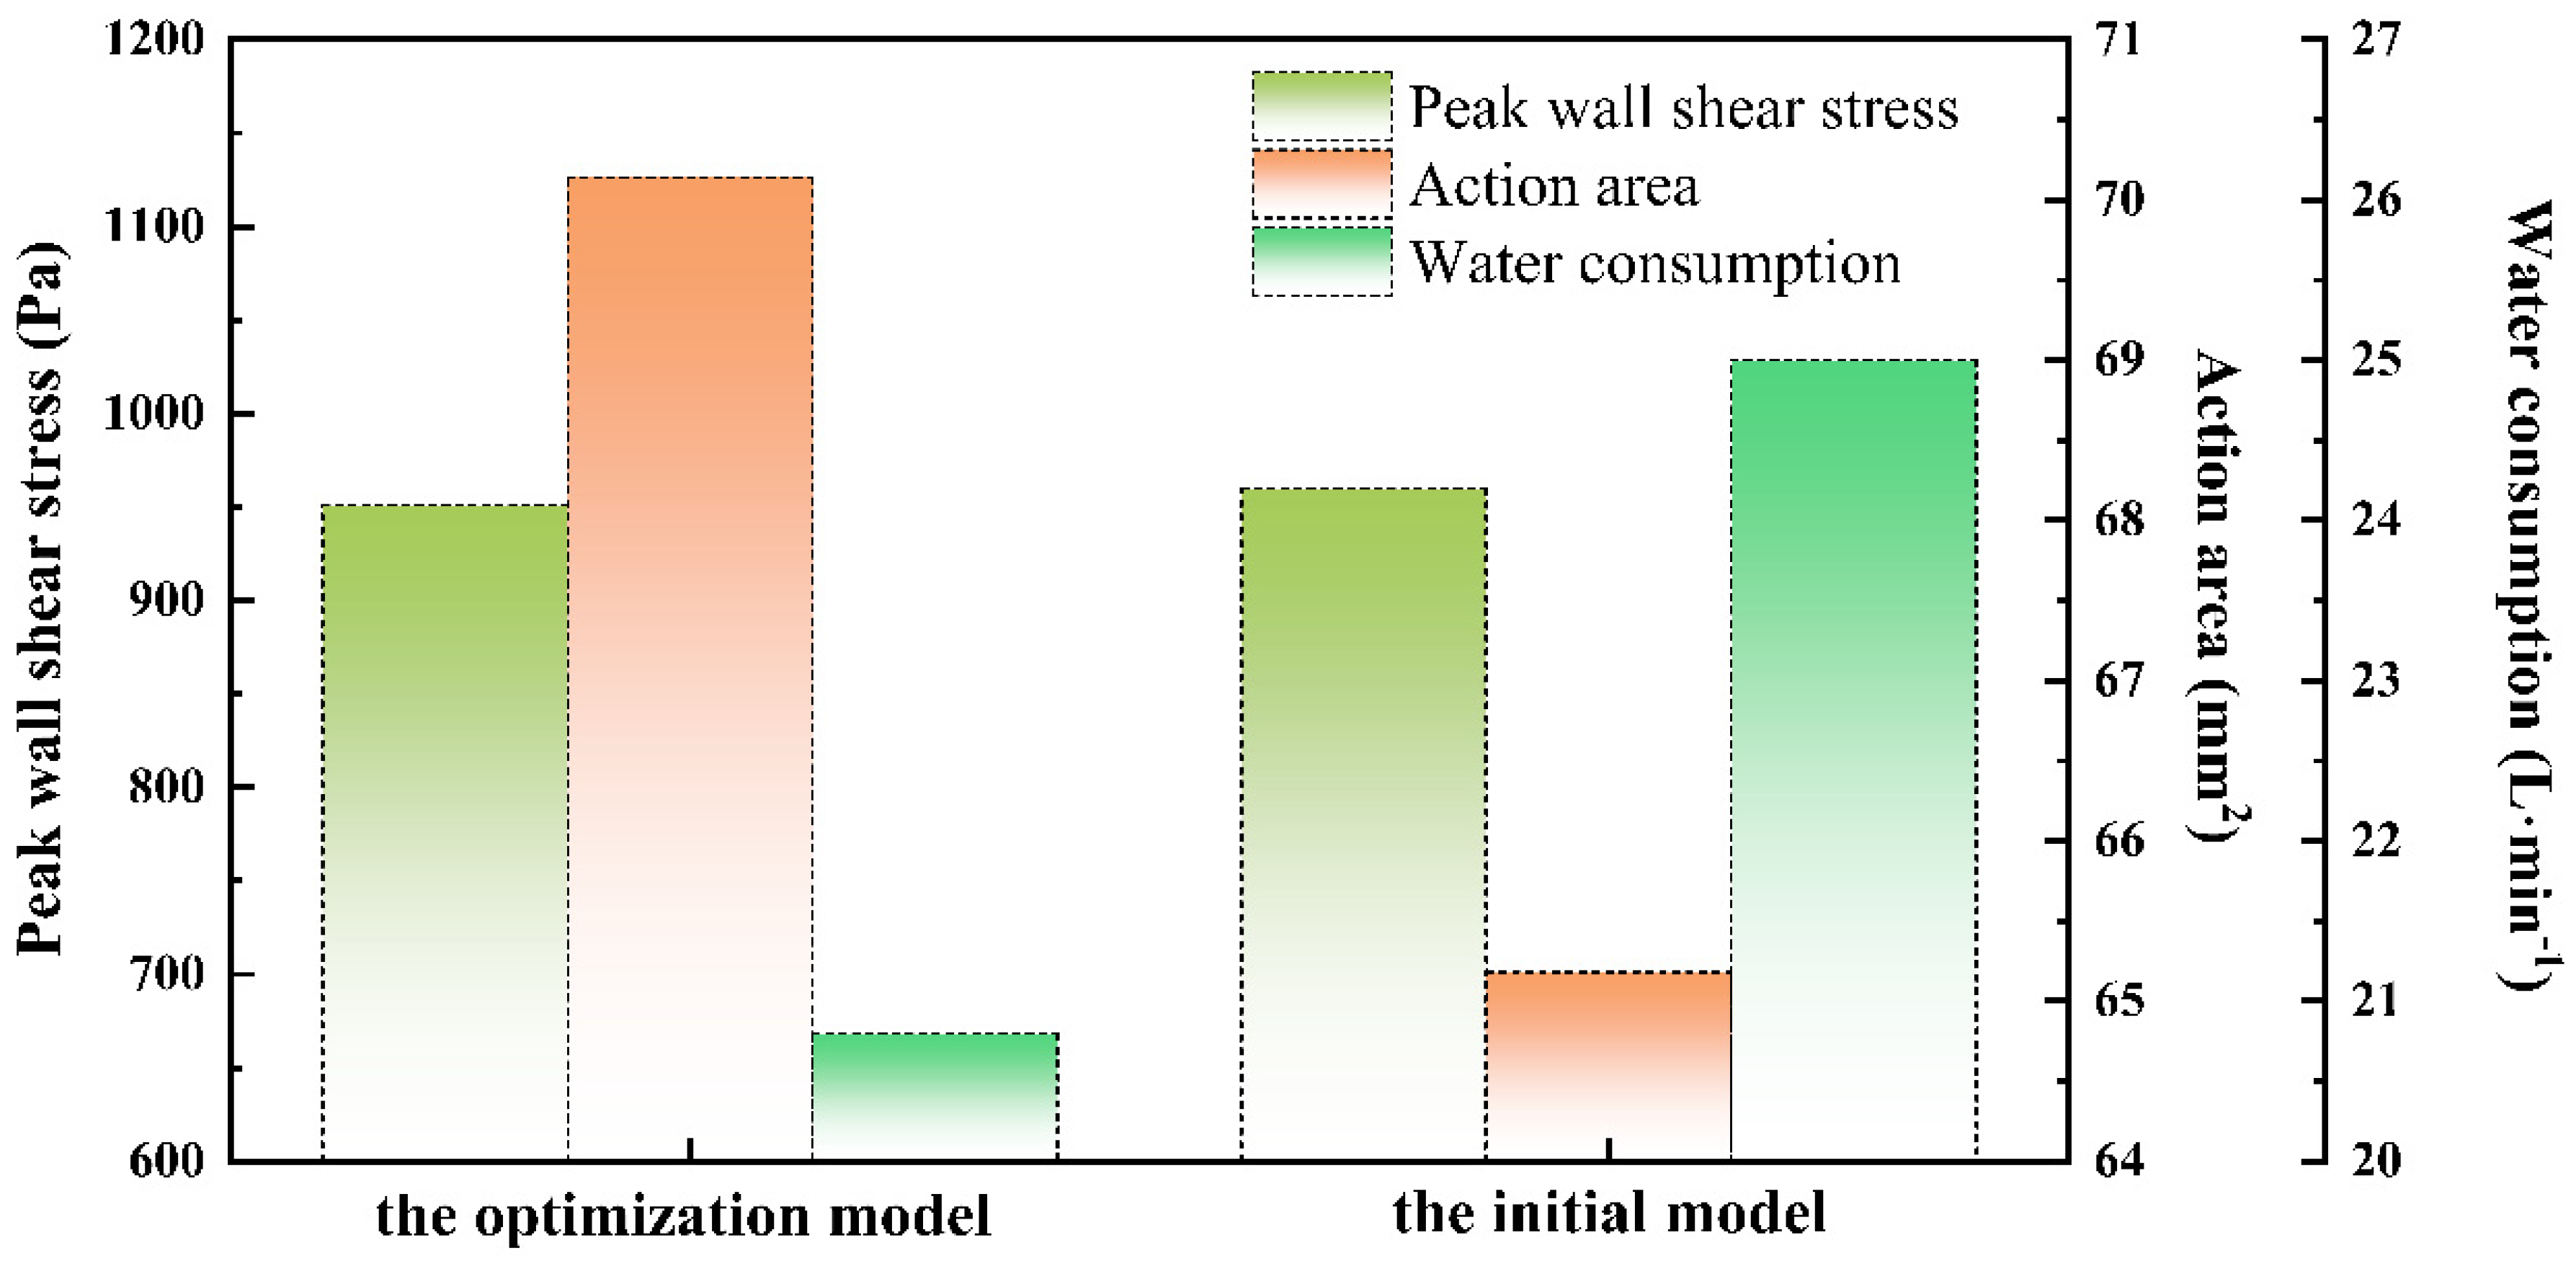
A comparative analysis between the optimized model and the baseline configuration was conducted [53] for three response metrics—the peak wall shear stress, action area, and water consumption—as illustrated in Figure 15. The optimized model demonstrated a reduction of 1.34% in the peak wall shear stress and 16.82% in water consumption relative to the baseline, whereas the cleaning area increased by 7.6%. This mutually dependent variation among the three metrics aligns with the trends observed in Figure 13. The optimization framework thus effectively enhances the jet-cleaning performance by simultaneously improving critical operational parameters.
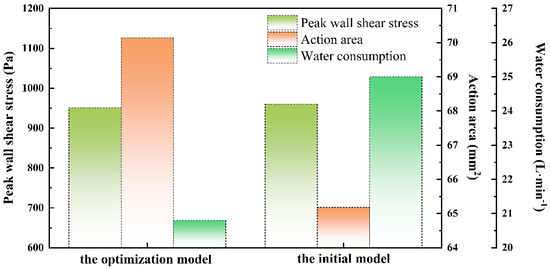
Figure 15.
Performance comparison of the optimization and the initial model.
The above optimization framework can quickly predict and optimize the jet-cleaning performance of the fan-type nozzle, and the cleaning performance after optimization has been improved to a certain extent, but due to the limitation of space, only the case of a single nozzle has been considered. In the subsequent process of improving and upgrading the jet-type self-cleaning screen filters, the optimization framework proposed in this paper can be applied to consider the structural optimization of multiple nozzles to broaden the application scope of this optimization framework.
4. Conclusions
This study presents an integrated computational framework combining 3D computational fluid dynamics (CFD), artificial neural networks (ANNs), and genetic algorithms (GAs) to optimize jet-cleaning performance. The main conclusions are as follows:
- (1)
- Among the main influencing parameters of the nozzle, the incident cross-section diameter d and V-groove half-angle β have the greatest influence on the peak wall shear stress, action area, and cleaning water consumption, with a total contribution rate of about 97.00%, 98.43%, and 98.01, which should be treated as key influencing parameters in the optimization.
- (2)
- The CFD numerical simulation model is verified to have an error of 5% or less, which meets the accuracy requirements and can be used to obtain the basic data for prediction and optimization instead of physical tests.
- (3)
- Among the nine commonly used AI algorithms tested, the artificial neural network ANN has the best prediction performance (R2 = 0.9991, MAE = 9.477). The prediction model results were within 3% error from the CFD simulation results, which has high prediction accuracy and can replace the CFD numerical simulation model for predicting the jet-cleaning performance over the full parameter range.
- (4)
- The optimization resulted in a 1.34% reduction in the peak wall shear stress, a 16.82% reduction in cleaning water consumption, and a 7.6% increase in the action area for the optimal model compared to the base model. It is investigated that the genetic algorithm GA optimization framework based on the artificial neural network ANN prediction model can achieve the prediction of jet cleaning performance.
The CFD-ANN-GA optimization framework has high accuracy and generalization capability and saves time in performance optimization. In the process of the subsequent improvement and upgrading of jet self-cleaning screen filters, the optimization framework proposed in this paper can be applied to consider the structural optimization of multiple nozzles in order to broaden the application scope of this optimization framework.
Author Contributions
Z.Q.: Data curation, Formal analysis, Investigation, Methodology, Software, Visualization, Writing—original draft. Z.C.: Conceptualization, Investigation, Methodology, Writing—original draft. R.C.: Conceptualization, Project administration, Resources, Supervision, Validation, Writing—review and editing. J.Z.: Conceptualization, Funding acquisition, Investigation, Methodology, Writing—review and editing. N.L.: Investigation, Writing—review and editing. M.L.: Writing—review and editing. All authors have read and agreed to the published version of the manuscript.
Funding
This research was funded by the Xinjiang Province Science and Technology Development Plan Projects, grant number 2024LQ04003; the Agricultural GG Project of the Xinjiang Production and Construction Corps (NYHXGG), grant number 2023AA30502; the Corps Technology Achievement Transformation Project, grant number 2023BA003; and the National Key Research and Development Program, grant number 2022YFD1900405.
Data Availability Statement
The raw data supporting the conclusions of this article will be made available by the authors upon request.
Acknowledgments
College of Water Conservancy & Architectural Engineering, Shihezi University.
Conflicts of Interest
The authors declare no conflicts of interest.
References
- Ma, Z.; Liu, J.; Zhang, J.; Yin, F.; Guo, L.; Wen, Y.; Song, L.; Zhu, Y.; Liang, Y.; Wang, Z. Ultra-wide film mulching with moderate irrigation water salinity enhances cotton growth under drip irrigation in Xinjiang, China. Field Crops Res. 2024, 315, 109485. [Google Scholar] [CrossRef]
- Xing, S.; Du, K.; Liu, N.; Li, M.; Li, W.; Zhang, J.; Yin, F.; Zhang, J.; Wang, Z. Effect of dynamic pressure and emitter type on irrigation and fertigation uniformity of drip irrigation systems. Agric. Water Manag. 2025, 312, 109418. [Google Scholar] [CrossRef]
- Liu, Z.; Long, Y.; Li, J.; Liu, D. Analysis of three-dimensional cake thickness structure characteristics in a screen filter for drip irrigation based on the CFD–DEM coupling method. Biosyst. Eng. 2025, 250, 1–14. [Google Scholar] [CrossRef]
- Barrero-Moreno, M.C.; Diaz-Vargas, C.A.; Restrepo-Parra, E. Computational Simulation of Filters Used in the Removal of Heavy Metals Using Rice Husks. Agriculture 2021, 11, 146. [Google Scholar] [CrossRef]
- Liu, Z.; Muhammad, T.; Puig-Bargués, J.; Han, S.; Ma, Y.; Li, Y. Horizontal roughing filter for reducing emitter composite clogging in drip irrigation systems using high sediment water. Agric. Water Manag. 2021, 258, 107215. [Google Scholar] [CrossRef]
- Zong, Q.; Zheng, T.; Liu, H.; Li, C. Development of head loss equations for self-cleaning screen filters in drip irrigation systems using dimensional analysis. Biosyst. Eng. 2015, 133, 116–127. [Google Scholar] [CrossRef]
- Duran-Ros, M.; Pujol, J.; Pujol, T.; Cufí, S.; Arbat, G.; Ramírez de Cartagena, F.; Puig-Bargués, J. Solid Removal across the Bed Depth in Media Filters for Drip Irrigation Systems. Agriculture 2023, 13, 458. [Google Scholar] [CrossRef]
- Wang, S.; Wang, H.; Qiu, X.; Wang, J.; Wang, S.; Wang, H.; Shen, T. Study on the Performance of Filters Under Biogas Slurry Drip Irrigation Systems. Agriculture 2024, 15, 30. [Google Scholar] [CrossRef]
- Liu, J.; Ouyang, Y.; Wang, Q. Design and research on the new type self-cleaning filters with scraper. Mach. Tool Hydraul. 2013, 41, 26–28. [Google Scholar]
- Du, S.; Han, Q.; Lan, J.; Guo, Z.; Li, H.; Huang, X. Experimental Study on Hydraulic Performance of the Hand-operated Cleaning Screen Filter. J. Irrig. Drain. 2021, 40, 66–72. [Google Scholar] [CrossRef]
- Taleghani, A.S.; Hesabi, A.; Esfahanian, V. Numerical Study of Flow Control to Increase Vertical Tail Effectiveness of an Aircraft by Tangential Blowing. Int. J. Aeronaut. Space Sci. 2024, 26, 785–799. [Google Scholar] [CrossRef]
- Abdolahipour, S. Review on flow separation control: Effects of excitation frequency and momentum coefficient. Front. Mech. Eng. 2024, 10, 1380675. [Google Scholar] [CrossRef]
- Abdolahipour, S. Effects of low and high frequency actuation on aerodynamic performance of a supercritical airfoil. Front. Mech. Eng. 2023, 9, 1290074. [Google Scholar] [CrossRef]
- Abdolahipour, S.; Mani, M.; Shams Taleghani, A. Parametric study of a frequency-modulated pulse jet by measurements of flow characteristics. Phys. Scr. 2021, 96, 125012. [Google Scholar] [CrossRef]
- Park, S.; Kainuma, S.; Yang, M.; Kim, A.; Ikeda, T.; Toyota, Y.; Arakawa, T. Advancements in abrasive water-jet treatment for efficient surface cleaning and comprehensive corrosion removal in steel structures. J. Build. Eng. 2024, 84, 108623. [Google Scholar] [CrossRef]
- Cano-Salinas, L.; Sourd, X.; Moussaoui, K.; Le Roux, S.; Salem, M.; Hor, A.; Zitoune, R. Effect of process parameters of Plain Water Jet on the cleaning quality, surface and material integrity of Inconel 718 milled by Abrasive Water Jet. Tribol. Int. 2023, 178, 108094. [Google Scholar] [CrossRef]
- Li, S.; Ye, H.; Wang, Z.; Liu, N. Study on cleaning elfeet and damage of jet cleaning on filter screen of micro-irrigation filter. J. Drain. Irrig. Mach. Eng. 2024, 24, 102–108. [Google Scholar]
- Qin, Z.; Liu, N.; Zhang, J.; Wang, Z.; Liang, W.; Li, M.; Zhang, J. Development and performance evaluation of novel jet self-cleaning for screen filters in drip irrigation systems: More efficient, water-saving, and cleaner. Agric. Water Manag. 2025, 312, 109424. [Google Scholar] [CrossRef]
- Sun, S.; Hai, Y.; Wu, J.; Hu, B.; Luo, X.; Ma, Z. Jet impact self-cleaning: Research on impurity filtration and collection method before irrigation system pump. J. Water Process Eng. 2025, 72, 107587. [Google Scholar] [CrossRef]
- Qian, Y.; Chean, H.; Dai, H.; Liu, T.; Kuang, t.; Bian, L. Experimental study of the nozzle settings on blow tube in a pulse-jet cartridge filter. Sep. Purif. Technol. 2018, 191, 224–249. [Google Scholar] [CrossRef]
- Zhang, Q.; Liu, D.; Chen, H.; Wang, M.; Liang, C.; WU, X.; Li, W. Effect of nozzle type on pulse-jet cleaning performance of ceramic filter tube. Adv. Powder Technol. 2023, 34, 104180. [Google Scholar] [CrossRef]
- Careddu, N.; Akkoyun, O. An investigation on the efficiency of water-jet technology for graffiti cleaning. J. Cult. Herit. 2016, 19, 426–434. [Google Scholar] [CrossRef]
- Wang, T.; Davidson, J.F.; Wilson, D.I. Flow patterns and cleaning behaviour of horizontal liquid jets impinging on angled walls. Food Bioprod. Process. 2015, 93, 333–342. [Google Scholar] [CrossRef]
- Kim, W.-J.; Karuppuchamy, V.; Heldman, D.R. Evaluation of maximum wall shear stress from air impingement to remove food deposits from stainless steel surfaces. J. Food Eng. 2022, 316, 110825. [Google Scholar] [CrossRef]
- Andersen, B.O.; Nielsen, N.F.; Walther, J.H. Numerical and experimental study of pulse-jet cleaning in fabric filters. Powder Technol. 2016, 291, 284–298. [Google Scholar] [CrossRef]
- Chen, L.; Sun, W.; Qian, F.; Fang, C.; Zheng, Z.; Zhuang, Q.; Han, Y.; Lu, J. An Experimental and Numerical Study on the Cleaning of Pleated Bag Filters Using Low-Pressure Pulsed-Jets. Fluid Dyn. Mater. Process. 2022, 18, 41–56. [Google Scholar] [CrossRef]
- Fernandes, R.R.; Tsai, J.H.; Wilson, D.I. Comparison of models for predicting cleaning of viscoplastic soil layers by impinging coherent turbulent water jets. Chem. Eng. Sci. 2022, 248, 117060. [Google Scholar] [CrossRef]
- Kawale, S.; Chandramohan, V.P. CFD simulation of estimating critical shear stress for cleaning flat soiled surface. Sādhanā 2017, 42, 2137–2145. [Google Scholar] [CrossRef]
- Huang, L.-Y.; Chen, Z.S. Effect of technological parameters on hydrodynamic performance of ultra-high-pressure water-jet nozzle. Appl. Ocean Res. 2022, 129, 103410. [Google Scholar] [CrossRef]
- Carvalho, A.R.d.; Pita, R.P.; Oliveira, T.M.d.; Silva, G.J.B.; Mendes, J.C. Exploratory literature review and scientometric analysis of artificial intelligence applied to geopolymeric materials. Eng. Appl. Artif. Intell. 2025, 145, 110210. [Google Scholar] [CrossRef]
- Dawkins, M.S. Smart farming and Artificial Intelligence (AI): How can we ensure that animal welfare is a priority? Appl. Anim. Behav. Sci. 2025, 283, 106519. [Google Scholar] [CrossRef]
- Saad Alotaibi, B.; Ibrahim Shema, A.; Umar Ibrahim, A.; Awad Abuhussain, M.; Abdulmalik, H.; Aminu Dodo, Y.; Atakara, C. Assimilation of 3D printing, Artificial Intelligence (AI) and Internet of Things (IoT) for the construction of eco-friendly intelligent homes: An explorative review. Heliyon 2024, 10, e36846. [Google Scholar] [CrossRef]
- Xu, A.; Han, L.; Fu, J.; Huangfu, S.; Zhao, R. The tiered competition genetic algorithm and its application in the wind-resistant optimization of a cable-stayed mast structure. Eng. Struct. 2025, 327, 119592. [Google Scholar] [CrossRef]
- Cui, Y.; Ye, L.; Yao, Z.; Gu, X.; Wang, X. Performance optimization of cement calciner based on CFD simulation and machine learning algorithm. Energy 2024, 302, 131926. [Google Scholar] [CrossRef]
- Zhu, B.; Zhu, X.; Zhao, W.; Cao, L. Design and simulation of gas-liquid two-phase jet cleaning device. Fluid Mach. 2021, 49, 36–42. [Google Scholar] [CrossRef]
- TU, Y.; Fan, C.; Qian, Y.; Wang, X. Structure optimization of central-body in dual cavitating jet andthe behavior of coal breaking under its impact. J. China Coal Soc. 2022, 47, 3250–3259. [Google Scholar]
- Guha, A.; Barron, R.M.; Balachandar, R. An experimental and numerical study of water jet cleaning process. J. Mater. Process. Technol. 2011, 211, 610–618. [Google Scholar] [CrossRef]
- Hsu, C.-Y.; Liang, C.-C.; Teng, T.-L.; Nguyen, A.-T. A numerical study on high-speed water jet impact. Ocean Eng. 2013, 72, 98–106. [Google Scholar] [CrossRef]
- Li, J.; Wang, P.; Wu, D.; Chen, D.-R. Numerical study of opposing pulsed-jet cleaning for pleated filter cartridges. Sep. Purif. Technol. 2020, 234, 116086. [Google Scholar] [CrossRef]
- Eryoldaş, Y.; Durmuşoğlu, A. An efficient parameter tuning method based on the Latin Hypercube Hammersley Sampling and fuzzy C-Means clustering methods. J. King Saud Univ. Comput. Inf. Sci. 2022, 34, 8307–8322. [Google Scholar] [CrossRef]
- Liu, D.; Wang, S.; Shi, J.; Liu, D. Sequential search-based Latin hypercube sampling scheme for digital twin uncertainty quantification with application in EHA. Chin. J. Aeronaut. 2024, 38, 103310. [Google Scholar] [CrossRef]
- Wang, J.-X.; Jin, C.-T.; Gao, S. Anti-collapse on the fragility and sensitivity analysis of composite frame with CFST columns based on the improved Latin hypercube sampling. Structures 2024, 63, 106402. [Google Scholar] [CrossRef]
- Han, X.; Zhao, X.; Qu, Z.; Wu, Y.; Li, G. LS-SVM-based nonlinear multi-physical steady-state field coupled problems computing method. Appl. Math. Model. 2025, 142, 115987. [Google Scholar] [CrossRef]
- Weerakoon, A.H.S.; Assadi, M. Artificial Neural Network (ANN) driven Techno-Economic Predictions for Micro Gas Turbines (MGT) based Energy Applications. Energy AI 2025, 20, 100483. [Google Scholar] [CrossRef]
- Jeon, H.S.; Yeon, S.H.; Park, J.K.; Kim, M.H.; Yoon, Y.; Kim, C.H.; Lee, K.H. ANN based solar thermal energy forecasting model and its heating energy saving effect through thermal storage. Appl. Therm. Eng. 2025, 267, 125740. [Google Scholar] [CrossRef]
- Wei, Y.; Lu, M.; Yu, Q.; Li, W.; Wang, C.; Tang, H.; Wu, W. The normalized difference yellow vegetation index (NDYVI): A new index for crop identification by using GaoFen-6 WFV data. Comput. Electron. Agric. 2024, 226, 109417. [Google Scholar] [CrossRef]
- Zhang, X.; Dong, Z.; Hao, P.; Li, Y. Design of flat fan nozzles and its experimental study. Mach. Des. Res. 2008, 24, 89–92. [Google Scholar]
- Ren, Y.; Li, Q.; Guo, Y.; Pedrycz, W.; Xing, L.; Liu, A.; Song, Y. A distance similarity-based genetic optimization algorithm for satellite ground network planning considering feeding mode. Expert Syst. Appl. 2025, 268, 126303. [Google Scholar] [CrossRef]
- Xie, Y.; Ren, J.; Huang, H. Grid independence analysis of computational fluid dynamics based on Chisquare test. Sci. Technol. Eng. 2020, 20, 123–127. [Google Scholar]
- Liu, W.; Zhou, X.; Li, Q. Effect of fan-shaped nozzle structure optimization on jet impact force based on response surface analysis. Sci. Technol. Eng. 2025, 25, 1467–1474. [Google Scholar]
- Chen, Y.-J.; Chen, Z.-S. A prediction model of wall shear stress for ultra-high-pressure water-jet nozzle based on hybrid BP neural network. Eng. Appl. Comput. Fluid Mech. 2022, 16, 1902–1920. [Google Scholar] [CrossRef]
- Singh, V.K.; Kumar, D.; Tripathi, R.J. Multi objective optimization of novel phase change material-based desalination system using genetic algorithms. J. Energy Storage 2024, 103, 114388. [Google Scholar] [CrossRef]
- Liu, F.; Chen, Y.; Qin, W.; Li, J. Optimal design of liquid cooling structure with bionic leaf vein branch channel for power battery. Appl. Therm. Eng. 2023, 218, 119283. [Google Scholar] [CrossRef]


Disclaimer/Publisher’s Note: The statements, opinions and data contained in all publications are solely those of the individual author(s) and contributor(s) and not of MDPI and/or the editor(s). MDPI and/or the editor(s) disclaim responsibility for any injury to people or property resulting from any ideas, methods, instructions or products referred to in the content. |
© 2025 by the authors. Licensee MDPI, Basel, Switzerland. This article is an open access article distributed under the terms and conditions of the Creative Commons Attribution (CC BY) license (https://creativecommons.org/licenses/by/4.0/).