Article

Carbon Dioxide Capture by Alkaline Water with a Semi-Batch Column and Ultra-Fine Microbubble Generator

1
Department of Chemical Engineering, College of Engineering, University of Nizwa, P.O. Box 33, Nizwa PC 616, Oman
2
Department of Biological Sciences & Chemistry, College of Arts & Sciences, University of Nizwa, P.O. Box 33, Nizwa PC 616, Oman
3
Department of Chemical Engineering, College of Engineering, King Khalid University, Abha 62223, Saudi Arabia
4
Department of Chemical and Process Engineering, Faculty of Engineering & Built Environment, Universiti Kebangsaan Malaysia, Bangi 43600, Selangor, Malaysia
5
Oman Water and Wastewater Services Company, P.O. Box 1047, Nizwa 113, Oman
6
Department of Civil and Environmental Engineering, College of Engineering and Architecture, University of Nizwa, Birkat Al Mouz, P.O. Box 33, Nizwa PC 616, Oman
*
Authors to whom correspondence should be addressed.
Processes 2025, 13(4), 1259; https://doi.org/10.3390/pr13041259
Submission received: 5 March 2025 / Revised: 6 April 2025 / Accepted: 16 April 2025 / Published: 21 April 2025

Abstract

:
Increased emissions of carbon dioxide (CO2) from industrial activities are the main cause of the growing problem of global warming and climate change, highlighting the needs for efficient CO2 capture and storage (CCS) techniques. The present work aims to investigate the possibility of CO2 sequestration using sodium hydroxide (NaOH) in a semi-batch column with an integrated gas lift tower and an ultra-micro bubbles generator, a novel setup designed to enhance mass transfer rates and capture efficiency. Unlike the previously reported setups, our system achieves a 50% faster capture rate with improved mass transfer, enhanced gas-liquid interaction and higher removal efficiency due to finer bubble dispersion, as confirmed by experimental findings. Preliminary tests to ascertain the effectiveness of CO2 removal were carried out across various CO2 gas flow rates (3, 5, 7 L/min), NaOH volumes (2, 3, 4 L) and concentrations (0.1, 0.2, 0.3 M). The results indicated that both gas flow rate and NaOH concentration have profound impacts on the CO2 capture rate. Increasing either of these parameters, or using low concentrations of NaOH, leads to a rapid drop in pH due to a faster rate of neutralization and the formation of carbonic acid (H2CO3), a weak acidic solution. For instance, with 0.1 M NaOH and 2 L volume, the pH decreased from 13.07 to 7.02 within 1.5 min at gas flow rate of 7 L/min, while with 0.3 M NaOH, pH reduced to 7.3 after 6 min. Higher volumes and concentrations of NaOH caused a decrease in the capture rate of CO2 due to reversed reaction with formed sodium carbonate. For instance, with 0.3 M NaOH and 4 L volume, the pH reduced from 13.58 to 8 after 5 min at 7 L/min gas flow rate. Scaling up to a 100 L semi-batch column with an ultra-fine micro bubble generator, as a new approach, reduced the time taken by half in the capture of CO2. Additionally, the study also investigated the comparison of tap versus deionized water in CO2 capture reaction. The results demonstrated that dissolved minerals in tap water, particularly Ca2+ and Mg2+ ions, affected precipitate formation and capture efficiency differently than deionized water, offering practical insights for CCS in varied water sources.

1. Introduction

Global warming and climate change are largely caused by carbon dioxide (CO2) emissions. The rapid industrial development has led to excessive emissions of carbon dioxide (CO2) gas into the atmosphere, thus becoming a major environmental concern. According to Cheng et al., 2019 [1], about 40% of the CO2 emissions from human activity in 2015 were from fossil fuel power plants, accounting for 68% of total greenhouse gas emissions. Furthermore, it is projected that by the 2050s, the average CO2 concentration in the atmosphere will be approximately twice as high as it was in the 1800s, which had already increased by 40% [2,3]. If CO2 gas is not cut by more than 50% now, the average global temperature could rise by 2 °C by 2050 [4,5].
In response to this urgent issue, various methods have been developed for CO2 capture [6,7]. These include amine-based CO2 capture technology, direct air capture, carbon capture at power plants, membrane gas separation, carbon conversion into useful materials, carbon capture using nanotechnology, and mitigation through the photo-oxidation process. As industries continue to expand, the demand for efficient CO2 capture systems is expected to grow [6,7,8,9].
Among these techniques, CO2 capture using alkaline solutions and packed columns is one of the most promising approaches Darmana, et al. (2007) [10]. In this method, flue gas is passed through a column containing an alkaline solution, such as KOH or NaOH, which reacts with CO2 to form carbonate compounds. This method can effectively capture CO2 with minimal energy consumption, offering a potentially viable solution to reduce atmospheric CO2 concentrations. Darmana, et al. (2007) [10] used computational model namely Euler-Lagrange model to simulate mass transfer and chemical reactions in a bubble column reactor, particularly focusing on the chemisorption process of CO2 in an aqueous NaOH solution. The computational study results were compared with experimental bubble velocity data, highlighting the influence of both mass transfer and chemical reactions on reaction hydrodynamics, bubble size distribution, and gas hold-up in the reactor. The research findings underscored the need for dynamic three-dimensional models to better understand the hydrodynamics of bubble column reactors.
Carbon dioxide capture in a spray column was experimentally studied by Guo et al., 2011 [6] using NaOH solution and a fine mist of aqueous ammonia as CO2 absorbents. The effects of various operational and design parameters were investigated on the effectiveness of CO2 removal, such as the concentration of aqueous ammonia solution and NaOH solution, absorbent solution volume flow rate, and total gas flow rate. The removal efficiency of CO2 was enhanced by higher concentrations of aqueous ammonia and NaOH, larger adsorbent flow rates, and lower flow rates of the total gas combination of nitrogen and CO2. The study also demonstrated that absorbent-to-CO2 mole ratios above certain thresholds were crucial for achieving high removal efficiency.
Dhakshinamoorthy et al. (2012) [11] studied the photocatalytic CO2 reduction by TiO2 and related titanium containing photocatalysts. Their study focused on optimizing reaction pathways for converting CO2 into fuels such as CH4, CH3OH, CO, and HCOOH. They found that modified TiO2 showed significant promise as a photocatalyst, with future recommendations for exploring alternative metal-TiO2 based catalysts to improve efficiency and make the process more commercially viable. Hong et al. (2013) [12] investigated reduction pathways in solar-energy-driven photocatalytic CO2 reduction for fuel production. They identified several challenges in achieving specific products like alcohol, aldehydes, and gases such as CH4 and CO. The study also developed analytical techniques such as high-performance liquid chromatography (HPLC) for the systematic evaluation of reaction products, stressing the need for more uniformity in photocatalytic studies. The efficiency of CO2 capture was investigated by Kordylewski et al., 2013 [13] by optimum conditions at laboratory scale experiments. A carrier gas with 15% CO2 concentration at a flow rate of 140 L/min was passed through Dreschel washers containing NaOH solutions. A CO2 capture efficiency of 85% was achieved with a 50% NaOH solution and increasing the solution temperature further enhanced CO2 capture.
The performance of a spray dryer for reactive absorption of CO2 using NaOH was investigated by Tavan and Hosseini (2017) [14]. The study sought to fill the knowledge gap regarding spray dryer performance in reactive absorption processes, particularly at low temperature conditions and demonstrated high CO2 removal efficiency at low temperatures. They also found that nozzle diameter, operating temperature, and NaOH concentration played significant roles in enhancing performance.
Salmón et al., 2018 [15] studied CO2 capture by alkaline solution for carbonate production in a packed column and in a membrane-contactor using NaOH solutions to produce sodium carbonate. Both techniques efficiently absorbed CO2 and generated sodium carbonate; the packed column demonstrated quick depletion of NaOH and good absorption of CO2, but the membrane contactor required less volume, indicating potential for industrial process intensification.
The continuous neutralization of NaOH solution with CO2 in an internal-loop airlift reactor was used by Pichler et al., 2021 [16] to demonstrate how CO2 was captured and utilized. Experiments were conducted at 25 °C with gas flow rates up to 10 NL/min. They evaluated the amount of CO2 absorbed and the NaOH feed rate, calculating the reaction rate based on the two-film theory. The experimental findings showed that, under ideal circumstances, the internal-loop airlift reactor’s superior mixing and mass transfer design allowed it to attain significant CO2 capture efficiency and effective conversion of captured CO2 into methanol and formic acid.
Yan et al. (2021) [17] optimized CO2 adsorption capacity using imidazole (Im) and tetraethylenepentamine sorbents, employing response surface methodology (RSM) based on Central Composite Design (CCD). A functional sorbent prepared by SBA-15 as a support material impregnated with TEPA and Im, was used for adsorption studies. Modified SBA-15 adsorbents demonstrate enhanced adsorption capacity and thermal stability due to imidazole’s interaction with CO2, forming a CO2-C3H4N2 complex. This study provided new insight for the development of cutting-edge CO2 capture adsorbents by demonstrating the efficacy of combining TEPA and Im in improving CO2 adsorption efficiency. Further studies identified sodium hydroxide (NaOH) as the most effective hydroxide for absorbing CO2 from ambient air, achieving up to 90% reduction in controlled settings [18]. They proposed the use of NaOH-equipped drones for air purification at various elevations, offering a novel atmospheric CO2 mitigation approach.
Sadewo et al. (2022) [19] studied the impact of sodium hydroxide (NaOH) on biomass and metabolite synthesis in Chlorella sorokiniana cultures. Using CO2-enriched media with varying NaOH concentrations, optimal growth was achieved at 60 mM, resulting in a biomass yield of 598.3 mg/L and carbon consumption of 691.8 mg L−1. While NaOH improved protein levels, other metabolites remained unchanged. Their findings highlighted the potential of C. sorokiniana for CO2 mitigation and bioresource applications.
Kozlowski and Hasani (2022) explored NaOH (aq) for cellulose dissolution and its CO2 absorption capabilities [20]. Controlled in-situ CO2 addition enabled effective cellulose coagulation with minimal alkalinity loss, attributed to carbonate species formation. Temperature significantly influenced the process, with experiments at 25 °C and 5 °C highlighting its impact on CO2-induced coagulation pathways.
The effect of CO2 flow rate on its absorption using a NaOH absorbent was investigated by Nugroho et al. (2023) [4]. The study revealed an inverse relationship between the absorption factor and CO2 flow rate due to reduced contact between CO2 gas and NaOH at higher flow rates. As the CO2 ratio exceeded the absorbent’s capacity, the absorption capacity decreased. However, the absorption capacity increased proportionally with the liquid-to-gas ratio (L/V) and as the residual liquid approaches saturation, enhancing CO2 diffusion in water.
A few studies have explored the use of sodium hydroxide (NaOH) for capturing carbon dioxide (CO2) from flue gases, but their findings have not provided conclusive evidence regarding the method’s efficiency [2,4,17]. This research demonstrates the effectiveness of using a sodium hydroxide solution with tap water to capture CO2 on a laboratory scale while simultaneously reducing the calcium content of tap water. The novelty of this study lies in its combined approach to CO2 mitigation and water treatment, offering dual environmental benefits. Additionally, the incorporation of ultra-microbubble technology to enhance gas-liquid interaction represents a potential advancement in CO2 capture efficiency. Experimental results demonstrated that the ultra-fine bubble system achieved a CO2 removal rate significantly higher than previous designs, such as the internal-loop airlift reactor studied by Pichler et al. (2021) [16], which relied on bulk neutralization of NaOH without fine bubble dispersion using an internal-loop airlift reactor. Similarly, our setup showed improved gas-liquid interaction over the bubble column modeled by Darmana et al. (2007) [10] using Euler-Lagrange model-based simulations, where mass transfer limitations were evident due to larger bubble size and lower gas hold-up. This study provides valuable insights into cost-effective and scalable solutions for addressing both CO2 emissions and water quality challenges.
Preliminary experiments were conducted using a semi-batch column with ultra-microbubble generation in a gas-lift tower. Sodium hydroxide solutions of varying volumes (2, 3, 4 L) and concentrations (0.1, 0.2, 0.3 M) were prepared using tap and deionized water. CO2 gas flow rates of 3, 5, and 7 L/min were applied. The production of carbonate precipitates in the presence of Ca2+ and Mg2+ ions was verified by conductivity analysis. Additionally, DLS was used to determine the particle size distribution of precipitated calcite particles.

2. Materials and Methods

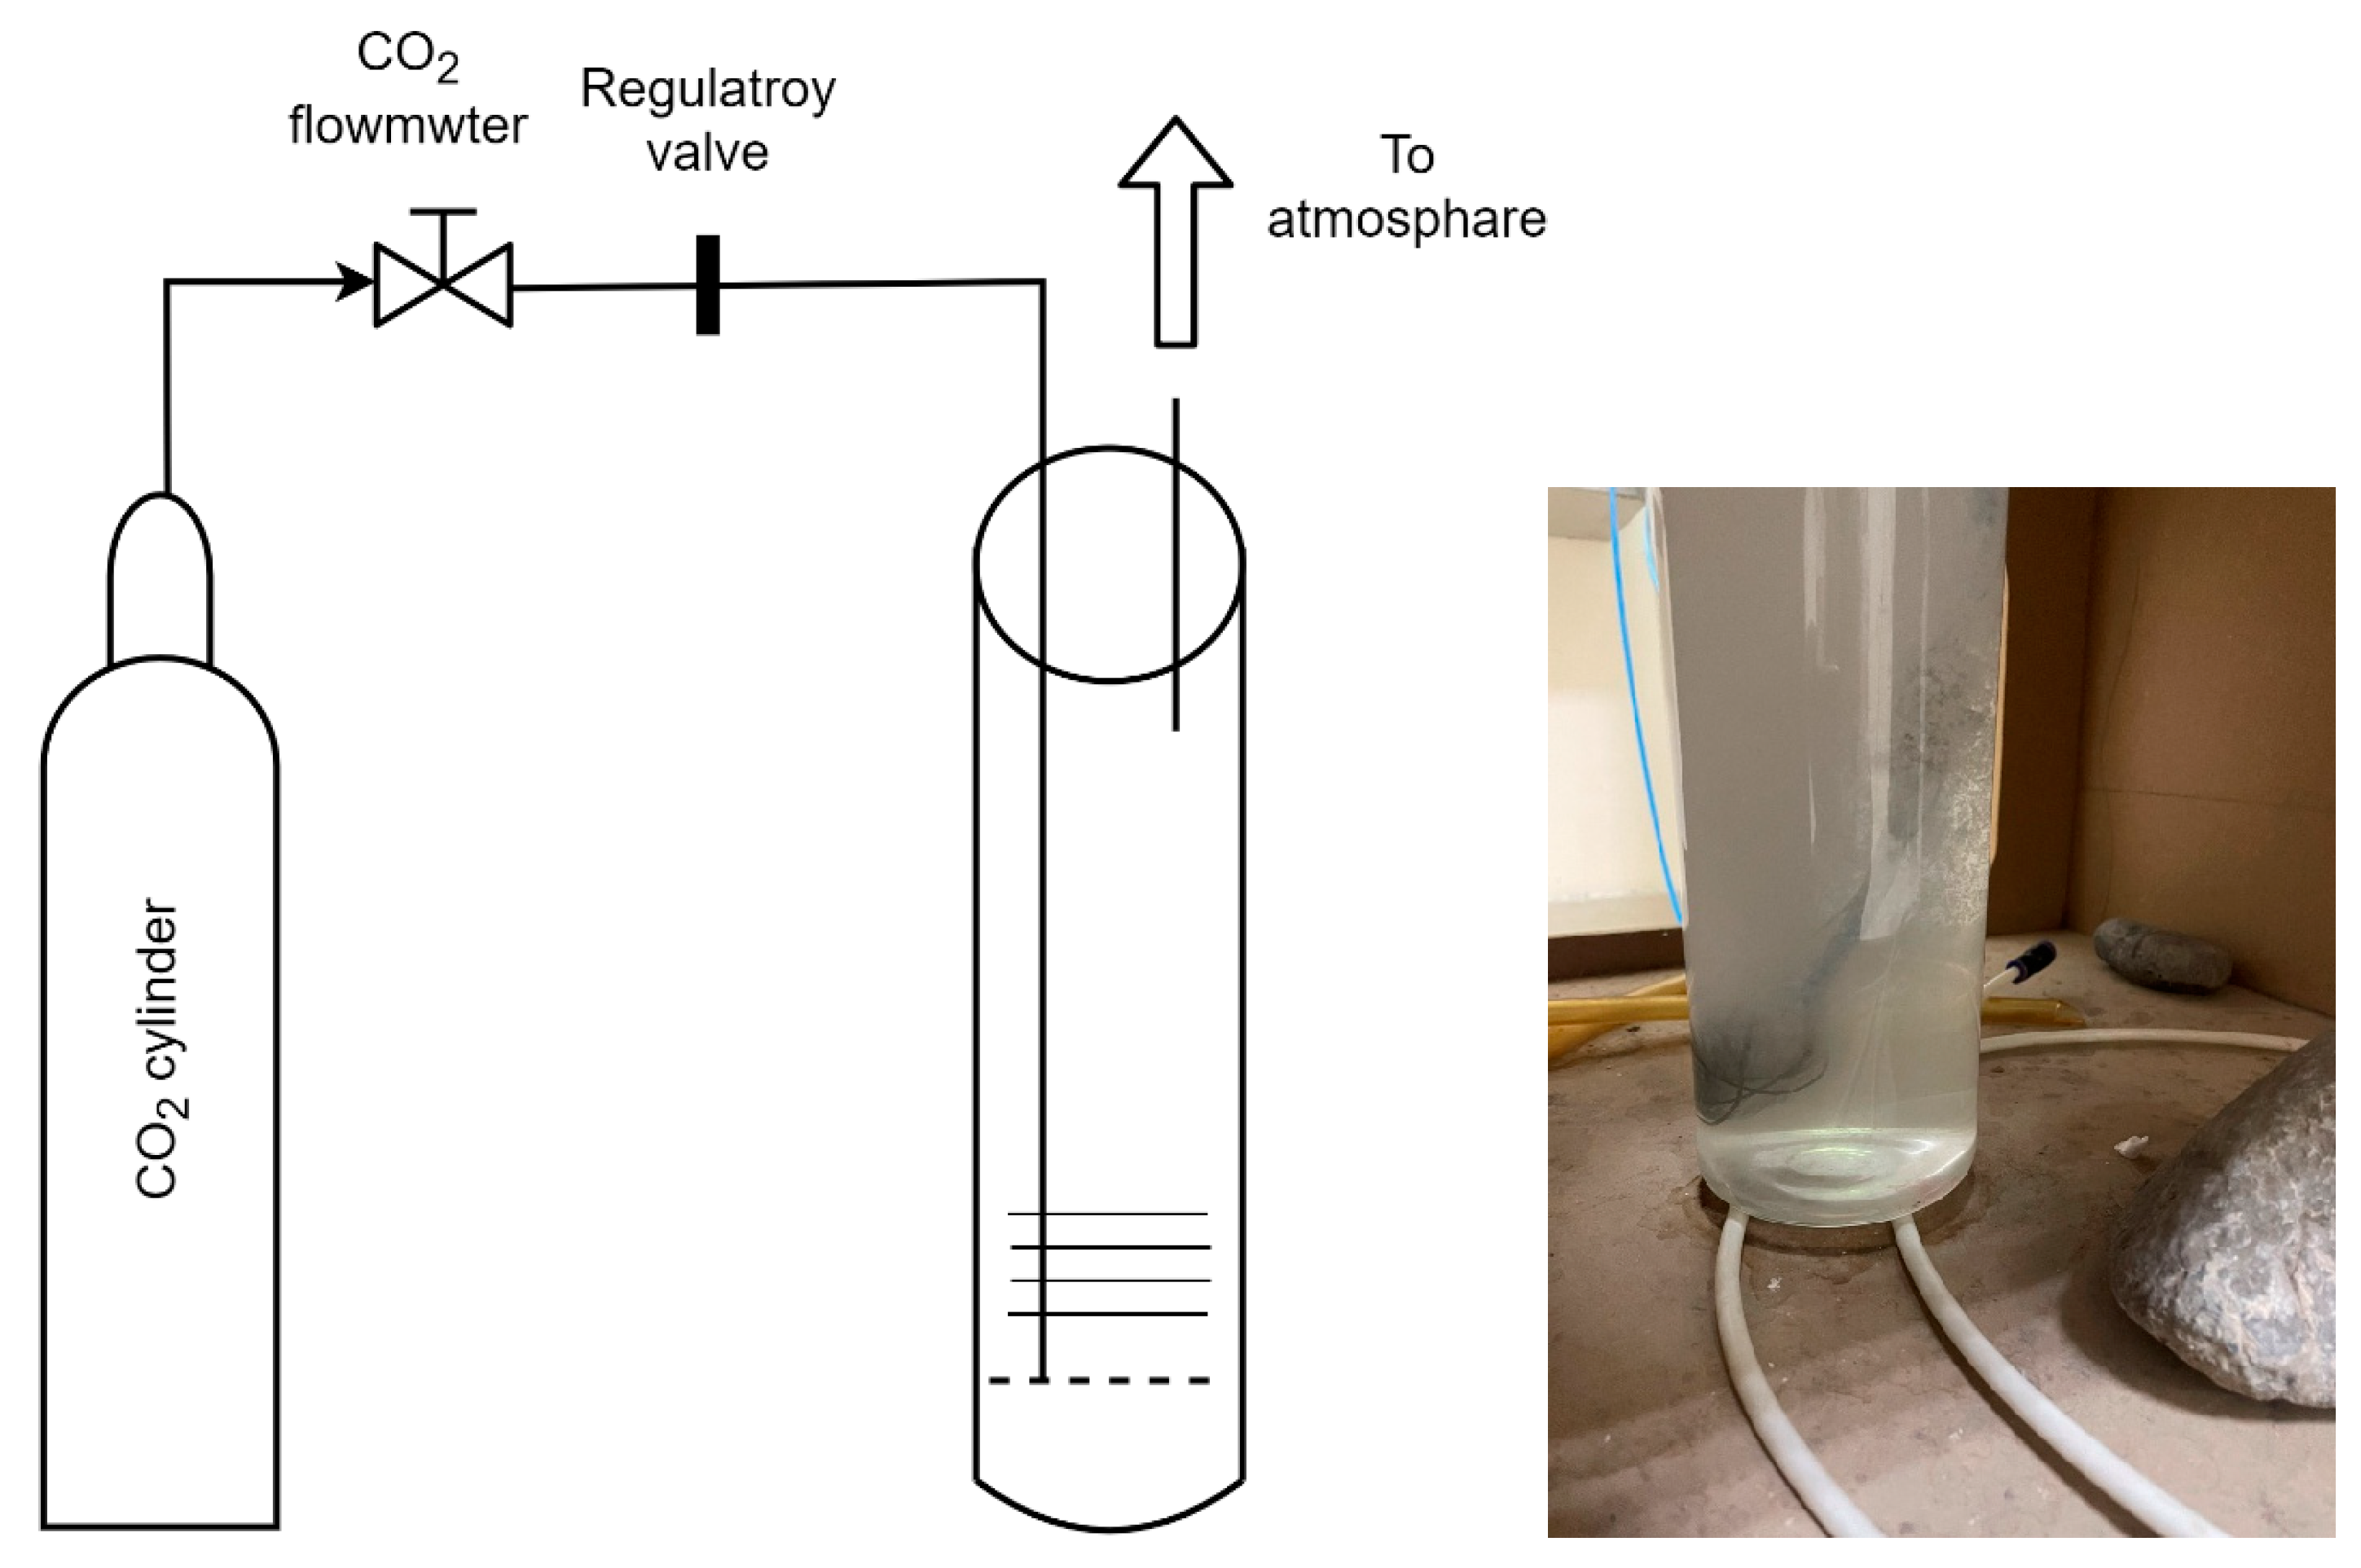
2.1. Semi-Batch Bubble Column

The experiments were carried out in a laboratory scale semi-batch bubble column, schematic diagram in Figure 1. The bubbles are introduced into the column using a gas distributor from CO2 gas cylinder and inlet gas flowrate was monitored using CO2 rotameters. The column is an atmospheric cylindrical lab scale gas lift column consisting of a glass tube (3 mm thickness, 1.2 m height, 10 cm diameter, fitted with a stone gas diffuser of 8 cm diameter at an average hole size of 1–3 mm), was fabricated in the labs of university of Nizwa. Different volumes of sodium hydroxide solution; 2 L, 3 L, 4 L and concentrations; 0.1, 0.2, 0.3 M were prepared using tap and deionized water. The liquid height in the cylinder for solution volumes 2, 3 and 4 L are 37, 53 and 75.5 cm, respectively. Different CO2 gas flowrates were purged at the bottom of the solution; 3, 5, 7 L/min (LPM).

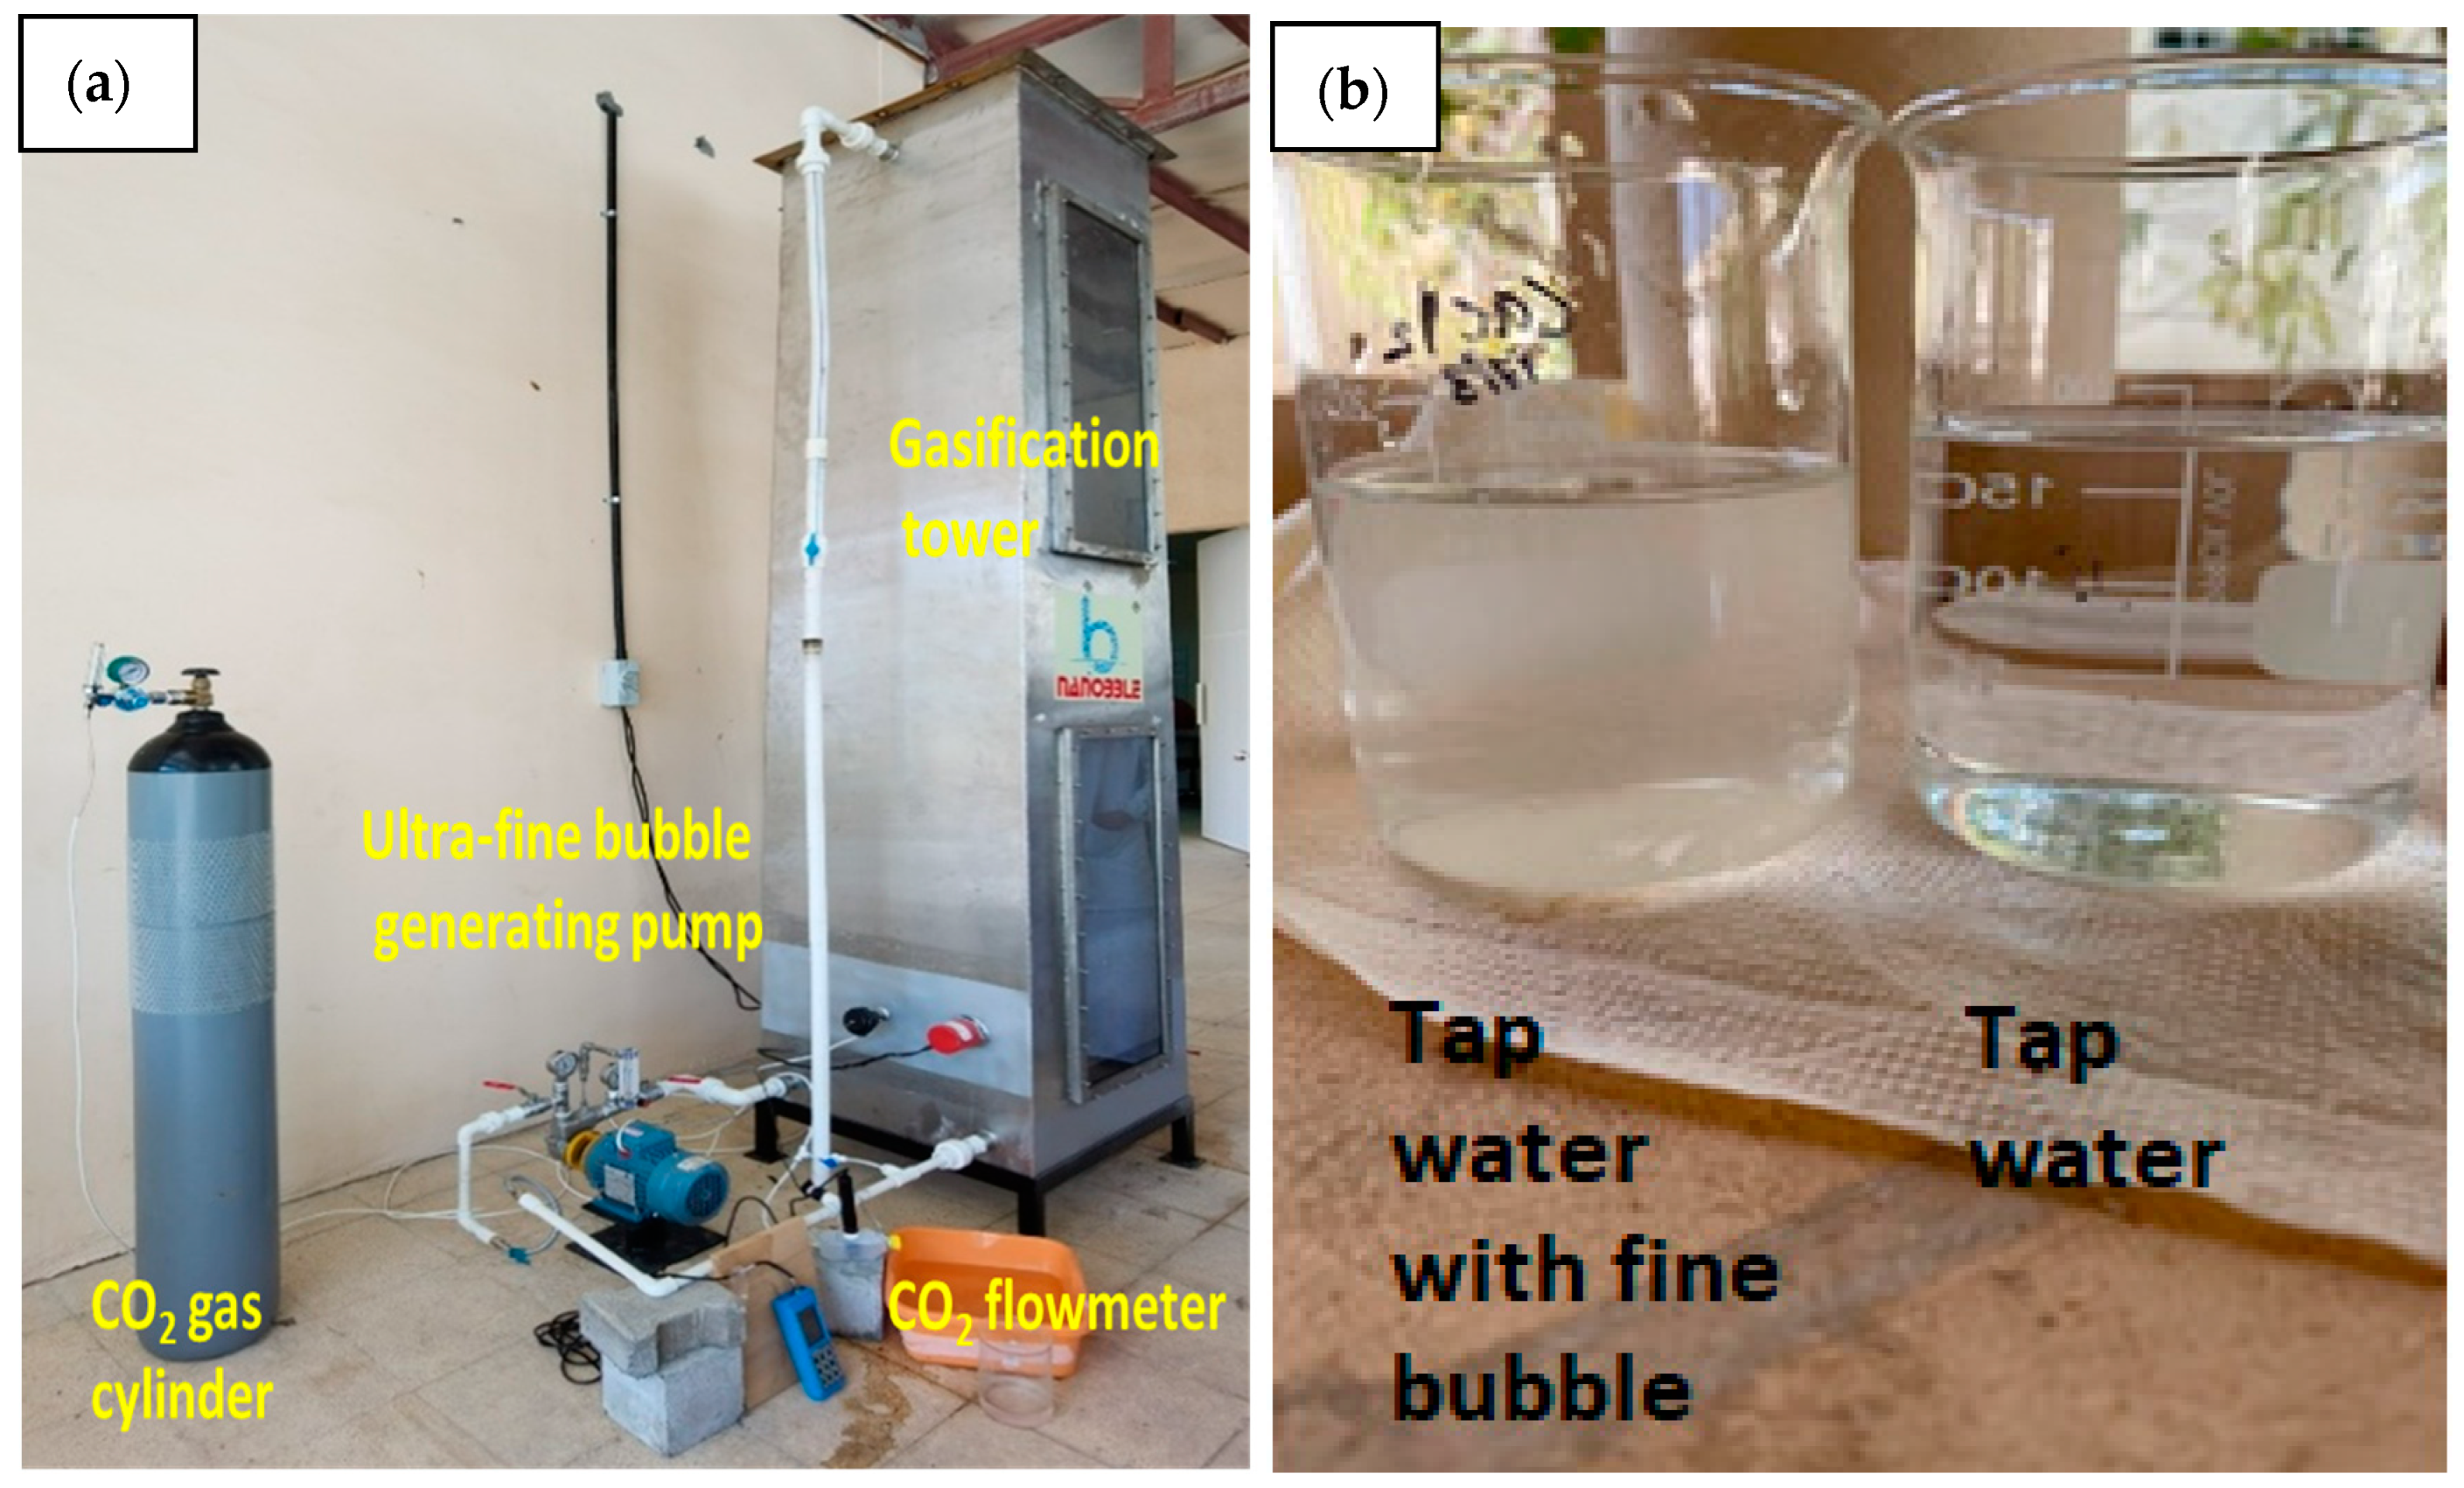
2.2. Ultra-Fine Micro Bubble Column

The CO2 capturing with NaOH solution (different volume and concentration) using the ultra-fine bubbles gasification tower (pilot scale), available at the university of Nizwa, is illustrated in Figure 2a. The rig in Figure 2a was custom designed/manufactured to examine a semi-batch experiment. The degassing tower, made of food grade stainless steel, is of 1.08 m3 liquid capacity (0.6 m × 0.6 m × 3.0 m) provided with 2 rectangular sight glasses (made of polycarbonate) at two levels of the column. Those were intended to monitor the bubble cloud generated in the column, and hence, controlling the bubble size, respectively. The tower was equipped with an ultra-fine bubble pump which can produce a minimum of 850 nm, average of 18 µm bubble size at a density of 1,600,000 bubbles/1 cm3. The bubble size can be adjusted manually through changing the valve opening on the suction and discharge lines, respectively. The prepared solution sample was with a concentration of 0.1 M NaOH using 100 L of tap water. CO2 gas was pumped at flowrate of 5 L/min.
Figure 2b shows a sample of tap water with fine bubbles. It is evident that the fine bubbles spread out in a hazy pattern throughout the water. The mass transfer between the gas and liquid phases is greatly enhanced by the fine bubbles’ large specific surface area. Furthermore, a lot of bubbles would create a lot of turbulence in the medium, which will help the fluid’s mass transfer.

2.3. Characterization

X-ray diffraction analysis was performed using D8 Discover AXS, Karlsruhe, Germany. Particle size distribution was performed using Malvern DLS (MADLS®), Worcestershire, UK. Water analysis was performed in the laboratories of Water and Wastewater Services Company, Nizwa, Sultanate of Oman.

2.4. Testing

Determination of total alkalinity procedure follows Standard Methods for the examination of water & wastewater 24th Edition, (2320-B) [21]. The first step is accomplished by titrating to the phenolphthalein endpoint pH (8.3) where half of the carbonate has been converted to bicarbonate. The amount of acid titrated to the phenolphthalein endpoint is called the phenolphthalein alkalinity. Once the titration volume representing the phenolphthalein alkalinity has been recorded the second step is accomplished by titrating the remaining bicarbonate to the methyl red endpoint (pH 4.5). At this point, the total amount of acid used to titrate the sample is related to the total alkalinity.
Determination of total hardness procedure follows Standard Methods for the examination of water & wastewater 24th Edition, (2340-C) and (3500-Mg part B) [21].
The titration reaction is:
Ca2+ + H2Y2− → CaY2− + 2H+
Eriochrome Black T is commonly used as indicator for the above titration. At pH 10, Ca2+ ion first complexes with the indicator as CaIn+ which is wine red. As the stronger ligand EDTA is added, the CaIn+ complex is replaced by the CaY2− complex which is blue. The end point of titration is indicated by a sharp colour change from wine red to blue. Titration using Eriochrome Black T as indicator determines total hardness due to Ca2+ and Mg2+ ions. Hardness due to Ca2+ ion is determined by a separate titration at a higher pH, by adding KOH solution to precipitate Mg(OH)2(s), using Patton and Reeder’s Reagent (VWR Chemicals BDH, Leuven, Belgium) as indicator.
Determination of pH by using pH meter Model pH 700, manufactured by Oakton company, Singapore.
Determination of conductivity by using conductivity meter Model CON 700, manufactured by Oakton company, Singapore.

3. Results and Discussion

3.1. Solution Dynamics of Treated Water—Effect of Variable Water Sources

3.1.1. Tap Water Solutions—Batch-Scale Study

The results of different volumes (2, 3 and 4 L) NaOH (0.05 M) solution with 3 L/min CO2 gas flow rate are depicted in Figure 3. It can be observed that the rate of decrease in the pH value after neutralization is fast, taking longer to reach close to pH 7 within 1 min for most of the volume indicating a faster reaction rate. The larger NaOH volume (i.e., higher liquid height) effectively reduce the pH in a faster rate compared to other volumes due to the residence time CO2 takes in the column allowing better gas-liquid contact for reaction before exit out the liquid to atmospheres.
The results of 2 L NaOH (0.1 M) solution with different CO2 gas flow rates (3, 5, 7 L/min) are depicted in Figure 4a–c. It can be observed that at a flow of 3 L/min, the rate of decrease in the pH value after neutralization is slow, taking longer to reach pH 7. Specifically, the pH decreased to 6.89 after 3 min, indicating a slower reaction rate. However, when the gas flow rates were increased to 5 and 7 L/min, the pH decreased more rapidly, indicating that higher gas flow rates accelerate the neutralization process. Increased gasification of the solution led to greater production of carbonic acid (H2CO3), which further reduced the pH (Figure 4a). At a flow rate of 5 L/min (Figure 4b), the pH reached 6.74 in 2 min, whereas at 7 L/min (Figure 4c), it reached 6.85 (Figure 4c). For solutions with higher NaOH concentrations (0.2 and 0.3 M), the pH reduction took longer and did not drop below 7. This suggests that higher concentrations of NaOH prolong the neutralization process and reduce the rate of carbonic acid formation under increased gas flow. Similar trends were observed for larger NaOH volumes; 3 and 4 L, however, larger NaOH volumes and higher concentration required longer time for neutralization and acid production as shown in Figure 5a–c and Figure 6a–c. For instance, with a volume of 3 L, the pH reached 8 at approximately 5 min, while with volume of 4 L, the pH reached 8 at approximately 10 min for gas flow rate 3 L/min.

3.1.2. Tap Water Solutions—Pilot-Scale Study

Using a large-scale semi-batch column with capacity of 100 L and a gas-lift tower equipped with an ultra-micro bubble generator reduced the CO2 capture time by 50% compared to using conventional diffusers when using gas flow of 5 L/min and a concentration of 0.1 M, the experiment continued for 40 min, during which the pH value decreased from 11.37 to 8.30 as shown in Figure 7a. There was noticeable fluctuation in the pH value, with approximately 23 min required for the pH value to stabilize. However, the trend of pH was decline as anticipated. The fluctuation in the pH was observed when using a lower NaOH concentration of 0.1 M. This This could be related to the turbulence and the generated ultrafine bubbles during the first 20 min which led to unbalance in short-term CO2 absorption. At greater NaOH concentrations, there were no transitory imbalances because CO2 was strongly absorbed.
Higher NaOH concentrations (0.2 and 0.3 M) allow for greater CO2 absorption capacity, the pH change becomes less pronounced due to buffering effects. At lower concentrations (0.1 M), CO2 absorption leads to a significant pH drop as carbonate and bicarbonate species form. However, at higher concentrations, the excess hydroxide ions buffer the system, preventing a noticeable pH reduction despite continued CO2 uptake. This indicates that the gas flow rate was insufficient to generate an acidic solution after neutralization, as depicted in Figure 7b,c.

3.1.3. Deionized Water Solutions

The results for CO2 capture using 0.1 M NaOH solution prepared with deionized water (initial pH = 7.26) are compared with those using tap water in Figure 8. It can be observed that the neutralization process and subsequent acid formation, leading to a pH reduction, occurs more rapidly when the NaOH solution is prepared with tap water. This is likely due to presence of calcium (Ca2+) and magnesium (Mg2+) ions in tap water, which react with carbonate ions formed during CO2 purging. Using tap water to prepare NaOH solution for capturing CO2 resulted in precipitation of calcium and magnesium ions, reducing conductivity and total suspended solids (TDS). This process effectively produces cleaner water, as explained in the next Section 3.4.

3.2. Mechanism of CO2 Mitigation Through Neutralization Reaction

Upon initial preparation, the pH of both the NaOH solutions (prepared with tap and deionized water) was highly basic, around 12–13. After CO2 purging, the pH of both solutions dropped to neutral (pH~7), indicating the sequential reaction of hydroxide ions with CO2 to form carbonate and bicarbonate species.
Despite the neutral pH in both cases, there was a noticeable difference between the treated solutions in terms of precipitate formation, as illustrated by Figure 9a. A white precipitate formed in the NaOH solution prepared with tap water (Figure 9b), while no precipitate was observed in the deionized water solution. Similar trends have been reported for precipitation by other researchers [22].

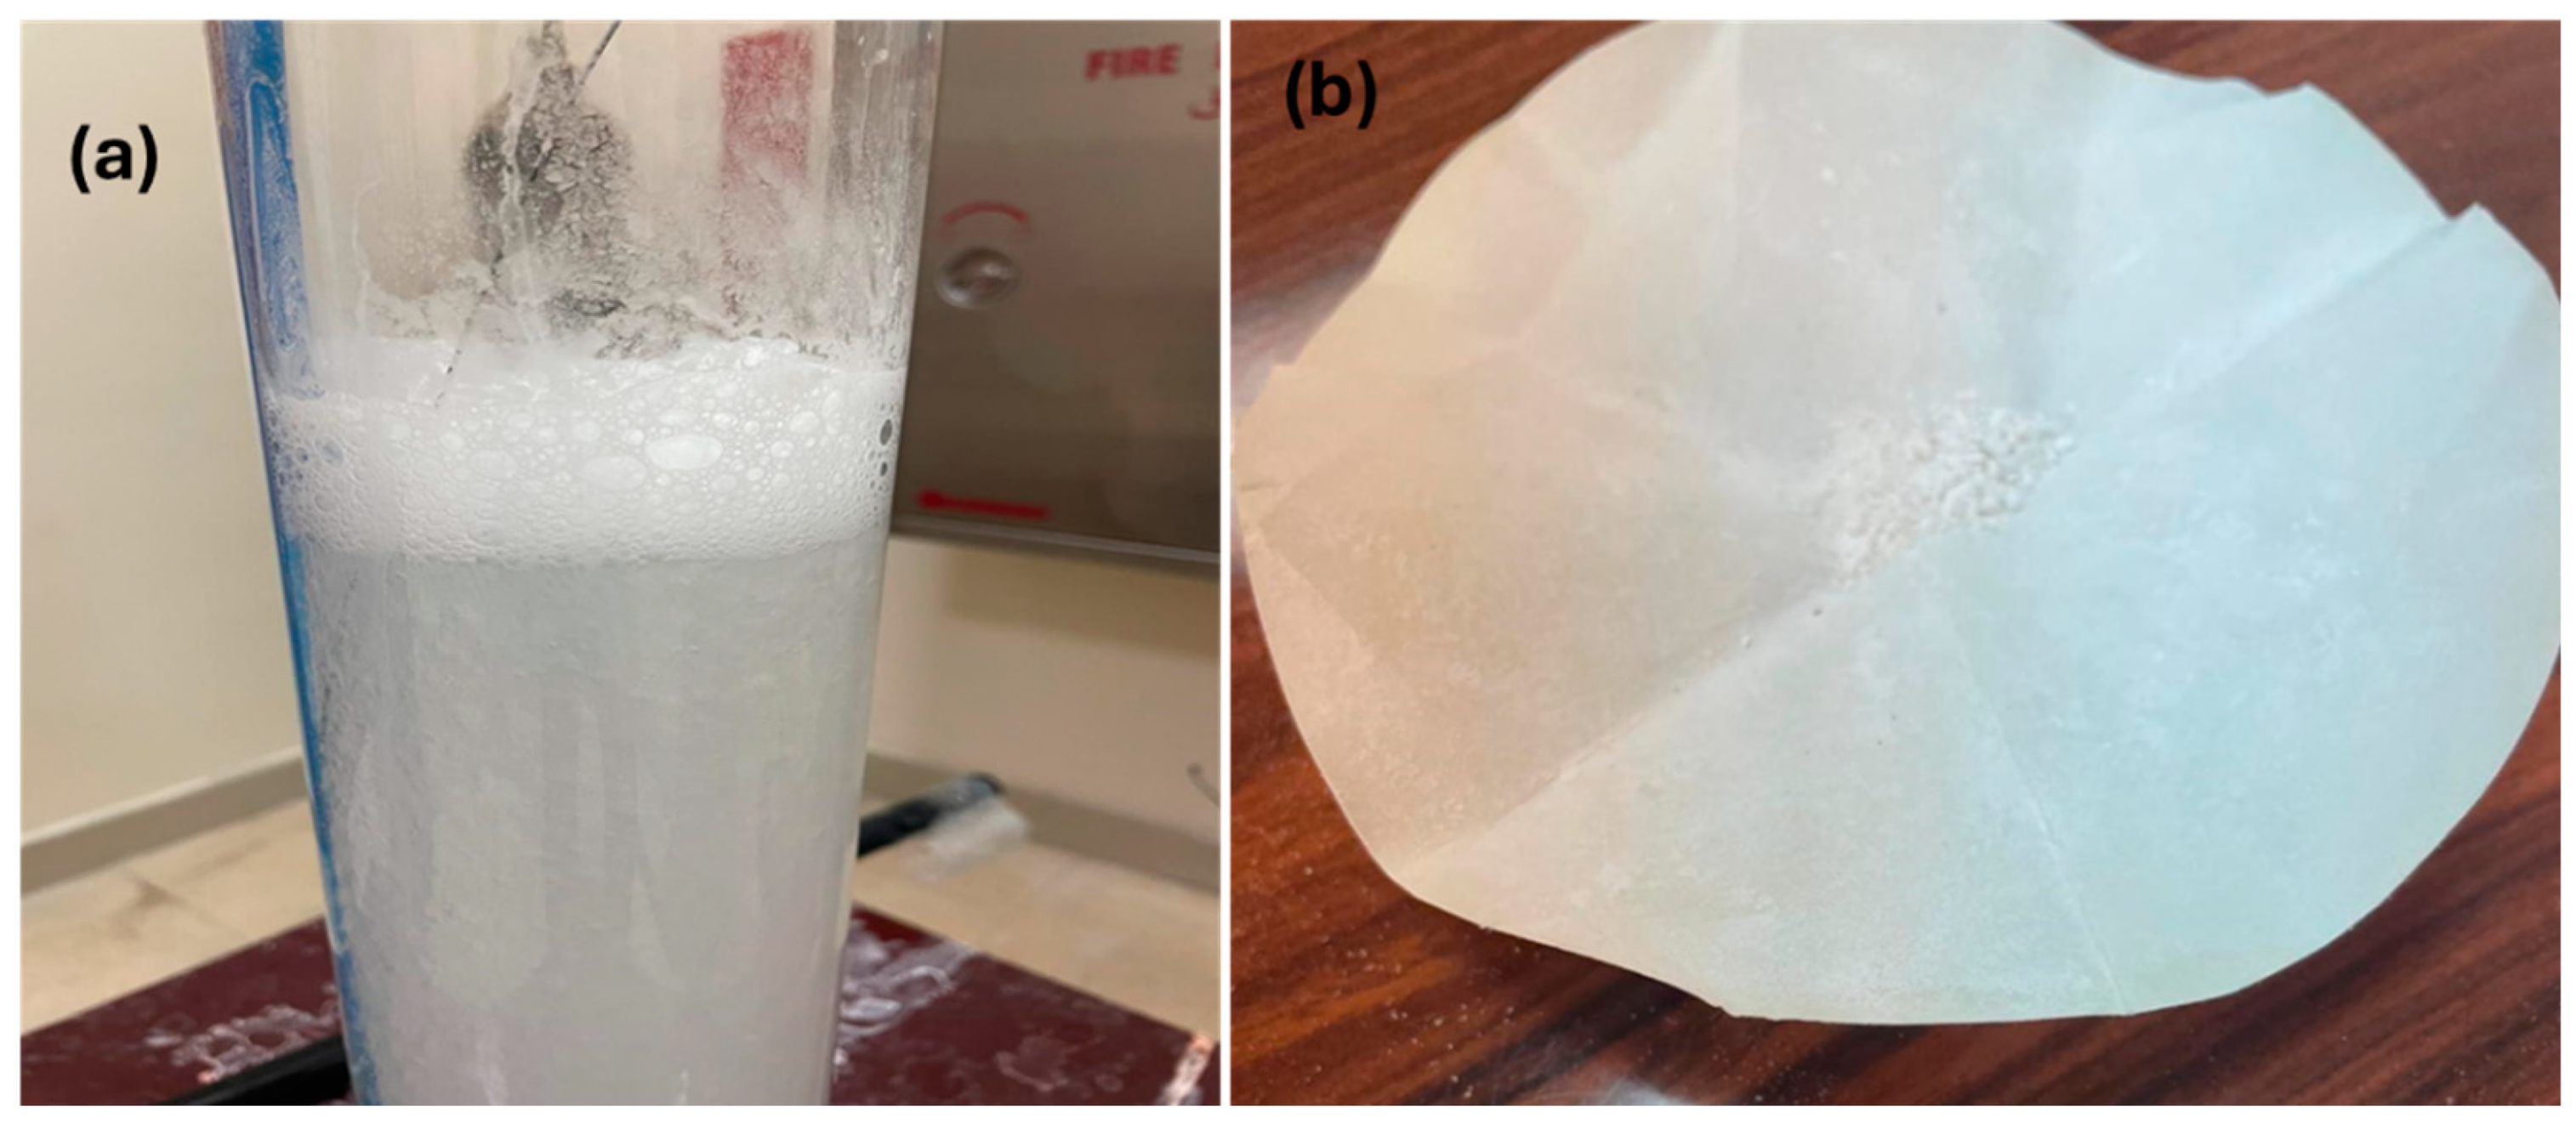
3.2.1. Precipitate Formation in Tap Water vs. Deionized Water

The pH trend, white precipitation and the difference in behaviour between using tap water and deionised water when purging CO2 into sodium hydroxide solution can be explained by the presence of dissolved minerals in tap water, particularly Ca2+ and Mg2+ ions [23].

Tap Water

A white precipitate formed due to dissolved Ca2+ and Mg2+ ions reacting with carbonate ions during CO2 purging.
When CO2 is bubbled through NaOH, the following reactions happen:
  • Formation of carbonate ions
CO2 + 2NaOH → Na2CO3 + H2O
  • Formation of calcium carbonate (CaCO3)
Ca2+ ions react with carbonate ions to form CaCO3, which is insoluble in water:
Ca2+ + CO32− → CaCO3(s)
  • Formation of magnesium carbonate (MgCO3):
Mg2+ ions react with carbonate ions to form MgCO3 or a mixed form like magnesium calcite, which is also poorly soluble:
Mg2+ + CO32− → MgCO3(s)
These reactions result in the white precipitates observed in the solution prepared with tap water, which were then analysed by XRD analysis to confirm the crystalline structure, as discussed in Section 3.3.

Deionised Water

In deionised water, there were no dissolved calcium or magnesium ions in the solution. Thus, no precipitation occurred because there were no cations (Ca2+ or Mg2+) to react with the carbonate ions and form solid calcium or magnesium carbonates.

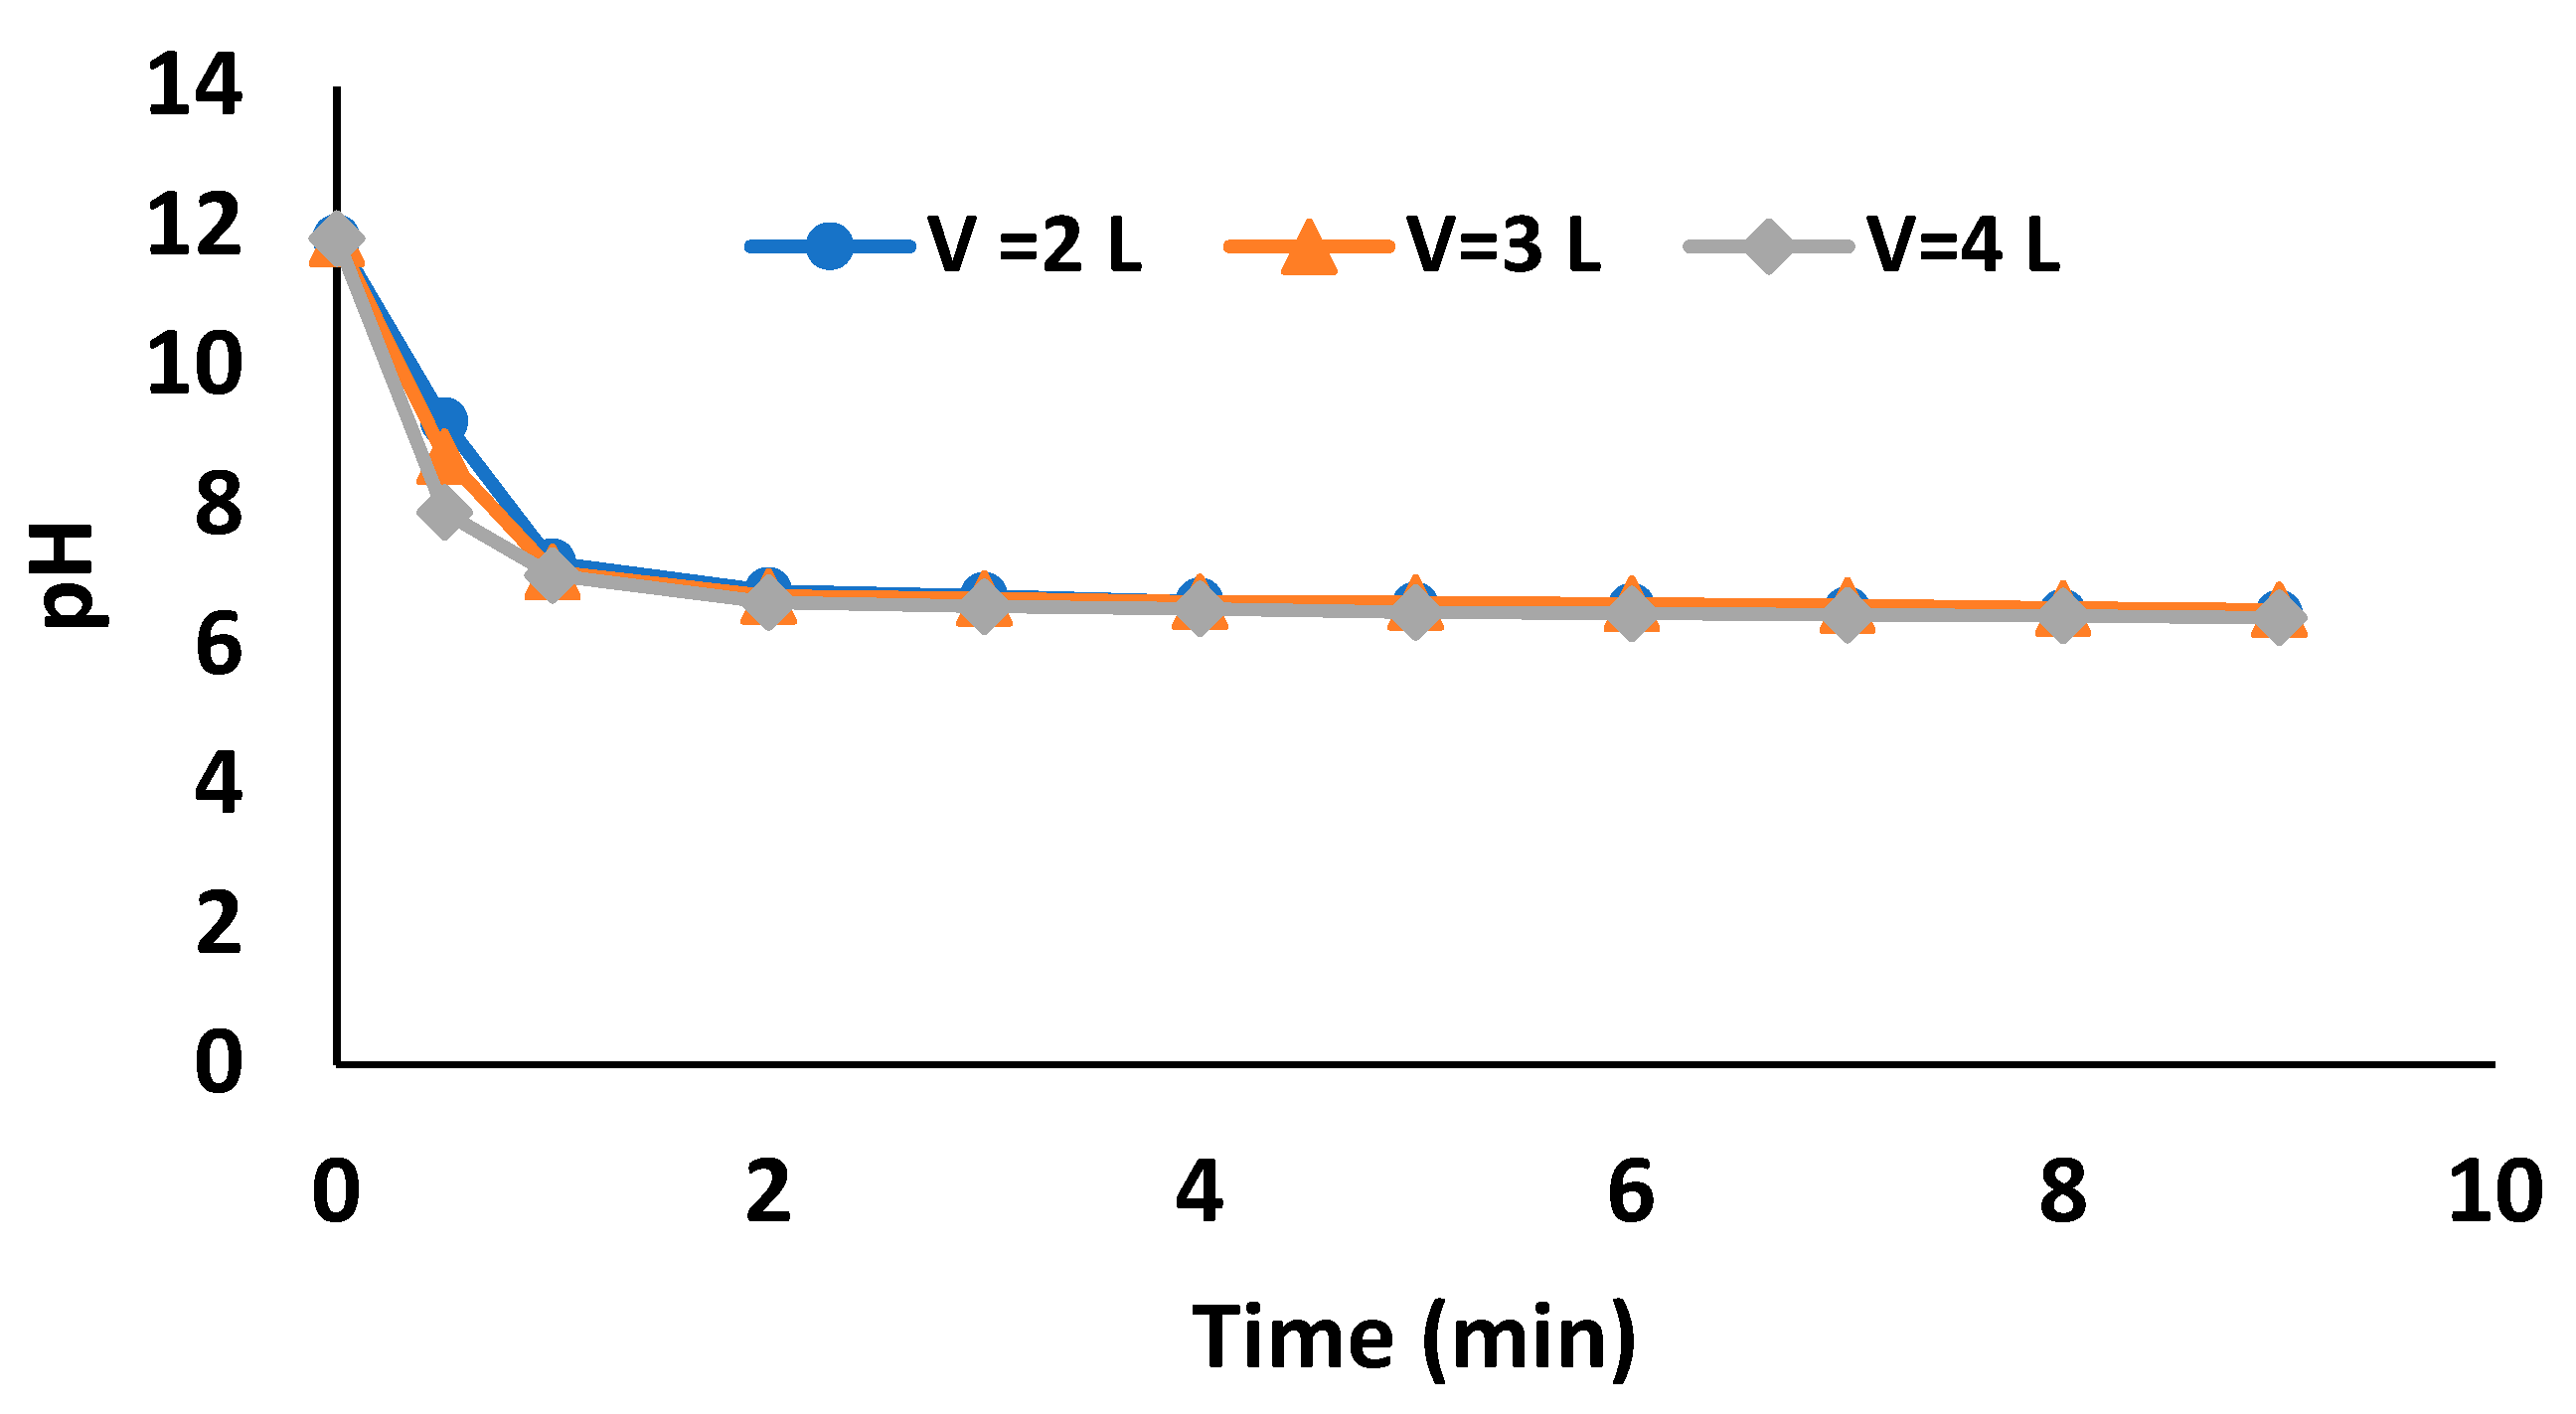
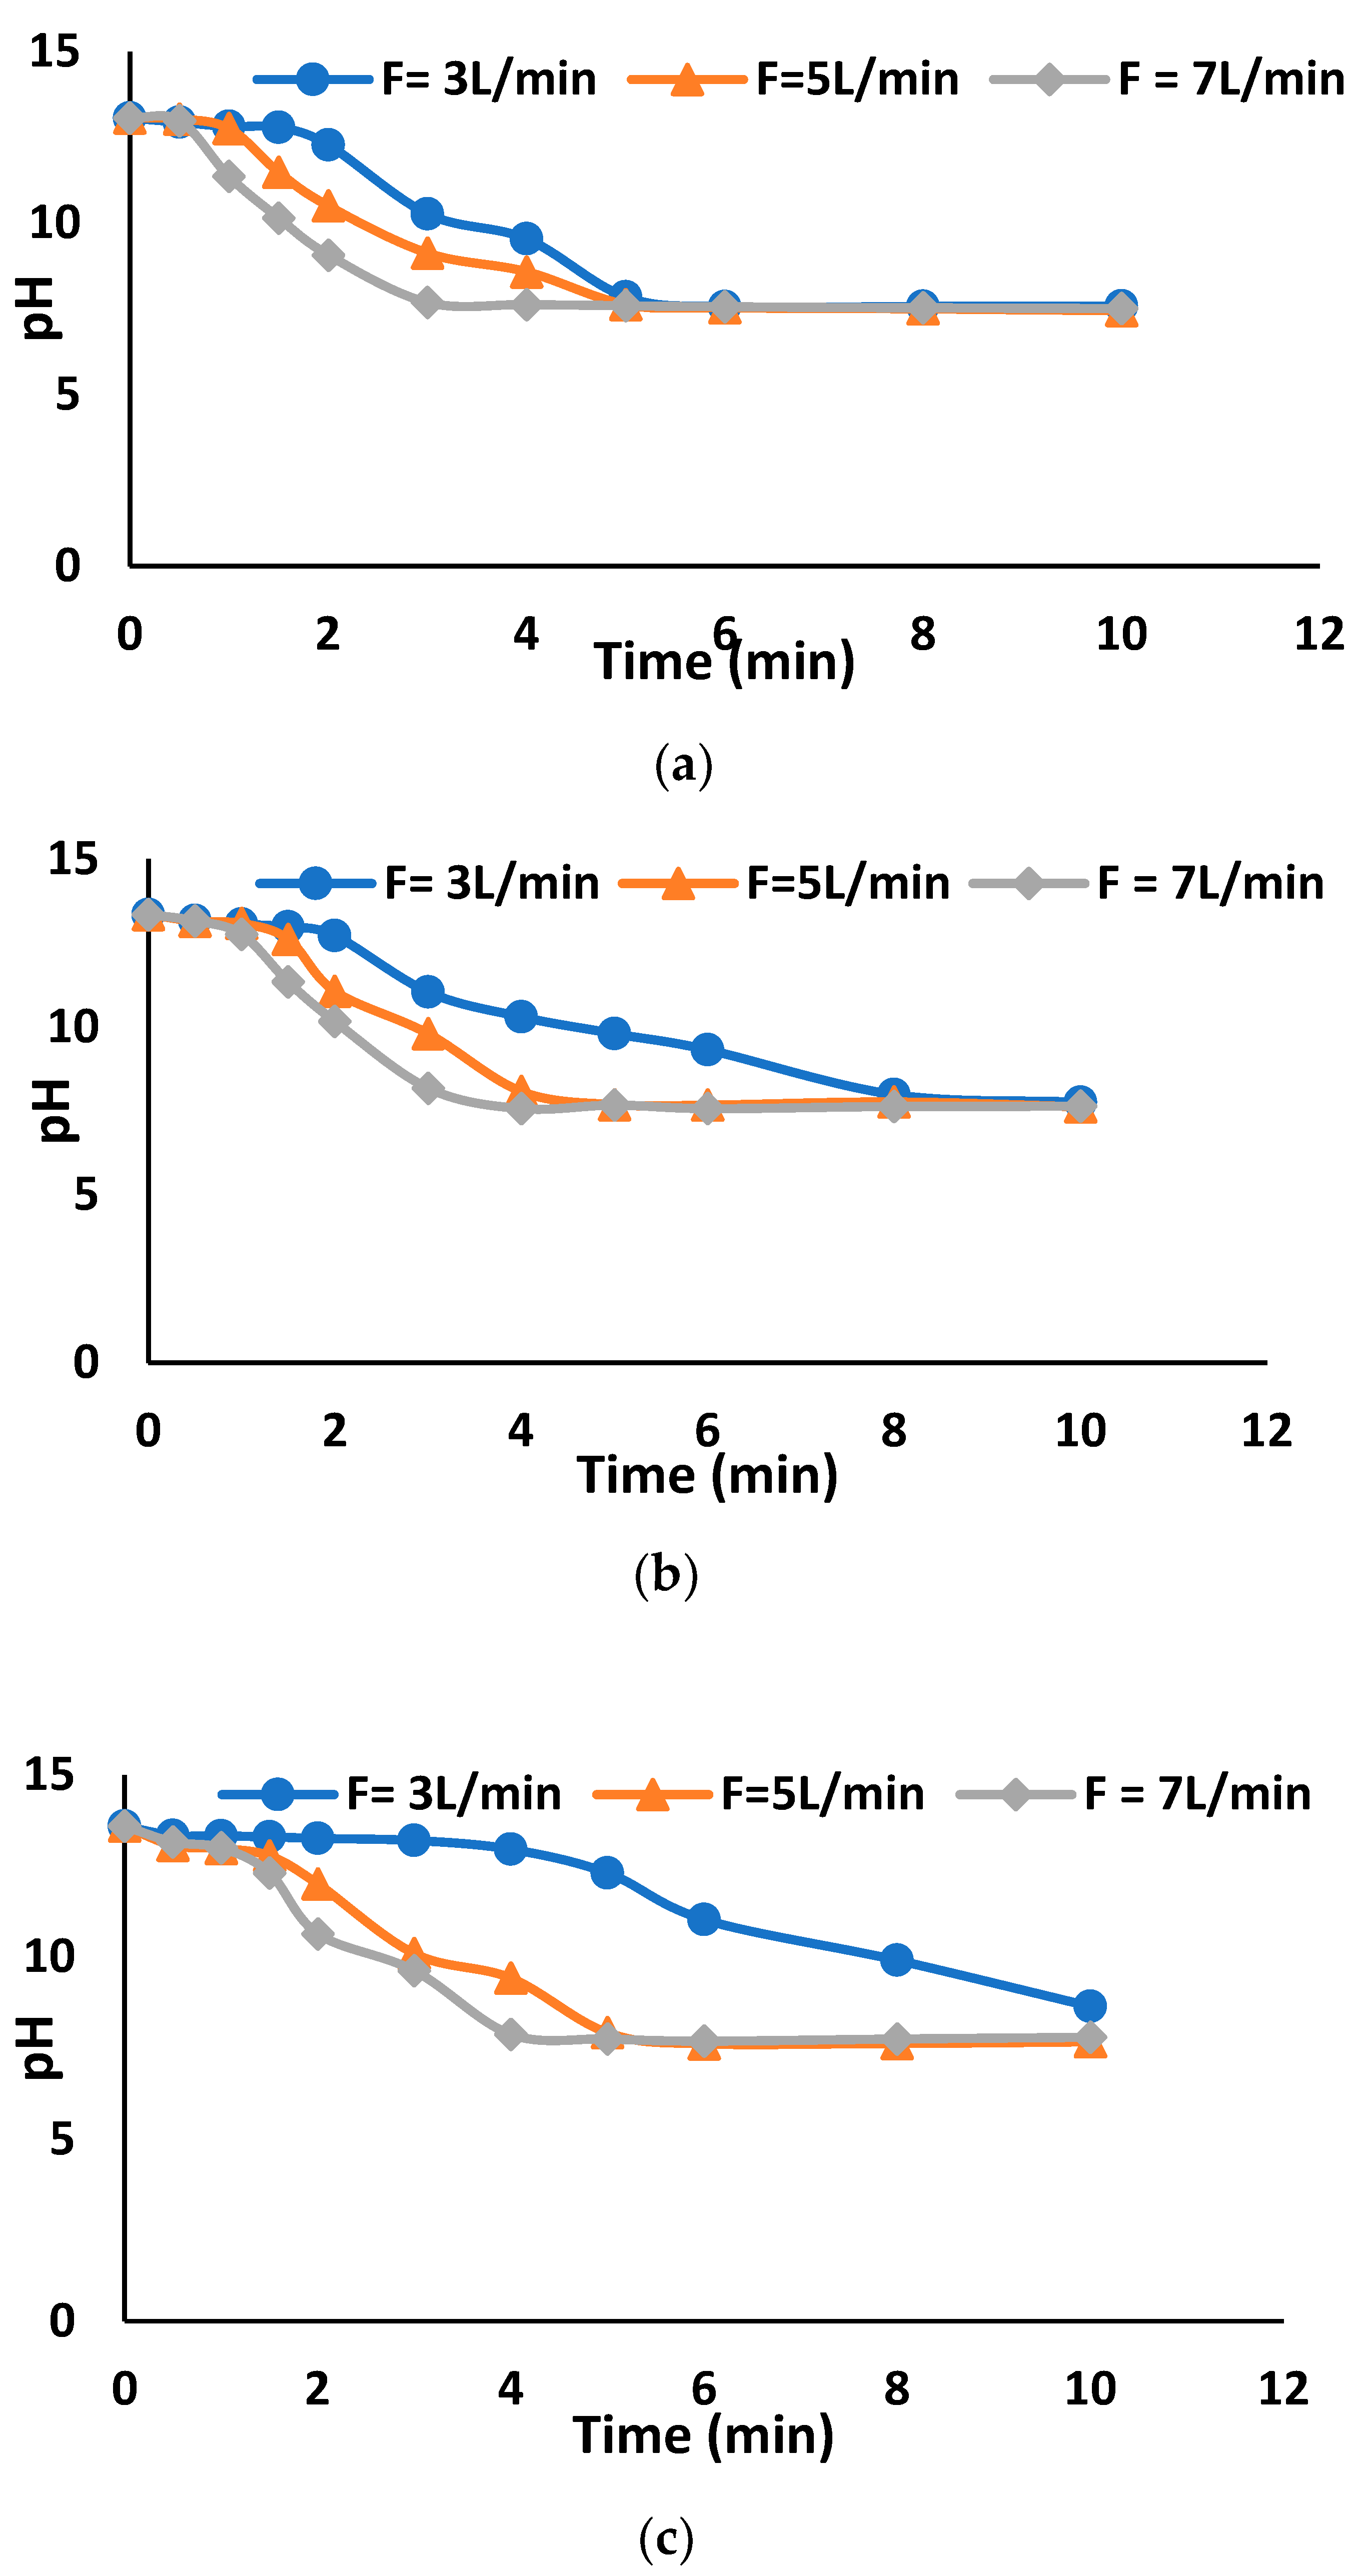
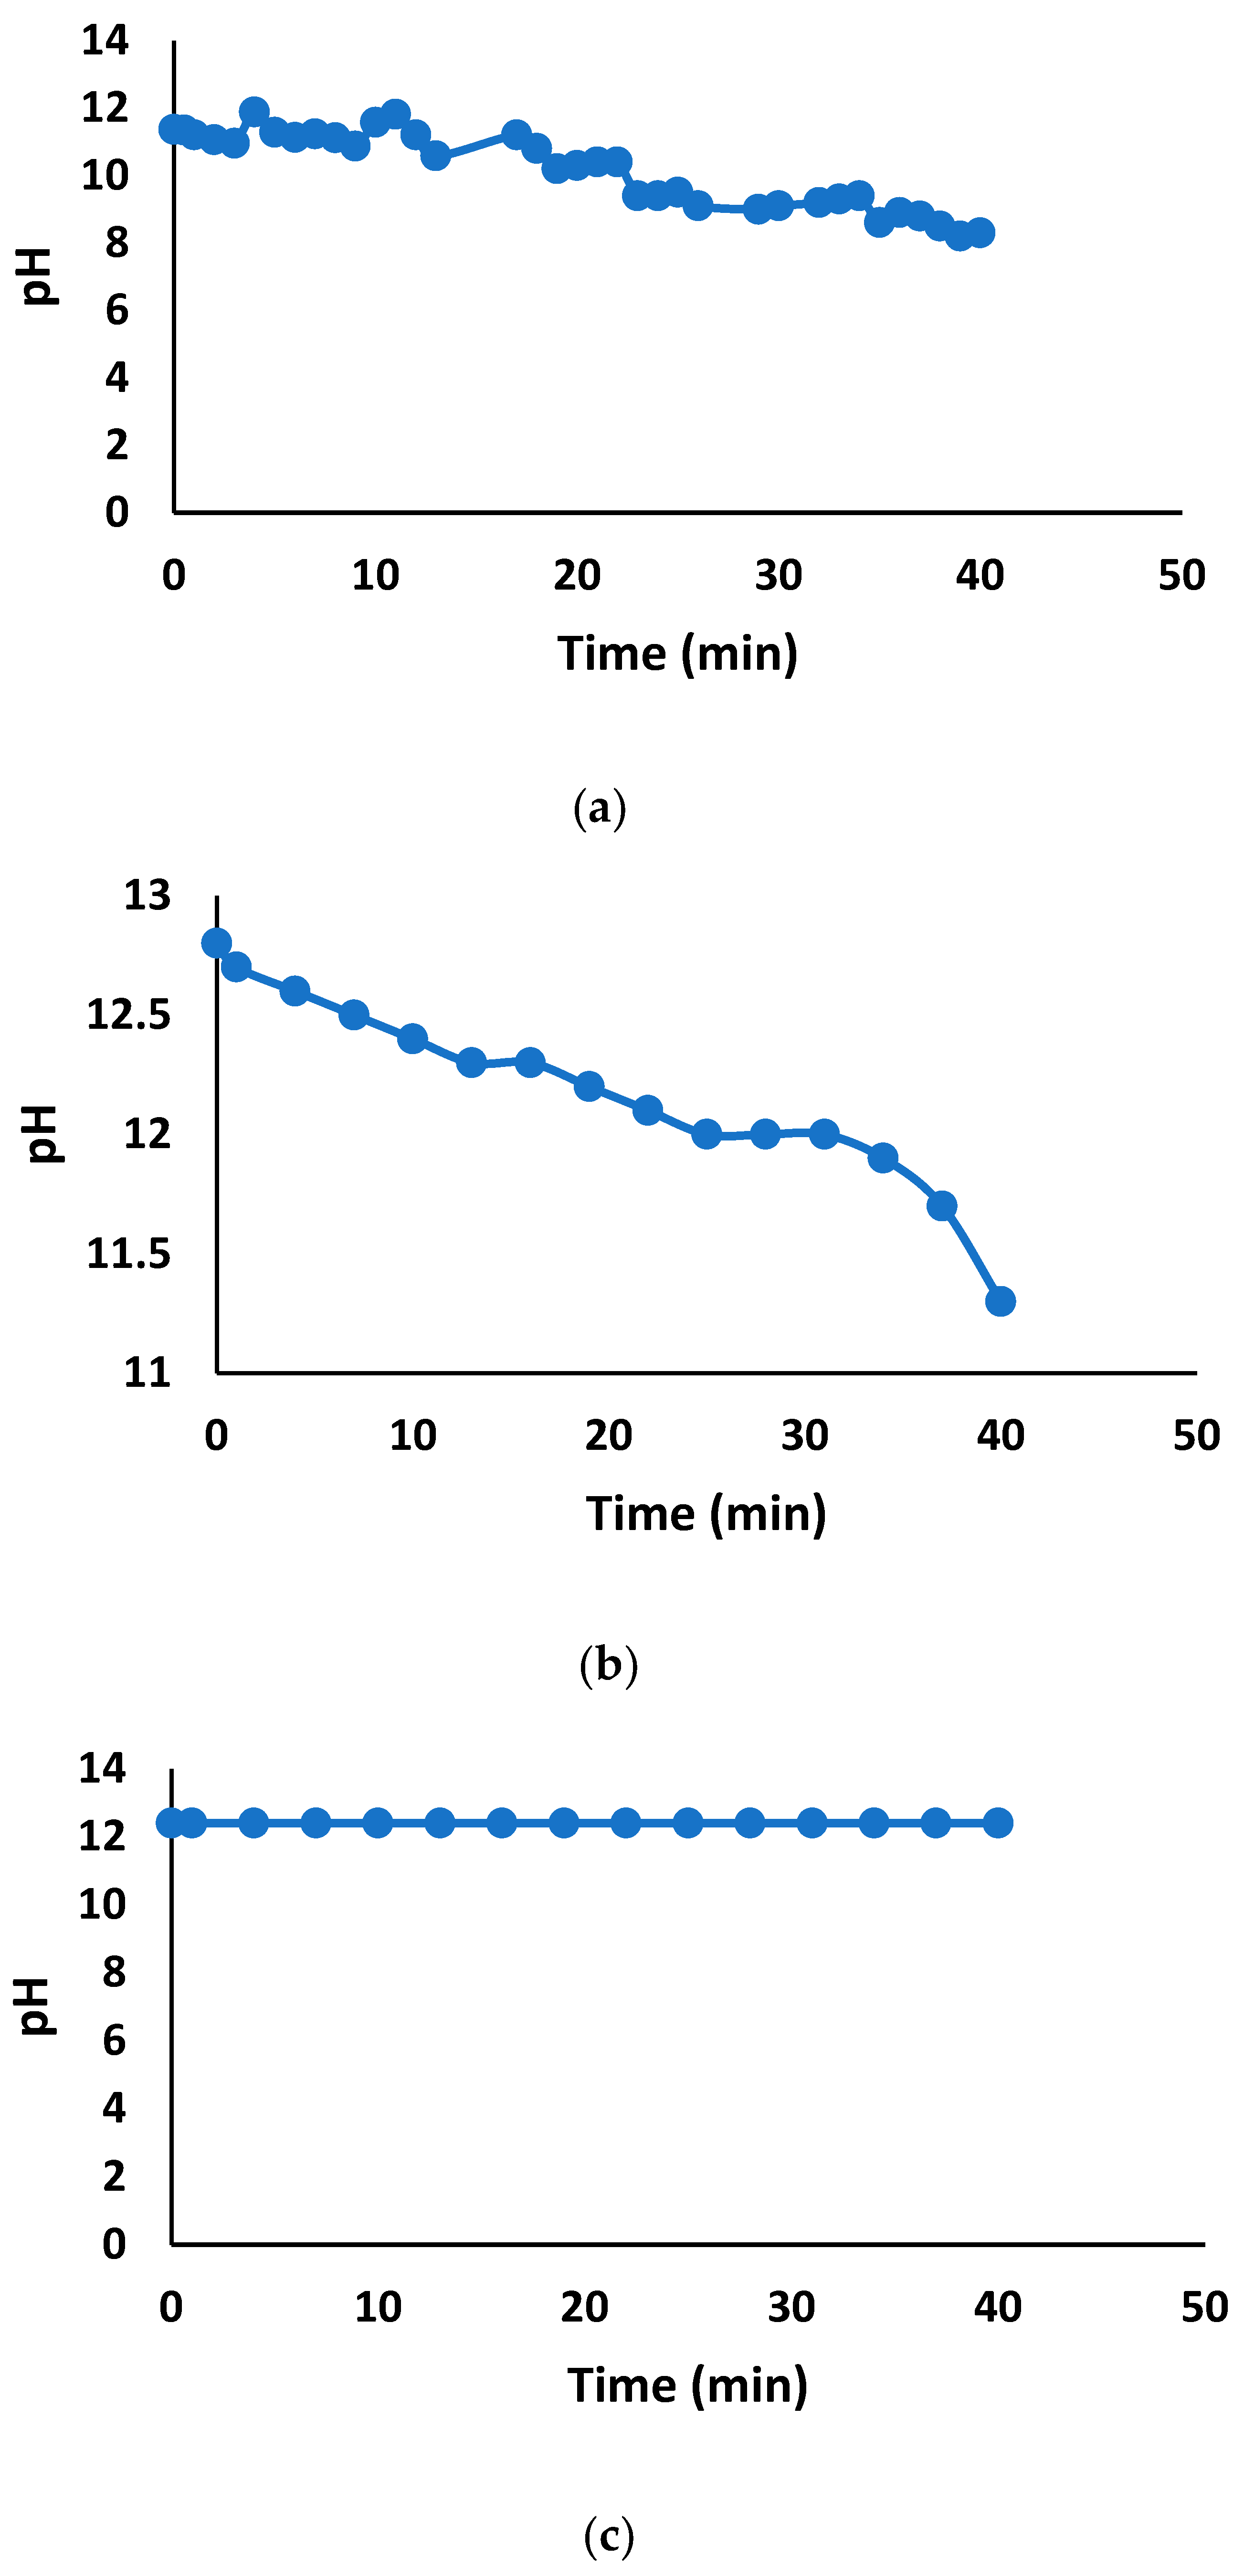
3.2.2. pH Variation of Treated Water

The pH varies based on the amount of CO2 and the stage of the reaction, and reaching neutral pH is possible when enough CO2 is purged into the solution to shift the equilibrium towards bicarbonate and carbonic acid.
Initially, when CO2 is bubbled through NaOH, sodium carbonate (Na2CO3) is formed, resulting in a highly alkaline solution with a pH around 11–12. This reaction occurs as CO2 reacts with NaOH, forming Na2CO3 and water as explained above.
As more CO2 is added, the sodium carbonate undergoes further reaction to form sodium bicarbonate (NaHCO3), a weaker base, causing the pH to decrease to around 8–9.
Na2CO3 + CO2 + H2O → 2NaHCO3
This reaction could be related to the dissociation of carbonic acid (H2CO3) because CO2 dissolves in water and reacts with sodium carbonate. The relevant equilibrium constants for the formation of bicarbonate are as follows:
H2CO3 ⇌ HCO3 + H+ (K1 ≈ 4.3 × 10⁻⁷ mol/L (at 25 °C)
With continued CO2 introduction, the conversion of Na2CO3 to NaHCO3 further weakens the basicity of the solution. If excess CO2 is added, sodium bicarbonate can react with CO2 and water to form H2CO3. This weak acid dissociates in the solution, producing hydrogen ions (H+) and hydroxide ions (OH), which further neutralize the solution and bring the pH closer to neutral (pH 7).
NaHCO3 + CO2 + H2O → H2CO3 + Na+ + OH K2 ≈ 5.6 × 10⁻¹¹ mol/L (at 25 °C)
This sequence of reactions demonstrates how the equilibrium between carbonate, bicarbonate, and carbonic acid species shifts with increasing CO2, ultimately driving the pH from basic to neutral. It also highlights the buffering capacity of carbonate and bicarbonate ions in maintaining the pH equilibrium. These findings align with our goal of study for integrating CO2 sequestration with water quality improvement. The presence of calcium Ca2+ and Mg2+ ions in tap water led to carbonate formation, enhancing alkalinity, which demonstrated how mineral content affected CO2 capture efficiency.
The CO2 treated and untreated water samples were further analysed for the water composition analysis, as discussed in Section 3.4.

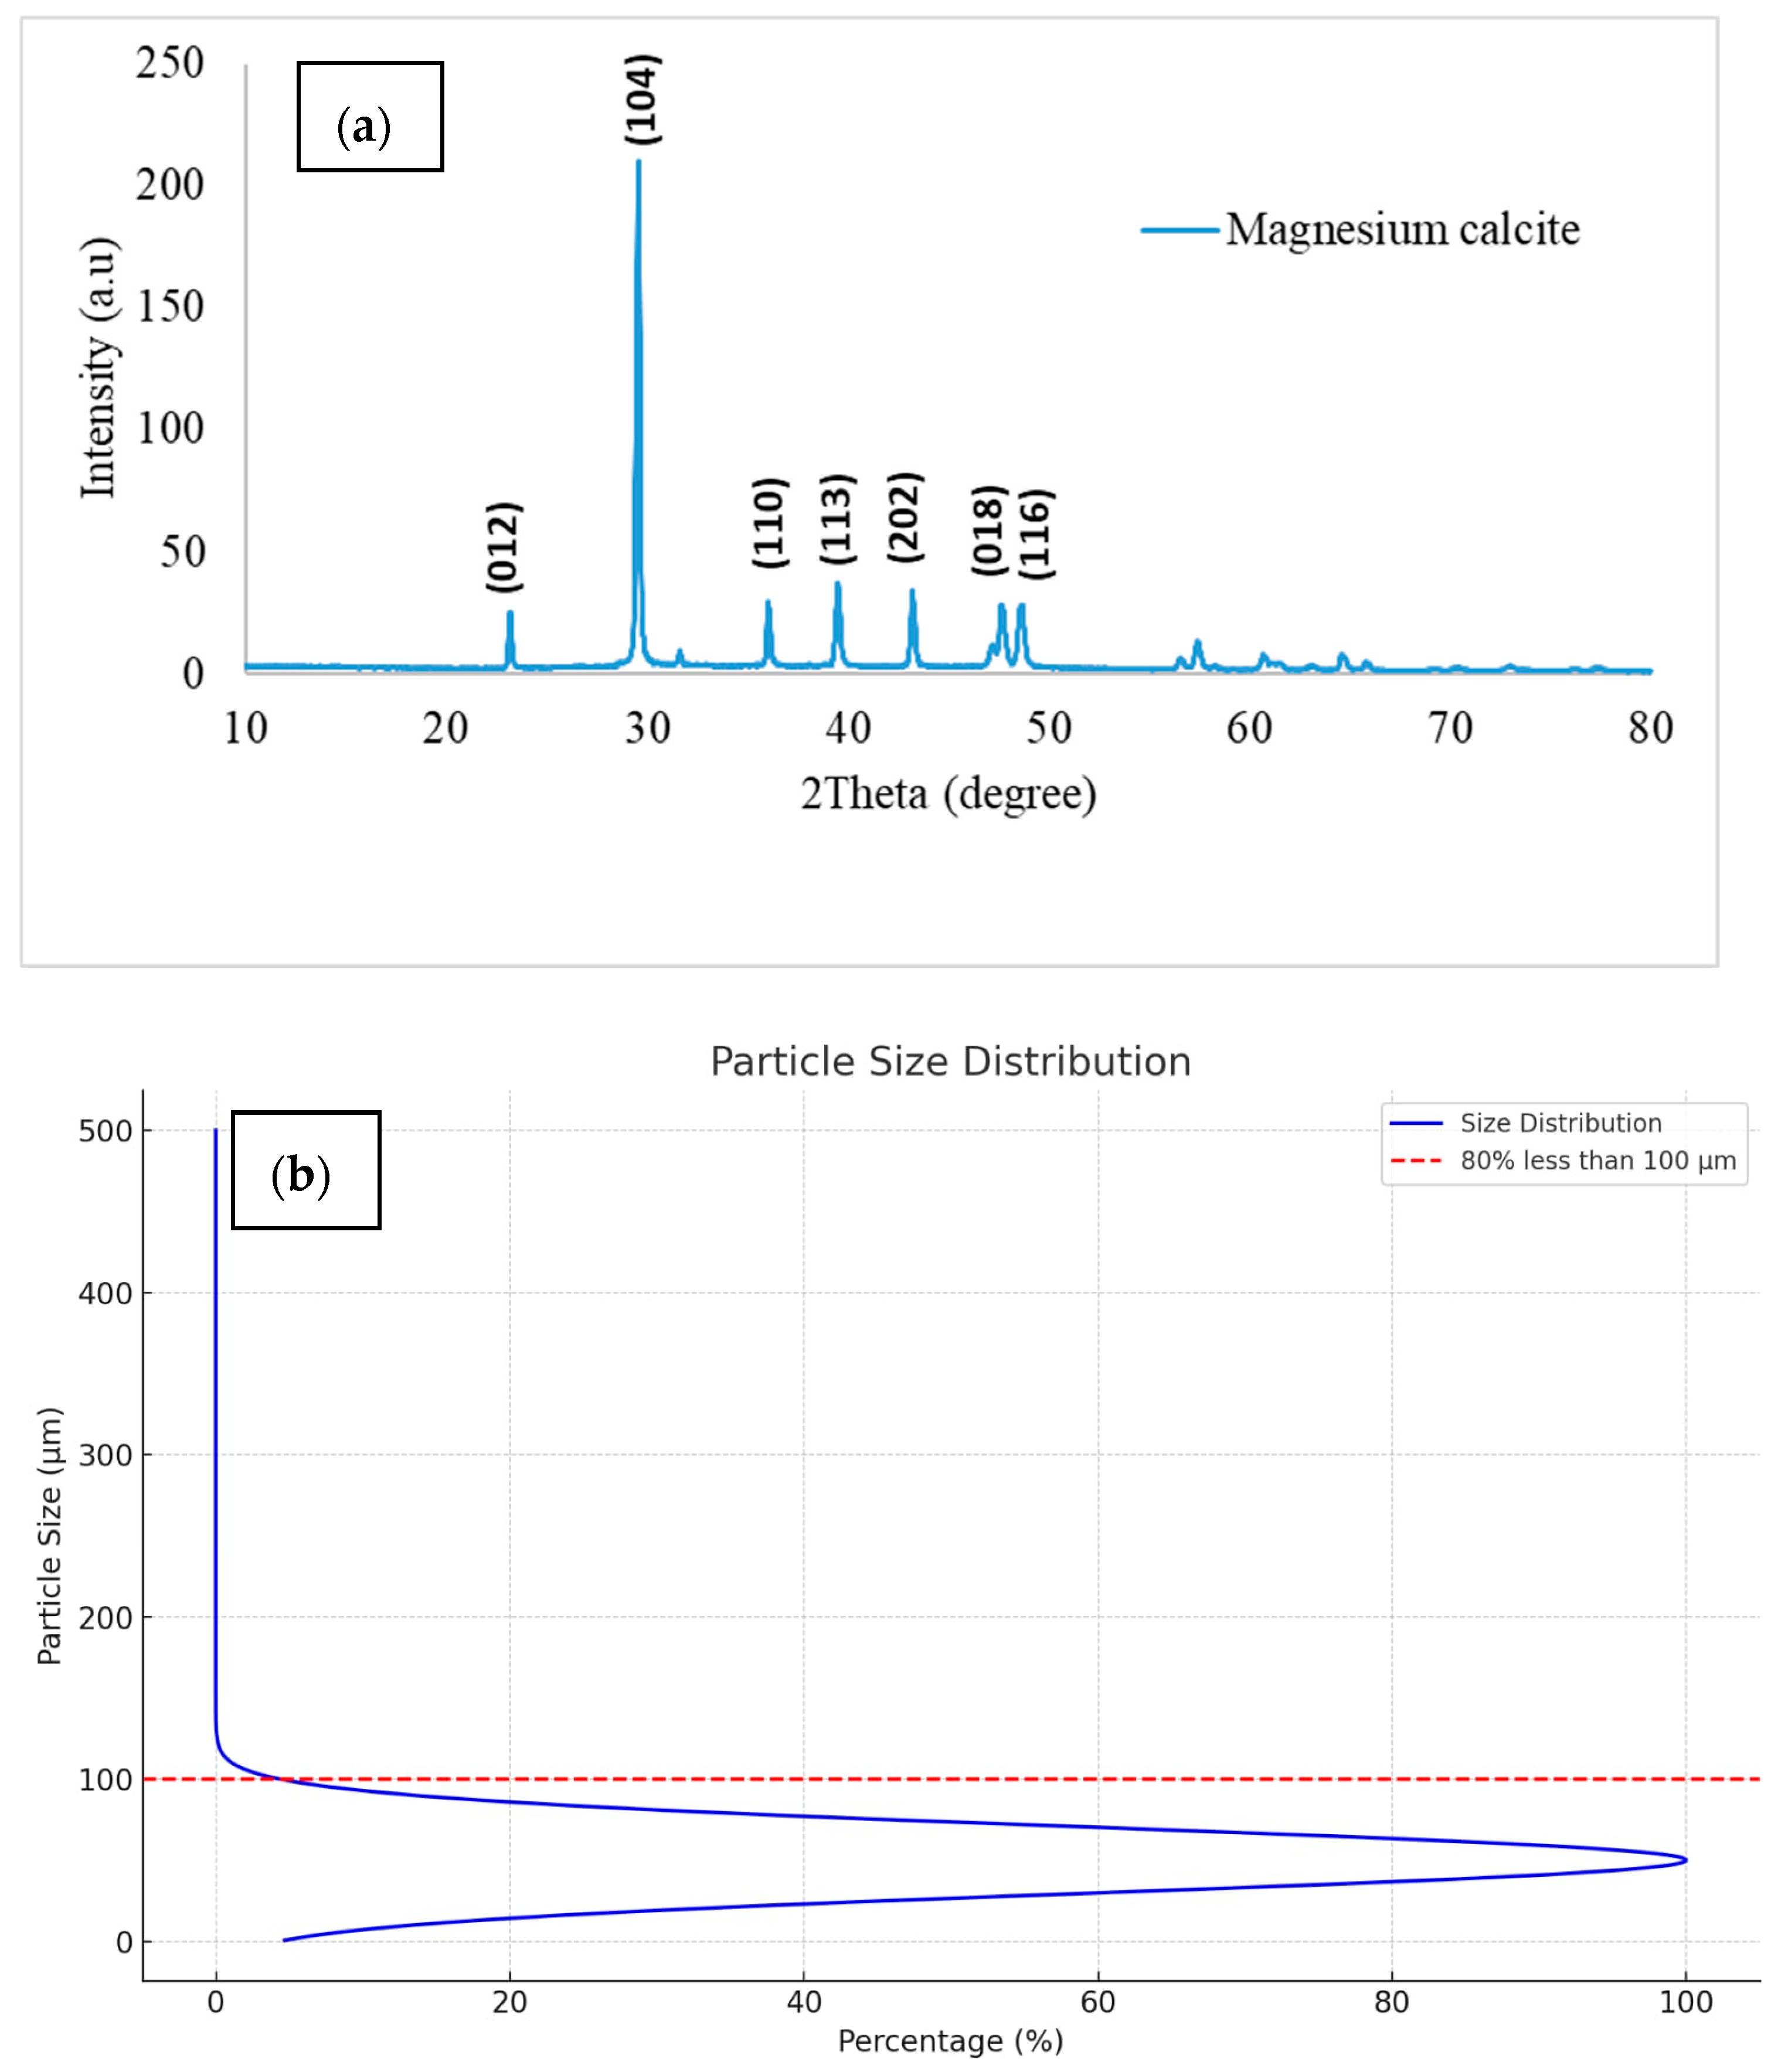
3.3. Material Characterization of the Precipitates

The white precipitate obtained during CO2 purging of NaOH prepared in tap water were analysed for the identification of crystalline phase by powder XRD analysis, as shown in Figure 10a. The diffractogram presented calcite structure with peaks (012), (104), (110), (113), (202), (018), (116), characteristic pattern for calcium calcite and magnesium calcite (JCPD # 01-086-2335 for Mg0.64Ca0.936CO3 & JCPD # 00-047-1443 CaCO3), which confirms the formation of CaCO3 and mixed magnesium-carbonate compounds. These are the insoluble minerals that precipitated from the solution due to the reaction of calcium and magnesium ions with CO2 [22,24]. These results also confirm that sodium bicarbonate was not observed in the precipitate because sodium bicarbonate (NaHCO3) and sodium carbonate (Na2CO3) are both soluble in water.
The particle size distribution of calcite particles was performed using DLS, as presented in Figure 10b. It clearly demonstrates that majority of particles have less than 100 µm size, indicating fine particle size distribution. The extended tail in the distribution curve shows that a small percentage of particles have been agglomerated so have significantly larger sizes.

3.4. Water Analysis of Treated Water

3.4.1. Water Alkalinity Testing

The results of the water analysis, presented as alkalinity and hardness in mg/L of CaCO3, are shown in Table 1. Methyl Orange Alkalinity represents the total alkalinity, meaning it includes all forms of alkalinity (bicarbonates, carbonates, and possibly hydroxides). Whereas phenolphthalein alkalinity measures the portion of total alkalinity due to carbonate (CO32−) and hydroxide (OH) ions.

Treated Tap Water

After CO2 purging, the total alkalinity remained high, indicating a significant contribution from both carbonate and bicarbonate ions. The presence of phenolphthalein alkalinity (501.00 mg/L) highlights a substantial amount of carbonate ions still present in the treated tap water. This is likely due to the interaction between NaOH and CO2, where carbonate species formed in the presence of Ca2+ and Mg2+ ions in the tap water.

Treated Deionized Water

The alkalinity of the treated deionized water was considerably lower, consisting predominantly of bicarbonate ions. The absence of phenolphthalein alkalinity (0.00 mg/L) confirms the lack of carbonate or hydroxide ions, as no mineral ions (e.g., Ca2+ or Mg2+) were available to promote carbonate formation during CO2 purging.

Untreated Tap Water

The untreated tap water exhibited moderate total alkalinity, primarily due to bicarbonate ions. The absence of phenolphthalein alkalinity indicates no significant presence of carbonate or hydroxide ions prior to treatment. The comparison between treated tap and deionized water reveals the influence of mineral content (especially Ca2+ and Mg2+) on water alkalinity. In tap water, these ions interact with CO2 and NaOH during treatment, resulting in the formation of carbonates and a higher overall alkalinity. Conversely, deionized water, which lacks these minerals, remains less alkaline, with only bicarbonate species contributing to its total alkalinity after treatment.

3.4.2. Water Conductivity Testing

To further confirm our understanding of water softening, we performed ionic conductivity measurements of treated tap water, as illustrated in Figure 11 and the reading intervals of one minute. The conductivity value of solution at the beginning of CO2 purging smoothly declines from 2.99 to 2.09 ± 0.27 mS/cm after 6 min, supporting the precipitation of Ca2+ and Mg2+ ions. This 30% reduction in conductivity suggests that dissolved metal ions are removed from the solution as carbonate precipitates, resulting in lower ionic conductivity.
This finding supports our conclusion that, using tap water for NaOH-based CO2 capture, not only reduces pH through carbonate and bicarbonate formation but also, to some extent, causes water softening by removing Ca2+ and Mg2+ ions, thus reducing its conductivity.

3.5. Comparision of Process Efficiency with the Reported Literature

The manuscript presents a comparative analysis of CO2 absorption using NaOH solutions, focusing on the dual benefits of CO2 capture and water treatment. The findings align with several prior studies, particularly in terms of CO2 removal efficiency using NaOH, but differ in methodology by incorporating ultra-microbubble technology, which enhanced gas-liquid interaction compared to previous systems reported in literature (Table 2). Our results demonstrated higher CO2 removal rates, significantly improving upon conventional NaOH-based methods.

4. Conclusions

According to the current study, there are several conclusions are drawn. The CO2 purging process affects NaOH-treated solutions differently based on the water source. In tap water, CO2 reacts with NaOH to form carbonate and bicarbonate ions, which then react with Ca2+ and Mg2+ ions to form insoluble precipitates (CaCO3 and MgCO3), reducing the total hardness of solution.
It was noted also that deionized water, lacking calcium and magnesium ions, does not form such precipitates upon CO2 purging, resulting in consistently low hardness.
There is a clear relationship between NaOH concentration, NaOH volume, CO2 absorption rate, and CO2 flow rate. Higher NaOH concentrations improve CO2 absorption, they also strengthen the buffering effect, leading to minimal pH variation. The higher Significant pH reduction was observed at a flow rate of 3 L/min after 6 min.
The use of a pilot-scale semi-batch column with an ultra-microbubble generator effectively reduced the CO2 capture time to 50% compared to conventional diffusers, demonstrating an efficient method for scale-up.
Using tap water to prepare the NaOH solution facilitated the precipitation of calcium and magnesium ions, which reduced water conductivity and total suspended solids (TDS), indicating an additional water purification benefit.
The formation of carbonate precipitates in the presence of Ca2+ and Mg2+ ions led to reduced pH, lower conductivity, and increased alkalinity in the solution. This demonstrates the significant influence of water composition on CO2 capture efficiency and provides a framework for optimizing NaOH-based CO2 capture methods across different water sources.
Our research findings highlight the dual benefits of NaOH-based CO2 capture, combining CO2 mitigation with water treatment, which can serve as a sustainable approach for environmental remediation. While NaOH is an effective reagent for CO2 capture, its long-term sustainability remains a challenge due to energy-intensive production and continuous consumption. Exploring alternative alkaline sources like industrial byproducts or regenerative processes could make this approach more cost-effective and environmentally friendly. Integrating NaOH-based CO2 capture with renewable energy and circular economy strategies can help reduce its footprint and contribute to a more sustainable solution for carbon management.

Author Contributions

Conceptualization, S.A.A.; Methodology, S.F.; Software, S.K.A.-D. and H.N.H.; Investigation, S.K.A.-D.; Resources, D.H.A.A., S.S.A., A.A.A.F. and S.S.A.A.; Data curation, H.N.H.; Writing—original draft, S.A.A.; Writing—review & editing, S.K.A.-D., S.F., R.H.H. and G.H.; Project administration, H.N.H. and R.H.H. All authors have read and agreed to the published version of the manuscript.

Funding

This research was funded by the Deanship of Research and Graduate Studies at King Khalid University (grant no. RGP2/333/45). Also, this research was funded by the Ministry of Higher Education, Research and Innovation (MoHERI) funding URG Project-call 2024.

Data Availability Statement

The original contributions presented in this study are included in the article. Further inquiries can be directed to the corresponding authors.

Acknowledgments

The authors extend their appreciation to the Deanship of Research and Graduate Studies at King Khalid University for funding this work through Large Research Project under grant number RGP2/333/45. Also, the authors extend their appreciation to the University of Nizwa and Ministry of Higher Education, Research and Innovation (MoHERI).

Conflicts of Interest

Author: Salim S. Al Alawi is employed by the Oman Water and Wastewater Services Company; The remaining authors declare that the research was conducted in the absence of any commercial or financial relationships that could be construed as a potential conflict of interest.

References

  1. Cheng, J.; Zhu, Y.; Zhang, Z.; Yang, W. Modification and improvement of microalgae strains for strengthening CO2 fixation from coal-fired flue gas in power plants. Bioresour. Technol. 2019, 291, 121850. [Google Scholar] [CrossRef] [PubMed]
  2. Song, C.; Liu, Q.; Qi, Y.; Chen, G.; Song, Y.; Kansha, Y.; Kitamura, Y. Absorption-microalgae hybrid CO2 capture and biotransformation strategy—A review. Int. J. Greenh. Gas Control. 2019, 88, 109–117. [Google Scholar] [CrossRef]
  3. Tu, R.; Jin, W.; Han, S.-F.; Zhou, X.; Wang, J.; Wang, Q.; He, Z.; Ding, W.; Che, L.; Feng, X. Enhancement of microalgal lipid production in municipal wastewater: Fixation of CO2 from the power plant tail gas. Biomass Bioenergy 2019, 131, 105400. [Google Scholar] [CrossRef]
  4. Nugroho, M.A.; Susanto, Y.B.; Kamilah, V.L.; Prameswari, R. Carbon Dioxide (CO2) Absorption Process Using Sodium Hydroxide (NaOH) IPTEK. J. Eng. 2023, 9, 30–34. [Google Scholar]
  5. Kwak, H.S.; Kim, J.Y.H.; Woo, H.M.; Jin, E.; Min, B.K.; Sim, S.J. Synergistic effect of multiple stress conditions for improving microalgal lipid production. Algal Res. 2016, 19, 215–224. [Google Scholar] [CrossRef]
  6. Guo, Y.; Niu, Z.; Lin, W. Comparison of removal efficiencies of carbon dioxide between aqueous ammonia and NaOH solution in a fine spray column. Energy Procedia 2011, 4, 512–518. [Google Scholar] [CrossRef]
  7. Ye, W.; Huang, J.; Lin, J.; Zhang, X.; Shen, J.; Luis, P.; Van der Bruggen, B. Environmental evaluation of bipolar membrane electrodialysis for NaOH production from wastewater: Conditioning NaOH as a CO2 absorbent. Sep. Purif. Technol. 2015, 144, 206–214. [Google Scholar] [CrossRef]
  8. Institute of Metallurgy and Ore Beneficiation; Kenzhaliyev, B.; Temirova, S.; Fisher, D.; Baltabekova, Z. Removal of hexavalent chromium from aqueous solutions by sorption with activated carbon. Review. Vestnik Kazn. 2024, 146, 8–16. [Google Scholar] [CrossRef]
  9. Abdykadyrov, A.; Abdullayev, S.; Tashtay, Y.; Zhunussov, K.; Marxuly, S. Purification of surface water by using the corona discharge method. Min. Miner. Deposits 2024, 18, 125–137. [Google Scholar] [CrossRef]
  10. Darmana, D.; Henket, R.L.B.; Deen, N.G.; Kuipers, J.A.M. Detailed modelling of hydrodynamics, mass transfer and chemical reactions in a bubble column using a discrete bubble model: Chemisorption of CO2 into NaOH solution, numerical and experimental study. Chem. Eng. Sci. 2007, 62, 2556–2575. [Google Scholar] [CrossRef]
  11. Dhakshinamoorthy, A.; Navalon, S.; Corma, A.; Garcia, H. Photocatalytic CO2 reduction by TiO2 and related titanium containing solids. Energy Environ. Sci. 2012, 5, 9217–9233. [Google Scholar] [CrossRef]
  12. Hong, J.; Zhang, W.; Ren, J.; Xu, R. Photocatalytic reduction of CO2: A brief review on product analysis and systematic methods. Anal. Methods 2013, 5, 1086–1097. [Google Scholar] [CrossRef]
  13. Kordylewski, W.; Sawicka, D.; Falkowski, T. Laboratory tests on the efficiency of carbon dioxide capture from gases in naoh solutions. J. Ecol. Eng. 2013, 14, 54–62. [Google Scholar] [CrossRef]
  14. Tavan, Y.; Hosseini, S.H. A novel rate of the reaction between NaOH with CO2 at low temperature in spray dryer. Petroleum 2017, 3, 51–55. [Google Scholar] [CrossRef]
  15. Salmón, I.R.; Cambier, N.; Luis, P. CO2 capture by alkaline solution for carbonate production: A comparison between a packed column and a membrane contactor. Appl. Sci. 2018, 8, 996. [Google Scholar] [CrossRef]
  16. Pichler, T.; Stoppacher, B.; Kaufmann, A.; Siebenhofer, M.; Kienberger, M. Continuous Neutralization of NaOH Solution with CO2 in an Internal-Loop Airlift Reactor. Chem. Eng. Technol. 2021, 44, 38–47. [Google Scholar] [CrossRef]
  17. Yan, H.; Zhang, G.; Liu, J.; Li, G.; Wang, Y. Highly efficient CO2 adsorption by imidazole and tetraethylenepentamine functional sorbents: Optimization and analysis using response surface methodology. J. Environ. Chem. Eng. 2021, 9, 105639. [Google Scholar] [CrossRef]
  18. Jagannathan, T.; Chandramouli, A.; Ramachandran, K.; Dev, S.; Devi, E.L.; Sharma, K.; Rajamani, C. Use of drone with sodium hydroxide carriers to absorb carbon dioxide from ambient air. J. Emerg. Investig. 2021, 4, 1–5. [Google Scholar] [CrossRef]
  19. Sadewo, R.P.; Hidhayati, N.; Ambarsari, L.; Anam, K. CO2 Sequestration Using Sodium Hydroxide and Its Utilization for Chlorella sorokiniana Biomass Production. Biosaintifika J. Biol. Biol. Educ. 2022, 14, 391–399. [Google Scholar] [CrossRef]
  20. Kozlowski, A.M.; Hasani, M. Cellulose interactions with CO2 in NaOH(aq): The (un)expected coagulation creates potential in cellulose technology. Carbohydr. Polym. 2022, 294, 119771. [Google Scholar] [CrossRef]
  21. Lipps, W.C. Standard Methods for the Examination of Water and Wastewater, 24th ed.; WEF APHA AWWA, USA: Washington, DC, USA, 2022. [Google Scholar]
  22. Santos, H.S.S.; Nguyen, H.; Venâncio, F.Q.; Ramteke, D.; Zevenhoven, R.; Kinnunen, P. Mechanisms of Mg carbonates precipitation and implications for CO2 capture and utilization/storage. Inorg. Chem. Front. 2023, 10, 2507–2546. [Google Scholar] [CrossRef]
  23. Lucile, F.; Cézac, P.; Contamine, F.; Serin, J.-P.; Houssin, D.; Arpentinier, P. Solubility of Carbon Dioxide in Water and Aqueous Solution Containing Sodium Hydroxide at Temperatures from (293.15 to 393.15) K and Pressure up to 5 MPa: Experimental Measurements. J. Chem. Eng. Data 2012, 57, 784–789. [Google Scholar] [CrossRef]
  24. Altiner, M.; Yildirim, M. Production of precipitated calcium carbonate particles with different morphologies from dolomite ore in the presence of various hydroxide additives. Physicochem. Probl. Miner. Process. 2017, 53, 413–426. [Google Scholar] [CrossRef]
Figure 1. Schematic diagram of gas bubble column for CO2 capturing using NaOH solution and stone gas diffuser.
Processes 13 01259 g001
Figure 2. (a) Laboratory-made pilot scale gasification tower equipped with an ultra-fine bubble generating pump. (b) Picture of tap water with and without fine-bubbles.
Processes 13 01259 g002
Figure 3. Variation of solution pH for volume 2, 3 and 4 L of 0.05 M NaOH.
Processes 13 01259 g003
Figure 4. Variation of solution pH for volume 2 L of NaOH (a) 0.1 M NaOH (b) 0.2 M NaOH. (c) 0.3 M NaOH.
Processes 13 01259 g004
Figure 5. Variation of solution pH for volume 3 L of NaOH (a) 0.1 M NaOH (b) 0.2 M NaOH (c) 0.3 M NaOH.
Processes 13 01259 g005
Figure 6. Variation of solution pH for volume 4 L of NaOH (a) 0.1 M NaOH (b) 0.2 M NaOH (c) 0.3 M NaOH.
Processes 13 01259 g006
Figure 7. Variation of solution pH for volume 100 L of NaOH using pilot column of ultra-fine bubble (a) 0.1 M NaOH (b) 0.2 M NaOH (c) 0.3 M NaOH.
Processes 13 01259 g007
Figure 8. Variation of pH for 2 L volume of 0.1 M NaOH using deionized and tap water.
Processes 13 01259 g008
Figure 9. Precipitation during CO2 purging (a) NaOH solution prepared with tap water (b) Dried white precipitates obtained.
Processes 13 01259 g009
Figure 10. (a) Xray diffractogram of the white precipitate obtained during CO2 purging of NaOH prepared in tap water (b) Particle size distribution of obtained precipitates (calcite).
Processes 13 01259 g010
Figure 11. Ionic conductivity of treated tap water.
Processes 13 01259 g011
Table 1. Alkalinity and hardness in mg/L of CaCO3.
Water SampleTotal Alkalinity
Methyl Orange Alkalinity (as CaCO3)
Phenolphthalein Alkalinity (as CaCO3)Total Hardness (as CaCO3)
Untreated Tap Water369.80 mg/L0.00 mg/L340.40 mg/L
Treated Tap Water993.40 mg/L501.00 mg/L198.20 mg/L
Treated Deionized Water96.80 mg/L0.00 mg/L39.80 g/L
Table 2. Comparison of process efficiency with reported literature.
CO2 Absorption Efficiency (%)NaOH Concentration (M)CO2 Flow Rate (L/min)Process TypeKey FindingsReference
850.510Air-lift reactorBulk neutralizationPichler et al. (2021) [16]
ModerateNot mentionedNot mentionedEuler-Lagrange modelLarger bubble size, limited mass transferDarmana et al. (2007) [10]
850.5140Dreschel washersHigher NaOH concentrations improve efficiencyKordylewski et al. (2013) [13]
VariableNot specifiedNot specifiedSpray absorptionInverse relation between CO2 flow rate and absorptionNugroho et al. (2023) [4]
Significantly higher0.1–0.33–7Ultra-microbubble systemEnhanced gas-liquid interaction, dual environmental benefitsThis study
Disclaimer/Publisher’s Note: The statements, opinions and data contained in all publications are solely those of the individual author(s) and contributor(s) and not of MDPI and/or the editor(s). MDPI and/or the editor(s) disclaim responsibility for any injury to people or property resulting from any ideas, methods, instructions or products referred to in the content.

