Review

Overview of Carbon Emission Source Analysis and Measurement Methods in Energy-Consuming Parks

1
State Grid Sichuan Electric Power Research Institute, Chengdu 610000, China
2
Power System Security and Operation Key Laboratory of Sichuan Province, Chengdu 610000, China
3
State Grid Sichuan Electric Power Company, Chengdu 610000, China
4
School of Electrical Engineering and Information, Southwest Petroleum University, Chengdu 610000, China
*
Author to whom correspondence should be addressed.
Processes 2025, 13(4), 989; https://doi.org/10.3390/pr13040989
Submission received: 18 February 2025 / Revised: 20 March 2025 / Accepted: 24 March 2025 / Published: 26 March 2025
(This article belongs to the Topic CO2 Capture and Renewable Energy)

Abstract

:
High-energy-consuming parks, as the largest carbon emission sources in China, face challenges in their carbon accounting systems, including methodological diversity, ambiguous characteristics, and unclear emission baselines, which severely constrain the formulation of carbon emission reduction pathways. Concurrently, carbon measurement methodologies are susceptible to human factors. This paper systematically examines park typologies, boundaries, measurement scopes, and carbon emission characteristics, while reviewing existing carbon accounting methodologies along with their limitations. The study concludes by outlining practical implementation challenges of measurement technologies in high-energy-consuming parks, while envisioning next-generation measurement approaches integrating satellite data and AI technologies. A comparison with existing measurement methods can be made to verify the accuracy and provide a reference for promoting the low-carbon transformation of high-energy-consuming parks.

1. Introduction

The accelerating global climate crisis, driven predominantly by anthropogenic greenhouse gas emissions, necessitates urgent decarbonization interventions. As the world’s largest carbon emitter, China confronts particular challenges in mitigating sectoral emissions, with energy-intensive industries contributing 80% of national CO2 output (2016–2020). Sectoral analysis reveals electricity generation as the primary contributor (46.6%), followed by ferrous metal processing (18.9%) and composite industrial sources (18.1%) [1]. Industrial clusters—centralized hubs of energy-intensive production—constitute critical emission hotspots due to fossil fuel combustion processes across interconnected supply chains. Institutional responses to China’s 2020 dual carbon commitments (2030 peak/2060 neutrality) have catalyzed policy innovations, including the 2030 Carbon Peak Action Plan mandating sector-specific decarbonization roadmaps; enhanced emissions monitoring protocols under the 14th Five-Year Plan for Ecological Monitoring; and mandatory greenhouse gas reporting frameworks for high-emission enterprises. These regulatory advancements establish carbon quantification technologies as operational linchpins for achieving national climate targets. Particularly in industrial parks, precision measurement systems enable:
  • Real-time emission source identification;
  • Cross-sectoral carbon flow mapping;
  • Data-driven compliance verification [2].
Current research on carbon emissions from energy-intensive parks focuses on carbon measurement boundaries, carbon measurement methods, and low-carbon path planning. Reference [3] constructed the carbon emission inventory of Suzhou Industrial Park and used scenario analysis to analyze the carbon emissions from energy consumption in Suzhou Industrial Park. Reference [4] calculated the carbon emissions from waste treatment, compiled and improved the carbon emission inventory of Suzhou Industrial Park from the consumption perspective, and predicted the future carbon emissions in order to analyze the reduction potential. Reference [5] takes the Beijing Economic and Technological Development Area as the research object and establishes a comprehensive carbon emission inventory of the industrial park, covering energy consumption, industrial processes, and waste treatment. Reference [6] analyzes the whole life cycle carbon emission behavior of industrial parks, and introduces the three aspects of material consumption, equipment input, and carbon sinks on the basis of the previous carbon emission inventory, and establishes a more systematic carbon emission inventory of industrial parks. Reference [7] developed an accounting methodology and framework for high-energy-consuming parks in China based on enterprise-level data. Reference [8] categorizes the carbon emission sources of high-energy-consuming parks into energy consumption, industrial processes, and waste treatment, and proposes a corresponding carbon emission accounting method. Reference [9] calculated the life cycle carbon emissions of coal-fired power generation in China based on a life cycle model. Reference [10] investigated the measurement technique of carbon emissions from electricity, considering regional electricity trading based on the emission factor method. Reference [11] proposes an indirect carbon emission measurement method for power systems. Reference [12] started from the power generation side, and based on the carbon accounting method in the Guidelines for Accounting Methods and Reporting of Greenhouse Gas Emissions by Enterprises issued by the National Development and Reform Commission in 2015, the carbon emissions generated by coal-fired units were calculated in real time, which provided a reference for real-time continuous monitoring of the power generation side. References [13,14] proposed an electricity carbon emission calculation method considering green power trading from the user’s point of view based on the carbon flow tracking theory, quantifying the carbon emissions before and after the user’s participation in green power trading. Reference [15] explores the feasibility and optimization options for implementing an electrothermal carbon neutral energy-intensive park and establishes a framework for carbon neutrality in the park containing a mixed-integer linear programming energy optimization model. Reference [16] established a land–industry–carbon integration model and proposed a carbon peaking pathway for China’s energy-intensive parks. Reference [15] proposes the concept of a whole-process carbon footprint and, based on the virtual carbon flow transfer mechanism of multi-energy flow, proposes an optimization framework of a whole-process carbon footprint applicable to the integrated energy system of the park.
Realizing accurate carbon measurement in high-energy-consuming parks requires sorting out the characteristics of carbon emissions in the parks and mapping out the carbon emissions clearly in order to determine the carbon measurement scheme in the parks. In this paper, the current research status of carbon emission characteristics and measurement methods in energy-consuming parks is reviewed, and the existing problems are summarized. Finally, it looks forward to the development of carbon measurement technology in high-energy-consuming parks, and briefly describes the difficulties in the application of measurement technology in actual parks.

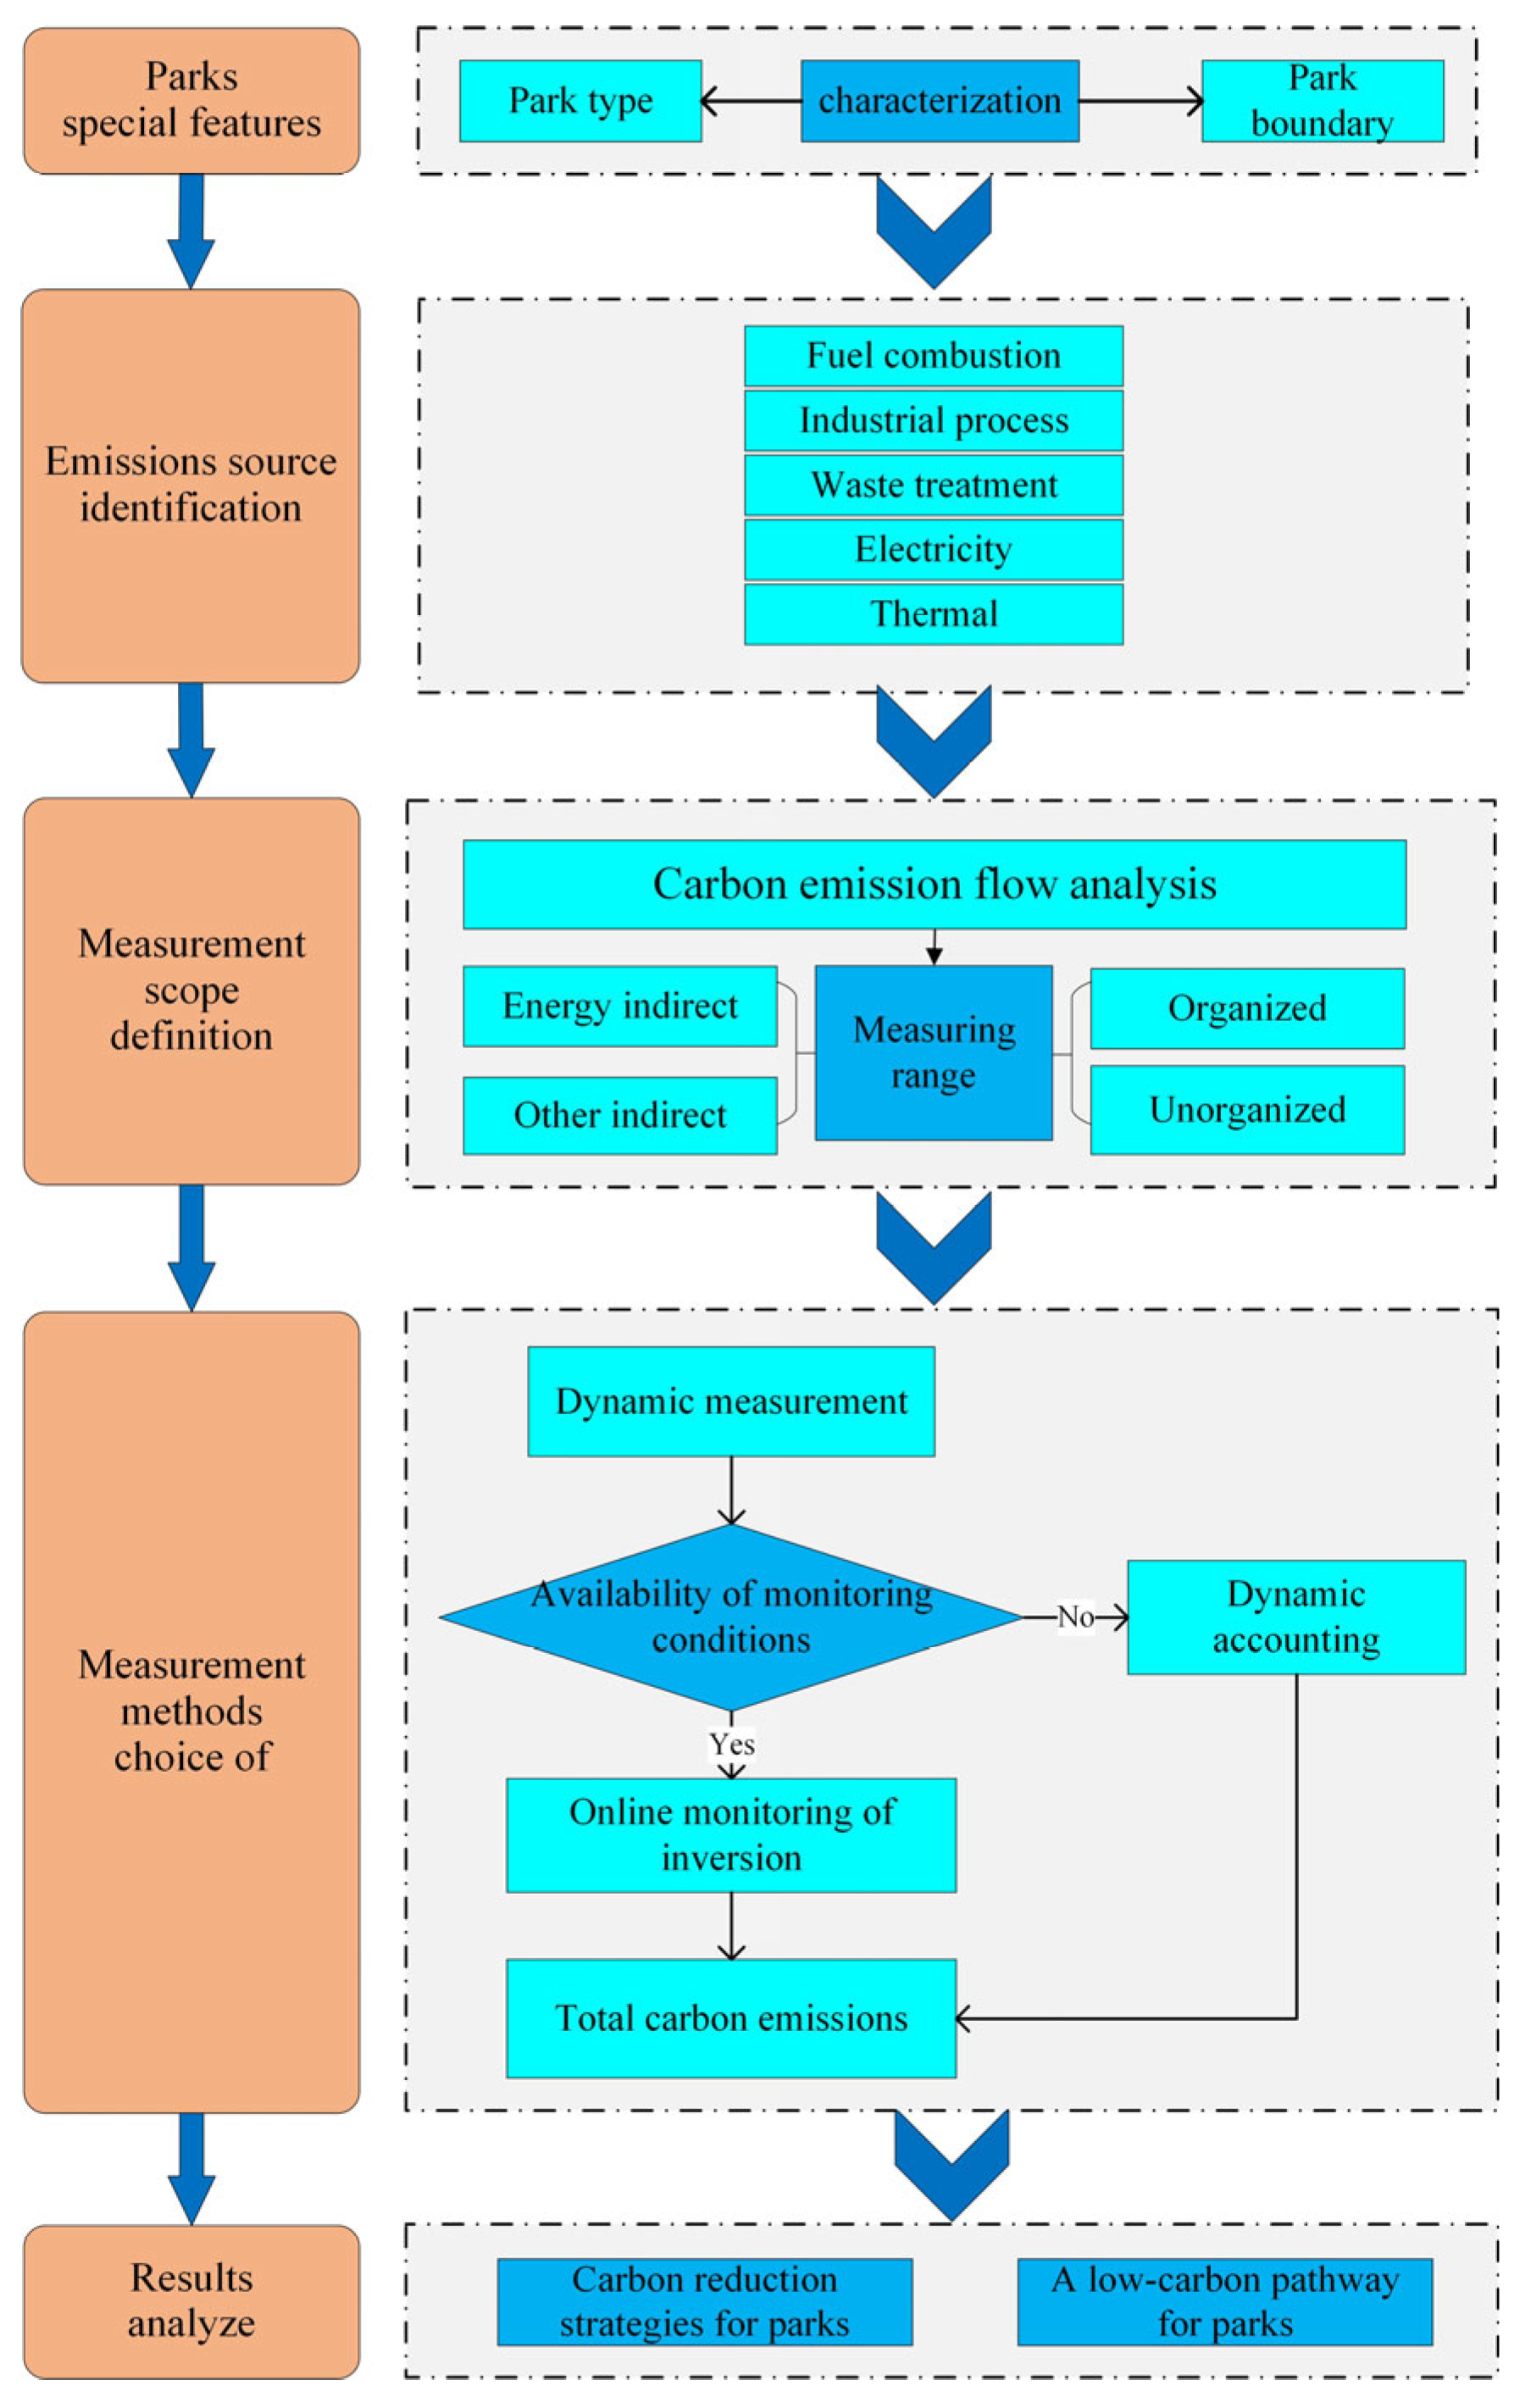
2. Characteristics of Energy-Consuming Parks

High-energy-consuming industrial parks are operationally defined as concentrated zones characterized by three principal attributes: elevated energy utilization rates, predominant clustering of energy-intensive industries, and substantial carbon footprints. The “Energy Efficiency Benchmark Standards for Key Sectors in High-Energy-Consumption Industries (2021)” establishes differentiated energy performance thresholds across industrial typologies, specifically:
Petrochemical parks: unit product energy consumption exceeding 1550 kg standard coal equivalent (SCE)/ton.
Chemical manufacturing parks: unit product energy consumption exceeding 2300 kg SCE/ton.
Ferrous metallurgy parks: unit product energy consumption exceeding 1770 kg SCE/ton.
Aluminum smelting complexes: unit product energy consumption exceeding 13,000 kg SCE/ton.
This section systematically examines high-energy-consuming industrial park defining characteristics through two analytical lenses: industrial typology classification and spatial demarcation parameters of park boundaries [17].

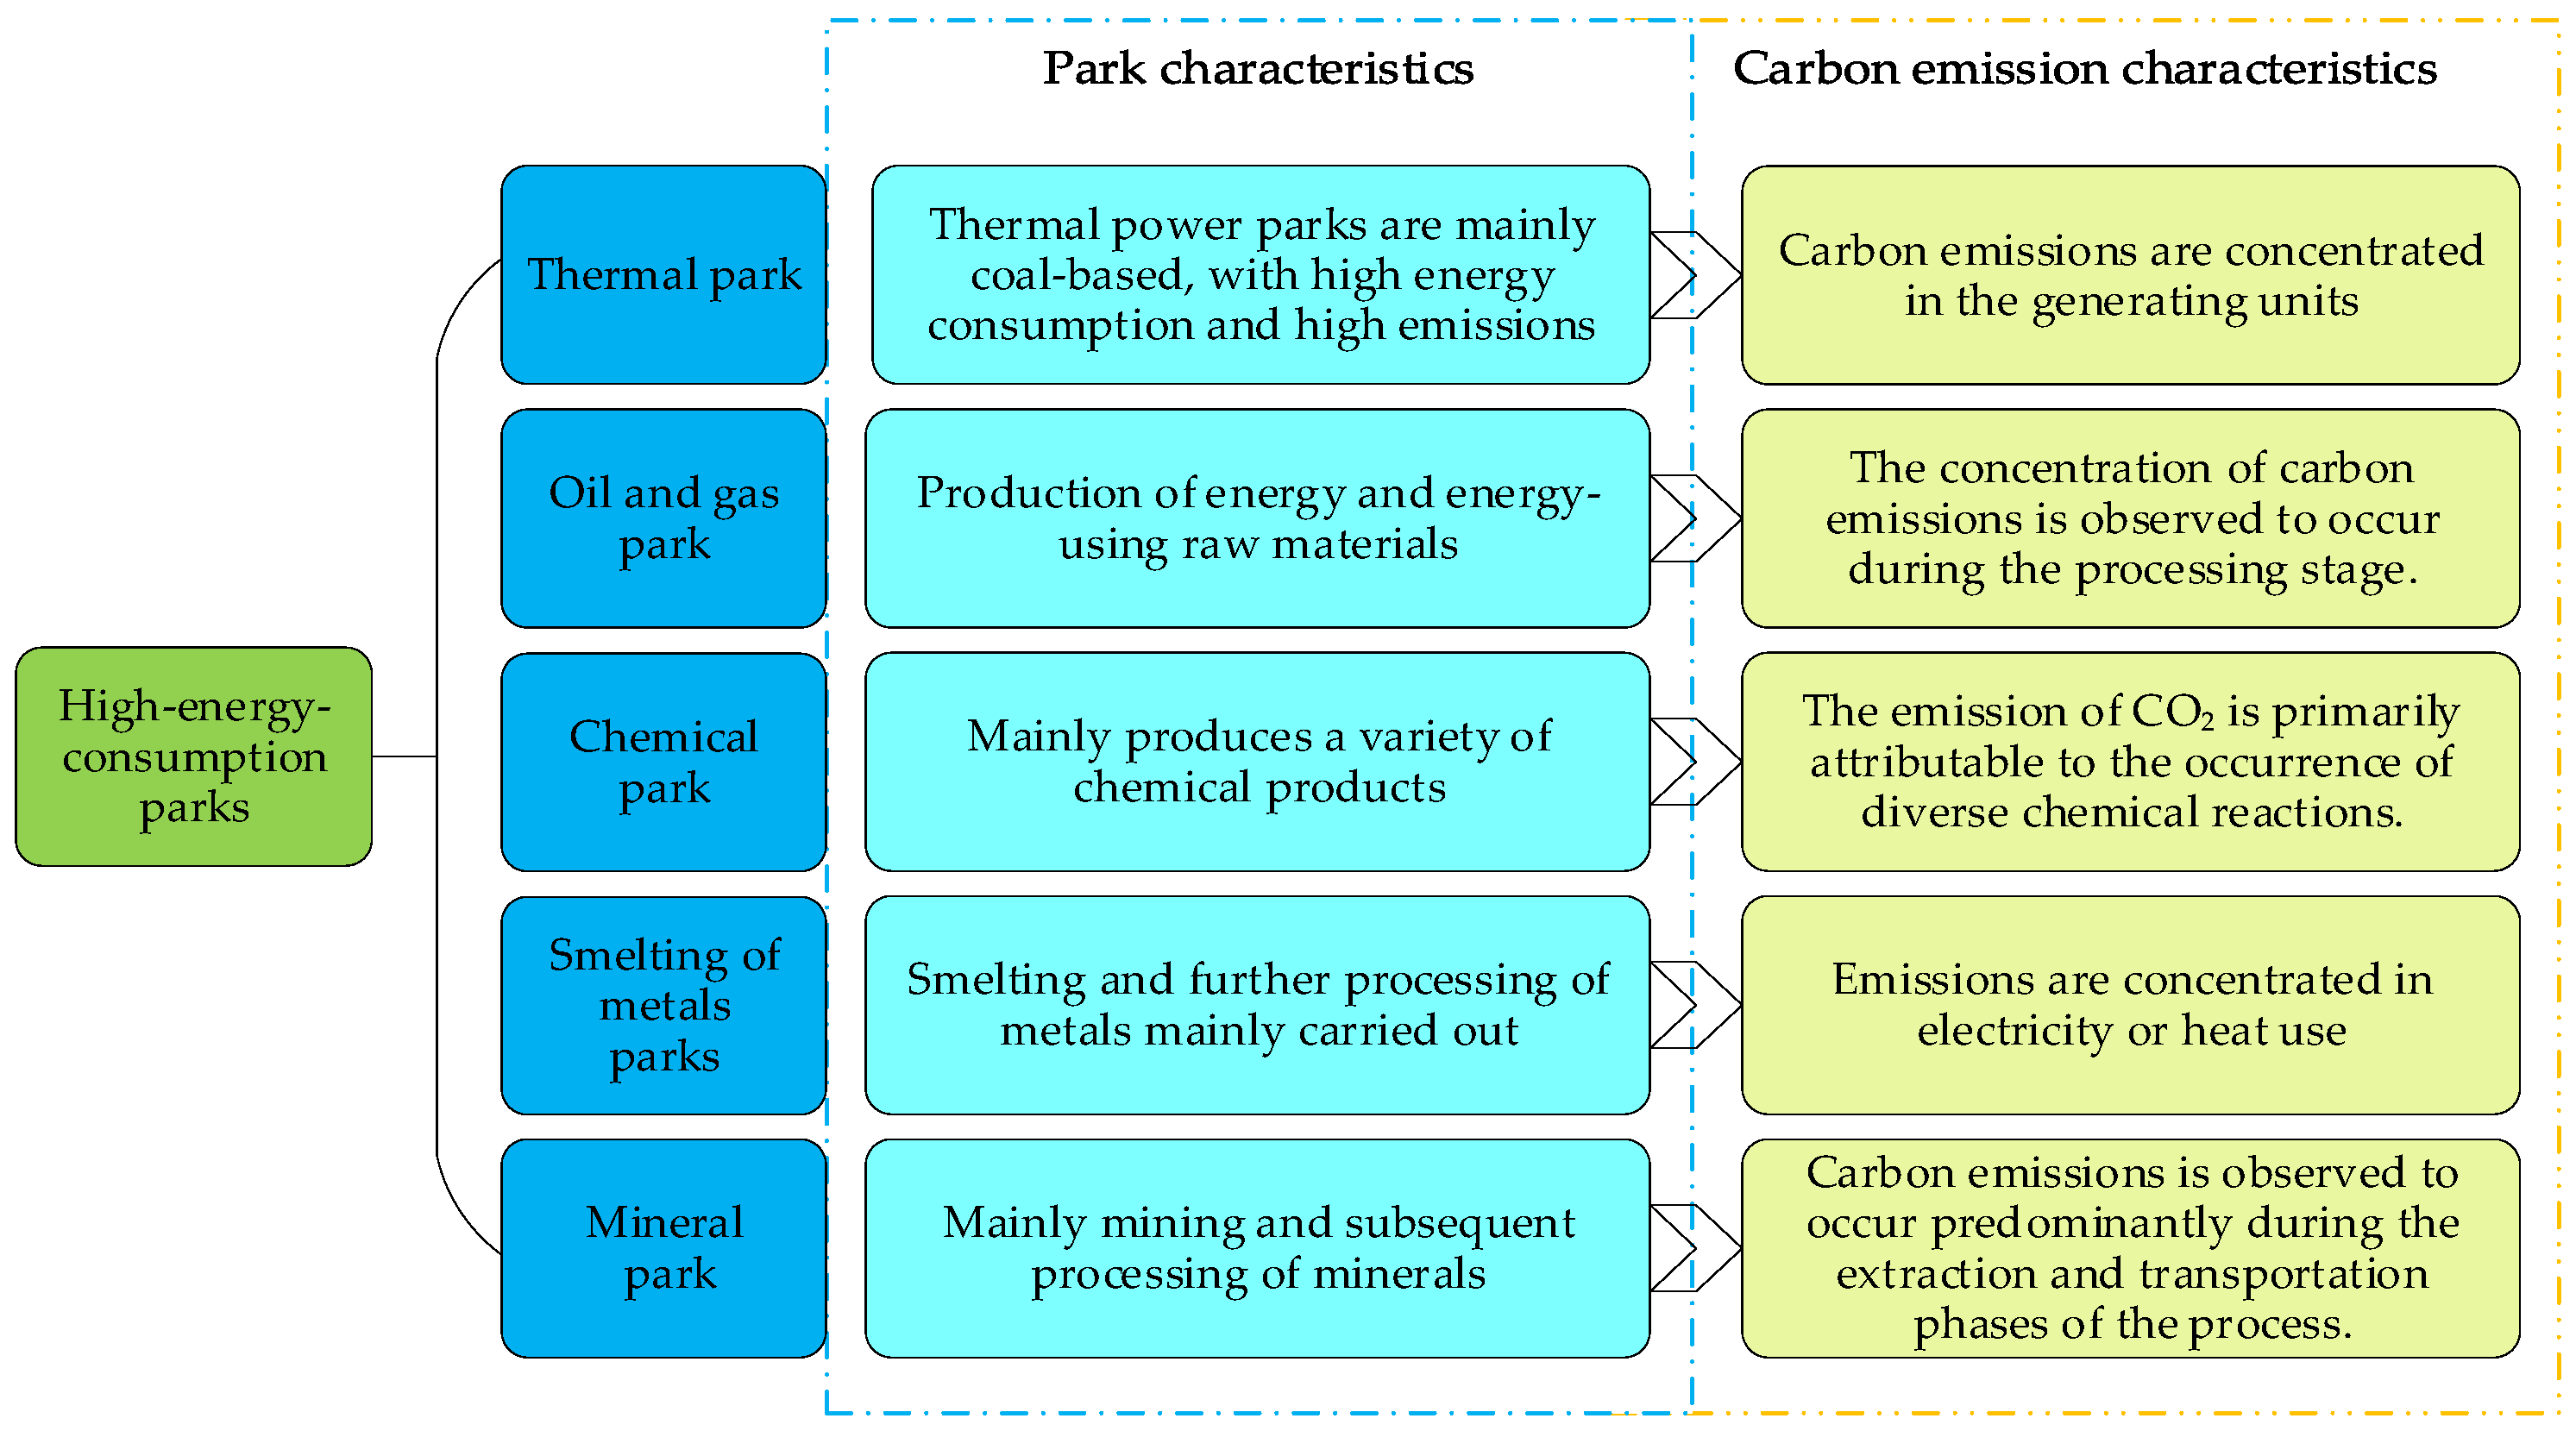
2.1. Types of Energy-Consuming Parks

High-energy-consuming parks emerge as an inevitable outcome of national manufacturing development, strategically designated through administrative zoning mechanisms to concentrate production factors and foster industrial clusters, in alignment with governmental economic planning imperatives. Consequently, high-energy-consuming parks serve dual roles as critical infrastructure for national manufacturing ecosystems and interdisciplinary nexuses integrating regional economies with industrial enterprises, exhibiting multilayered attributes spanning park-level governance, sectoral coordination, and corporate operations [18]. Empirical data from the National Bureau of Statistics reveal that the six most energy-intensive industries collectively contribute approximately 80% of China’s total carbon dioxide emissions, positioning high-energy-consuming parks as pivotal battlegrounds for achieving China’s Dual Carbon Targets (carbon peaking and carbon neutrality). Classification frameworks derived from the Statistical Report on National Economic and Social Development (2020) and intra-park industrial processes categorize high-energy-consuming parks into five archetypes: Thermal Power Generation Complexes; Petroleum Refining and Coking Facilities; Chemical Raw Material Production Bases; Metallurgical Processing Parks; and Non-Metallic Mineral Product Manufacturing Zones [19]. Figure 1 systematically delineates the typological taxonomy and distinguishing characteristics of these five high-energy-consuming park categories.

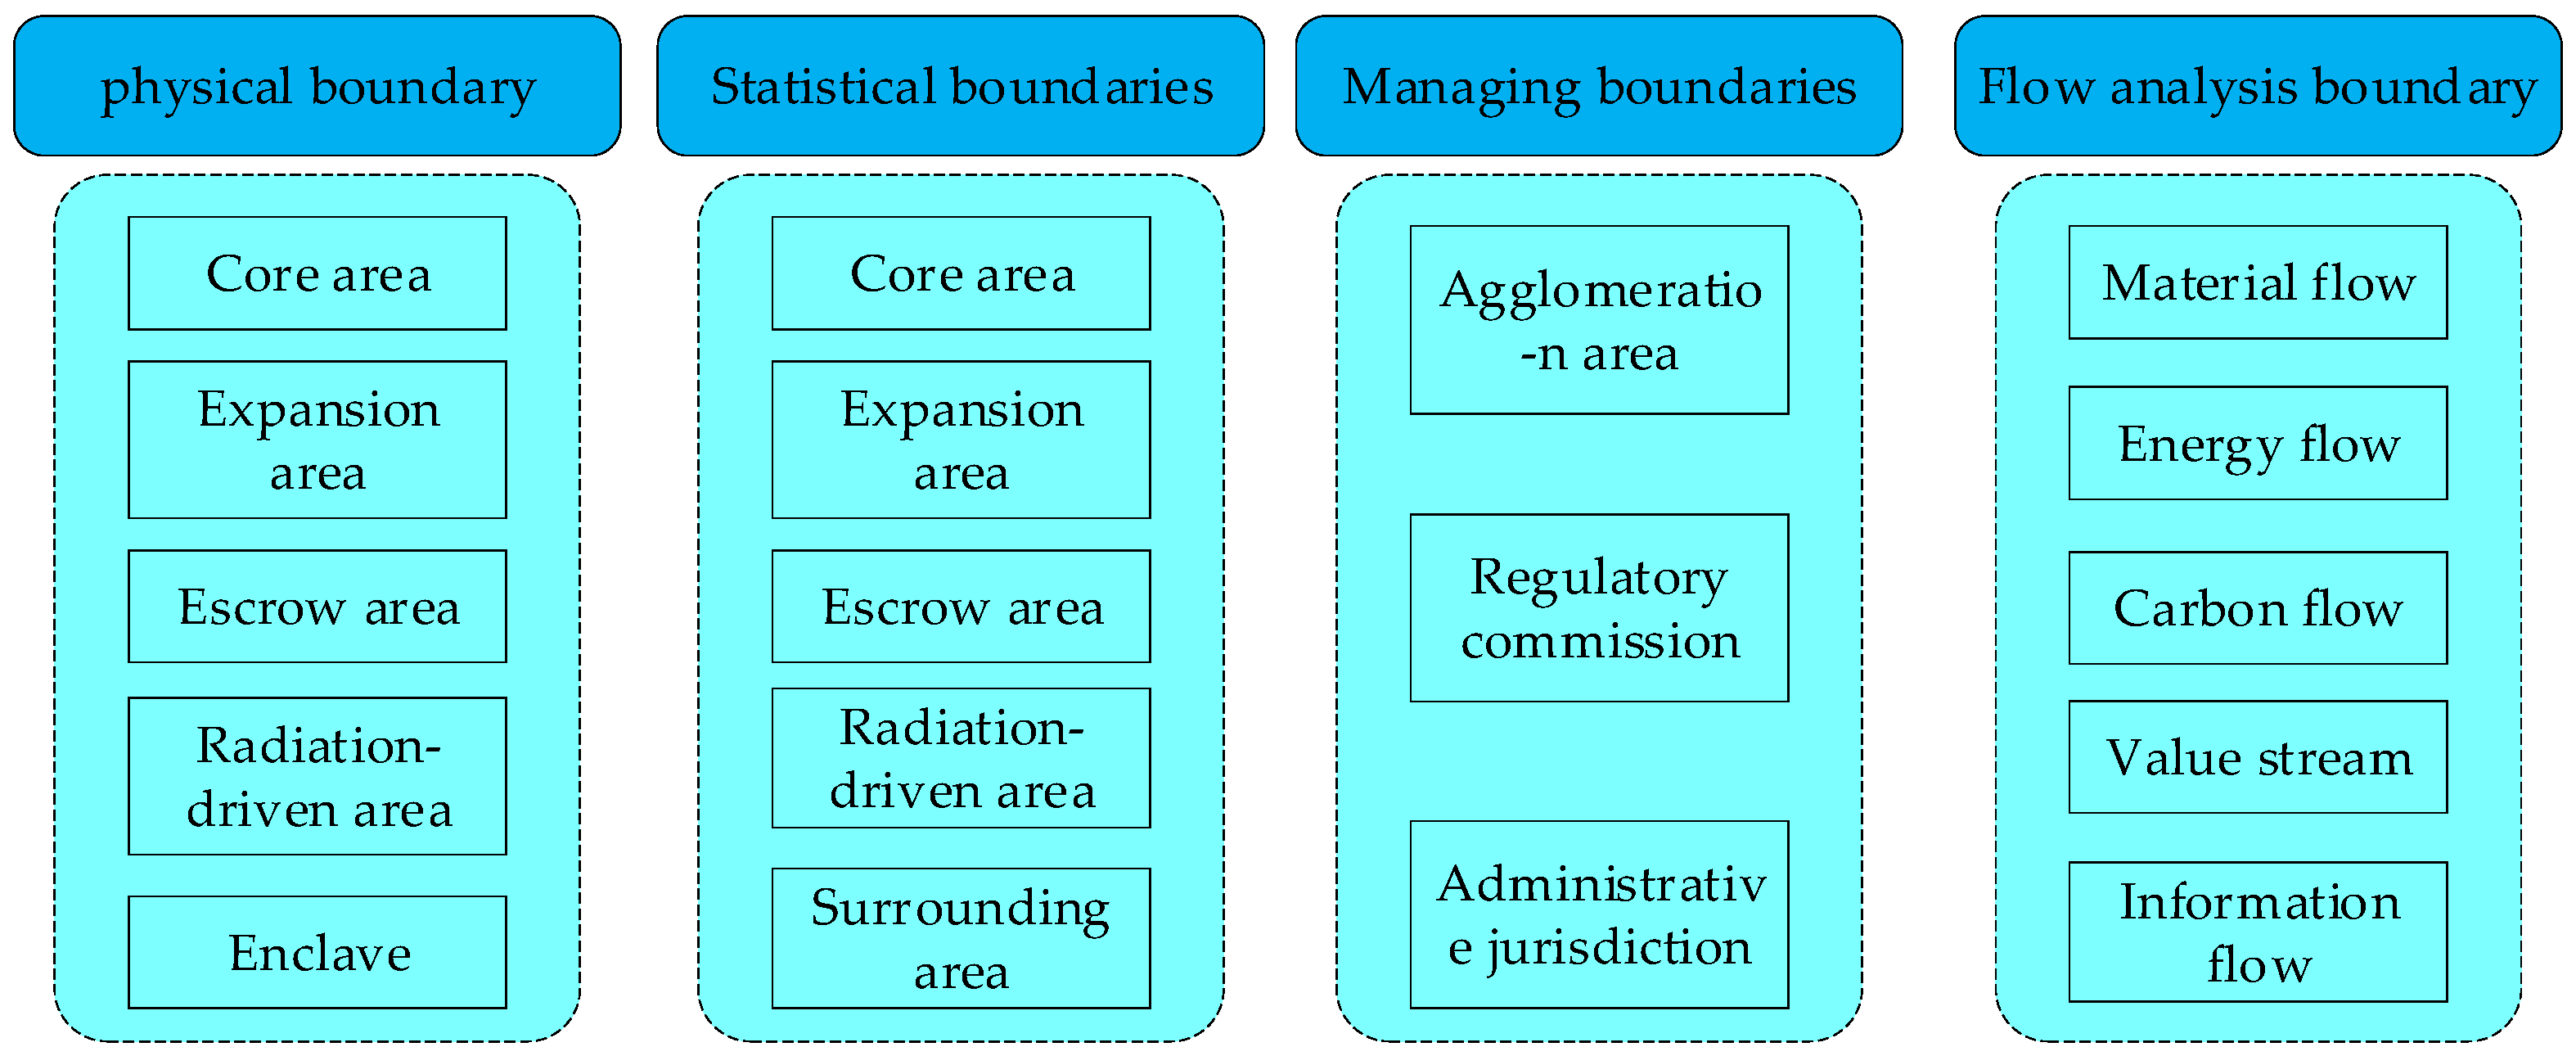
2.2. Boundary Demarcation of Energy-Consuming Parks

The boundaries of energy-consuming parks can be divided into four categories: physical boundaries, statistical boundaries, management boundaries, and “flow analysis” boundaries [20], as shown in Figure 2.
Physical boundaries refer to the geospatial scope of the park, including the core area, expansion area, entrusted escrow area, radiation-driven area, and an enclave with five parts [21]. In this case, the core area refers to the boundaries in the state-issued park directory, including the boundaries of the east, west, south, and north boundaries. The expansion area refers to the area of the park that is used to expand the scale of industries and increase investment. The delegated management area refers to an area that is delegated by a professional development company or management organization. The radiation-driven zone refers to the area around the park that is led and driven by the park to develop into a mutually supportive and win–win area with the park. An enclave is a separate area outside the boundaries of an energy-consuming park, but subject to the planning and management of that park. The actual area under the jurisdiction of the park has a variety of names and changes rapidly, and the actual footprint and boundary delineation are often unclear.
The statistical boundary refers to the area where the park is registered, including enterprises registered within the park but producing and operating outside the park in the course of the park’s development. Enterprises often choose to register in the park and actually carry out production and business activities outside the park due to a series of policies and incentives introduced by various provinces and cities. This leads to the separation of the place of registration of an enterprise from its actual place of business and confuses the demarcation of the boundaries of industrial parks.
The management boundary refers to the area jointly managed by the park and the local government, such as the city–industry integration zone, safety zone, environmental protection zone, social public affairs management zone, and other daily affairs operation and management zone. This promotes the co-development of energy-consuming parks and the economies of the places to which they belong, but makes it difficult to differentiate and blurs the boundaries of park management.
The “flow analysis” boundary refers to the boundary formed by the coupling of various energy flows, material flows, carbon emission flows, value flows, information flows, etc. within the energy-consuming park.

3. Carbon Emission Source Analysis in Energy-Consuming Parks

The systematic analysis of carbon emission profiles in high-energy-consuming parks constitutes a critical methodological foundation for subsequent carbon accounting protocol selection and decarbonization strategy formulation. This section delineates the carbon emission characteristics of high-energy-consuming parks through three critical analytical dimensions: Carbon Accounting Boundaries; Sector-Specific Emission Sources; and Spatial–Temporal Emission Distribution.

3.1. Scoping of Carbon Emissions Measurement

In the process of measuring carbon emissions in high-energy-consuming parks, in order to more accurately calculate the total amount of carbon emissions, it is necessary to define the scope of measurement of carbon emission sources in high-energy-consuming parks. There are a number of ways to categorize the scope of carbon emissions measurement according to different bases, and this section focuses on the methodology used in the text [22].
As shown in Figure 3, carbon emissions from energy-consuming parks can be categorized into direct and indirect emissions, where direct emissions are carbon emissions that originate within the accounting boundary, also known as “in-boundary emissions”. This includes emissions from the combustion of fossil fuels and emissions from industrial processes and internal waste disposal. Indirect emissions are carbon emissions that originate outside the accounting boundary but are caused by activities within the accounting boundary, also known as “transboundary emissions”. This includes emissions from purchased electricity and purchased heat.
This methodology strictly categorizes emission sources according to their geographical location and is widely used in carbon accounting at provincial, city, and enterprise levels. In order to ensure the consistency and universality of the accounting rules for high-energy-consuming parks, this paper is based on this classification and is also divided into direct and indirect carbon emissions when carrying out dynamic carbon emission accounting for high-energy-consuming parks.
Direct carbon emissions can be classified into two distinct categories based on emission pathways: organized and unorganized emissions. This taxonomy is particularly relevant for energy-consuming parks, where CO2 discharge mechanisms differ fundamentally depending on whether gaseous emissions are channeled through dedicated exhaust systems. Organized emissions refer to anthropogenic CO2 releases systematically conducted through engineered ventilation structures, such as chimney stacks or regulated exhaust systems. Typical examples include combustion processes in coal-fired or gas-powered boilers, where emissions are intentionally directed through designated flues. Conversely, unorganized emissions comprise fugitive CO2 releases that bypass controlled discharge mechanisms. These encompass diffusive emissions from exposed material surfaces in open storage areas; and unmitigated vehicular exhaust from internal combustion engines within facility premises and unregulated gaseous escapes through structural discontinuities or transient openings such as maintenance access points and improperly sealed portals.
Indirect carbon emissions can be categorized into energy-related indirect emissions and other indirect emissions. Energy-related indirect emissions refer to greenhouse gas emissions generated from energy consumed within the accounting boundary but produced outside of it, primarily including emissions from purchased electricity and heat supplies to meet operational demands. Other indirect emissions encompass carbon footprints embedded in externally sourced materials through their production, transportation, utilization, and end-of-life treatment phases. Particular emphasis should be placed on upstream and downstream activities in the value chain, including, but not limited to, raw material extraction, logistics operations, product usage patterns, and waste management processes. For instance, in industries such as fashion manufacturing or consumer electronics, over 80% of total emissions typically originate from these indirect sources within supply chain networks.
Relevant studies have shown that direct carbon emissions and indirect carbon emissions from energy sources are the main sources of carbon emissions in energy-consuming parks. As other indirect carbon emissions vary considerably from park to park, they need to be accounted for according to the actual situation in the park. The feasibility and simplicity of the accounting method are taken into account.

3.2. Analysis of Emission Sources in Five Typical Parks

Various major sources of emissions vary in different types of parks. This section describes the main sources of emissions from the five types of typical energy-consuming parks mentioned above and defines the main sources of emissions from energy-consuming parks in accordance with Section 3.1.

3.2.1. Thermal Parks

Thermal parks constitute major emission sources of atmospheric pollutants and greenhouse gases. According to the 2024 Technical Guidelines for Environmental Impact Assessment of Greenhouse Gas Emissions from Construction Projects in the Coal-fired Power Industry (Trial) (hereafter Guidelines), key emission sources in these parks include fossil fuel combustion, particularly coal combustion, contributing to 80% of total carbon emissions within such parks; energy consumption in production and auxiliary systems, where greenhouse gas emissions from coal-fired power projects encompass fossil fuels consumed by power generation boilers and supporting infrastructure; desulfurization/denitration processes, during which direct carbon emissions are generated through hydrolysis or pyrolysis reactions; and externally procured electricity and thermal energy. These emission sources collectively account for the primary carbon-intensive activities during normal operational phases of thermal parks [21]. As shown in Table 1.

3.2.2. Oil and Gas Parks

According to the 2015 Guidelines for Greenhouse Gas Emission Accounting and Reporting in China’s Petrochemical Enterprises (hereafter Guidelines) issued by the National Development and Reform Commission, emission sources in petroleum refining parks encompass fuel combustion emissions, process emissions, fugitive releases, and flare system discharges. Specific examples include natural gas combustion for heat supply and steam generation and flue gas emissions from captive power plants and thermal facilities. Greenhouse gas emissions in oil and gas parks primarily consist of CO2 and CH4. As illustrated in Table 2, emission distributions across industrial sectors are categorized into three phases: upstream processes (e.g., extraction and raw material preparation); midstream processes (e.g., refining and intermediate processing); and downstream processes (e.g., product distribution and end-use applications). The dominant emission sources derive from fossil fuel combustion and energy-intensive operations in refinery thermal/power systems, which collectively represent the most carbon-intensive activities within these industrial clusters.

3.2.3. Chemical Parks

Pollutants emitted from chemical parks primarily originate from chemical production processes and park infrastructure. The treatment of wastewater, waste gas, and solid waste, as well as the management of energy and environmental infrastructure within chemical parks, has reached a relatively advanced stage. However, the effective management of the “three wastes” (wastewater, waste gas, and solid waste) generated during production processes, along with the mitigation of persistent and difficult-to-biodegrade pollutants, remains a critical challenge. Addressing these issues is essential for achieving the green and high-quality development of chemical parks [23].
Carbon emission sources in chemical parks can be categorized into three main types:
(1)
Carbon in chemical compounds: Carbon is ubiquitous in chemical compounds, as most chemical reactions involve the transformation of functional groups, such as carbon–carbon bonds. The portion of carbon that does not integrate into the final product may form byproducts or waste. Consequently, carbon emission management in chemical parks is a dynamic process, heavily dependent on the specific product being manufactured and its structural characteristics.
(2)
Carbon in fuels: Carbon present in fuels, particularly those derived from fossil energy sources, typically undergoes chemical reactions (e.g., oxidation) that convert the chemical energy stored in these fuels into thermal energy. During this process, carbon is oxidized to carbon dioxide, which is considered the “unchanged component” in carbon emission management within chemical parks. Once fuel combustion infrastructure is operational, its processes and efficiencies become relatively fixed, leading to a direct correlation between carbon emissions and fuel consumption.
(3)
Life cycle carbon emissions: From a comprehensive life cycle perspective, the production, processing, and transportation of chemical raw materials and energy sources inevitably generate carbon emissions. These emissions constitute the carbon footprint of the raw materials and energy consumed within the park. For carbon categories I and II, the system boundary is confined to the park itself. However, for category III, particularly in the case of electricity and heat, it is necessary to account for upstream carbon emissions generated during their production processes.

3.2.4. Metal Smelting Parks

The metal smelting industry serves as a cornerstone of industrial development, contributing approximately 5% to the nation’s gross domestic product (GDP). This industry encompasses a wide range of activities, occupies a critical position within the industrial sector, and is a major consumer of natural resources. It plays a vital role in driving economic growth, fostering social progress, and generating employment opportunities. However, the metal smelting industry in China remains characterized by lengthy production processes and high carbon intensity. Currently, the sector accounts for approximately 15% of China’s total carbon emissions, ranking it among the highest-emitting industries [24]. Among the various emission sources, aluminum production is the most significant contributor, representing over 75% of the industry’s total emissions.
This section explores the primary sources of emissions within the metal smelting industry, with a specific focus on aluminum production. As depicted in Figure 4, the major sources of emissions from aluminum production parks include (1) emissions from fossil fuel combustion, (2) emissions resulting from energy use as a raw material, (3) emissions generated during the anode effect, and (4) emissions associated with the net purchased use of electricity and heat [25].

3.2.5. Non-Metallic Mineral Product Parks

The principal sources of carbon emissions within non-metallic mineral processing parks primarily stem from four key operational phases: mineral exploration and extraction, ore processing and metallurgical operations, stationary combustion processes, and mobile fossil fuel-powered vehicular activities [26]. When adopting conventional industrial classification parameters that define the mining sector as encompassing mineral prospecting, extraction, primary production, and fundamental processing activities, direct carbon emissions are restricted to those originating from exploration operations, excavation processes, and metallurgical transformation stages. Subsequent emissions generated through post-extraction utilization of mineral products—such as thermal coal combustion in power generation facilities or hydrocarbon consumption in transportation systems—fall under the classification of indirect emissions within this framework.
Notably, while the mineral development sector occupies an upstream position in the production chain relative to metallurgical and manufacturing industries, its direct emission profile demonstrates substantially lower magnitude compared to downstream processes including smelting operations, advanced material processing, and end-user consumption activities [27]. This emission disparity underscores the critical importance of adopting a comprehensive life cycle assessment approach when evaluating the environmental impacts of mineral resource utilization.

3.2.6. Scope of Measurement of Park Emission Sources

By synthesizing the information presented in the initial four sections, the primary emission sources associated with the five categories of typical parks are identified for carbon measurement in accordance with the methodology outlined in Section 2.1, as illustrated in Figure 5.

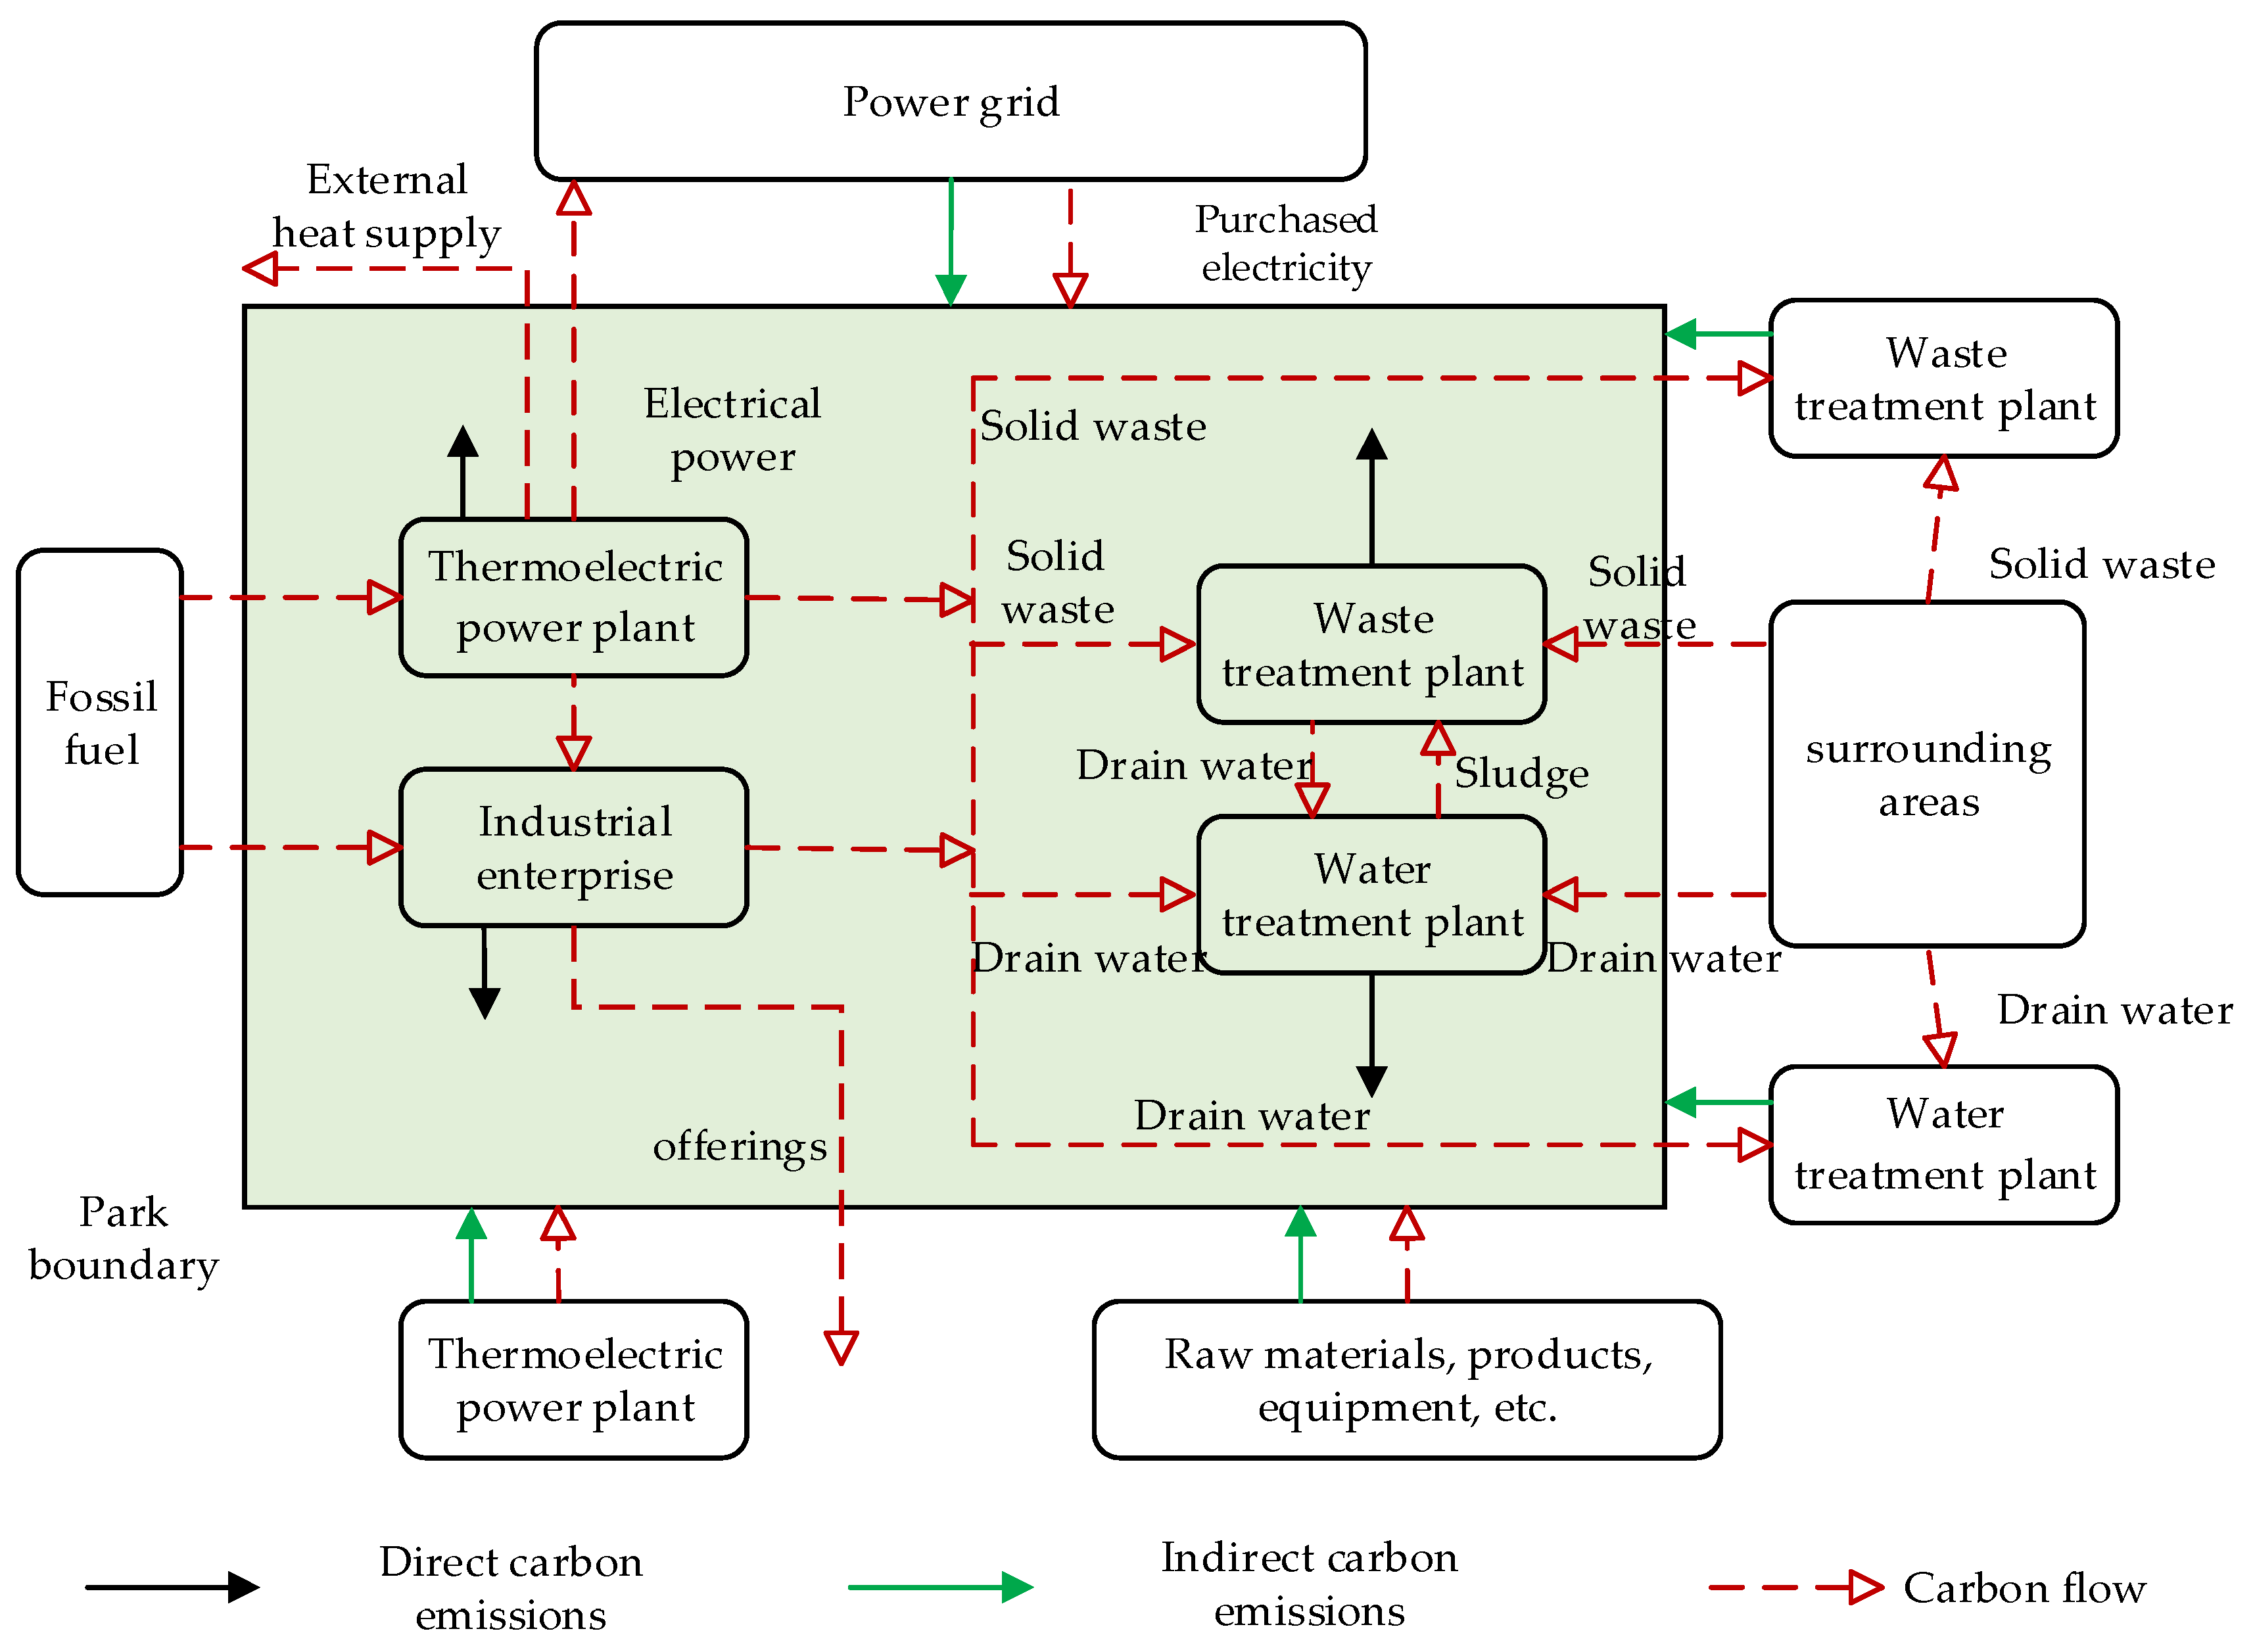
3.3. Carbon Emission Flow Analysis

In light of the aforementioned evidence, this section presents a comprehensive analysis of the sources and sinks of carbon flows and their pathways within a specified temporal framework in energy-consuming parks. It demonstrates that the carbon emissions between the primary entities in these parks follow the trajectories of energy flows, thereby establishing a general model of carbon flows in energy-consuming parks [11].
As illustrated in Figure 6, from the perspective of energy flow, energy-consuming parks procure electricity from the grid and import thermal energy from thermal power plants external to the park to facilitate the production activities of enterprises within the park. A cogeneration plant, situated within the park, not only provides the requisite heat for the park itself, but also offers services to businesses situated outside the park. During the industrial production process, enterprises within the park consume a variety of energy sources, including fossil fuels, electricity, and heat. The solid waste and wastewater generated are treated by the park’s waste treatment facilities and sewage treatment plants. Some of the waste is incinerated to generate electricity, which is converted into energy for reuse.
As delineated in Figure 7, carbon emissions at the carbon flow level derive predominantly from fossil fuel combustion in thermal power plants located within the industrial park. Concurrently, emissions attributable to on-site industrial enterprises arise from both stationary fossil fuel combustion and energy-intensive production processes. Notably, emissions originating from the waste treatment facility stem from solid waste management operations conducted within the park’s premises, while those from the wastewater treatment plant (WWTP) result from biochemical and mechanical treatment processes. These emission streams, directly tied to the park’s core operational infrastructure, fall within its jurisdictional boundaries and are thus categorized as direct carbon emissions. Significantly, emissions associated with externally linked systems—including grid electricity generation, off-site thermal power plants, and external waste/sewage treatment facilities—reside outside the park’s operational boundaries. However, such emissions retain indirect classification due to their causal relationship with the park’s demand for auxiliary energy and waste processing services. Specifically, these indirect emissions are intrinsically linked to fossil fuel combustion during electricity/heat generation and resource recovery processes necessitated by the park’s operational requirements. Consequently, under a lifecycle assessment framework, these externalized emissions are formally classified as indirect carbon emissions owing to their secondary but material connection to the park’s activities.

3.4. Generic Park Emission Sources and Scope of Measurement

As established in the preceding analysis, carbon emission sources within high-energy-consumption industrial parks have been systematically categorized into five principal classifications: (1) fossil fuel combustion emissions, (2) industrial process emissions, (3) waste treatment emissions, (4) electricity-associated carbon emissions, and (5) heat-associated carbon emissions. While conventional scope delineation for emission accounting in such parks typically subsumes thermal power plant emissions under fossil fuel combustion categories, this classification framework warrants critical re-examination.
Current methodological paradigms predominantly adopt a supply-side perspective, wherein emissions from park-based thermal power generation are attributed to fuel combustion sources. However, this approach inadequately addresses the demand-side environmental footprint, as evidenced by the inability of purchased electricity emissions data alone to fully encapsulate the operational realities of park-level energy consumption [28]. This critical gap necessitates a paradigm shift toward consumption-based accounting, recognizing that electricity and heat utilization constitutes a distinct emission pathway intrinsically tied to park operations.
To address this discrepancy, this study proposes a methodological refinement whereby emissions from electricity and heat consumption are redefined as distinct analytical categories. Specifically:
Emissions generated through in-park thermal power generation (both electricity and heat) shall be reclassified under “electricity consumption-associated emissions” and “heat consumption-associated emissions”, respectively
This reallocation acknowledges the causal relationship between energy demand patterns and associated generation emissions
(1)
Fossil fuel combustion emissions
1) Stationary source emission chain
Stationary source emissions mainly include carbon emissions from the combustion of fossil fuels in boilers, industrial kilns, blast furnaces, and other equipment in energy-consuming parks.
2) Mobile source emission segments
Energy consumption emissions from mobile sources mainly include carbon emissions from energy consumption of various types of road motorized transport, such as cars, trucks, tractors, etc., in energy-consuming parks.
(2)
Industrial process emissions
Industrial process emissions are primarily comprised of carbon emissions generated during the manufacture of industrial products as a consequence of physical and chemical reaction processes, including the utilization of raw materials. Emissions resulting from the combustion of fossil fuels are not included in this category.
(3)
Waste treatment emissions
Waste treatment emissions include carbon emissions from solid waste treatment, sewage, and wastewater treatment.
(4)
Carbon emissions from electricity consumption
Carbon emissions from electricity consumption can be calculated as the sum of the carbon emissions from electricity purchased outside the park and the carbon emissions from electricity generated by thermal power plants within the park.
(5)
Carbon emissions from heat use
Total carbon emissions from heat use can be calculated by adding together the carbon emissions from heat purchased from external sources and the carbon emissions from heat supplied by heat and power plants within the park.
As illustrated in Figure 8, the scope of carbon measurement through carbon flow analysis for the generic major emission sources of high-energy-consumption parks is delineated.

3.5. Definition of Carbon Accounting Gas Categories

Regarding greenhouse gas species for carbon emission accounting in high-energy-consuming industrial parks, seven major greenhouse gases explicitly identified in the Interim Management Rules for Carbon Emission Trading issued by the Ministry of Ecology and Environment (including carbon dioxide, methane, nitrous oxide, etc.) are referenced, as shown in Table 3. Among the five emission sources in high-energy-consuming industrial parks, CO2 constitutes the primary greenhouse gas from fossil fuel combustion, purchased electricity, and purchased heat. Waste treatment emissions mainly involve CO2, CH4, and N2O. Industrial process emissions exhibit greater complexity in gas species composition, encompassing various non-CO2 gases generated from manufacturing processes beyond carbon dioxide. In practical accounting, the inclusion of accounting gases should be rationally determined based on the specific characteristics of different parks. It should be noted that the term “carbon emissions” in this study specifically refers to CO2 emissions.

4. A Study on the Measurement of Carbon in Energy-Consuming Parks

Achieving the “dual-carbon” strategic goals constitutes an extensive and profound transformation, with its core focusing on controlling total carbon emissions and establishing baseline emission levels. These elements form critical foundations for scientific policymaking, effectiveness evaluation, and international negotiations, playing a vital role in China’s realization of its dual-carbon objectives. Metrological technology serves as the fundamental driver underpinning the dual-carbon strategy. This technology is directly applied in carbon emission measurement, energy monitoring, and natural resource–environmental surveillance. Through internationally recognized, standardized measurement protocols and methodologies, it ensures data accuracy and reliability. As critical components of national infrastructure, high-energy-consuming industrial parks require precise carbon measurement to provide direct evidence for emission accounting, reduction initiatives, carbon removal, and market mechanisms, exerting decisive influence on accelerating China’s carbon market development [29]. Previous sections systematically analyzed the characteristics and emission patterns of high-energy-consuming parks, delineating the measurement scope for their carbon emission sources. Building upon this foundation, this section examines carbon quantification methodologies for emission sources across four defined measurement categories.

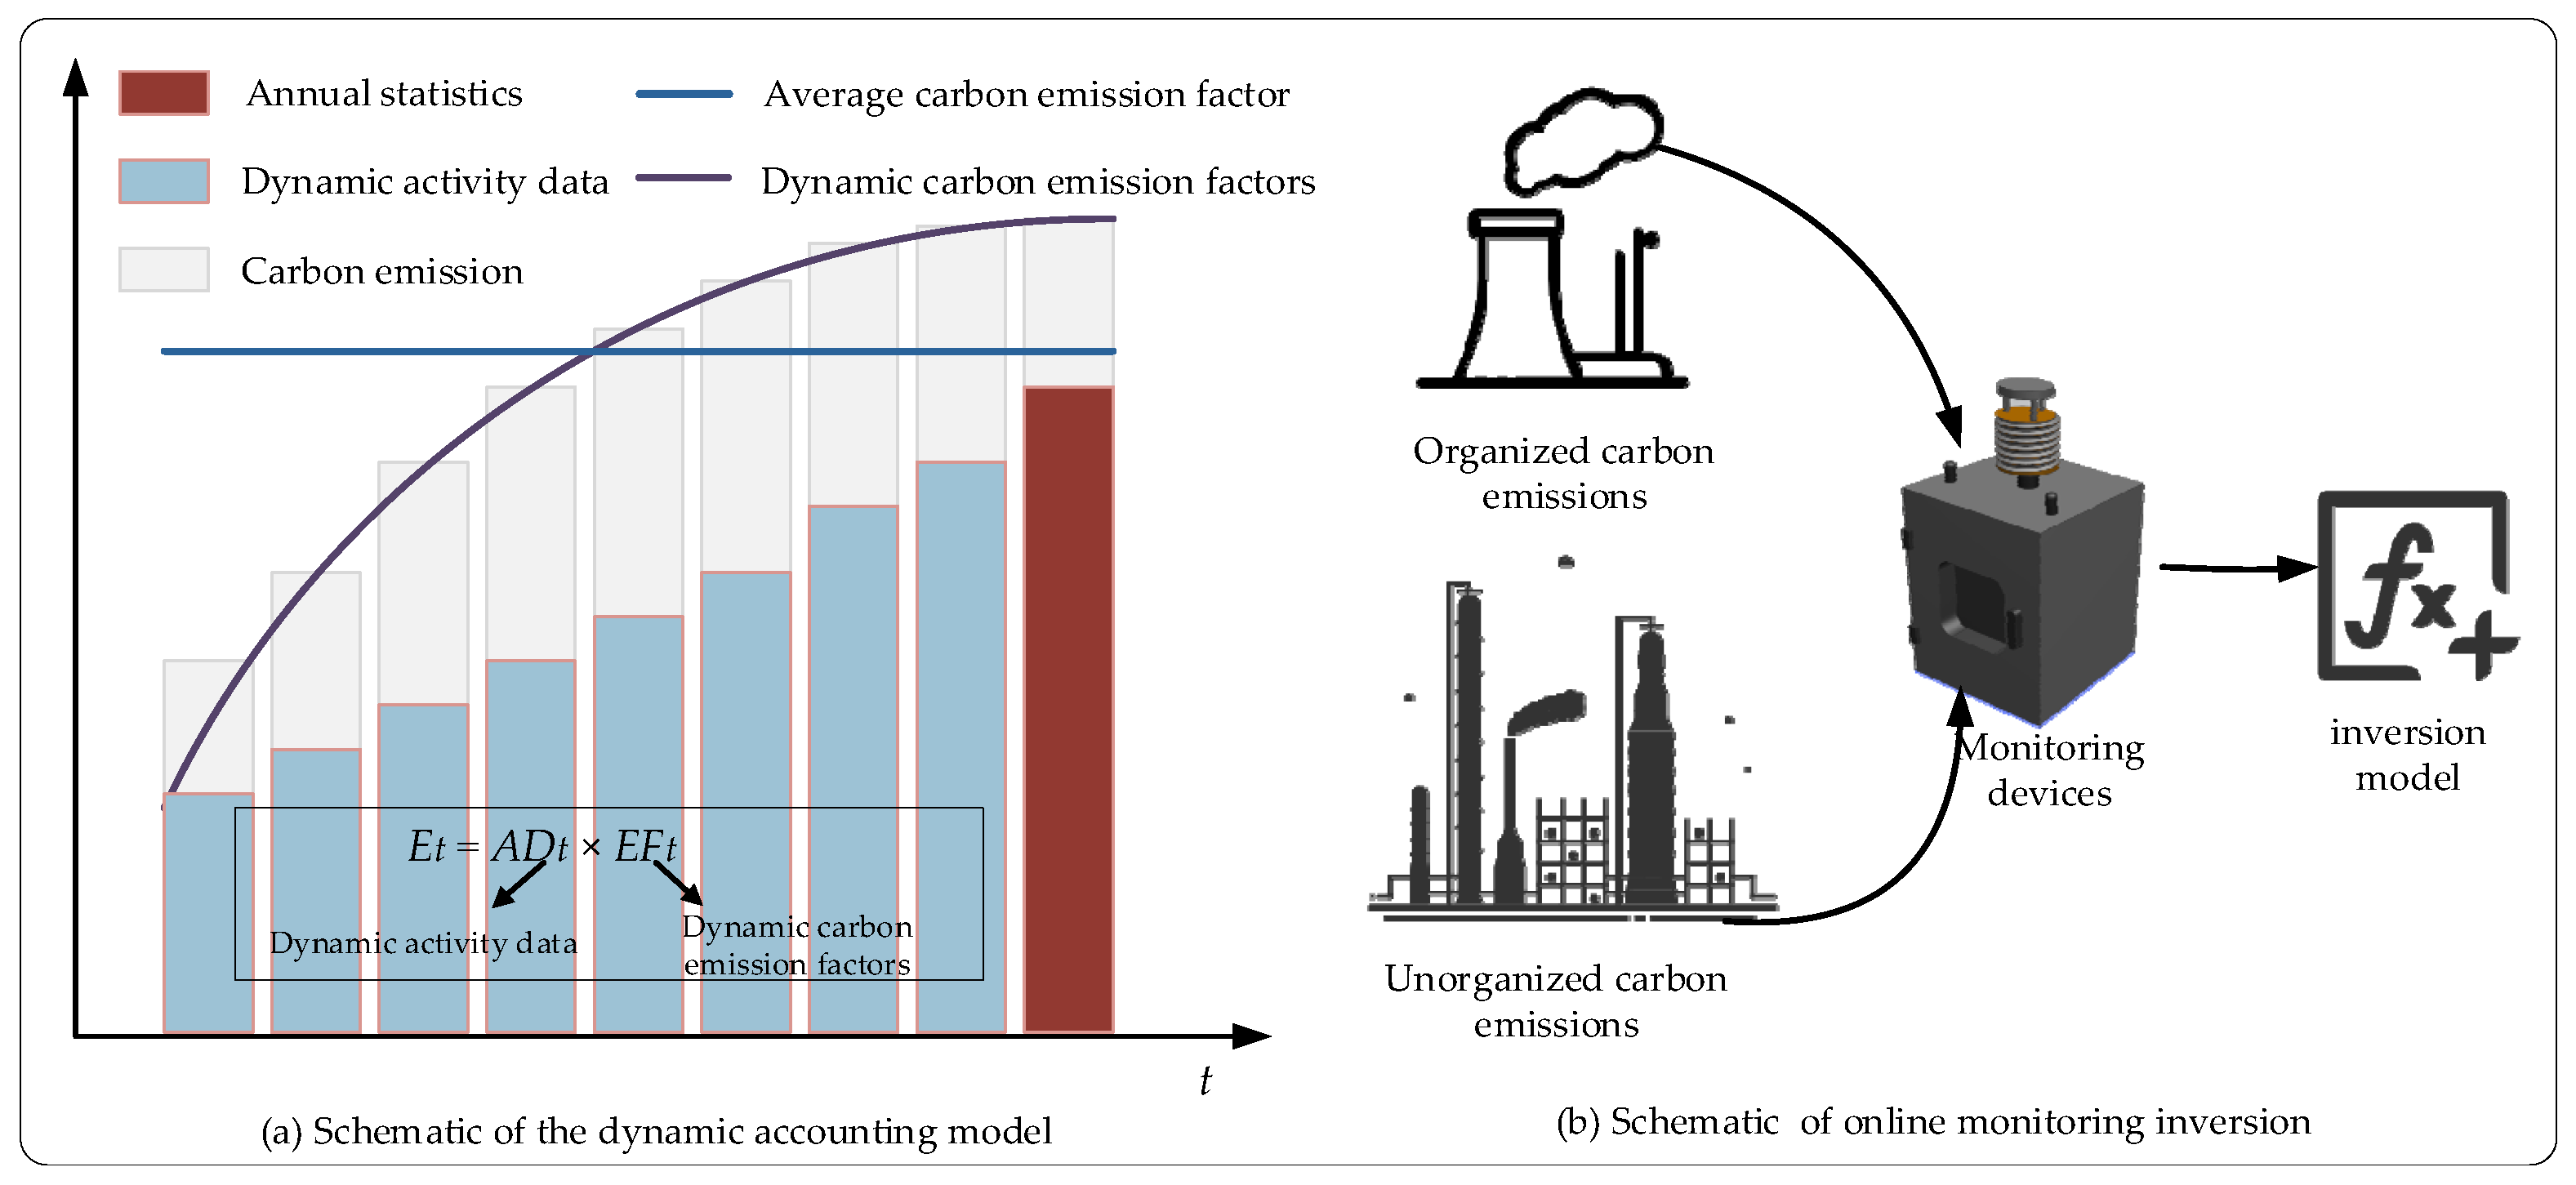
4.1. Direct Carbon Emissions

(1)
Organized carbon emissions
In the case of organized emission sources situated within energy-consuming parks, the measurement of carbon emissions is typically conducted using two distinct methodologies: the emission factor method and the actual measurement method.
1) Emission factor approach
The emission factor approach (EFA), also termed the Emission Inventory Method, is a mature carbon accounting methodology proposed by the Intergovernmental Panel on Climate Change (IPCC). Widely employed across various domains, including energy consumption and industrial processes for carbon emission accounting, it serves as the primary foundation for compiling carbon inventories both domestically and internationally [30]. Recognized for its computational simplicity, authoritative status, and broad applicability, the EFA has been formally adopted by China’s greenhouse gas inventory compilation guidelines and emission accounting/reporting protocols. The methodology’s fundamental principle involves estimating emission quantities through the product of activity level data and corresponding emission factors for specific emission sources. The computational formula is explicitly demonstrated in Equation (1). Activity-level data quantify the operational parameters of emission sources, such as fossil fuel combustion volumes or purchased electricity quantities, primarily derived from statistical surveys, field monitoring, and empirical measurements. Emission factors represent carbon emissions per unit activity, typically adopting default values from national standards and guidelines. Alternatively, research findings from domestic and international testing institutions or academic studies may be utilized based on practical requirements [31].
E = A D i E F i
Formula E ——carbon footprint;
A D i ——activity-level data;
E F i ——emission factors.
While the EFA offers advantages of computational simplicity, authoritative recognition, and mature applicability, its accuracy in carbon emission accounting remains limited due to regional disparities in lifestyles and production conditions. Additionally, significant uncertainties persist in emission factor determination. In China’s high-energy-consuming industrial parks, localized emission factors are rarely adopted for carbon accounting. The absence of nationally standardized certification criteria for such localized factors further undermines their authoritative status [32]. However, from the developmental perspective of these parks, employing localized emission factors enables precise carbon accounting and reduces estimation errors. Implementing dynamic accounting mechanisms could substantially mitigate annualized emission errors and enhance the temporal granularity of carbon emission data. This capability would empower industrial parks to monitor real-time emission variations, thereby facilitating the formulation of targeted decarbonization roadmaps and operationalizing emission reduction strategies.
2) Method of actual measurement
The Measurement-Based Method employs real-time monitoring data (including CO2 concentration, emission rates, and flow volumes) acquired through Continuous Emission Monitoring Systems (CEMSs) to achieve precise quantification of organized carbon dioxide emissions. Compared to conventional accounting methods, this approach demonstrates superior advantages in automation capability, monitoring data frequency, and cost-effectiveness of operational management. This methodology is particularly applicable to emission sources with stable and continuous carbon output patterns, such as exhaust points in cement plants and coal-fired power plants [33]. Despite its streamlined workflow and accurate results, the method’s reliance on dedicated continuous CO2 monitoring leads to elevated implementation costs and challenges in large-scale data collection.
The emission factor approach and Measurement-Based Method exhibit distinct strengths and limitations, as comprehensively compared in Table 4. Practical implementation requires strategic selection or hybrid application of these methodologies to optimize the accuracy of carbon emission accounting.
(2)
Unorganized carbon emissions
Diffuse carbon emissions refer to CO2 releases not channeled through exhaust stacks, including fugitive emissions from open areas, vehicular fuel combustion, or irregular discharges through cracks and open doors/windows. Characterized by intermittent, unstructured dispersion without stack pathways, such emissions evade monitoring via CO2-CEMS systems. Consequently, CO2 accounting methods are predominantly employed for quantification, though these suffer from temporal lag and low data collection efficiency. Additionally, diffuse CO2 emissions exhibit significant spatiotemporal heterogeneity. The critical challenges in monitoring diffuse CO2 emissions within open zones of high-energy-consuming parks lie in achieving comprehensive spatial coverage, real-time data acquisition, and measurement accuracy [34]. To address the limitations of existing measurement and emission factor approaches in monitoring diffuse emissions, a dynamic carbon accounting methodology has been developed [35]. This hybrid approach integrates activity-specific industrial processes and operational data, enabling timely detection of fugitive emissions such as gas leaks within industrial parks. The underlying principles of this methodology are illustrated in Figure 9.
The “Dynamic Measurement Methodology” comprises two components: “Dynamic Accounting” and “Online Monitoring Inversion”. Dynamic Accounting centers on real-time dynamic parameters, enabling the integration of emission factors with activity-level data to achieve real-time carbon emission quantification in high-energy-consuming parks. By extracting real-time operational parameters from emission sources, this approach addresses the temporal resolution limitations and coarse granularity inherent in traditional emission factor methods, effectively reducing annualized accounting errors while enhancing temporal resolution of emission data. Online Monitoring Inversion targets diffuse carbon emission surveillance in regional contexts. To overcome the quantification challenges of diffuse emissions, this hybrid methodology synergizes measurement-based approaches with inversion modeling, establishing a comprehensive monitoring framework for both organized and diffuse emissions [36]. Leveraging environmental monitoring data, the method investigates dynamic response relationships between emission sources and carbon concentration measurements, offering valuable references for real-time carbon monitoring in high-energy-consuming parks.

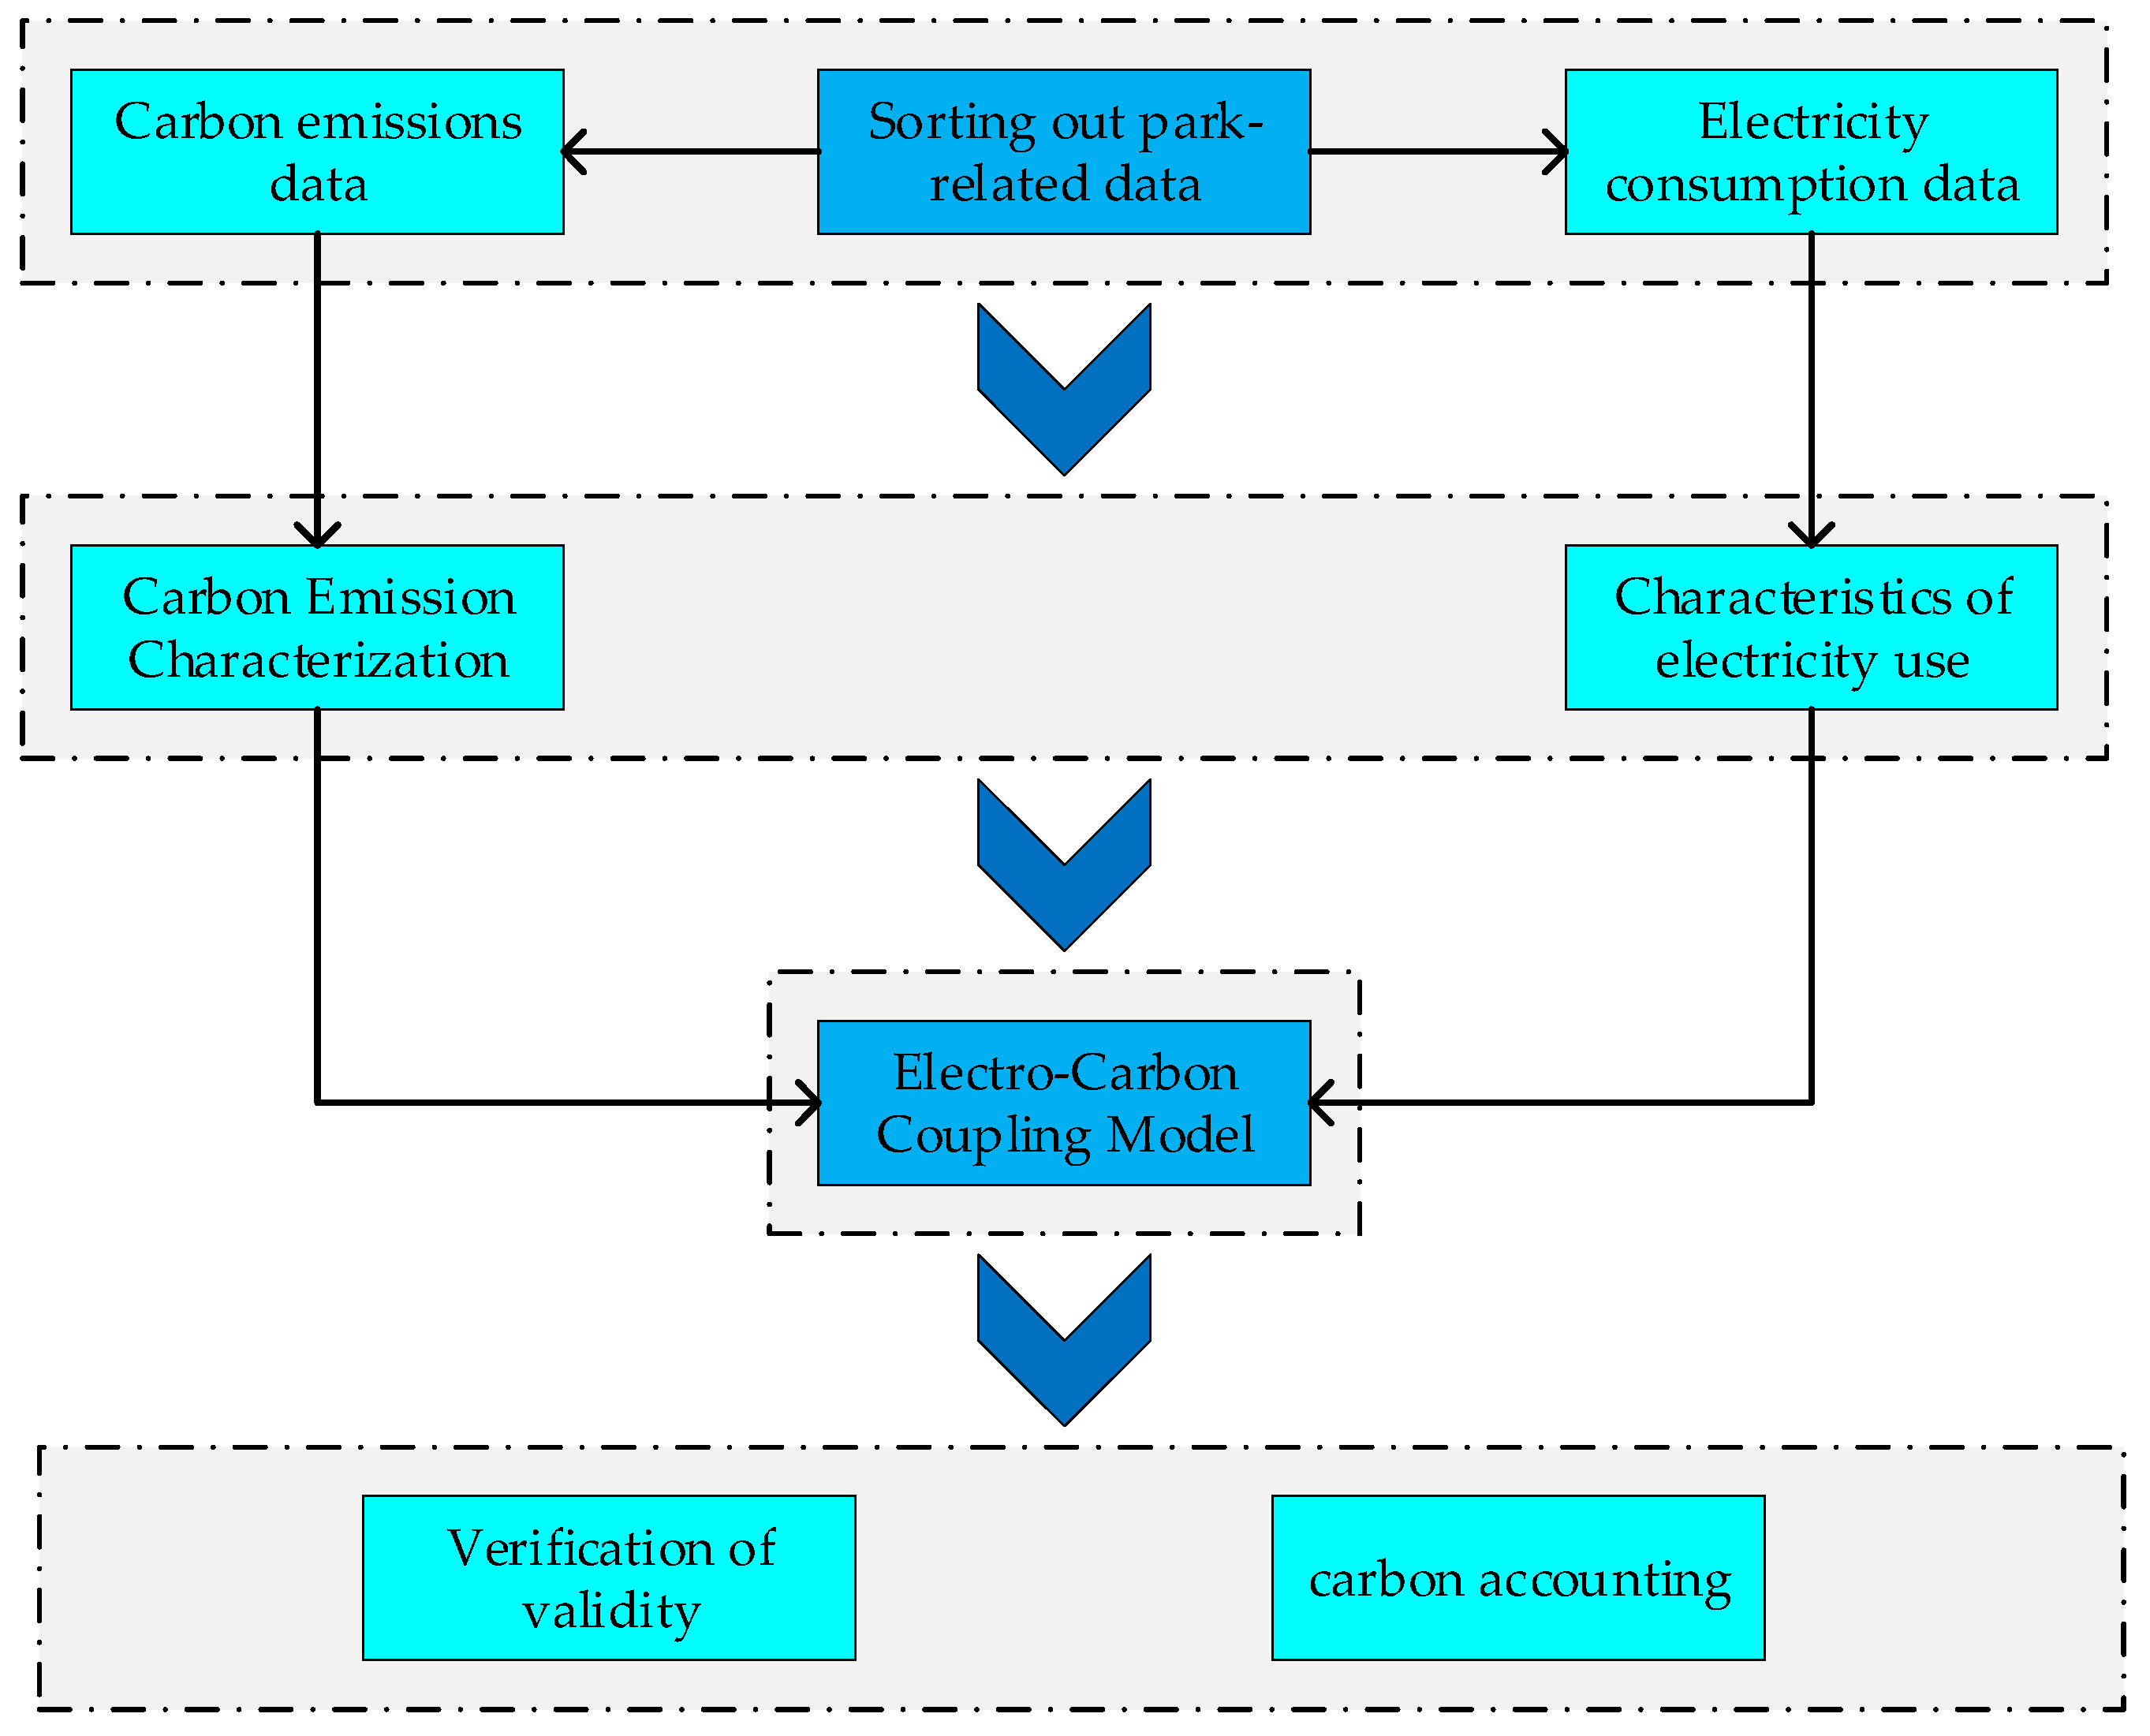
4.2. Indirect Carbon Emissions

The term “indirect carbon emissions” is used to describe net purchased electricity or heat carbon emissions. These emissions arise from sources outside the accounting boundary and cannot be measured using the actual measurement method. Instead, they are typically accounted for using the electricity–carbon factor method [37].
The electricity–carbon model is founded upon the correlation between electricity consumption, other energy consumption, and carbon emissions from industrial production. It employs the advantages of electricity big data, including extensive coverage, robust real-time capabilities, high resolution, and a high degree of digitization, to develop an innovative methodology for calculating carbon emissions based on electricity consumption. The electricity–carbon model employs regression analysis and other algorithms to establish a coupling between electricity consumption and carbon emissions modeling, thereby facilitating more reliable, convenient, and real-time monitoring of carbon emissions [38].
Figure 10 illustrates the flow chart of the electricity–carbon factorization method. Firstly, the carbon emissions of electricity and electricity consumption of high-energy-consuming parks are sorted out separately. Secondly, the existing data are fitted using algorithms such as the least squares method to obtain the coupled electricity–carbon model. Finally, the existing monitoring data are used to validate the obtained electricity–carbon model. Once the model has been verified as valid, the net purchased electricity can be used to calculate the indirect carbon emissions of the energy source.
The application of national average emission factors for power system carbon accounting introduces significant inaccuracies and temporal resolution limitations. To address these constraints, recent methodological advancements propose dynamic electro-carbon factor quantification that integrates regional grid variations and time-variant carbon emission intensities, effectively mitigating systematic errors inherent in static averaging approaches [39]. This refined methodology is mathematically expressed as:
e t = i n E i , t e i , t i n E i , t
where e t , e i , t are the integrated electric carbon factor at moment t of the high-energy-consuming park and the electric carbon factor at moment t of the ith regional power grid, respectively, and E i , t is the amount of electricity purchased by the energy-intensive park from the ith grid at moment t .
The electricity–carbon factor methodology demonstrates particular efficacy in metal-smelting complexes where energy-related indirect carbon emissions dominate total emission profiles. This applicability is exemplified in electrolytic aluminum production complexes, as previously analyzed. In practical implementation, the China Southern Power Grid has pioneered a first-of-its-kind electro-carbon meter in grid-connected trial operation. Beyond conventional electrical parameter monitoring (current, voltage, and power consumption), this advanced instrumentation enables dynamic calculation of real-time carbon intensity per kilowatt hour. The system provides users with an intuitive real-time carbon accounting interface, analogous to electricity usage monitoring, thereby significantly enhancing the technical capacity for energy conservation, emission reduction, and decarbonization initiatives [40].
For the multiple carbon measurement methods previously delineated, an adaptation analysis must be conducted to evaluate the applicability of each method [41], as illustrated in Table 5.
This system approach enables the development of precision-tailored accounting solutions that dynamically adapt to sector-specific emission profiles. For instance, integrated parks combining metallurgical and chemical processes may require concurrent application of mass-balance calculations, dynamic tracking, and infrared-based leak detection. The methodological synthesis ultimately enhances measurement accuracy through cross-validation mechanisms while maintaining compliance with evolving regulatory standards [39].

4.3. Park Carbon Measurement Process

Building upon defined carbon emission characteristics and measurement scopes of high-energy-consuming parks, this study has designed and synthesized a carbon accounting protocol tailored to their operational realities. The comprehensive measurement procedure is visually outlined in Figure 11. The process initiates with systematic analysis of the target park’s operational characteristics to identify primary emission sources. Subsequent steps involve delineating direct versus indirect emissions, organized versus diffuse emissions, followed by tracing emission flow origins and transmission pathways. The protocol culminates in methodologically appropriate selection of measurement approaches based on park-specific monitoring capabilities to ensure precise carbon quantification [38].

5. Discussion

Under the dual carbon goals of peaking carbon emissions and achieving carbon neutrality, high-energy-consumption parks, as one of China’s largest carbon emission sources, demonstrate significant potential for emission reduction. Accurate carbon quantification serves as the fundamental premise for subsequent decarbonization efforts, ensuring the systematic progression of related initiatives. Future mainstream carbon measurement methodologies will increasingly align with market-oriented mechanisms and international standards, adapting to the evolving global carbon market through refined and dynamic approaches. The development trajectory of carbon measurement will focus on creating tailored methodologies that account for industry-specific characteristics, product profiles, and enterprise scales by integrating modern information technologies. Emerging technological advancements are expected to enhance monitoring precision through next-generation carbon satellites, while intelligent sensors coupled with IoT solutions will enable real-time data acquisition and remote monitoring of park-level emissions. Data fusion techniques and artificial intelligence will further empower comprehensive carbon footprint assessments, facilitating the formulation of targeted emission reduction strategies. As systematically compared in Table 6 across parameters including economic viability and measurement accuracy [40], these technological solutions present differentiated advantages for practical implementation.
To summarize, under the goal of “dual-carbon”, the research on carbon emission characterization and carbon measurement in high-energy-consuming parks mainly focuses on the following aspects:
(1)
Accurate determination of emission factors (EFs) is critical for reliable carbon quantification. Traditional approaches that treat entire industrial parks as homogeneous entities for EF calculation require refinement. Instead, it is imperative to establish differentiated EF models that dynamically adapt to park typologies (e.g., chemical, metallurgical), industrial processes, and geographic-specific emission profiles. A granular framework should be implemented to calculate EFs at the subsystem level, distinguishing between individual equipment units and specific production processes, thereby mitigating errors inherent in conventional average-based EF allocation. Continuous refinement and granular optimization of EF determination methodologies will significantly enhance data comparability and accuracy. This approach aligns with the operational realities of industrial ecosystems, where emission intensities vary substantially across production stages. Advanced data disaggregation techniques, combined with machine learning-enabled dynamic EF calibration, can further improve model adaptability to fluctuating operational conditions and technological upgrades.
(2)
While continuous emission monitoring systems (CEMSs) for organized carbon emissions have achieved operational maturity, persistent technical limitations require targeted resolution. Key challenges include accuracy–complexity trade-off: Current systems exhibit compromised data reliability (typical uncertainty >15%) due to sensor drift, while their integration with legacy CEMSs necessitates costly secondary development (average 35% project cost overrun); and environmental resilience deficits: prolonged exposure to extreme conditions (e.g., >300 °C flue gas, 90% RH humidity) accelerates sensor degradation, with field studies showing a 23% performance decline within 6 months under such stressors.
(3)
Fugitive carbon emissions exhibit characteristics of multiple dispersed sources, variable locations, fluctuating emission volumes, and significant terrain influence, substantially complicating monitoring efforts. Prolonged field deployment of monitoring equipment coupled with frequent power source replacements introduces substantial human interference, necessitating robust electrical infrastructure to ensure data reliability. While satellite remote sensing can estimate regional carbon fluxes, its limited spatiotemporal resolution impedes precise source attribution of fugitive emissions. Acquiring high-precision measurement data to strengthen emission inversion modeling constitutes a pivotal research frontier [41].
(4)
Measurement constraints arise from data gaps in supply chain aspects and reliance on average grid factors, compromising measurement accuracy and amplifying data uncertainty. Sensor performance demonstrates monthly accuracy degradation of 3–5%, while cross-sensitivity to non-target gases (e.g., methane) introduces measurement inaccuracies. Inadequate deployment of edge computing devices in remote mining areas results in data latency exceeding two hours.
(5)
Deployment of monitoring technologies in industrial parks faces significant challenges, as high-precision systems carry prohibitively high costs that hinder adoption in developing economies. Internationally, the absence of standardized protocols creates implementation barriers for enterprises seeking to adopt these technologies. Data silos across industries further compound these operational challenges. Traditional manufacturing sectors exhibit strong resistance to carbon accounting practices.
(6)
During the “14th Five-Year Plan” period, high-energy-consuming parks will be fully integrated into the carbon-trading market. The monitoring, reporting, and verification of greenhouse gases constitutes the foundation for the smooth operation of carbon emissions trading. The key objective of monitoring, reporting, and verification system construction is to obtain high-quality carbon emission monitoring data. The improvement of the quality of carbon emission monitoring data and the establishment of data uncertainty analysis methods are also urgent issues that require resolution.

6. Conclusions

As a growing number of energy-consuming industries in China converge in geographic clusters, forming high-energy-consuming parks, this paper addresses pivotal issues, including diverse types of high-energy-consuming parks accounting, indistinct boundaries, intricate subjects, and challenges in data selection. It provides an overview of the types of high-energy-consuming parks, the characteristics of carbon emissions, the scope of measurement, and the measurement methodology. Furthermore, it examines the trajectory of future development and potential avenues for improvement. In the future, there is considerable scope for research into the characteristics of carbon emissions in energy-consuming parks and the definition of the scope of measurement. This should include the carbon measurement technology of parks, the measurement of carbon independently in each piece of equipment, the development of carbon-monitoring devices that can adapt to harsh environments, and the accurate acquisition of data and interaction of information on the external environment in the monitoring of unorganized carbon emissions in parks. Furthermore, the question of how to integrate the carbon measurement technology of the park with the carbon-trading market represents a significant area of research. It is therefore evident that the undertaking of carbon measurement is of considerable importance to both the business community and wider society, providing the necessary data and technical support to facilitate the achievement of carbon emission reduction targets.

Author Contributions

Y.W., Z.C., Y.Z. and X.L. completed the experimental test. The algorithm research was performed by Y.C., B.P. and J.Z. The draft of the manuscript was written by Z.L. and Q.L. All authors have read and agreed to the published version of the manuscript.

Funding

This research was supported by the science and technology project of the State Grid Sichuan Electric Power Company (No. 52199723001K).

Data Availability Statement

The original contributions presented in the study are included in the article. Further inquiries can be directed to the corresponding authors.

Acknowledgments

The researchers are thankful for the comments from reviewers. The authors would like to take this opportunity to thank the data collection assistants and the anonymous respondents who responded to the questionnaire.

Conflicts of Interest

Authors Zhenwei Chang, Yibin Zhang, Jie Zhang were employed by State Grid Sichuan Electric Power Company. The remaining authors declare that the research was conducted in the absence of any commercial or financial relationships that could be construed as a potential conflict of interest. The State Grid Sichuan Electric Power Company had no role in the design of the study; in the collection, analyses, or interpretation of data; in the writing of the manuscript, or in the decision to publish the results.

References

  1. Liu, X.Z.; Sun, X.; Zhu, Q.K.; Shang, Y.T. Review on the Measurement Methods of Carbon Dioxide Emissions in China. Ecol. Econ. 2017, 33, 21–27. [Google Scholar]
  2. Chen, W.H.; Lu, X. The optimal layout of CCUS clusters in China’s coal-fired power plants towards carbon neutrality. Clim. Change Res. 2022, 18, 261–271. [Google Scholar]
  3. Liu, L.; Zhang, B.; Bi, J.; Wei, Q.; He, P. The greenhouse gas mitigation of industrial parks in China: A case study of Suzhou industrial park. Energy Policy 2012, 46, 301–307. [Google Scholar] [CrossRef]
  4. Wang, H.; Lei, Y.; Wang, H.; Liu, M.; Yang, J.; Bi, J. Carbon reduction potentials of China’s industrial parks: A case study of Suzhou industry park. Energy 2013, 55, 668–675. [Google Scholar] [CrossRef]
  5. Liu, W.; Tian, J.; Chen, L. Greenhouse gas emissions in China’s eco-industrial parks: A case study of the Beijing economic technological development area. J. Clean. Prod. 2014, 66, 384–391. [Google Scholar] [CrossRef]
  6. Wang, N.; Guo, Z.; Meng, F. The circular economy and carbon footprint: A systematic accounting for typical coal-fuelled power industrial parks. J. Clean. Prod. 2019, 229, 1262–1273. [Google Scholar] [CrossRef]
  7. Yu, X.; Zheng, H.; Sun, L. An emissions accounting framework for industrial parks in China. J. Clean. Prod. 2019, 244, 118712. [Google Scholar] [CrossRef]
  8. Yan, K.; Lv, Y.; Guo, Y. Review on Greenhouse Gas Accounting Methods on China’s Industrial Parks. Chin. J. Environ. Manag. 2021, 13, 13–23. [Google Scholar] [CrossRef]
  9. Hu, B.; Sun, K.B.; Shao, C.Z.; Huang, W.; Zhao, Y.S.; Xie, K.G. Carbon awareness and optimization methods for park-level integrated energy systems considering whole-process carbon footprint. High Volt. Eng. 2022, 48, 2495–2504. [Google Scholar]
  10. Ji, L.; Liang, S.; Qu, S. Greenhouse gas emission factors of purchased electricity from interconnected grids. Appl. Energy 2016, 184, 751–758. [Google Scholar] [CrossRef]
  11. Zhang, N.; Li, Y.; Huang, J. Carbon Measurement Method and Carbon Meter System for Whole Chain of Power System. Autom. Electr. Power Syst. 2023, 47, 2–12. [Google Scholar] [CrossRef]
  12. Qi, J.; Chen, B. Greenhouse Gas Emission Inventory of Industrial Parks. Acta Ecol. Sin. 2015, 35, 2750–2760. [Google Scholar]
  13. Wang, J.; Wang, Y.; Zhou, M. Accounting Method of Users’ Indirect Carbon Emissions Considering Green Electricity Trading. Power Syst. Technol. 2024, 48, 29–38. [Google Scholar] [CrossRef]
  14. Cheng, Y.; Zhang, N.; Wang, Y. Modeling carbon emission flow in multiple energy systems. IEEE Trans. Smart Grid 2019, 10, 3562–3574. [Google Scholar] [CrossRef]
  15. Lyu, Y.; Gao, H.; Yan, K.; Liu, Y.; Tian, J.; Chen, L.; Wan, M. Carbon peaking strategies for industrial parks: Model development and applications in China. Appl. Energy 2022, 322, 119442. [Google Scholar]
  16. Wei, X.; Qiu, R.; Liang, Y.; Liao, Q.; Klemeš, J.J.; Xue, J.; Zhang, H. Roadmap to carbon emissions neutral industrial parks: Energy, economic and environmental analysis. Energy 2022, 238, 121732. [Google Scholar]
  17. Wu, Q.; Tu, K.; Zeng, Y. Research on China’s energy strategic situation under the carbon peaking and carbon neutrality goals. Chin. Sci. Bull. 2023, 68, 1884–1898. [Google Scholar]
  18. Tan, Q.; Zhao, H. Carbon Emission Factors and Decoupling Effects of China’s Power Industry under the Background of Carbon Peak. Electr. Power 2024, 57, 88–98. [Google Scholar]
  19. Zhou, Y.B.; Zhang, S.N.; Hou, F.X.; Ren, H.T.; Xun, P.F. Analysis of Carbon Peaking in Power Sector and its Impact on Promoting Whole-Society Carbon Emissions Reduction. Electr. Power 2024, 57, 1–9. [Google Scholar]
  20. Wang, Y.X.; Yu, Z.; Huang, H.Q.; Li, S.W.; Dong, M.Q.; Wang, P.F.; Wang, D. Spatial-temporal evolution and driving factors analysis of carbon emissions in China’s thermal power industry. Environ. Pollut. Control 2024, 46, 1662–1668+1678. [Google Scholar]
  21. Wang, S.; Zhou, B.; Qu, J.B.; Li, J.H.; Yi, L.Z.; Wu, X.; Yang, Y.; Xu, X.; Bo, X. Air pollution impact of thermal power industry in Shandong Province under carbon peak and carbon neutrality scenario. China Environ. Sci. 2024, 44, 5990–5998. [Google Scholar]
  22. Dou, L.; Gao, F.; Peng, Y.; Wang, X.; Xiong, L. Green transition situations and development suggestions for upstream petroleum industry. Bull. Chin. Acad. Sci. 2024, 39, 1205–1216. [Google Scholar]
  23. Wang, T.; Li, G.; Song, X.; Wang, H.; Wang, G.; Liu, Z. Development of Smart Oil and Gas Fields with Multi-energy Synergy of Wind, Solar, Geothermal, and Energy Storage. Strateg. Study CAE 2024, 26, 259–270. [Google Scholar]
  24. Zheng, S.L.; Ye, S.F.; Wang, Q.; Ma, S.H.; Wang, Z.; Sun, Z.; Qiao, S.; Zhang, X.M.; Zhang, Y. Analysis and thinking of low-carbon technology in non-ferrous metal industry. Chin. J. Process Eng. 2022, 22, 1333–1348. [Google Scholar]
  25. Gu Lin, H.K.; Ma, M. Research on low carbon development of non-ferrous metallurgical industry in terms of energy structure. China Nonferrous Metall. 2022, 51, 1–7. [Google Scholar]
  26. Liu, L.; Lei, Y.; Zhi, S.; Chen, W.; Chai, C.; Shao, Z.; Liu, Z.; Liu, C. Potential and Optimization Deployment of CCUS Technology Emission Reduction at Point Source Level in China’s Cement Industry. J. Beijing Inst. Technol. (Soc. Sci. Ed.) 2024, 26, 56–67. [Google Scholar]
  27. Ma, M.; Huang, Z.; Wang, J.; Niu, L.; Zhang, W.; Xu, X.; Xi, F.; Liu, Z. Carbon uptake by cement in China: Estimation and contribution to carbon neutrality goals. Sci. Sin. Terrae 2024, 54, 2086–2097. [Google Scholar]
  28. Wang, P.; Zhao, Y.; Zhang, J.; Xiong, Z. Research progress on carbon measurement methods of coal-fired power plants under the background of carbon neutrality. Clean Coal Technol. 2022, 28, 170–183. [Google Scholar]
  29. Xie, J.; Guo, J.; Huang, Y.; Liu, W.; Xu, M. Accounting for household carbon emissions and estimating their proportion in China based on multi-source data. Chin. J. Environ. Eng. 2024, 18, 3081–3091. [Google Scholar]
  30. Li, Y.W.; Yang, X.X.; Liu, C. A review on carbon emission accounting approaches for the electricity power industry. Appl. Energy 2024, 359, 122681. [Google Scholar]
  31. Liu, Z.X.; Xu, Z.Y.; Zheng, W.F. Calculation of carbon emissions in wastewater treatment and its neutralization measures: A review. Sci. Total. Environ. 2024, 912, 169356. [Google Scholar] [CrossRef] [PubMed]
  32. Zhang, H.X.; Sun, W.Q.; Ma, G.Y. A carbon flow tracing and carbon accounting method for exploring CO2 emissions of the iron and steel industry: An integrated material-energy-carbon hub. Appl. Energy 2022, 309, 118485. [Google Scholar]
  33. Paul, K.I.; Roxburgh, S.H. A national accounting framework for fire and carbon dynamics in Australian savannas. Int. J. Wildland Fire 2024, 33, WF23104. [Google Scholar] [CrossRef]
  34. Li, L.Q.; Wang, X.H.; Ren, N.Q. Carbon neutrality of wastewater treatment-A systematic concept beyond the plant boundary. Environ. Sci. Ecotechnology 2022, 11, 100180. [Google Scholar] [CrossRef]
  35. Ma, Y.; Chen, Y.; Wei, Y.; Li, Q.; Liu, X.; Zhang, A. Carbon Flow Tracking based Carbon Emission Accounting of Low-Carbon Industrial Parks. In Proceedings of the 2022 IEEE 6th Conference on Energy Internet and Energy System Integration (EI2), Chengdu, China, 11–13 November 2022. [Google Scholar]
  36. Raza, S.; Ghasali, E.; Erk, N. Advances in technology and utilization of natural resources for achieving carbon neutrality and a sustainable solution to neutral environment. Environ. Res. 2023, 220, 115135. [Google Scholar] [CrossRef]
  37. Li, Y.; Brando, P.M.; Randerson, J.T. Deforestation-induced climate change reduces carbon storage in remaining tropical forests. Nat. Commun. 2022, 13, 1964. [Google Scholar]
  38. Chen, B.; Yang, W.S. Beijing Normal University State Key Joint Laboratory of Environmental Simulation and Pollution Control/School of Environment. Carbon emission accounting methods for industrial parks. China Popul. Resour. Environ. 2017, 27, 1–10. [Google Scholar]
  39. Cai, B.F.; Zhu, S.L.; Yu, S.M.; Dong, H.M.; Zhang, C.Y.; Wang, C.K.; Zhu, J.H.; Gao, Q.X.; Fang, S.X.; Pan, X.B.; et al. The Interpretation of 2019 Refinement to the 2006 IPCC Guidelines for National Greenhouse Gas Inventory. Environ. Eng. 2019, 37, 1–11. [Google Scholar]
  40. Wu, X.P.; Kang, C.Q.; Yuan, Q.H. A Review of the Impact Factors of Carbon Emissions and the Accounting Methods for Electricity Carbon Emissions in China. Proc. CSEE 2024, 44 (Suppl. S1), 1–18. [Google Scholar]
  41. Hua, J.C.; Zeng, Z.C. Quantifying the scattering effect of dust aerosols on satellite remote sensing retrievals of atmospheric carbon dioxide. Natl. Remote Sens. Bull. 2024, 28, 2582–2599. [Google Scholar] [CrossRef]
Figure 1. Classification of high-energy-consuming park types.
Processes 13 00989 g001
Figure 2. Boundary demarcation of high-energy-consuming parks.
Processes 13 00989 g002
Figure 3. Scope of carbon emission measurement in high-energy-consuming parks.
Processes 13 00989 g003
Figure 4. Schematic diagram of carbon emissions from aluminum production parks.
Processes 13 00989 g004
Figure 5. Scope of measurement for five typical park emission sources.
Processes 13 00989 g005
Figure 6. Energy flow framework for energy-consuming parks.
Processes 13 00989 g006
Figure 7. Carbon flow framework for energy-consuming parks.
Processes 13 00989 g007
Figure 8. Generic emission source measurement scope.
Processes 13 00989 g008
Figure 9. Principles of the dynamic measurement method.
Processes 13 00989 g009
Figure 10. Flow chart of the electro-carbon factorization method.
Processes 13 00989 g010
Figure 11. Flow of carbon emission measurement in high-energy-consuming parks.
Processes 13 00989 g011
Table 1. Emission share of thermal power plant emission sources.
Greenhouse Gas SourcesFuel CombustionFuel Supply ChainDesulfurization and DenitrificationVaporization
Share of carbon emissions80~95%5~15%1~3%0.5~2%
Table 2. Carbon emission sources in oil and gas parks: (a) upstream industry emission sources; (b) emission sources from midstream and downstream industries.
(a)
Greenhouse gas sourcesExtraction and drillingFugitive gasFossil fuel combustion
Share of carbon emissions10%14%33%
(b)
Greenhouse gas sourcesCrude oil transport (ships)Crude oil transport (pipeline)Refinery heat and power systems
Share of carbon emissions3%2%38%
Table 3. Scope of carbon emission accounting for high-energy-consuming parks.
Classification of Carbon Emission SourcesGas Type
Fossil fuel combustion emissionsCO2
Industrial process emissionsThe presence of CO2 and other non-CO2 gases
Waste treatment emissionsCO2, CH4, N2O
Carbon emissions from electricityCO2
Carbon emissions from heatCO2
Table 4. Comparison of the two methods.
FormAdvantageDrawbacksApplicable ObjectsApplication Status
emission factor approach
Simple methods
Proven accounting methodology
A plethora of application references are available for consultation.
poor timelinessEmission sources change more steadily, ignoring complexity within the system
Widely used
Methodological cognitive unity
Concluding authority
method of actual measurement
Fewer intermediate links
Accurate results
Difficulty in accessing data
Higher cost
Sites with access to first-hand measured data
Scope of Application
Longer history of application
Minimal method flaws but most difficult data acquisition
Table 5. Comparative analysis of measurement method error.
MethodologiesSources of UncertaintyCalibration MethodData ReliabilityApplicable Scenarios
emission factor approachactivity data errors, emission factors not updatedregularly synchronized with the Industry Factors databaselowapplicable to industries conducting preliminary carbon accounting
method of actual measurementinfrared instruments drift over time, temperature, humidityuses standard gas for range and zero calibrationhighsuitable for industries requiring audited data
dynamic measurement methodsensor signal-to-noise ratio issuesdistributed Sensor Time Alignmentcenterfor industries with variable processes
electro–carbon methodregional grid changes, carbon intensity over timecalibration using real-time datacenterindustries with high electricity consumption
Table 6. Comparison of mainstream carbon monitoring methods.
MethodologiesCostPrecisionSpatial ScaleTime ScaleApplicable Scenarios
satellite remote sensinghighcenterglobal coveragedayregional-level monitoring
ground sensor networkscenterhighsmall-scalereal timecampus monitoring
traditional accountinglowlarge errorenterprise-classmonthly or annualemission estimates
AI predictive modelingcenterrelated to data qualityhighnear real timecarbon intensity projections
Disclaimer/Publisher’s Note: The statements, opinions and data contained in all publications are solely those of the individual author(s) and contributor(s) and not of MDPI and/or the editor(s). MDPI and/or the editor(s) disclaim responsibility for any injury to people or property resulting from any ideas, methods, instructions or products referred to in the content.

