Abstract
Throughout China’s 14th five-year plan, the national natural gas pipeline network has been interconnected, and the gas quality became increasingly complex. A certain amount of dust particles widely spread in the natural gas pipeline and lead to abnormal wear of the reciprocating compressor’s compression cylinder within the underground storage cavern. The wear characteristics of the compression cylinder are effectively demonstrated based on the tangential impact energy model, and combined with field measurement and the moving-grid method of computational fluid dynamics. The results reveal that the lubricating oil forms “grinding paste” when mixed with dust particles. With an increase in the dust mass concentration from 0.01% to 3.00%, the viscosity of the “grinding paste” increases from 450,800 mPa·s to 1,274,000 mPa·s, and the density increases from 890 kg/m3 to 980 kg/m3. The abnormal wear frequently occurs at the 12 o’clock and 6 o’clock directions of the compression cylinder. When the piston is in the midpoint of the stroke, the wall shear rate and the wear rate are the highest. When the piston is at both endpoints of the stroke, the wall shear rate and the wear rate are the lowest. For every 1000 h of operation without repairing the cylinder, the dust concentration should be controlled below 0.60%. For every 5000 h and 10,000 h of operation without replacing the cylinder, the dust concentration should be controlled below 1.3% and 0.4%. When the dust mass concentration is 0.01%, the wear rate decreases with decreasing lubricating oil viscosity. When the dust mass concentration is 0.51% and 1.0%, and the lubricating oil viscosities are 259,700 mPa·s, 220,500 mPa·s, and 196,980 mPa·s, the wear rate increases dramatically with decreasing lubricating oil viscosity.
1. Introduction
Characterized by a flexible output and pressure ratio and high-level transmission, the utilization of reciprocating compressors is favorable in the natural gas industry. However, the quality of the delivered gas varies greatly in the wake of the interconnection of natural gas pipeline networks, which triggers the presence of dust in the operating gas of reciprocating compressors [1]. When mixed with the lubricating oil in the compression cylinder, the dust forms a “grinding paste” that sticks to the cylinder [2,3]. Excessive cylinder wear will occur at high rotational speeds [4,5]. Normally, compression cylinders can run continuously for over 10,000 h. Their wear is basically unchanged as the operation time goes on. As specified by manufacturers, compression cylinders should be repaired and replaced once the wear reaches 0.13 mm and 1.16 mm, at a cost of hundreds of thousands of dollars. Compressors play a vital role in the efficient delivery of natural gas to the Sichuan–Chongqing region and the Beijing–Tianjin–Hebei region in winter. Their shutdown would result in significant and unforeseen losses. It is evident that this abnormal wear poses a threat to the normal operation of compressors and even the overall natural gas pipeline network.
As for the lubrication features of compression cylinders, Grabon et al. [6] studied the lubrication properties of the contact surface “grinding paste” in compression cylinders, and quantified the impact of materials and geometry on wear. Milojević et al. [7] discovered that a friction and wear testing machine can effectively replicate the high-temperature and oil-starved environment typically seen when applying “grinding paste,” thus acquiring performance data of piston–cylinder liner friction pairs. The piston movement could have natural potency in a reciprocating gas compressor [8]. Su et al. [9] further clarified that the main factors causing wear of reciprocating compressors include normal force, displacement amplitude, and frequency. When it comes to the wear mechanism, Cho et al. [10] suggested that the maximum wear occurs at the midstroke of the piston motion. Manepatil et al. [11] and Elhaj et al. [12] identified pressure variations in the compression chamber induced by piston movement. Rao et al. [13] found that both the blow-by and frictional power loss of the piston escalate as the rotational speed increases. Cheng et al. [14] explored the relationship between compression cylinder wear and piston acceleration, suggesting a modest increase with higher rotational speeds and wear clearance. On this basis, the dynamic simulation of a reciprocating compressor model with lubricated bearings was carried out and a mixed lubrication model considering oil groove feed was established by Zhang et al. [15]. Concerning operational control, Jarang et al. [16] comprehensively analyzed the main factors affecting the operational performance of compressors, including lubricant viscosity, temperature, impurities, and lubrication system design. Shcherba et al. [17] found that reducing the temperature of the walls and the diameter of the cylinder improves the implementation of the isothermal compression process. Burhanuddin et al. [18] fitted the fault time points from numerical simulations with the least squares method, constructing a compressor cylinder’s life curve. Zhao et al. [19] stated that the physical properties of lubricating oil vary based on specific working conditions, and the lubricating performance can be significantly improved by augmenting compatibility. In conclusion, the current research at home and abroad mostly focuses on analyzing the factors affecting the wear of fundamental components. There are few industrial application cases that thoroughly analyze the abnormal wear mechanisms and on-site wear control of natural gas compressors under diverse operating conditions.
We established a method for calculating the cylinder wear in reciprocating compressors based on the tangential impact energy model [20], aiming to elucidate the specifications of compressors for dust mass concentration in natural gas, lubricating oil properties, and operational control. The operation status of compressors over the past seven years was tracked; extensive field measurement data and computational fluid dynamics (CFD) simulations were adopted to analyze the impact of factors such as dust mass concentration, operational duration, and lubricating oil viscosity on abnormal wear. As a result, a range of indexes were established to monitor the operation of the compression cylinder. Technically, this provides powerful support for the efficient operation of gas storage, ensuring the natural gas supply in the Sichuan–Chongqing region and the Beijing–Tianjin–Hebei region in winter.
2. Experiment
2.1. Operation Principles and Structure of Compression Cylinder
A reciprocating compressor is primarily composed of pistons (orange), compression cylinders (transparent), and inlet and outlet valves (green and blue). As illustrated in Figure 1, the black arrow indicates the direction of low-pressure admission, the red arrow signifies the direction of high-pressure output after compression, and the blue arrow represents the direction of piston movement. Gas always enters from the upper part of the compression chamber and exits from the lower part. The compression cylinder compresses the gas, reducing its volume and increasing its pressure. The coordinated operation of the intake and exhaust valves alternately expels the gas, achieving natural gas compression.
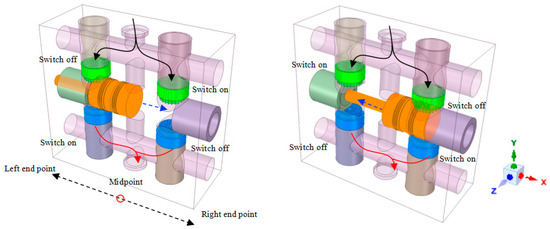
Figure 1.
The principles of a compression cylinder in a reciprocating compressor.
2.2. Experiments to Determine Composition of “Grinding Paste” in Compression Cylinder
A 300 mL sample was extracted from the cylinder during compressor maintenance in order to determine the mass concentration range of dust in the “grinding paste”. Separation using a high-speed centrifuge (Thermo Fisher Sorvall, Waltham, MA, USA) revealed that the dust mass concentration ranged from 0.01% to 3.00%, as shown in Figure 2a. The morphology of the dust in the “grinding paste” is illustrated in Figure 2b. The viscosity and density of “grinding paste” were determined by preparing samples at different dust mass concentrations. The dust mass concentrations in the samples were 0.01%, 0.50%, 1.00%, 1.50%, 2.00%, 2.50%, and 3.00%, respectively. The analysis was conducted at a temperature of 70 °C, utilizing a HAAK viscometer (Thermo Fisher Scientific-HAAKE, Karlsruhe, BW, Germany). The reason for determining the test temperature as 70 °C is that the designed temperature at the outlet of the compression cylinder does not exceed 70 °C, and in the calculation, the temperature in the entire compression cavity is set to be constantly at 70 °C. This is because although the piston friction will generate heat, when the compressor maintains a long-term rotational speed of 994 r/min, the temperature in the entire compression cylinder will reach a dynamic heat-transfer equilibrium. In addition, the cylinder shell has a heat-insulating coating, so the entire system can be regarded as an adiabatic system.
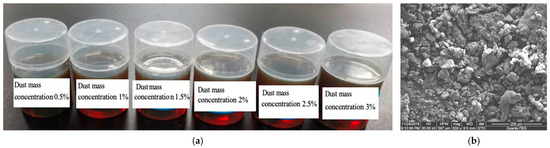
Figure 2.
The grinding paste and the particles inside it, extracted from the compression cylinder. (a) Grinding paste under different particle mass concentrations, extracted from the compression cylinder; (b) the particle size distribution of the grinding paste.
2.3. Measurement of Compression Cylinder Wear
To explore the effect of dust mass concentration on compression cylinders, wear measurement experiments were carried out with compression cylinders for an operation time of 1000 h (see Table 1), with the experiments numbered from No. 1 to No. 7. Cylinder wear was measured by a cylinder gauge (Mitutoyo, Shanghai, China), with a measuring range of 0.01 mm~10 mm and an accuracy of 0.001 mm. The daily gas injection capacity of a single compression cylinder was 55 × 104 Nm3/d. The compressor operated at a speed of 994 rpm. The compression cylinder was made of ASTM 4340 materials, and pistons were constructed from polyethylene terephthalate plastic (PEPT) with a hardness of 32 HRC. In the experiment, the particle size of dust ranged from 10 to 50 μm, and the dust mass concentration varied from 0.01% to 3.0%. The lubricating oil viscosity was maintained at 450,800 mPa·s.

Table 1.
The wear experiments of the cylinder.
To identify the optimal lubricant and minimize the sliding resistance of the friction pair, a contrast experiment was performed on seven lubricants of similar physical properties but different viscosities; the corresponding viscosities varied from 196,980 mPa·s to 450,800 mPa·s (shown in Table 2). This experiment, spanning 1000 h for each test, covered samples labeled as No. 8.1 to No. 8.7, No. 9.1 to No. 9.7, No. 10.1 to No. 10.7, respectively.
Table 2.
The contrast wear experiments of the cylinder.
2.4. Sliding Wear Test
The piston and compression cylinder were sliced and sampled, respectively, to gain the sliding friction coefficient μ between the piston and the compression cylinder. The indoor sliding friction experiment was performed using the high-speed reciprocating module of the UMT friction and wear tester (Bruker Corporation, Billerica, MA, USA). The friction pair adopted SiC ceramic balls with a diameter of 9.5 mm, a hardness of 2800 HV, and a surface roughness value Ra of 0.13 μm [21]. The gap between the sliding friction pairs, which was similar to that in an actual compression cylinder, was 2.26 mm. In this gap, the “grinding paste” was squeezed and rubbed to further determine the sliding friction coefficient between the “grinding paste” and the friction pair. In reality, the existence of this tiny gap can maximize the lifespan of the piston ring and reduce the friction between the piston ring and the cylinder wall.
In addition, the reciprocating speed was 5.68 m/s, the maximum operating pressure is 26 MPa, and the temperature was maintained at 177 °C. The dust mass concentration in the experiment aligned with that shown in Table 1, ranging from 0.01% to 3.0%. During the test, the friction coefficient was recorded and saved in real time by the testing machine. Before and after the test, the samples were ultrasonically cleaned with acetone. After the test, the wear volume of the samples was measured by a Bruker Contour GT-K optical profilometer (Bruker Corporation, Tucson, AZ, USA), and the average value was obtained by measuring the wear volume of each sample four times.
3. Numerical Simulation of Wear Rate
Pereira et al. [22,23] used the dynamic grid method to accurately simulate the operation process of reciprocating compressors. By compiling UDF, the opening and closing of small holes on the gas valve to achieve a cycle of suction–compression–exhaust–suction (using the macro DEFINE_CG_MOTION) are periodically controlled. Furthermore, the sealing between the piston and the compression cylinder is achieved by periodically controlling the expansion and contraction of the sealing ring (using the macro DEFINE-GRID.MOTION) [24].
The flow field is still described using the continuity and momentum equations, as shown in Equations (1) and (2) [25]:
where ρ is the gas phase density (kg/m3), u is the gas phase velocity vector, is the Reynolds stress (m2/s2), g is the gravitational acceleration 9.8 m/s2, μ is the gas viscosity (N·s/m2), and p is the nodal pressure (Pa). The inlet is set as the natural gas velocity inlet, and the velocity value is obtained by converting the compressor processing capacity and operating pressure. The outlet is set as the pressure outlet. At the start of operation, the “grinding paste” is inserted to fill the gap between the piston and the cylinder wall using the Volume-Patch method. The dust mass concentration is reflected by defining the liquid phase viscosity and density.
The contact conditions and constraint conditions of motion are as follows: The geometric parameters of the compression cylinder and piston are presented in Figure 3a. Inside the compression cylinder, four air valves are vertically arranged. These valves have small holes and built-in diaphragms. The diaphragms open and close periodically to realize alternating suction and exhaust processes, as depicted in Figure 3b. The entire fluid domain is divided into mixed grids. Specifically, the inlet and outlet valves are divided into unstructured grids, while the cylinder body, connecting rod, piston, etc., are divided into highly structured grids, as shown in Figure 3c.
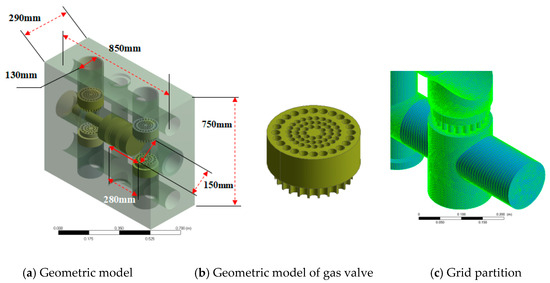
Figure 3.
Modeling and meshing of compression cylinder.
Since the dynamic mesh simulation is to be carried out, the meshes generated in the piston motion area are mainly tetrahedral meshes. These meshes have an aspect ratio of approximately 1, a skewness controlled below 0.9, and an orthogonal quality of 0.95.
The wear between the piston and the compression cylinder wall was calculated using the tangential impact energy model [20]. The surface wall thickness loss, W (mm), can be obtained from Equations (3)–(5), where Eshear is the tangential impact energy, Fct,ij is the shear stress between the piston and the compression cylinder wall, vt,ij is the shear speed of the relative motion between the piston and the compression cylinder wall, and A is the contact area of 0.63 m2 between the specimens. According to the UMT friction and wear experiment, the shear rate is 15.68 m/s at a fixed speed of 994 r/min, where P is the contact surface’s flow pressure, 1.5 times the Vickers hardness [26], and μ is the sliding friction coefficient. To visualize the computation results, the equation was imported into the macro DPM_EROSION and loaded into Ansys Fluent for resolution. The wear rate was calculated for diverse operational durations (100 h to 10,000 h) and dust mass concentrations (0.01%~3.00%).
Figure 4 shows the volume fraction of the particle phase at the outlet of the compression cylinder under 1.6 million, 3.5 million, and 7.7 million grids when the operation time is 0.2 s. It can be observed that, firstly, the convergence trend of the model is the same under different grid sizes. Secondly, only when the number of grids exceeds 1.6 million does the volume concentration of particles at the outlet tend to stabilize. Thirdly, when the number of grids increases from 3.5 million to 7.7 million, the volume fraction of the particle phase remains basically unchanged. Therefore, it can be determined that a grid size of 3.5 million can achieve computational stability, while the grid size is relatively small. Therefore, 3.5 million grids were used for the multiphase flow calculation.
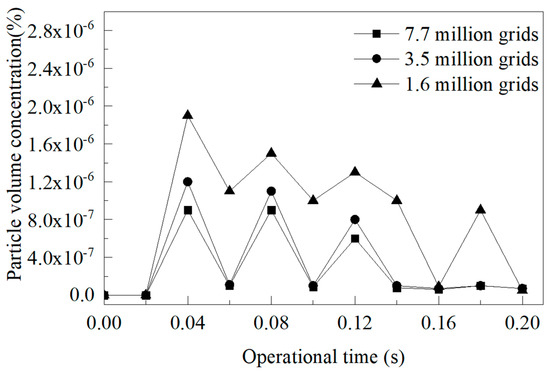
Figure 4.
Grid adaptability analysis.
4. Results and Discussion
4.1. Determination of Compression Cylinder Wear Rate
4.1.1. Physical Property Analysis of “Grinding Paste”
We extracted the grinding paste as described in Section 2.2, and conducted a viscosity and density analysis, as shown in Table 3, to determine the viscosity and density distribution of the paste at different dust mass concentrations. The viscosity of the grinding paste increased from 450,800 mPa·s to 1,274,000 mPa·s with the rise in dust mass % in the lubricating oil. The density increased from 890 kg/m3 to 980 kg/m3.
Table 3.
Variations in the friction coefficient μ with an increasing particle mass concentration.
Almasi et al. [2] claimed that high-viscosity lubricants are quickly consumed and deteriorated at high temperatures. Simultaneously, natural gas compressor lubricant oils are characterized by heavy distillate, high viscosity, high asphaltene, and other contents. Thus, micropollution may deteriorate the lubrication conditions.
4.1.2. Determination of Coefficient of Sliding Friction
Figure 4 illustrates the results of the UMT wear experiments mentioned in Section 2.4. The coefficient of friction initially rises and subsequently declines as the running time increases, which aligns with the findings of Grabon et al. [6] and Tomanik et al. [27]. This is due to the fact that the sliding friction coefficient μ must achieve a steady temperature in the friction pair after a specific duration. Once the running time reaches 60 min, the sliding friction temperature remains constant, and the coefficient of friction curve progressively stabilizes. Thus, the sliding friction coefficient after 60 min of running is incorporated into Equation (5), with the corresponding values presented in Table 4.
Table 4.
Friction coefficient μ of reciprocating motion between compression cylinder and piston.
According to Milojević et al. [7], the temperature exerts a slight impact on the friction coefficient as it remains constant at 177 °C. When the load is known, the friction coefficient μ also exhibits a marginal reduction. A comparison of Figure 5 with the findings of Milojević et al. [7] reveals that increasing the dust mass concentration in the lubricant does not have the same effect as elevating the experimental load. Increasing the amount of dust makes the sliding friction coefficient μ grow faster, while increasing the experimental load slowly makes μ decrease.
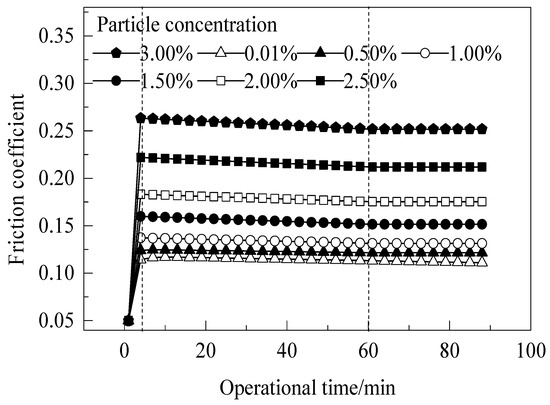
Figure 5.
Variations in the friction coefficient μ with increasing particle mass concentration and operational time.
4.1.3. Changes in Shear Stress
The CFD numerical simulations described in Section 3 demonstrate that the shear stress within the compression cylinder varies when the mass concentration of dust in the “grinding paste” is 3.0%. Specifically, the cylinder wall experiences a minimal shear stress of 0.0001 MPa at both the left and right endpoints of the stroke, since the piston does not come into contact with it during the reciprocating cycle of the intake and exhaust process. As shown in Figure 6, the piston experiences a peak shear stress of up to 0.2 MPa while maintaining contact with the cylinder wall during its full stroke at the midpoint. It was found by Cho et al. [8] that near the end of a piston operating cycle (approximately 0.2 s), both the axial and radial forces reach their peak, causing the maximum shear force. Nevertheless, the acceleration (also called shear stress) is directed oppositely during a cycle. Figure 5 depicts the force magnitudes, indicating that the shear stress direction opposes the piston motion.
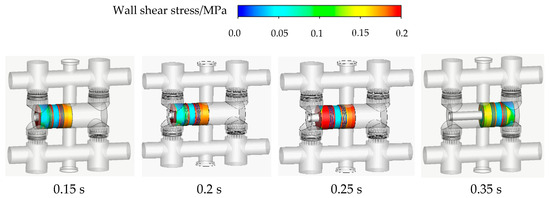
Figure 6.
The process of the wall shear stress variation during the piston’s reciprocating motion.
4.1.4. Concentration Distribution of Grinding Paste
The area of the “grinding paste” attached to the piston is distributed as illustrated in Figure 7 when the dust mass concentration reaches 3.0%, according to the numerical simulation. It is evident that throughout the piston stroke, at both endpoints, the piston is no longer in contact with the cylinder wall. However, the concentration of the “grinding paste” adhering to the piston remains significantly high. This can be ascribed to the adhesive properties of “grinding paste”, which has high viscosity and density. Positioning the piston near the stroke’s midpoint lowers the concentration of “grinding paste” for two reasons. First of all, the piston ring inhibits the transfer of the “grinding paste” to the opposite side. Second, the minimal gap between the piston and the cylinder results in a low mass concentration of the “grinding paste” that can be retained. At dust mass concentrations of 0.5%, 1.0%, 1.5%, 2.0%, or 2.5%, the distribution of the “grinding paste” follows the similar pattern depicted in Figure 6.
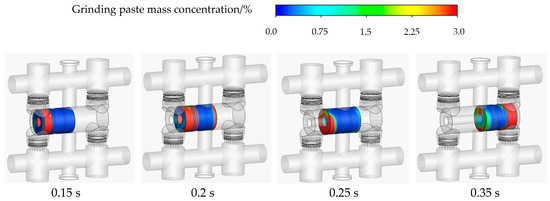
Figure 7.
The grinding paste’s distribution in the compression cylinder during the piston’s reciprocating motion.
4.1.5. Determination of Wear Rate
In accordance with Section 4.1.1, Section 4.1.2, Section 4.1.3 and Section 4.1.4, we determined the physical properties of the grinding paste, the sliding friction coefficient of the piston and compression cylinder, the shear stress, and the wear area. In addition, the macro DPM_EROSION was elaborated upon. The sliding wear rate of the contact surface between the piston and the compression cylinder was gained by integrating Equations (3)–(5) into Ansys Fluent, as shown in Figure 8. The results elucidate that at a dust mass concentration of 3.0%, when the piston was in the midpoint of the stroke, the shear stress was the highest and the wear rate was the highest, reaching up to 1.89 × 10⁻⁷ mm/s. When the piston was on both endpoints of the stroke, the wear rate was the lowest, measuring 2.2 × 10⁻⁹ mm/s. At concentrations of 2.5%, 2.0%, 1.5%, 1.0%, 0.5%, and 0.01%, the wear rates after 1000 h of running were recorded as 1.3 × 10⁻⁷ mm/s, 1.1 × 10⁻⁷ mm/s, 7.9 × 10⁻⁸ mm/s, 5.4 × 10⁻⁸ mm/s, 2.2 × 10⁻⁹ mm/s, and 2.2 × 10⁻⁹ mm/s, respectively. In most cases, wear occurred in the top (12 o’clock) and bottom (6 o’clock) positions of the compression cylinders. The errors between the calculated wear rates and the actual wear rates observed in the field compressor cylinders (experiments No. 1 to No. 7) after 1000 h of running were 10.9%, 2.89%, 5.16%, 9.01%, 6.47%, and 1.02%, respectively, as shown in Figure 9.
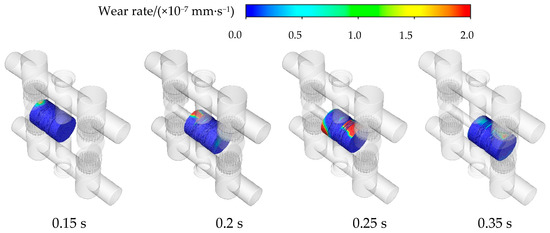
Figure 8.
The calculated wear rates of the compression cylinder.
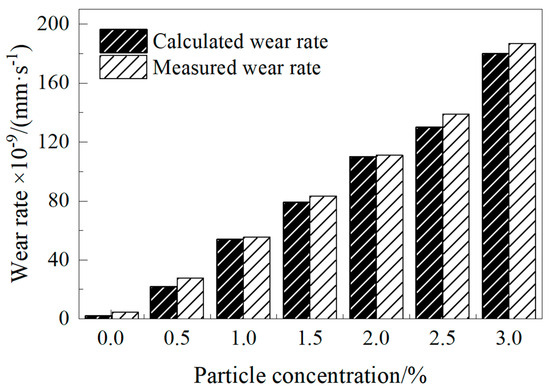
Figure 9.
The calculated and experimental results for the wear rate.
Based on the calculated wear rate, the service life of the compression cylinder can be estimated as per the following manufacturer specifications: “The compression cylinder shall be repaired and replaced once the wear reaches 0.13 mm and 1.16 mm”. Specifically, at dust quality concentrations of 3.0%, 2.5%, 2.0%, and 1.5%, compression cylinders should not be used for more than 1000 h. Exceeding this threshold warrants repairs. If left unrepaired and used continuously, the cylinders will not reach a lifespan of 5000 h, and will be subject to mandatory scrapping after six months of operation.
4.2. Determination of Compression Cylinder’s Operation Monitoring Criteria
According to the wear rate model in the preceding section, the wear rate was calculated for different operation durations (100 h to 10,000 h) and diverse dust mass concentrations (0.01% to 3.0%). It is advisable to keep the dust mass concentration below 0.6% to avert the necessity of repairing the compression cylinder after every 1000 h of operation (with wear less than 0.13 mm, below the dotted line in Figure 10). For every 5000 and 10,000 h of operation without maintenance (i.e., wear less than 1.16 mm, as indicated below the dotted line in Figure 11), the dust mass concentration should be controlled below 1.3% and 0.4%, respectively, as seen in Figure 11. The dotted line in the figure indicates that when the compression cylinder wears down to the corresponding value, it needs to be repaired.
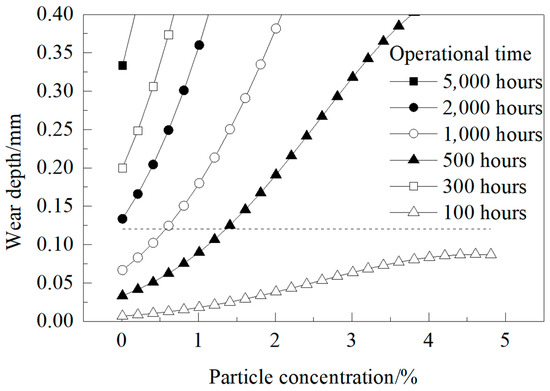
Figure 10.
The calculated relationships between the dust mass concentration and the wear rate under 100~5000 h.
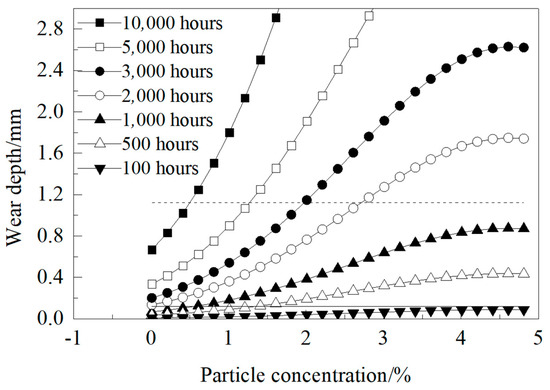
Figure 11.
The calculated relationships between the dust mass concentration and the wear rate under 100~10,000 h.
4.3. Lubricating Oil Viscosity Reduction Experiment Results
4.3.1. Relationship Between Lubricating Oil Viscosity and Wear Rate
Drawing from Figure 10 and Figure 11, and citing the field trial of lubricating oil conducted by Almasi et al. [2], the concept of utilizing low-viscosity lubricating oil was investigated. The relation between particle concentration and wear rate, concerning variations in operating viscosity, was summarized. Equation (6) illustrates that x means the mass concentration of the “grinding paste” within the pipeline, μ signifies the viscosity of the lubricating oil, and A represents a constant valued at 0.002.
Equation (6) was used to calculate the wear rate per 1000 h of operation with a gradual decrease in the viscosity of the lubricating oil. Accordingly, an experimental design was proposed for the trial of seven lubricants with viscosities of 450,800 mPa·s, 392,000 mPa·s, 343,000 mPa·s, 289,100 mPa·s, 259,700 mPa·s, 220,500 mPa·s, and 196,980 mPa·s. The results of the calculations performed prior to the experiment using Equation (6) demonstrate that the wear rate decreases gradually with increasing lubricant viscosity. When the lubricant viscosities are 289,100 mPa·s, 259,700 mPa·s, 220,500 mPa·s, and 196,980 mPa·s, the compression cylinders require no repair for over 1000 h of operation, provided that the dust mass concentration remains below 1.0%, as shown in Figure 12. The dotted line in the figure indicates that when the compression cylinder wears down to the corresponding value, it needs to be repaired.
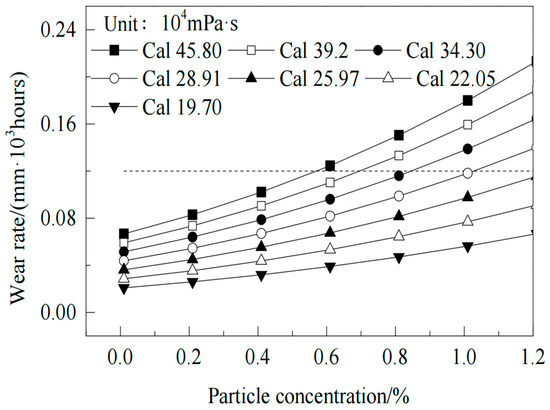
Figure 12.
The calculated relationships between the wear rate and the particle mass concentration under different viscosities in 1000 h.
4.3.2. Viscosity Reduction Effect
However, when experiments were conducted to examine the effects of these seven lubricants after 1000 h of operation (experiments No. 1, No. 2, No. 3, and No. 7~No. 14), it was found that the wear rate gradually decreased with increasing lubricant viscosity when the dust mass concentration was 0.01%. The experimental results align with the calculated results. When the dust mass concentration is 0.51% and 1.0%, the wear rate increases steeply at lubricant viscosities of 259,700 mPa·s, 220,500 mPa·s, and 196,980 mPa·s (No. 8.5–No. 8.7, No. 9.5–No. 9.7, No. 10.5–No. 10.7), which is more different from the calculated results of Equation (6), as shown in Figure 13.
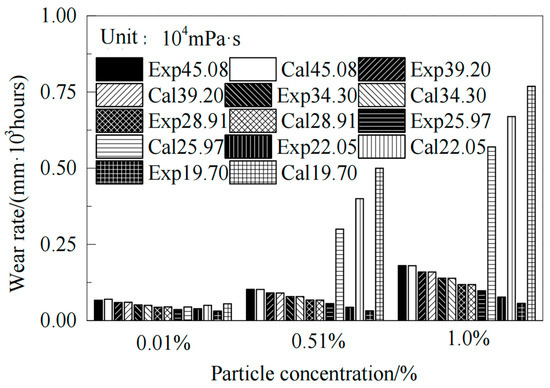
Figure 13.
The experimental relationships between the wear rates and 3 kinds of particle mass concentrations under different viscosities in 1000 h.
It was found that the fluidity of lubricant increases as its viscosity decreases, making it easier to emulsify and dilute, further reducing its lubricating effect. Similarly, Jurayev et al. [3] indicated that the viscosity of lubricating oil was reduced by 50% with each 10 °C rise in temperature. The lubricating oil is contaminated to a certain degree by the dust it contains. At a lower viscosity, the lubricant is more prone to emulsification and dilution, resulting in extra viscosity reduction and weakening of the damping effect. Nevertheless, when the dust mass fraction exceeds 0.01%, the abrasive effect is enhanced to some extent. This not only makes it difficult to provide a lubricating effect, but also hastens wear.
5. Conclusions
A method for calculating the cylinder wear of reciprocating compressors was established, based on the tangential impact energy model. By tracking the operating conditions of the compressor over the past seven years and referring to on-site measurement data and CFD simulation, we analyzed the effects of dust mass concentration, operating duration, lubricant viscosity, and other factors on abnormal wear. The findings are as follows:
- (1)
- The lubrication conditions in the compression cylinder became worse as the mass percentage of dust in the lubricating oil increased. The viscosity of the grinding paste rose from 450,800 mPa·s to 1,274,000 mPa·s, and the density increased from 890 kg/m3 to 980 kg/m3.
- (2)
- Specifically, the cylinder wall experienced a minimal shear stress of 0.0001 MPa at both the left and right endpoints of the stroke, since the piston did not come into contact with it during the reciprocating cycle of the intake and exhaust process. However, the concentration of the “grinding paste” adhering to the piston remained significantly high. This can be ascribed to the adhesive properties of “grinding paste”, which has a high viscosity and density. When the piston is positioned near the stroke’s midpoint, the concentration of “grinding paste” is lower for two reasons. First of all, the piston ring inhibits the transfer of the “grinding paste” to the opposite side. Second, the minimal gap between the piston and the cylinder results in a low mass concentration of the “grinding paste” that can be retained.
- (3)
- The error in the calculation of wear rate when utilizing the CFD method may be maintained below 10%. It was revealed that for every 1000 h of operation without repairing the compression cylinder (wear less than 0.13 mm), the dust mass concentration should be controlled below 0.6%; for every 5000 h and 10,000 h of operation without replacing the cylinder (wear less than 1.16 mm), the dust mass concentration should be kept below 1.3% and 0.4%, respectively.
- (4)
- It was observed that the wear rate of the seven lubricants with viscosities of 450,800 mPa·s, 392,000 mPa·s, 343,000 mPa·s, 289,100 mPa·s, 259,700 mPa·s, 220,500 mPa·s, and 196,980 mPa·s decreased gradually with increasing lubricant viscosity at a dust mass concentration of 0.01%; however, at dust mass concentrations of 0.51% and 1.0%, the wear rate increased sharply when the lubricant viscosity was 259,700 mPa·s, 220,500 mPa·s, and 196,980 mPa·s.
Author Contributions
Methodology, Z.D.; Validation, J.S.; Formal analysis, F.W. (Fei Wang) and Y.W.; Investigation, S.Z.; Resources, Q.B. and W.J.; Data curation, F.W. (Feng Wang), J.C. and Z.P.; Writing—original draft, S.Z. All authors have read and agreed to the published version of the manuscript.
Funding
This work is supported by the National Natural Science Foundation of China (Grant No. 51775463) and the International Cooperation Project of Chengdu Science and Technology Bureau (2019-GH02-00055-HZ).
Data Availability Statement
The original contributions presented in this study are included in the article. Further inquiries can be directed to the corresponding author.
Conflicts of Interest
Authors Sijia Zheng, Zhixiang Dai, Fei Wang, Feng Wang, Yongbo Wang, Qin Bie, Wei Jiang, Jingdong Chen, and Zicheng Peng were employed by the Southwest Oil and Gas Field Company of CNPC. The remaining authors declare that the research was conducted in the absence of any commercial or financial relationships that could be construed as a potential conflict of interest.
References
- Pawar, P.B. Compressor, pneumatic components, and accessories in fluid system. In Industrial Hydraulics and Pneumatics; Sankalp Publication: Bilaspur, Chhattisgarh, 2020. [Google Scholar]
- Almasi, A. Latest technologies of rotating machine lubrication and lubricant selection. Aust. J. Mech. Eng. 2015, 9, 171–183. [Google Scholar] [CrossRef]
- Jurayev, R.; Xatamova, D.; Pardayeva, S. Increasing the operating efficiency of mining compressor installations on the basis of improving the cooling, lubrication and air suction system. E3S Web Conf. 2023, 417, 03016. [Google Scholar] [CrossRef]
- Almeida, I.M.G.; Barbosa, C.R.F.; Fontes, F.D.A.O. Methods of wear tests for hermetic reciprocating compressors: An overview. Holos 2016, 4, 86–104. [Google Scholar] [CrossRef]
- Elhaj, M.; Almrabet, M.; Rgeai, M.; Ehtiwesh, I. A combined practical approach to condition monitoring of reciprocating compressors using IAS and dynamic pressure. Int. J. Mech. Mechatron. Eng. 2010, 4, 287–293. [Google Scholar]
- Grabon, W.; Pawlus, P.; Sep, J. Tribological characteristics of one-process and two-process cylinder liner honed surfaces under reciprocating sliding conditions. Tribol. Int. 2010, 43, 1882–1892. [Google Scholar] [CrossRef]
- Milojević, S.; Pešić, R.; Taranović, D. Tribological principles of constructing the reciprocating machines. Tribol. Ind. 2015, 37, 13–19. [Google Scholar]
- Silva, E.; Dhutra, T. Piston trajectory optimization of a reciprocating compressor. Int. J. Refrig. 2021, 121, 159–167. [Google Scholar] [CrossRef]
- Su, J.; Zhang, T.F.; Ke, L.L. Fretting wear behavior of silicone rubber under quartz sand abrasives. Wear 2025, 564–565, 205721. [Google Scholar] [CrossRef]
- Cho, I. Dynamic behavior characteristics of piston in reciprocating compressor. Korean Soc. Tribol. Lubr. Eng. 2013, 29, 105–110. [Google Scholar]
- Manepatil, S.; Yadava, G.S.; Nakra, B.C. Modelling and computer simulation of reciprocating compressor with faults. J. Inst. Eng. Mech. Eng. Div. 2000, 81, 108–116. [Google Scholar]
- Elhaj, M.; Gu, F.; Ball, A.D.; Albarbar, A.; Al-Qattan, M.; Naid, A. Numerical simulation and experimental study of a two-stage reciprocating compressor for condition monitoring. Mech. Syst. Signal Process. 2008, 22, 374–389. [Google Scholar] [CrossRef]
- Rao, X.; Sheng, C.; Guo, Z.; Yuan, C. Influence of surface groove width on tribological performance for cylinder liner–piston ring components. Tribol. Trans. 2019, 62, 239–248. [Google Scholar] [CrossRef]
- Cheng, S. Dynamic analysis of reciprocating compressor with a translational joint clearance. Vibroeng. Procedia 2018, 18, 36–40. [Google Scholar] [CrossRef][Green Version]
- Zhang, J.J.; Song, C.Y.; Lei, F.C.; Wang, Y.; Zhi, H.; Liu, F. Research on the dynamic response of connecting rod bearing bush wear of reciprocating machine under variable working conditions. High Technol. Lett. 2023, 29, 148–158. [Google Scholar]
- Jarang, H.G.; Deshpande DR, S. The survey on reciprocating gas compressor—A review. Int. J. Sci. Res. 2022, 11, 389–393. [Google Scholar] [CrossRef]
- Shcherba, V.; Pavlyuchenko, E.; Nosov, E.; Bulgakova, I.Y. Approximation of the compression process to isothermal in a reciprocating compressor with a liquid piston. Appl. Therm. Eng. 2022, 207, 118151. [Google Scholar] [CrossRef]
- Burhanuddin, F.; Yuwono, A.H.; Yuliati, D. Improved Maintenance Strategy for Reciprocating Compressor Based on Reliability and Safety. Int. J. Reliab. Risk Saf. Theory Appl. 2024, 7, 73–81. [Google Scholar]
- Zhao, Z.; Ma, Y.; Ju, P.; Wu, Y.; Chen, L.; Zhou, H.; Chen, J. Improved wear resistance and environmental adaptability of a polysiloxane/molybdenum disulfide composite lubricating coating using polyhedral oligomeric silsesquioxane. ACS Appl. Mater. Interfaces 2022, 14, 36105–36115. [Google Scholar] [CrossRef]
- Xu, C.; Liu, Z.; Zhou, L.; Zhao, Y. Development of a DEM method for predicting wear distribution on particle scale. Powder Technol. 2024, 432, 119126. [Google Scholar] [CrossRef]
- Zhao, E.H.; Ma, B.; Li, H.Y. Study on the high temperature friction and wear behaviors of Cu-based friction pairs in wet clutches by pin-on-disc tests. Adv. Mater. Sci. Eng. 2017, 2017, 6373190. [Google Scholar] [CrossRef]
- Pereira, E.L.; Santos, C.J.; Deschamps, C.J.; Kremer, R. A simplified CFD model for simulation of the suction process of reciprocating compressors. In Proceedings of the International Compressor Engineering Conference at Purdue, West Lafayette, IN, USA, 16–19 July 2012; pp. 234–289. [Google Scholar]
- Pereira, E.; Deschamps, C.J.; Ribas, F.A. Performance analysis of reciprocating compressors through computational fluid dynamics. Arch. Proc. Inst. Mech. Eng. Part E J. Process Mech. Eng. 2008, 222, 183–192. [Google Scholar] [CrossRef]
- Chang, X.; Ma, R.; Zhang, L.; He, X.; Li, M. Further study on the geometric conservation law for finite volume method on dynamic unstructured mesh. Comput. Fluids 2015, 120, 98–110. [Google Scholar] [CrossRef]
- Zhang, Y.; Reuterfors, E.; McLaury, B.; Shirazi, S.; Rybicki, E. Comparison of Computed and Measured Particle Velocities and Erosion in Water and Air Flows. Wear 2007, 263, 330–338. [Google Scholar] [CrossRef]
- Beinert, S.; Fragnière, G.; Schilde, C.; Kwade, A. Analysis and modelling of bead contacts in wet-operating stirred media and planetary ball mills with CFD–DEM simulations. Chem. Eng. Sci. 2015, 134, 648–662. [Google Scholar] [CrossRef]
- Tomanik, E. Friction and wear bench tests of different engine liner surface finishes. Tribol. Int. 2008, 41, 1032–1038. [Google Scholar] [CrossRef]


Disclaimer/Publisher’s Note: The statements, opinions and data contained in all publications are solely those of the individual author(s) and contributor(s) and not of MDPI and/or the editor(s). MDPI and/or the editor(s) disclaim responsibility for any injury to people or property resulting from any ideas, methods, instructions or products referred to in the content. |
© 2025 by the authors. Licensee MDPI, Basel, Switzerland. This article is an open access article distributed under the terms and conditions of the Creative Commons Attribution (CC BY) license (https://creativecommons.org/licenses/by/4.0/).