Article

Thermodynamic Analysis of a Compact System Generating Hydrogen for Mobile Fuel Cell Applications

1
Shandong Engineering Research Centre for Pollution Control and Resource Valorization in Chemical Industry, College of Environment and Safety Engineering, Qingdao University of Science and Technology, 53 Zhengzhou Road, Qingdao 266042, China
2
Qingdao Institute of Bioenergy and Bioprocess Technology, Chinese Academy of Sciences, 189 Songling Road, Qingdao 266101, China
3
R&D Division, Vitalite ApS, DK-3450 Allerod, Denmark
4
Tianjin Passion Advanced Material Technology, LLC., TEDA, Tianjin 300280, China
*
Authors to whom correspondence should be addressed.
Processes 2025, 13(5), 1273; https://doi.org/10.3390/pr13051273
Submission received: 24 March 2025 / Revised: 17 April 2025 / Accepted: 20 April 2025 / Published: 22 April 2025
(This article belongs to the Special Issue Studies on Chemical Processes Thermodynamics)

Abstract

:
A thermodynamic analysis of a compact hydrogen generation system for mobile fuel cell applications is presented. The system consists of a miniature autothermal steam reformer (ATR) and a water–gas shift (WGS) reactor, designed to produce hydrogen from hydrocarbon fuels for a 1 kW proton exchange membrane (PEM) fuel cell. Methane is used as the model fuel, and the study focuses on optimizing feed compositions and operational conditions to maximize hydrogen yield and purity. Feed compositions and operational conditions are optimized. In total, 0.7 Nm3 h−1 H2 is generated from 0.25 Nm3 h−1 CH4 with properly adjusted steam and air feeding. Issues with product purity and start-up procedures have been identified and discussed, along with feasible solutions. The system is suitable for remote and mobile applications.

1. Introduction

Water splitting through various photocatalytic or electro-photochemical processes may provide a sustainable supply of hydrogen as energy carrier in the future [1,2,3,4,5]. However, before the widespread industrial adoption of these processes, steam reforming of hydrocarbon fuels remains the main intermediate method to produce hydrogen [6,7,8,9].
At larger scales, hydrogen production is carried out in a series of steam reformers, water–gas shift reactors, and gas cleaning units [10,11]. By carefully selecting the operational parameters, such as the feed flow compositions, temperatures, and pressures in the reformers and shift reactors, as well as selecting the methods for supplying and removing heat to and from the reactors, etc., hydrogen gasses of various purities are obtained for a number of chemical and energy applications [12,13], such as ammonia synthesis, methanol synthesis, SNG production, etc. Purified hydrogen produced from hydrocarbon steam reforming is also stored in small high-pressure vessels and distributed for mobile uses [14,15]. The scale of such production can be as large as several thousand metric tons per day. At such a scale, the equipment productivity per unit volume becomes critical, in addition to material and energy efficiency. Therefore, large-scale steam reformers are usually operated at high temperatures above 1000 K and high pressures around 2–3 MPa [16,17,18]. However, from a thermodynamic perspective, lower pressure leads to higher fuel conversion and higher H2 yields.
On the other hand, PEM fuel cell activities continue to increase, particularly in mobile and distributed energy systems. As global demand for hydrogen technology continues to rise, PEM fuel cells are increasingly gaining attention among commercial and research activities, e.g., from different motor and aerospace uses to portable power backup systems [19]. For these mobile fuel cell applications, in addition to pressure vessels, small-scale and localized hydrogen production is desired in certain cases. Miniature steam reforming plants are one of many methods to meet these demands. In such cases, maximum hydrogen yields, as well as safety and ease of operation, become the most critical factors in judging their feasibility. Operating at lower temperatures and pressures would introduce new routines [20,21].
In this paper, we present a compact system consisting of a miniature autothermal steam reformer (ATR) and a subsequent water–gas shift reactor (WGS) to generate hydrogen to supply a 1 kW PEM fuel cell. Such systems can be used in various mobile scenarios, e.g., providing a combined supply of heat and power at remote sites using LNG or LPG fuels, or powering long-haul, heavy-duty drones that can carry liquid fuel tanks in liter-sized containers [22,23,24]. Taking methane as a model fuel, thermodynamic analysis was performed considering feed and effluent compositions, methane conversion, H2 yields and purities, energy efficiency, etc., under stable operating conditions.

2. Materials and Methods

2.1. Reactions and Equilibrium Constants

Scilab (version 6.1.1) software was used for solving the equations.
The reaction of hydrocarbon steam reforming [25,26,27], as listed in Table 1, Reaction (1), using methane as the simplest example, is an extremely endothermal reaction. In larger scale production operations, external heat can be supplied to the reactor tubes. In autothermal steam reformers (ATR), oxygen is supplied along with the reactants [28,29,30]. The partial and total oxidation of both reactants and products produces the required heat, such as in Reactions (3), (4) and (7), (8). In the present design, air is co-fed to operate the reformer working in a manner of ATR [30,31].
A number of other sequential or competing reactions occur in the reformer. The water–gas shift (WGS) reaction (2) is a significant exothermic reaction. The dry reforming of methane using CO2 to produce synthesis gas (5) also occurs.
The above reactions are interconnected by six common molecules, i.e., H2, CO, CO2, CH4, H2O, and O2. We chose the three most significant and independent reactions, (1), (2), and (3), to calculate the equilibrium compositions. The other reactions can be considered as respective combinations of the independent ones.
Undesired coking may take place in the reacting system, for instance, through Reactions (9) and (10). Fortunately, experience gained from larger scale operations has shown that coking can be suppressed by choosing coke-resistant catalysts and optimizing the feed compositions, especially the steam and oxygen contents [10,16,32]. At the current stage, we first ignored the coke formation for the thermodynamic analysis.
For the equilibrium constants of the steam reforming and water–gas shift reactions, we take the partial pressure as the absolute atm of the respective components at the ATR exit, i.e.,
K = P d v d P i v i
where P represents the pressure, the subscript d represents the product, i represents the reactants, and v is the respective stoichiometric factor.
Table 2 represents the temperature dependency of the equilibrium constants taken from literature [31]. These empirical equations are widely accepted and commonly used to treat steam reforming and WGS reactions.
The partial oxidation of methane (3) is considered being completed at ATR exit, which is a common treatment regarding the thermodynamic and kinetic relations with the other dependent reactions in the overall reaction network [10,12,31].

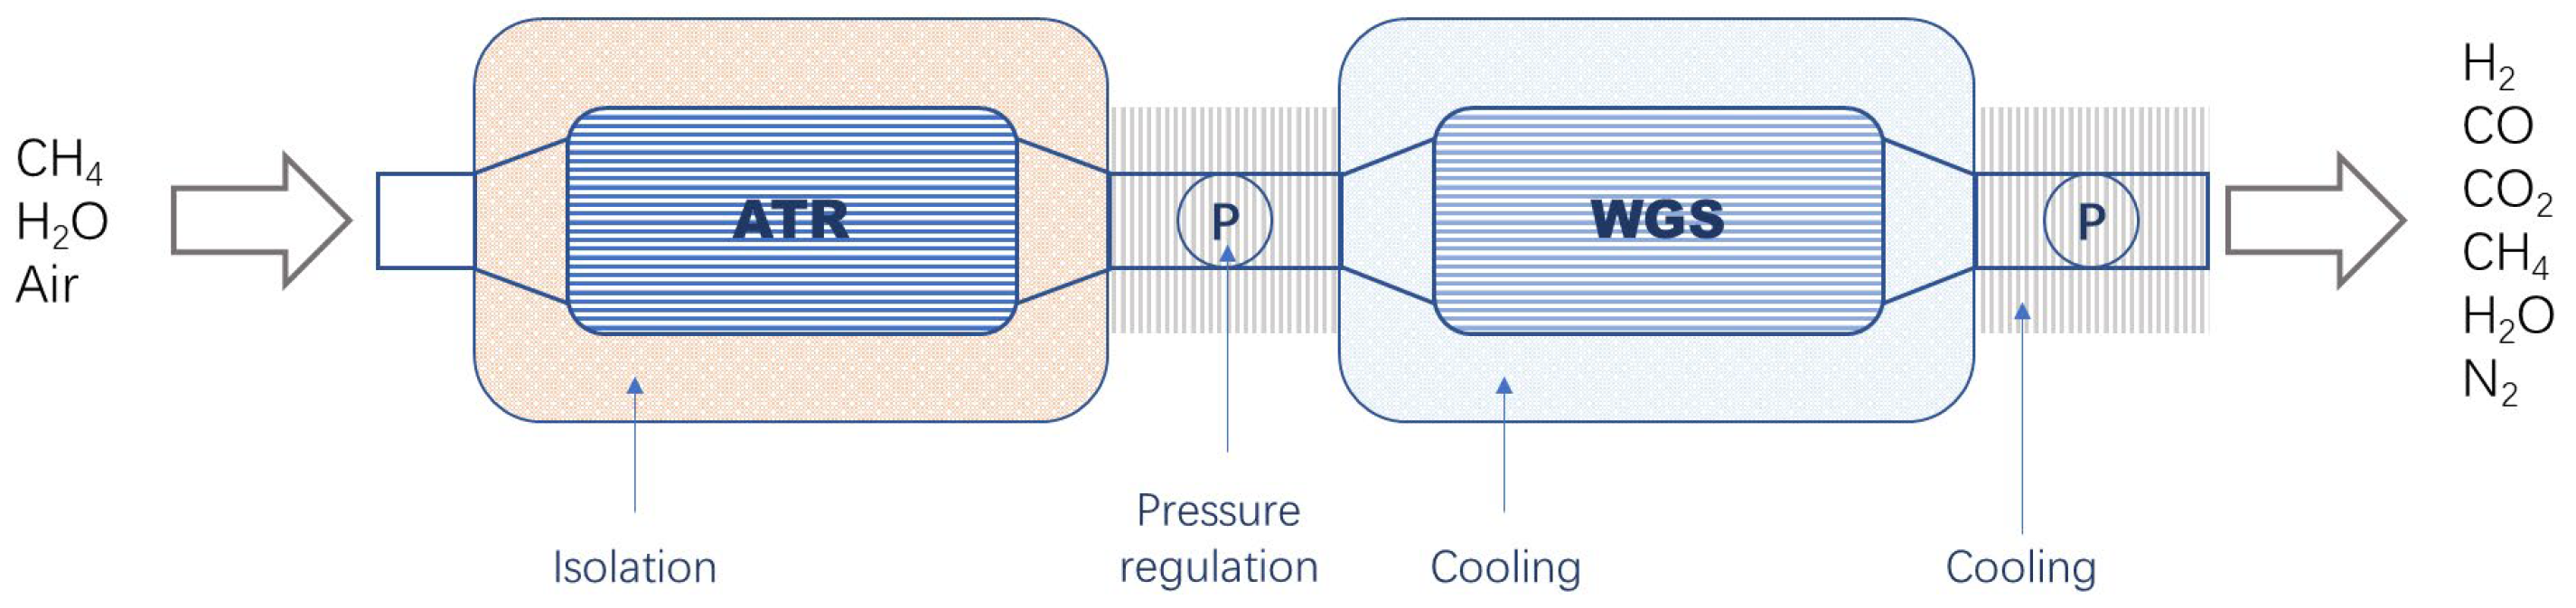
2.2. System Description

Considering that a typical PEM fuel cell usually has a fuel-to-electricity efficiency of around or higher than 40% [33,34], and that H2 gas has a combustion heat at standard conditions of 284 kJ mol−1 to liquid water [35], a 1 KW PEM FC would consume ca. 0.7 Nm3 h−1 H2. PEM fuel cells are well tolerable against water, CO2, and CH4 impurities in the hydrogen feeds. However, CO must be reduced to a sub-ppm level to prevent the degradation of noble metal catalysts on the electrodes [36], or other means have to be taken to mitigate CO poisoning [37,38].
Here, we analyze a compact system consisting of two sequential reactors. An upstream ATR reactor is fed with methane, steam, and air. The effluent synthesis gas is then fed to a downstream WGS reactor to obtain a desired fuel stream containing maximum hydrogen and minimum carbon monoxide. Both reactors should be operated at the lowest possible temperatures and at pressures not much higher than the atmospheric pressure. At a gas hour space velocity (GHSV) of 4000–5000 h−1, the volume of the ATR catalyst bed is estimated at ca. 400 mL. A similar size can be applied to the WGS reactor. Micro-channel reactors made of stacks of highly heat-conducting steals are suggested, as illustrated in Figure 1. The internal channel walls of the ATR are coated with a Ni/Al2O3 catalyst modified with rare earth and noble metal components [39,40,41], while the WGS use a Cu/Zn/Al2O3 or Fe/Cr catalyst [42,43].
To initiate hydrogen generation, a stream containing extra air is fed to the ATR. When the temperature reaches the desired value, the normal feed stream is switched online, and a stable operating state is established.

3. Results and Discussions

3.1. Analysis of Autothermal Reformer (ATR)

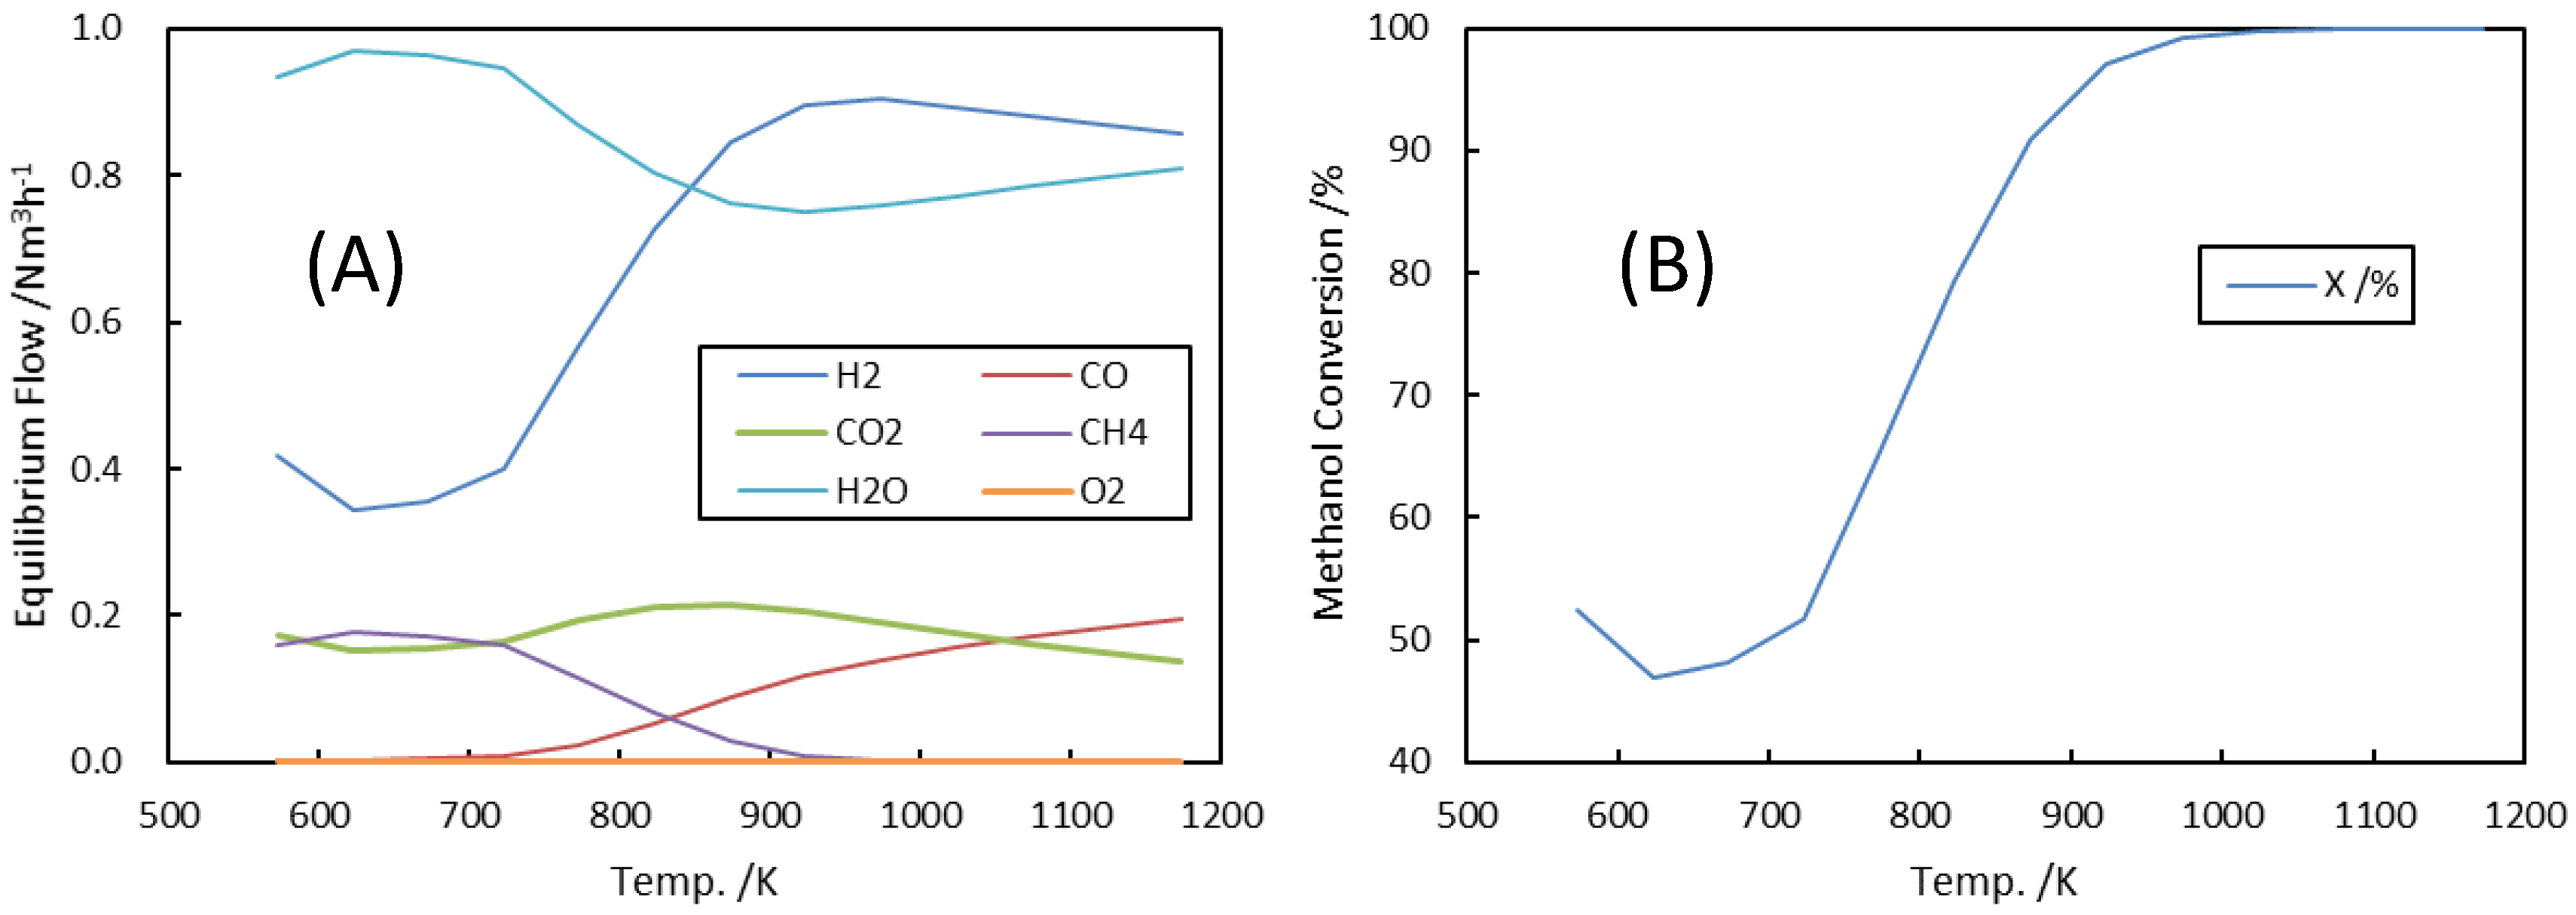
3.1.1. Equilibrium Flow at ATR Exit

Methane conversion and equilibrium flow compositions were calculated for a gaseous feed at a total flow rate of 2 Nm3 h−1, with an air/carbon ratio (ACR) of 2 and a steam/carbon ratio (SCR) of 3. Assuming that the ATR exit had an absolute pressure of 1 atm., and the partial oxidation was complete, the x mol h−1 of CH4 was converted in the steam reforming reaction, and the y mol h−1 of CO was converted in the WGS. The relative mol flow compositions for the feed and the equilibrium flow applied at the ATR exit are listed in Table 3.
Furthermore, the N2 flow rate remained at 0.79 n a i r 0 in the feed and at the ATR exit. The total mol flow at the ATR exit becomes n C H 4 0 + n H 2 O 0 + 1.07 n a i r 0 + 2 x . The respective equilibrium constants can be represented using the following values:
K 1 = ( 0.14 n a i r 0 + x y ) ( 3 x + y ) 3 n C H 4 0 0.14 n a i r 0 x ( n H 2 O 0 + 0.28 n a i r 0 x y ) ( P e x i t n C H 4 0 + n H 2 O 0 + 1.07 n a i r 0 + 2 x ) 2
where P e x i t is the pressure at the ATR exit in absolute atm.
K 2 = ( y ) ( 3 x + y ) ( 0.14 n a i r 0 + x y ) ( n H 2 O 0 + 0.28 n a i r 0 x y )
Solving the equations against x and y, the equilibrium flow compositions in the temperature range of 573–1173 K were obtained, as presented in Figure 2A.
The equation for the conversion of methane in ATR is
X % = n C H 4 0 ( n C H 4 0 0.14 n a i r 0 x ) n C H 4 0 100 .
Its temperature dependency is illustrated in Figure 2B.
Starting at 673 K, methane conversion became significant and reached a level > 99% above 973 K. The hydrogen yields increased in parallel with increasing methane conversion, resulting in a flow of 0.9 Nm3 h−1 between 923 and 973 K. This value already meets the requirement of a 1 kW fuel cell. It decreased slightly at further elevated temperatures. The CO yields increased monotonically from 573 K upwards. At 973 K, it resulted in a CO concentration of ca. 10% in the dry components. PEM fuel cells cannot work with such a high concentration of CO, so it must be further converted in the subsequent WGS reactor.

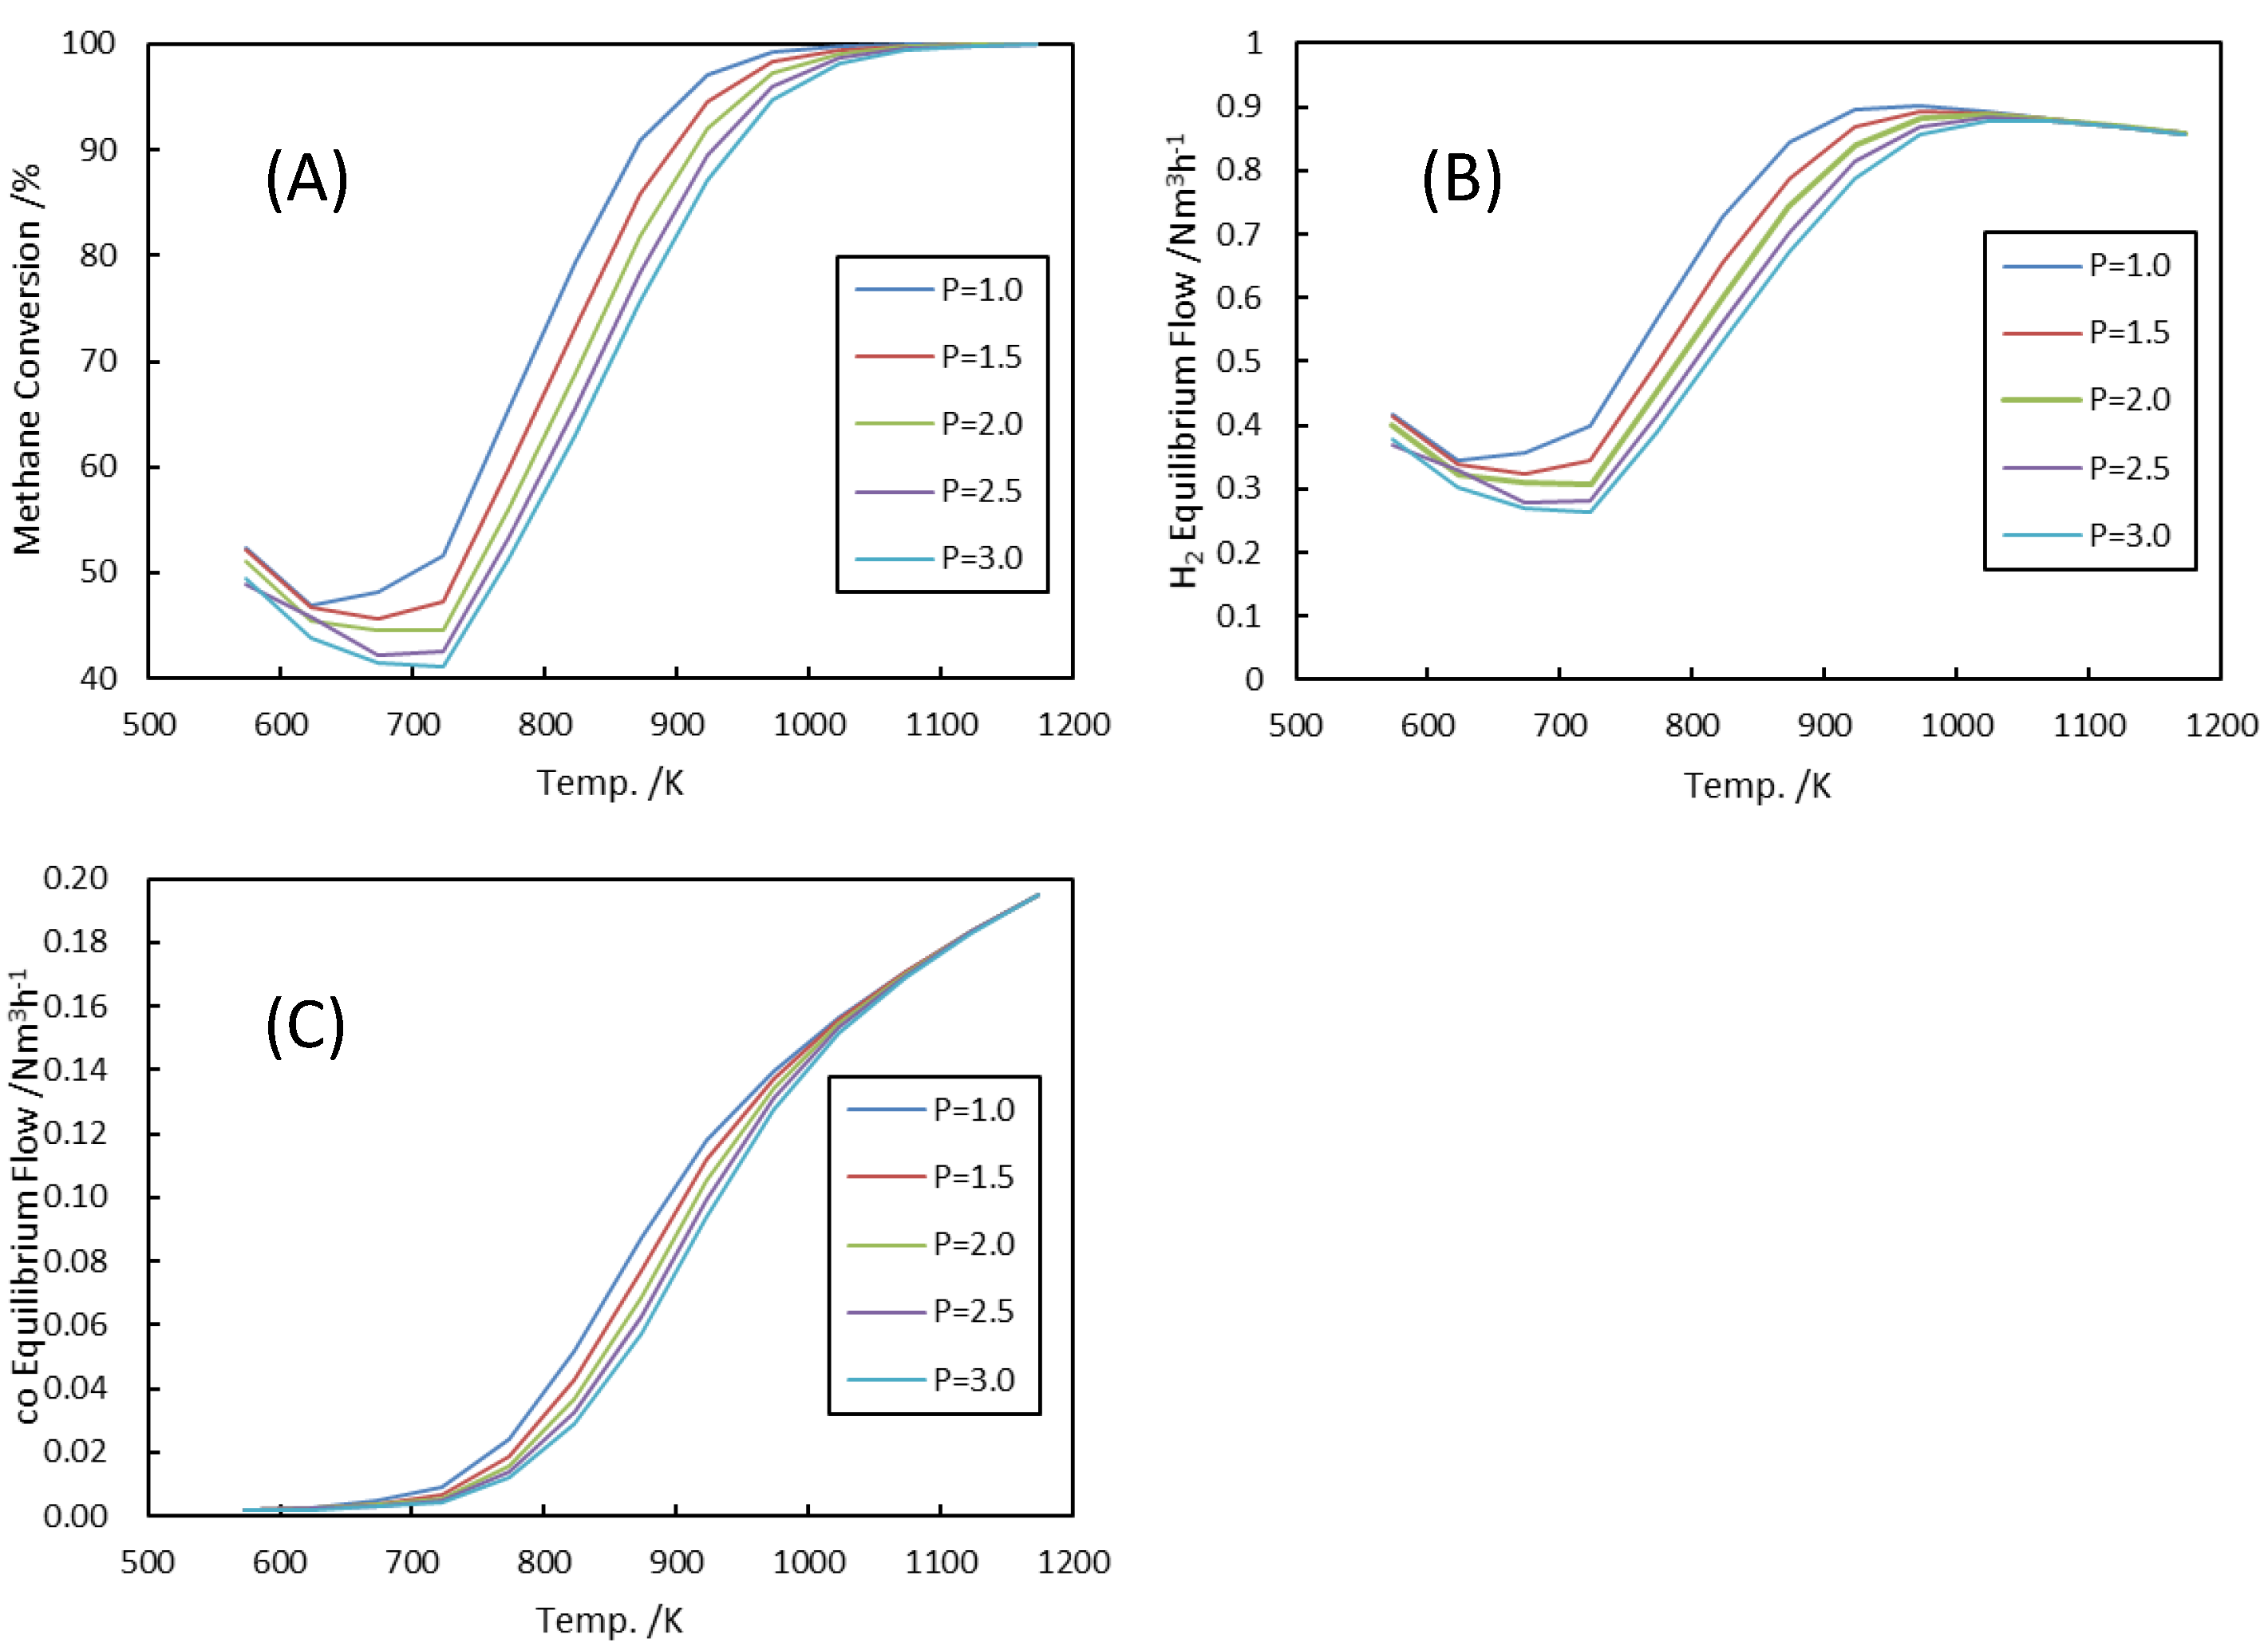
3.1.2. ATR Exit Pressure

Higher pressures lead to a reverse reaction in steam reforming but have no effect on the WGS reaction. Figure 3A shows that higher pressure indeed had a negative effect on methane conversion at the ATR exit. When the pressure increases from 1 to 3 atm. methane conversion decreased from 47% to 43% at 673 K, from 97% to 87% at 923 K, and from 99% to 95% at 973 K. Both values meet 99% only above 1073 K.
Regarding the hydrogen equilibrium flow, it followed the same trend as methane conversion, that is, it decreased with increasing pressure until 1073 K. At 923 K, it decreased from 0.90 to 0.79 Nm3 h−1 when pressure goes from 1 to 3 atm. At 973 K, it decreased from 0.90 to 0.87 Nm3 h−1, as shown in Figure 3B.
The CO flow also decreased slightly with decreasing methane conversion, as shown in Figure 3C. However, the reduction in CO yield did not compensate for the loss in hydrogen yield. Therefore, it is suggested to operate the system at possibly low pressure that is not much higher than the atmosphere, as long as it is technically feasible.

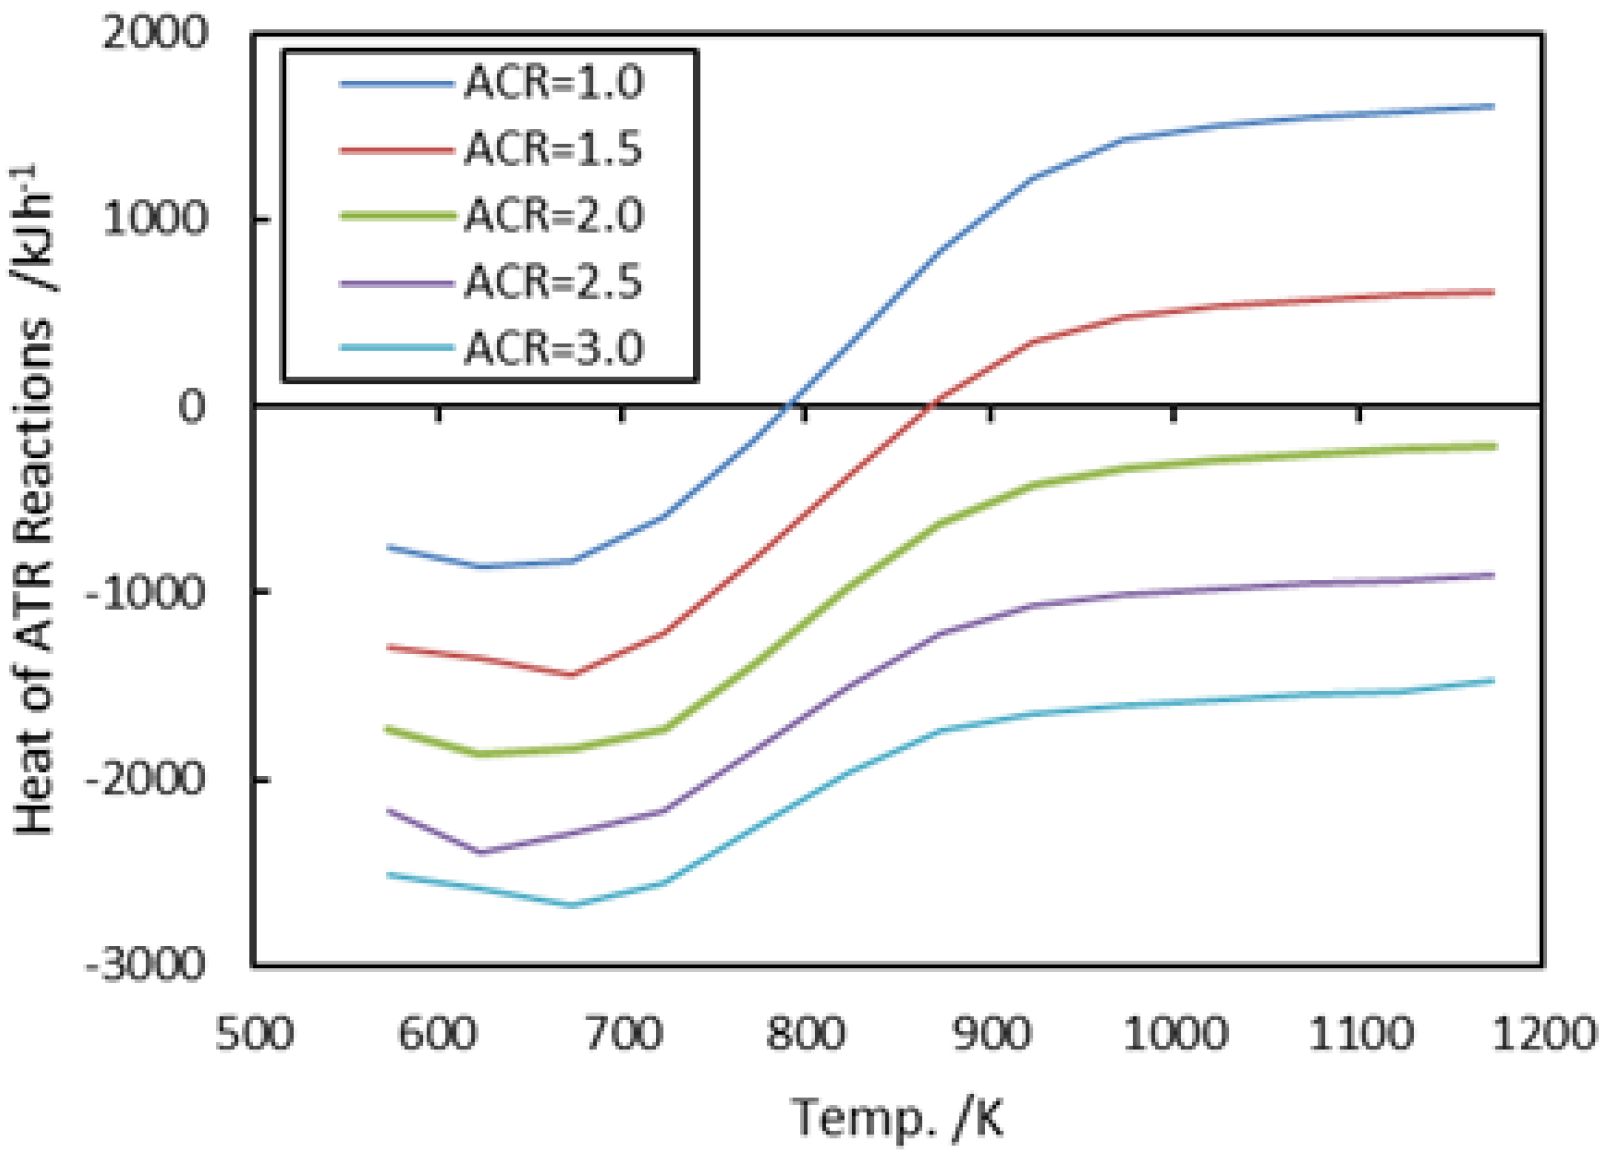
3.1.3. Air-to-Carbon Ratios (ACR)

Co-feeding air with methane and steam enabled the steam reformer to operate in an autothermal manner, i.e., the catalytic combustion of a portion of the fuels provided the heat necessary for the steam reforming reaction. Figure 4A shows that the methane conversion at the ATR exit increased with the increasing ACR from 1 to 3. However, hydrogen flow (Figure 4B) and CO flow (Figure 4C) decreases with increasing ACR, indicating that more CH4 was consumed to generate heat at the higher ACR. From the viewpoint of material efficiency, using less air in the co-feed is beneficial.
However, there is a lowest limit for the ACR, to ensure that enough heat is generated for the steam reforming reaction to proceed. As shown in Figure 5, for a feed flow of 2 Nm3 h−1 with SCR = 3, at 1 atm., the ACR must be greater than a value close to 2, for the H2 production to be sufficient in the temperature range between 900 and 1000 K.

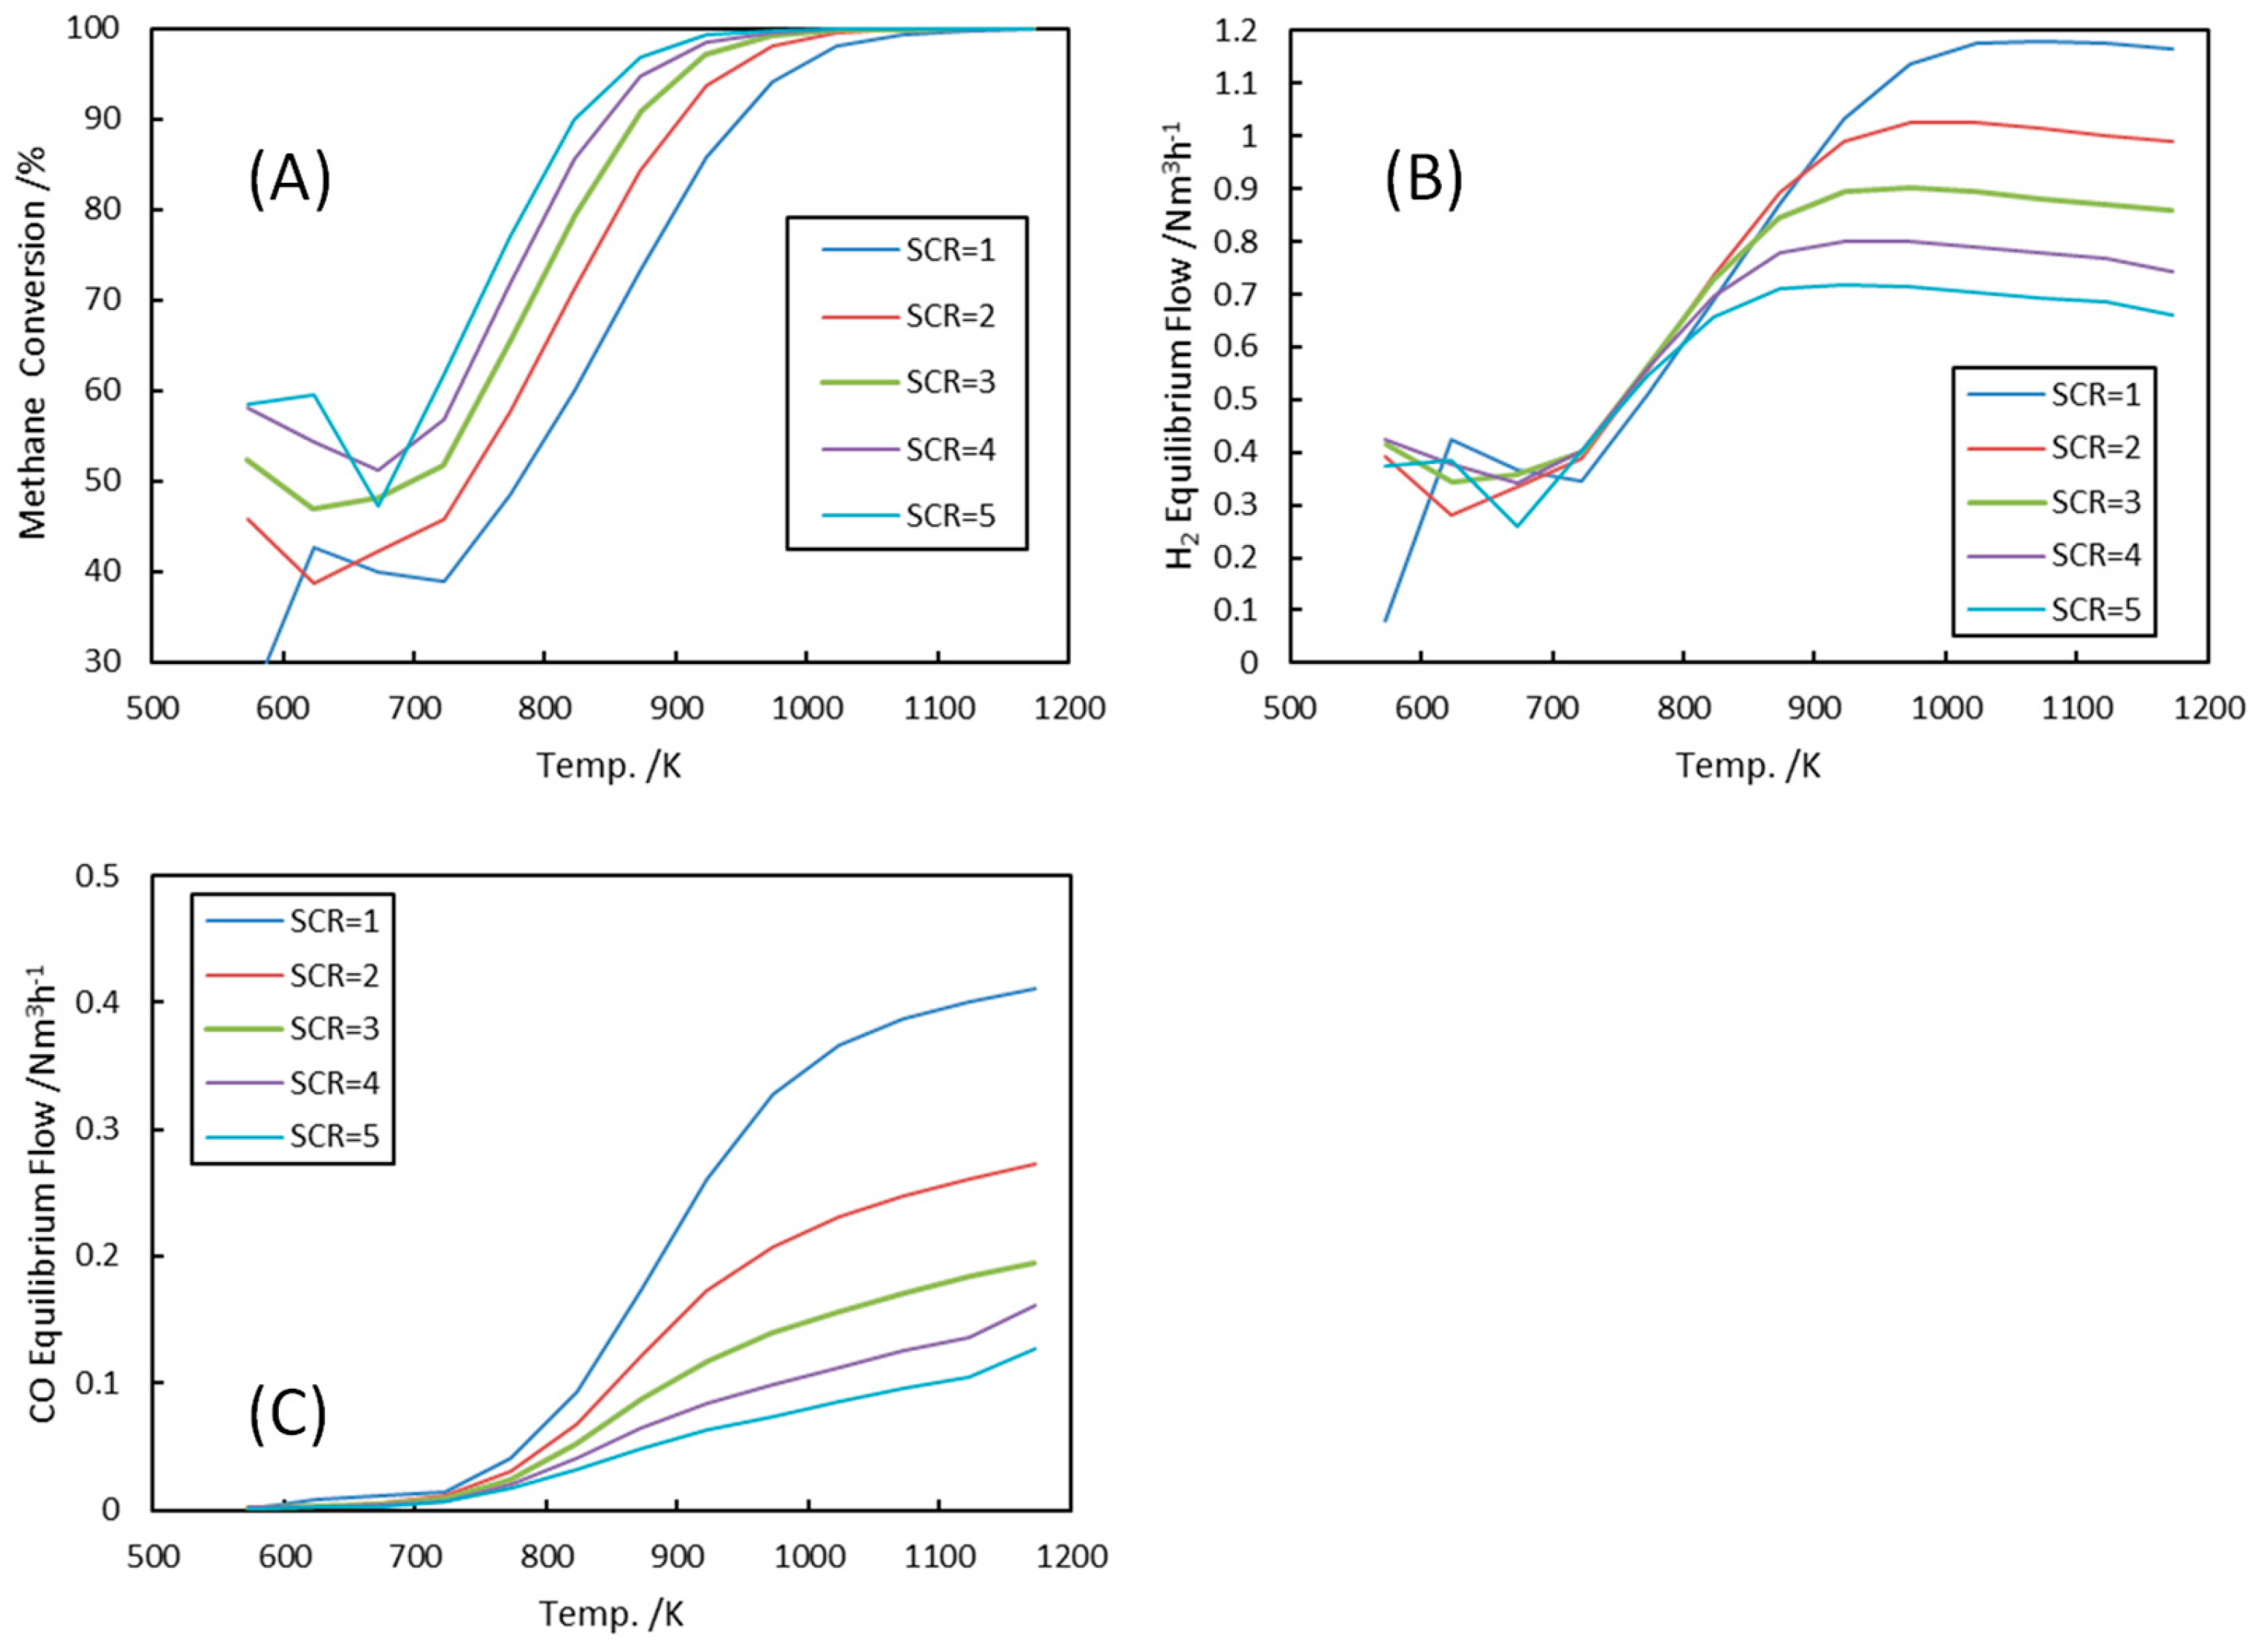
3.1.4. Steam-to-Carbon Ratios (SCR)

Stoichiometrically, an SCR of 2 is needed to achieve the target of 100% CH4 and CO conversion. In practice, higher values are used to drive the reaction equilibria of the steam reforming and WGS reactions in the forward direction. Figure 6A shows that the methane conversion went up when the SCR rose from 1 to 5.
In the same SCR range of 1 to 5, the hydrogen equilibrium flow increased slightly with an increasing SCR to below ca. 800 K. However, above 800 K, the hydrogen flow decreased significantly with increasing SCR (Figure 6B). The highest flow of H2 approached 1.2 Nm3 h−1 at an SCR of 1. However, this occurred above 1000 K, which is not suitable for portable applications. At 923 K, the H2 equilibrium flow was ca. 1.1 Nm3 h−1 at SCR = 1, 1.0 at SCR = 2, and 0.9 at SCR = 3.
The CO equilibrium flow decreased when the SCR increased from 1 to 5. The difference became significant as the temperatures increased above 800 K (Figure 6C).
In choosing an operating SCR value, one must compromise between high hydrogen and low CO flow. A value between 2 and 4 appears to be sufficient.

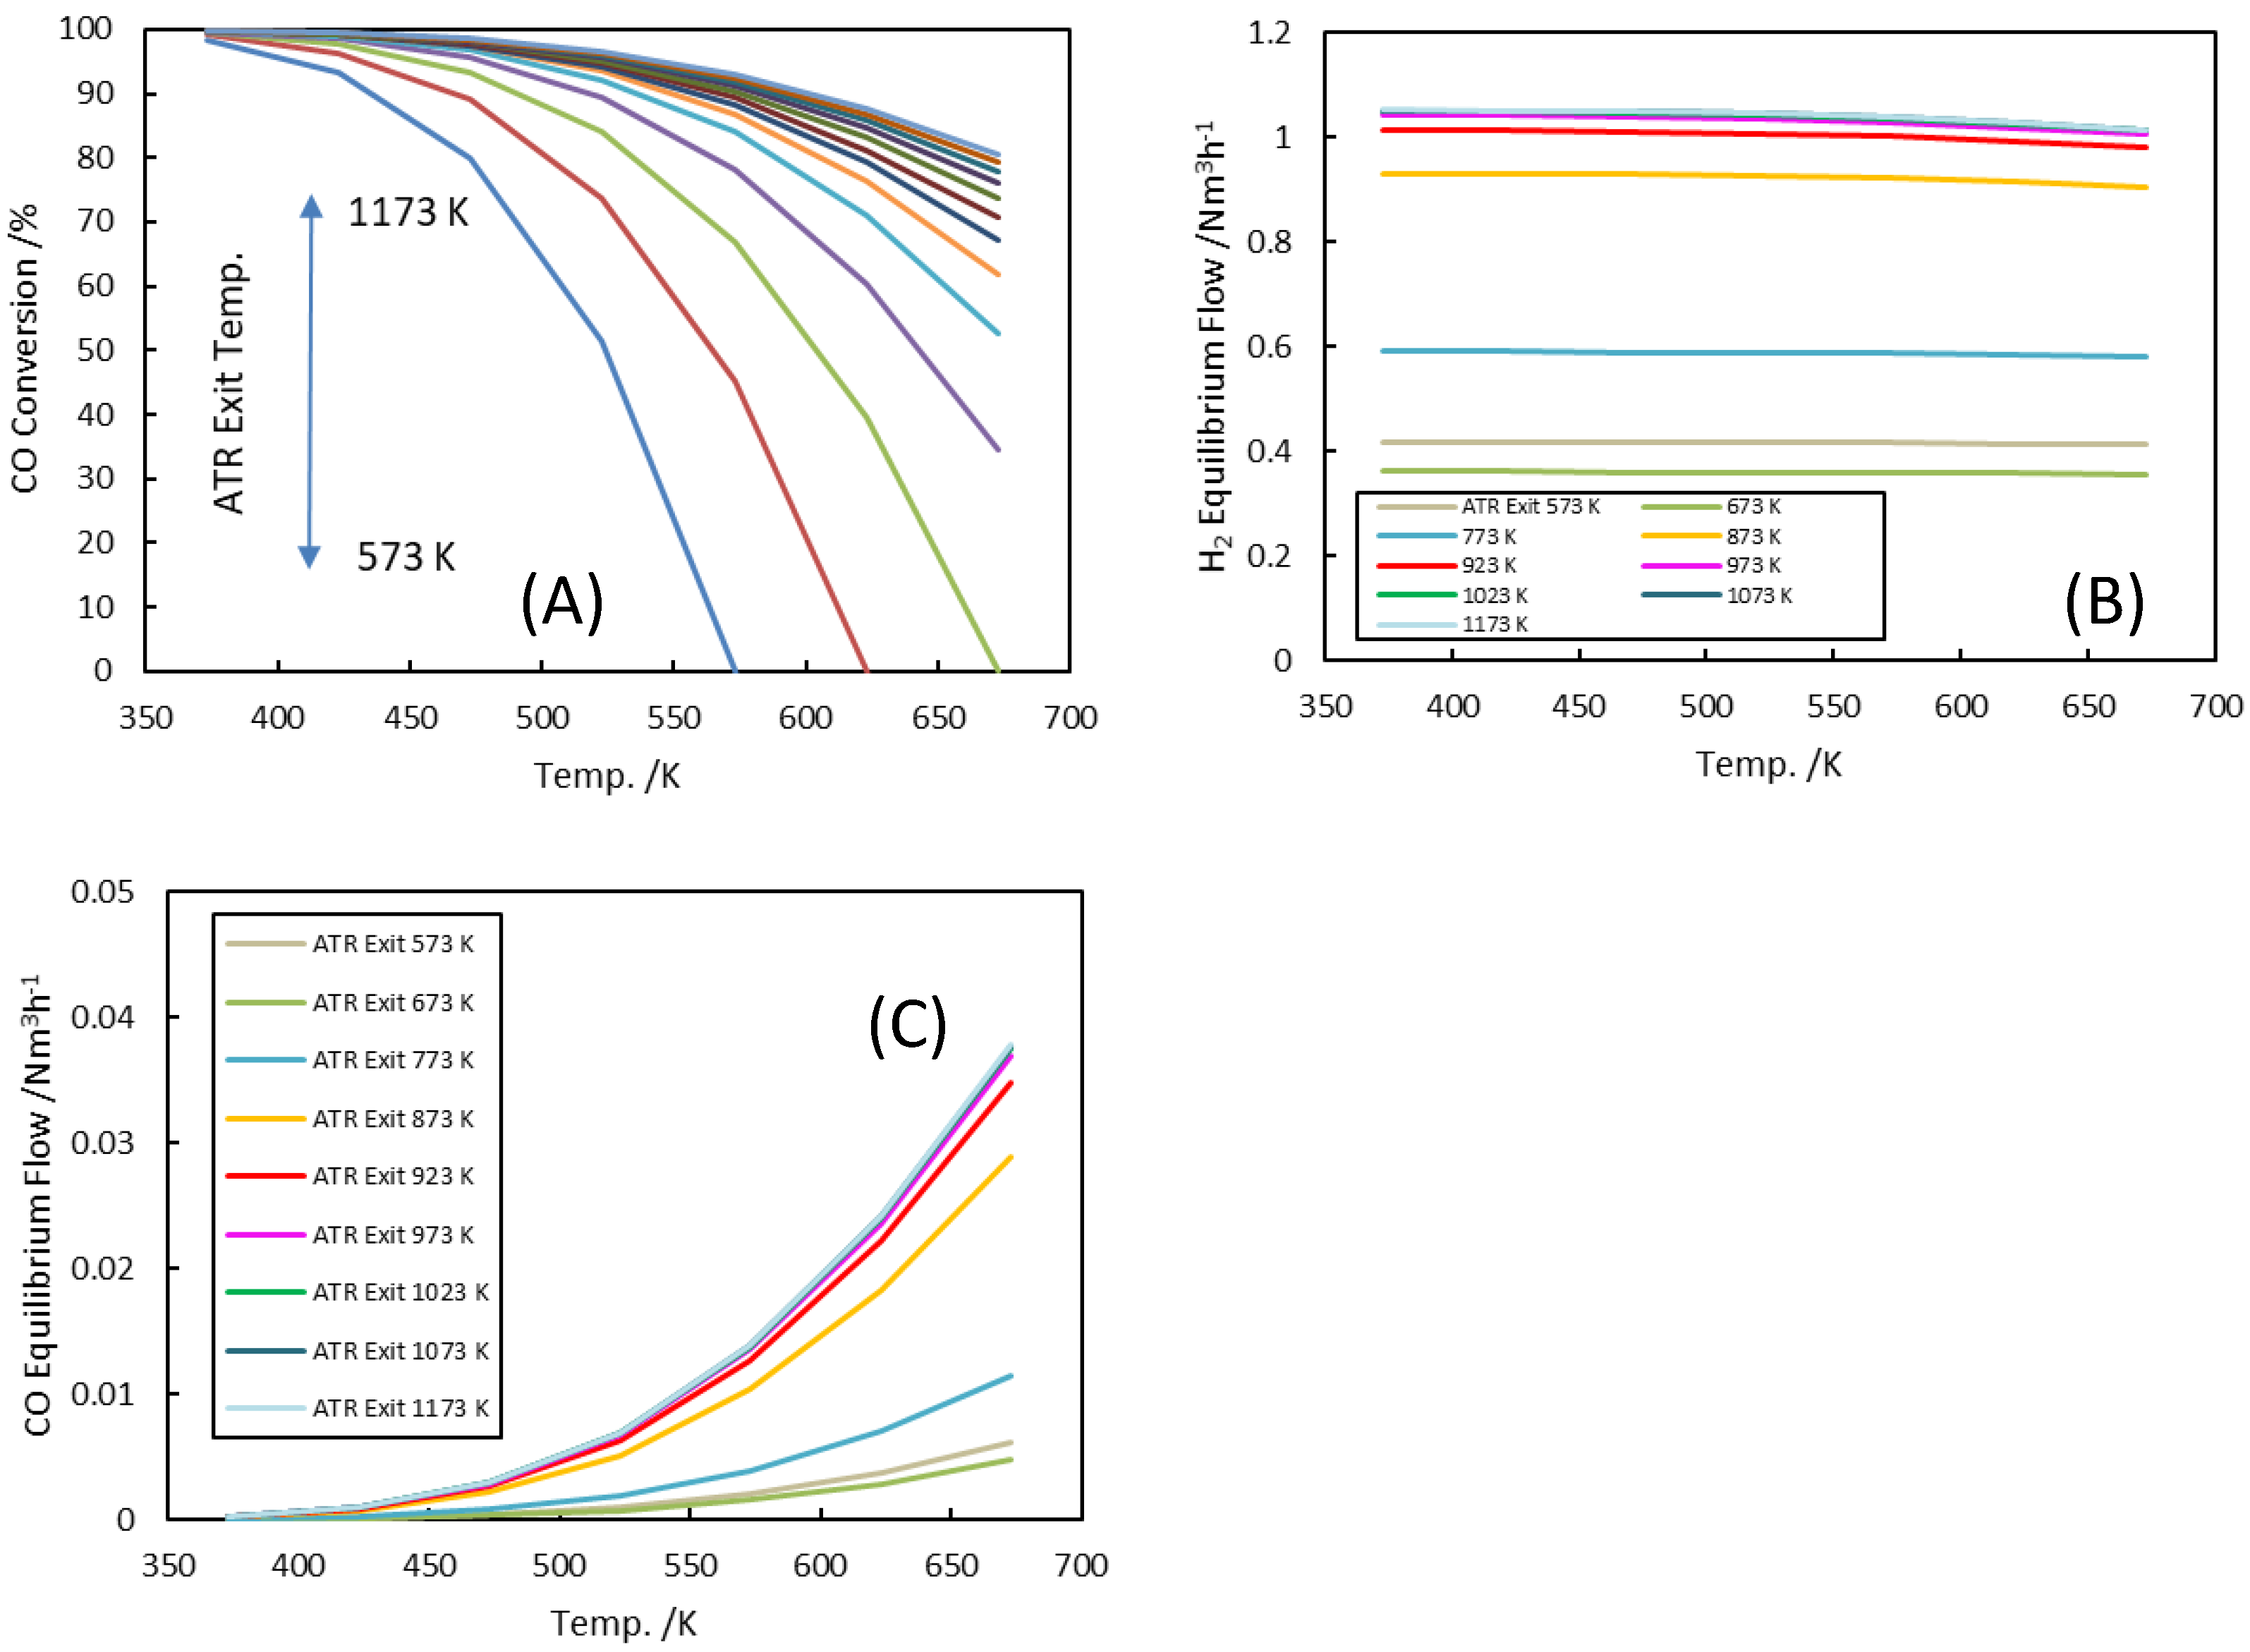
3.2. Water–Gas Shift (WGS) Reactor

A water–gas shift reactor was connected to the exit of the ATR. It operated at a lower temperature and converted the CO in the ATR effluent into H2.
The conversion of the CO in the ATR effluent at various temperatures is presented in Figure 7A. The ATR feed had a total flow rate of 2 Nm3 h−1, with ACR = 2, SCR = 3, and P = 1 atm. (cf. Figure 1). The WGS exit also had a pressure of 1 atm. CO conversion depends strongly on the WGS temperature, as well as the ATR effluent compositions, and, in turn, the ATR exit temperatures. On one hand, the water–gas shift reaction is exothermic, and lower a temperature favors the CO conversion. On the other hand, effluents of higher ATR temperatures contain higher amount of CO and drive the WGS equilibrium in the forward direction. Rational values of >95% can be achieved for ATR with exit temperatures of 923–973 K, if the WGS exit temperature does not exceed 473 K.
Figure 7B,C present the H2 and CO equilibrium flow rates at the WGS exit with feeds at various ATR temperatures. Generally, higher ATR temperatures result in higher CH4 conversion, more H2, and more CO in the effluent. Consequently, this leads to higher H2 and CO flows when the mixture is further converted in the WGS. When the ATR exit was above 923 K, the H2 flow at the end of the WGS reached over 1.0 Nm3 h−1. The temperature at the WGS exit must stay low and, ideally, not exceed 423 K. Otherwise the CO flow becomes significant.

3.3. Material and Heat Efficiency

Under the proposed operation conditions, with a total feed flow of 1.6 Nm3 h−1, containing CH4, H2O, and air at an ACR of 2.5, and SCR of 3, an ATR exit temperature of 923 K, an WGS exit temperature of 473 K, and pressure of 1 atm at both positions, the resulting flow composition values at the ATR exit and the system outlet are listed in Table 4.
At the outlet of the system, 0.71 Nm3 h−1 H2 flow was obtained out of 0.25 Nm3 h−1 CH4 in the feed. The mol ratio of the produced H2 to fed CH4 was ca. 2.87, which is a satisfactory value. The H2 flow is adequate to drive a 1 kW PEM FC.
However, in the effluent flow, components other than H2 may pose a problem. It contained 0.23% unconverted CH4, 24.9% N2, and 12.3% CO2, which are tolerable. It also contained 26.4% H2O, which is acceptable for some electrodes or can be removed largely by condensation at room temperature. However, it also contained 0.09%, i.e., 900 ppm, CO. This concentration is far beyond the limit that the electrode catalysts of a PEM FC can treat. Table 5 presents the operation results with the same feed, an ATR exit temperature of 973 K, and a WGS exit temperature of 423 K. Under these operating conditions, there were small improvements in the H2 yield, as well as the CH4 and CO conversions. The H2/CH4 increased to 2.93. However, the CO concentration is still at 300 ppm. This is a serious issue that must be addressed.
Fuel energy efficiency is estimated as the combustion heat of the produced hydrogen divided by that of feeding methane. For the above two operation cases, the values are given in Table 6. For Case 1, the fuel efficiency is about 0.97. For Case 2, the value goes up to 0.99.
Table 6 presents four other heat values: Q1 is the energy needed to generate the required steam and to heat the feed gaseous flow to the ATR operating temperature. Q2 is the energy that released when the effluent flow cools down. Q(ATR) and Q(WGS) are the reaction heat values in the respective reactors. During stable operation, both the ATR and WGS work under exothermic conditions, and the system has an extra heat of 145 and 57 kJ·h−1. These are sufficient values that isolation materials can maintain heat flows below them to keep the working temperatures of the reactors. Therefore, the system is self-sustaining.

3.4. Issues and Solutions

Several issues are identified in the above analyses and briefly addressed here.
The most serious problem with the current system design is that 300–900 ppm CO remains in the effluent, which is not tolerable for FC electrode catalysts, and must be removed. Several methods can be considered as feasible choices. For example, a preferential oxidation (PROX) unit can be incorporated between the reactors and the FC, which selectively converts CO with very little or even zero loss of H2. It does not require an energy supply because the unit can work at mild temperatures, but it needs an O2 feed [44]. Another choice is a zeolite absorber, which selectively absorbs CO and is regenerable by heating [45]. These choices require some installations that are suitable only for stationary applications. For mobile applications, a one-way cartridge filled with a CO absorbent, such as zeolite or metal alloy [46], which can be disposed of after use, is suggested.
Coking is another serious issue that affects the system operation time. Experience has shown that properly adjusting the steam co-feeding may retard coking. Assuming a worse case of 3% coking rate, the H2 productivity would reduce by ca. 5% [32]. Typical steam reforming catalysts are reloaded in two-year periods [47]. For the compact system, it is not necessary to regenerate the catalysts. Preferably, the reactors are designed in modules with exchangeable catalyst cartridges for easy mounting.
The proposed feed compositions and operational conditions are based on the thermodynamic analysis. How favorable the kinetics, as well as the mass and heat transfers, are for achieving the reaction equilibria remains a concern. The suggested GHSV is moderate in comparison to large-scale practices, and the choice of catalysts is not restricted to the extremely active ones but rather the commonly used and reliable ones. With redundant volumes in the reactors, these choices ensure that respective chemical equilibria are established at the reactor exits at stable operations. Furthermore, experimental validations and optimized reactor designs towards minimum redundancy are being carried out.
To start up the system, the ATR reactor and the catalyst need to be heated to 923 K, which requires approximately up to 1000 kJ of energy, corresponding to ca. 0.03 Nm3 CH4 as fuel. Therefore, a flow of 1:10(v) CH4/air can be fed at 1.6 Nm3·h−1 for ca. 15 min. Then, the reaction feed can be switched on for the operation.
Stationary applications have more flexibility regarding the supply of steams, such as by using a heat exchanger that utilizes the ATR effluent as the heating fluid. For mobile applications, it is recommended to use a small syringe pump to inject liquid water. In this case, the heat management in the catalyst bed must be carefully analyzed.
The modulated design of the reactors would enable a smooth scaling-up of the system for 5–10 kW fuel cells. Larger systems would require less engineering effort to achieve compactness.

4. Conclusions

Thermodynamic analysis was performed on a compact system consisting of a miniature autothermal steam reformer and a water–gas shift reactor, to generate H2 for a 1 kW PEM fuel cell using hydrocarbon fuels.
Both reactors can have sizes smaller than 500 mL, designed as stacks of micro-channels made with highly heat-conducting materials. The inner-channel walls are coated with catalysts, e.g., RE and noble metals-modified Ni/Al2O3 for the ATR, and Cu/ZuO/Al2O3 or Fe/Cr for the WGS.
Using CH4 as a model fuel, at a total feed flow of 1.6 Nm3 h−1 and co-feeding steam and air at S/C = 2–4 and air/C = 2.5, >0.7 Nm3 h−1 hydrogen can be produced with the ATR at 923–973 K, and the WGS at 423–473 K, which is sufficient to drive the 1 kW fuel cell.
The effluent contains steam and a significant amount of CO2. It contains up to 0.1% unconverted CH4, which can be tolerated. However, CO impurity contents are as high as 300–900 ppm, which need to be removed before the stream is qualified for PEM fuel cell applications. Some choices of CO removal methods are suggested for stationary or mobile application scenarios. The fuel efficiency, estimated by comparing the combustion heat of the feed and effluent, is very high, close to 1. The system is self-sustained at stable operating conditions. However, extra heat is required for start-up, which is proposed to be supplied using an air-rich feeding procedure.

Author Contributions

Investigation, Q.L., X.Y. and K.L.; Supervision, Y.L. and Y.Z.; Writing—original draft, Q.L.; Writing—review and editing, Y.L. All authors have read and agreed to the published version of the manuscript.

Funding

This research received no external funding.

Data Availability Statement

The original contributions presented in this study are included in the article. Further inquiries can be directed to the corresponding authors.

Conflicts of Interest

Author Ke Liang was employed by the company Tianjin Passion Advanced Material Technology, LLC., TEDA. The remaining authors declare that the research was conducted in the absence of any commercial or financial relationships that could be construed as a potential conflict of interest.

References

  1. Hui, Y.; Wang, M.; Guo, S.; Akhtar, S.; Bhattacharya, S.; Dai, B.; Yu, J. Comprehensive review of development and applications of hydrogen energy technologies in China for carbon neutrality: Technology advances and challenges. Energy Convers. Manag. 2024, 315, 118776. [Google Scholar] [CrossRef]
  2. Gupta, P.; Toksha, B.; Rahaman, M. A Critical Review on Hydrogen Based Fuel Cell Technology and Applications. Chem. Rec. 2024, 24, e202300295. [Google Scholar] [CrossRef] [PubMed]
  3. Fan, L.; Tu, Z.; Chan, S.H. Recent development of hydrogen and fuel cell technologies: A review. Energy Rep. 2021, 7, 8421–8446. [Google Scholar] [CrossRef]
  4. Nishioka, S.; Osterloh, F.E.; Wang, X.; Mallouk, T.E.; Maeda, K. Photocatalytic water splitting. Nat. Rev. Methods Primers 2023, 3, 42. [Google Scholar] [CrossRef]
  5. Naseem, K.; Qin, F.; Khalid, F.; Suo, G.; Zahra, T.; Chen, Z.; Javed, Z. Essential parts of hydrogen economy: Hydrogen production, storage, transportation and application. Renew. Sustain. Energy Rev. 2025, 210, 115196. [Google Scholar] [CrossRef]
  6. Dincer, I.; Acar, C. Review and evaluation of hydrogen production methods for better sustainability. Int. J. Hydrogen Energy 2015, 40, 11094–11111. [Google Scholar] [CrossRef]
  7. Van Hook, J.P. Methane-Steam Reforming. Catal. Rev. 1980, 21, 1–51. [Google Scholar] [CrossRef]
  8. Megía, P.J.; Vizcaíno, A.J.; Calles, J.A.; Carrero, A. Hydrogen Production Technologies: From Fossil Fuels toward Renewable Sources. A Mini Review. Energy Fuels 2021, 35, 16403–16415. [Google Scholar] [CrossRef]
  9. Peng, M.; Ge, Y.; Gao, R.; Yang, J.; Li, A.; Xie, Z.; Yu, Q.; Zhang, J.; Asakura, H.; Zhang, H.; et al. Thermal catalytic reforming for hydrogen production with zero CO2 emission. Science 2025, 387, 769–775. [Google Scholar] [CrossRef]
  10. Rostrup-Nielsen, J.R. Catalytic Steam Reforming. In Catalysis: Science and Technology; Anderson, J.R., Boudart, M., Eds.; Springer: Berlin/Heidelberg, Germany, 1984; Volume 5, pp. 1–117. [Google Scholar]
  11. Rostrup-Nielsen, J. Steam reforming of hydrocarbons. A historical perspective. In Studies in Surface Science and Catalysis; Bao, X., Xu, Y., Eds.; Elsevier: Amsterdam, The Netherlands, 2004; Volume 147, pp. 121–126. [Google Scholar]
  12. Rostrup-Nielsen, J.R.; Rostrup-Nielsen, T. Large-Scale Hydrogen Production. CATTECH 2002, 6, 150–159. [Google Scholar] [CrossRef]
  13. Gunathilake, C.; Soliman, I.; Panthi, D.; Tandler, P.; Fatani, O.; Ghulamullah, N.A.; Marasinghe, D.; Farhath, M.; Madhujith, T.; Conrad, K.; et al. A comprehensive review on hydrogen production, storage, and applications. Chem. Soc. Rev. 2024, 53, 10900–10969. [Google Scholar] [CrossRef] [PubMed]
  14. Dagdougui, H.; Sacile, R.; Bersani, C.; Ouammi, A. Chapter 4—Hydrogen Storage and Distribution: Implementation Scenarios. In Hydrogen Infrastructure for Energy Applications; Dagdougui, H., Sacile, R., Bersani, C., Ouammi, A., Eds.; Academic Press: New York, NY, USA, 2018; pp. 37–52. [Google Scholar]
  15. Ratnakar, R.R.; Gupta, N.; Zhang, K.; van Doorne, C.; Fesmire, J.; Dindoruk, B.; Balakotaiah, V. Hydrogen supply chain and challenges in large-scale LH2 storage and transportation. Int. J. Hydrogen Energy 2021, 46, 24149–24168. [Google Scholar] [CrossRef]
  16. Rostrup-Nielsen, J.R.; Sehested, J.; Nørskov, J.K. Hydrogen and synthesis gas by steam- and CO2 reforming. In Advances in Catalysis; Academic Press: New York, NY, USA, 2002; Volume 47, pp. 65–139. [Google Scholar]
  17. Szablowski, L.; Wojcik, M.; Dybinski, O. Review of steam methane reforming as a method of hydrogen production. Energy 2025, 316, 134540. [Google Scholar] [CrossRef]
  18. Distel, M.M.; Margutti, J.M.; Obermeier, J.; Nuß, A.; Baumeister, I.; Hritsyshyna, M.; Weiß, A.; Neubert, M. Large-Scale H2 Storage and Transport with Liquid Organic Hydrogen Carrier Technology: Insights into Current Project Developments and the Future Outlook. Energy Technol. 2025, 13, 2301042. [Google Scholar] [CrossRef]
  19. Altuntepe, A.; Erkan, S.; Olgar, M.A.; Çelik, S.; Zan, R. Investigating surface area and hydrogen pressure effects on LiH and NaH. J. Solid State Chem. 2024, 330, 124483. [Google Scholar] [CrossRef]
  20. Yuan, S.; Li, P.; Jiao, F.; Li, Y.; Qin, Y.; Han, D.; Liu, Q. An Efficient Integrated System for Methanol Steam Reforming to Produce Hydrogen Coupled with PEMFC Power Generation. J. Therm. Sci. 2025, 34, 374–388. [Google Scholar] [CrossRef]
  21. Dicks, A.L. Hydrogen generation from natural gas for the fuel cell systems of tomorrow. J. Power Sources 1996, 61, 113–124. [Google Scholar] [CrossRef]
  22. Arsalis, A. A comprehensive review of fuel cell-based micro-combined-heat-and-power systems. Renew. Sustain. Energy Rev. 2019, 105, 391–414. [Google Scholar] [CrossRef]
  23. Xu, L.; Kou, Y.; Liang, W.; Bieerke, A.; Wang, Y.; Li, J.; Yuan, Z. Fuel Cell-Based Distributed Robust Optimal Scheduling for Combined Heat and Power Supply. Electronics 2024, 13, 4172. [Google Scholar] [CrossRef]
  24. Steele, B.C.H.; Heinzel, A. Materials for fuel-cell technologies. Nature 2001, 414, 345–352. [Google Scholar] [CrossRef]
  25. Trimm, D.L.; Lam, C.-W. The combustion of methane on platinum—Alumina fibre catalysts—I: Kinetics and mechanism. Chem. Eng. Sci. 1980, 35, 1405–1413. [Google Scholar] [CrossRef]
  26. Carapellucci, R.; Giordano, L. Steam, dry and autothermal methane reforming for hydrogen production: A thermodynamic equilibrium analysis. J. Power Sources 2020, 469, 228391. [Google Scholar] [CrossRef]
  27. Pashchenko, D. Thermodynamic equilibrium analysis of steam methane reforming based on a conjugate solution of material balance and law action mass equations with the detailed energy balance. Int. J. Energy Res. 2020, 44, 438–447. [Google Scholar] [CrossRef]
  28. Ersoz, A.; Olgun, H.; Ozdogan, S. Reforming options for hydrogen production from fossil fuels for PEM fuel cells. J. Power Sources 2006, 154, 67–73. [Google Scholar] [CrossRef]
  29. Heinzel, A.; Vogel, B.; Hübner, P. Reforming of natural gas-hydrogen generation for small scale stationary fuel cell systems. J. Power Sources 2002, 105, 202–207. [Google Scholar] [CrossRef]
  30. Megía, P.J.; Rocha, C.; Vizcaíno, A.J.; Carrero, A.; Calles, J.A.; Madeira, L.M.; Soria, M.A. Thermodynamic Comparison between Conventional, Autothermal, and Sorption-Enhanced Bio-oil Steam Reforming. Energy Fuels 2025, 39, 1652–1667. [Google Scholar] [CrossRef]
  31. Halabi, M.H.; de Croon, M.H.J.M.; van der Schaaf, J.; Cobden, P.D.; Schouten, J.C. Modeling and analysis of autothermal reforming of methane to hydrogen in a fixed bed reformer. Chem. Eng. J. 2008, 137, 568–578. [Google Scholar] [CrossRef]
  32. Trimm, D.L. Catalysts for the control of coking during steam reforming. Catal. Today 1999, 49, 3–10. [Google Scholar] [CrossRef]
  33. Barbir, F.; Gómez, T. Efficiency and economics of proton exchange membrane (PEM) fuel cells. Int. J. Hydrogen Energy 1997, 22, 1027–1037. [Google Scholar] [CrossRef]
  34. Kumar, R.; Subramanian, K.A. Enhancement of efficiency and power output of hydrogen fuelled proton exchange membrane (PEM) fuel cell using oxygen enriched air. Int. J. Hydrogen Energy 2023, 48, 6067–6075. [Google Scholar] [CrossRef]
  35. Zhao, D.; Guan, Y.; Reinecke, A. Characterizing hydrogen-fuelled pulsating combustion on thermodynamic properties of a combustor. Commun. Phys. 2019, 2, 44. [Google Scholar] [CrossRef]
  36. Zamel, N.; Li, X. Transient analysis of carbon monoxide poisoning and oxygen bleeding in a PEM fuel cell anode catalyst layer. Int. J. Hydrogen Energy 2008, 33, 1335–1344. [Google Scholar] [CrossRef]
  37. Valdés-López, V.F.; Mason, T.; Shearing, P.R.; Brett, D.J.L. Carbon monoxide poisoning and mitigation strategies for polymer electrolyte membrane fuel cells—A review. Prog. Energy Combust. Sci. 2020, 79, 100842. [Google Scholar] [CrossRef]
  38. Shabani, B.; Hafttananian, M.; Khamani, S.; Ramiar, A.; Ranjbar, A.A. Poisoning of proton exchange membrane fuel cells by contaminants and impurities: Review of mechanisms, effects, and mitigation strategies. J. Power Sources 2019, 427, 21–48. [Google Scholar] [CrossRef]
  39. Bengaard, H.S.; Nørskov, J.K.; Sehested, J.; Clausen, B.S.; Nielsen, L.P.; Molenbroek, A.M.; Rostrup-Nielsen, J.R. Steam Reforming and Graphite Formation on Ni Catalysts. J. Catal. 2002, 209, 365–384. [Google Scholar] [CrossRef]
  40. Tusini, E.; Casapu, M.; Zimina, A.; Doronkin, D.E.; Störmer, H.; Barthe, L.; Belin, S.; Grunwaldt, J.-D. Structural Changes of Ni and Ni–Pt Methane Steam Reforming Catalysts During Activation, Reaction, and Deactivation Under Dynamic Reaction Conditions. ACS Catal. 2024, 14, 7463–7477. [Google Scholar] [CrossRef]
  41. Zhai, X.; Ding, S.; Liu, Z.; Jin, Y.; Cheng, Y. Catalytic performance of Ni catalysts for steam reforming of methane at high space velocity. Int. J. Hydrogen Energy 2011, 36, 482–489. [Google Scholar] [CrossRef]
  42. Ebrahimi, P.; Kumar, A.; Khraisheh, M. A review of recent advances in water-gas shift catalysis for hydrogen production. Emergent Mater. 2020, 3, 881–917. [Google Scholar] [CrossRef]
  43. Pal, D.B.; Chand, R.; Upadhyay, S.N.; Mishra, P.K. Performance of water gas shift reaction catalysts: A review. Renew. Sustain. Energy Rev. 2018, 93, 549–565. [Google Scholar] [CrossRef]
  44. Jia, Z.; Qin, X.; Chen, Y.; Cai, X.; Gao, Z.; Peng, M.; Huang, F.; Xiao, D.; Wen, X.; Wang, N.; et al. Fully-exposed Pt-Fe cluster for efficient preferential oxidation of CO towards hydrogen purification. Nat. Commun. 2022, 13, 6798. [Google Scholar] [CrossRef]
  45. Rostom, S.; Symonds, R.; Hughes, R. Cu-BTC and Zeolite-5A-Modified Cu-BTC MOFs for High-Pressure and Moderate-Temperature H2 Purification. Ind. Eng. Chem. Res. 2024, 63, 11207–11217. [Google Scholar] [CrossRef]
  46. Wang, H.; Liu, Y.; Zhang, J. Hydrogen purification by Mg alloy hydrogen adsorbent. Adsorption 2022, 28, 85–95. [Google Scholar] [CrossRef]
  47. Rostrup-Nielsen, J.; Dybkjaer, I.; Christiansen, L.J. Steam Reforming Opportunities and Limits of the Technology. In Chemical Reactor Technology for Environmentally Safe Reactors and Products; de Lasa, H.I., Doğu, G., Ravella, A., Eds.; Springer: Dordrecht, The Netherlands, 1992; pp. 249–281. [Google Scholar]
Figure 1. Sketch of the compact system with a micro-channel ATR and WGS reactor.
Processes 13 01273 g001
Figure 2. Equilibrium flow (A) and methane conversion (B) at the ATR exit with 2 Nm3 h−1 feed, SCR = 3, ACR = 2.
Processes 13 01273 g002
Figure 3. Methane conversion (A), equilibrium flow rates of H2 (B) and CO (C) at the ATR exit at various pressures, with 2 Nm3 h−1 feed, SCR = 3, ACR = 2.
Processes 13 01273 g003
Figure 4. Methane conversion (A) and equilibrium flow rates of H2 (B) and CO (C) at ATR exit at various ACR, with 2 Nm3 h−1 feed, SCR = 3, P = 1 atm.
Processes 13 01273 g004
Figure 5. The ATR reaction heat with 2 Nm3 h−1 feed, SCR = 3, and P = 1 atm, at various ACR.
Processes 13 01273 g005
Figure 6. Methane conversion (A) and the equilibrium flow rates of H2 (B) and CO (C) at the ATR exit at various SCR, with 2 Nm3 h−1 feed, ACR = 2, P = 1 atm.
Processes 13 01273 g006
Figure 7. CO conversion (A) and the equilibrium flow rates of H2 (B) and CO (C) in the WGS reactor using an ATR effluent at various temperatures as the feed. The ATR feed flow was 2 Nm3 h−1, ACR = 2, and SCR = 3. Both reactors had exit pressures of 1 atm. The lines in (A) from bottom to top represent CO conversion monotonically increases with the ATR exit temperatures from 573 to 1173 K with 50 K interval.
Processes 13 01273 g007
Table 1. Reactions under consideration (gaseous components) [28].
Reactions Δ H Θ /kJ mol−1
(1)Steam reformingCH4 + H2O ←→ CO + 3 H2206
(2)Water–gas shiftCO + H2O ←→ CO2 + H2−41
(3)Partial oxidationCH4 + 1.5 O2 ←→ CO + 2 H2O−519
(4)Total oxidation CH4 + 2 O2 ←→ CO2 + 2 H2O−803
(5)Dry reforming CH4 + CO2 ←→ 2 CO + 2 H2247
(6)Steam reformingCH4 + 2 H2O ←→ CO2 + 4 H2165
(7)CombustionH2 + 0.5 O2 ←→ H2O−394
(8)CombustionCO + 0.5 O2 ←→ CO2−172
(9)Boudouard reactionCO ←→ 0.5 C + 0.5 CO2−86
(10)DecompositionCH4 ←→ C + 2 H275
Table 2. Temperature dependency of equilibrium constants [31].
ReactionsEquilibrium Constant K
(1)Steam reformingCH4 + H2O ←→ CO + 3 H2K1 = exp (−26,830/T + 30.114)/atm2
(2)Water–gas shiftCO + H2O ←→ CO2 + H2K2 = exp (4400/T − 4.036)
(3)Partial oxidationCH4 + 1.5 O2 ←→ CO + 2 H2OComplete
Table 3. The mol flow compositions for the feed and the equilibrium flow applied at the ATR exit.
Reactants Products
Reaction 1CH4+1.5 O2←→CO+2 H2O
Feed/mol h−1 n C H 4 0 0.21 n a i r 0 0 n H 2 O 0
Equilibrium n C H 4 0 0.14 n a i r 0 x 0 0.14 n a i r 0 + x y n H 2 O 0 + 0.28 n a i r 0 x y
Reaction 2CH4+H2O←→CO+3 H2
Feed/mol h−1 n C H 4 0 n H 2 O 0 0 0
Equilibrium n C H 4 0 0.14 n a i r 0 x n H 2 O 0 + 0.28 n a i r 0 x y 0.14 n a i r 0 + x y 3 x + y
Reaction 3CO+H2O←→CO2+H2
Feed/mol h−10 n H 2 O 0 0 0
Equilibrium 0.14 n a i r 0 + x y n H 2 O 0 + 0.28 n a i r 0 x y y 3 x + y
Table 4. Equilibrium flows at ATR exit and WGS exit, with a feed of 1.6 Nm3 h−1, ACR = 2.5, and SCR= 3. ATR exit at 923 K, WGS exit at 473 K, and pressure of 1 atm at both positions.
H2COCO2CH4H2OO2N2Sum
FeedFlow/Nm3h−10.00000.00000.00000.24620.73850.12920.48621.6000
Fraction 0.00000.00000.00000.15380.46150.08080.30381.0000
ATR Exit
at 923 K
Flow/Nm3h−10.62680.08130.16030.00450.59500.00000.48621.9540
Fraction 0.32080.04160.08200.00230.30450.00000.24881.0000
WGS Exit
at 473 K
Flow/Nm3h−10.70640.00170.23990.00450.51530.00000.48621.9540
Fraction 0.36150.00090.12280.00230.26370.00000.24881.0000
Table 5. Equilibrium flows at ATR exit and WGS exit, with a feed of 1.6 Nm3 h−1, ACR = 2.5, and SCR = 3. ATR exit temperature of 973 K, WGS exit temperature of 423 K, and pressure of 1 atm at both positions.
H2COCO2CH4H2OO2N2Sum
FeedFlow/Nm3h−10.00000.00000.00000.24620.73850.12920.48621.6000
Fraction 0.00000.00000.00000.15380.46150.08080.30381.0000
ATR Exit
at 973 K
Flow/Nm3h−10.62590.09550.14950.00120.60250.00000.48621.9607
Fraction 0.31920.04870.07620.00060.30730.00000.24791.0000
WGS Exit
at 423 K
Flow/Nm3h−10.72080.00060.24440.00120.50760.00000.48621.9607
Fraction 0.36760.00030.12460.00060.25890.00000.24791.0000
Table 6. Fuel efficiency estimation and heats at a few key positions in the system.
η (Fuel)Q1
/kJ h−1
Q(ATR)
/kJ h−1
Q2
/kJ h−1
Q(WGS)
/kJ h−1
Banlance
/kJ h−1
Case 1
(ATR 923K, WGS 473K)
0.971341−860−480−146−145
Case 2
(ATR 973K, WGS 423K)
0.991341−809−415−174−57
Disclaimer/Publisher’s Note: The statements, opinions and data contained in all publications are solely those of the individual author(s) and contributor(s) and not of MDPI and/or the editor(s). MDPI and/or the editor(s) disclaim responsibility for any injury to people or property resulting from any ideas, methods, instructions or products referred to in the content.

