

Experimental Study and Numerical Simulation of Sediment’s Promoting Effect on Cavitation Based on Flow Field Analysis


Abstract
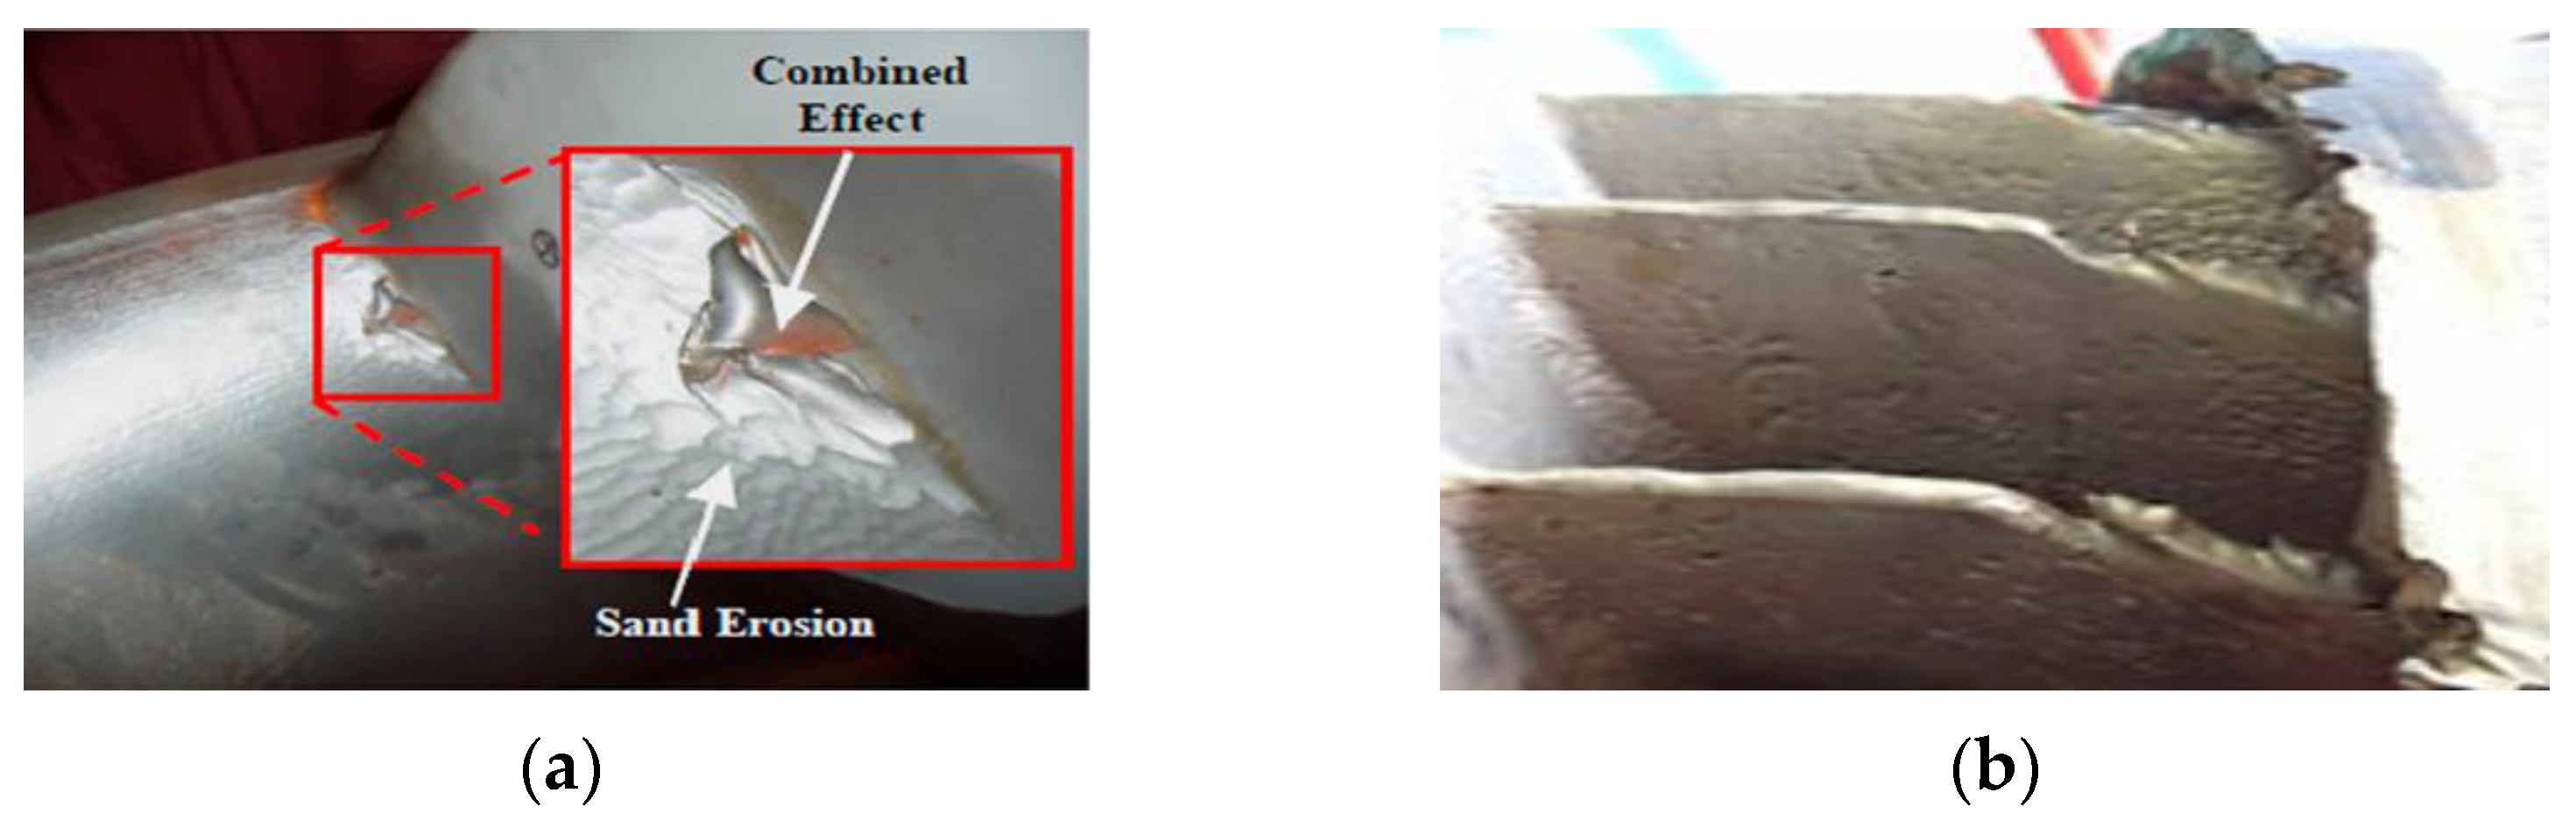
1. Introduction
2. Visual Cavitation Experiment
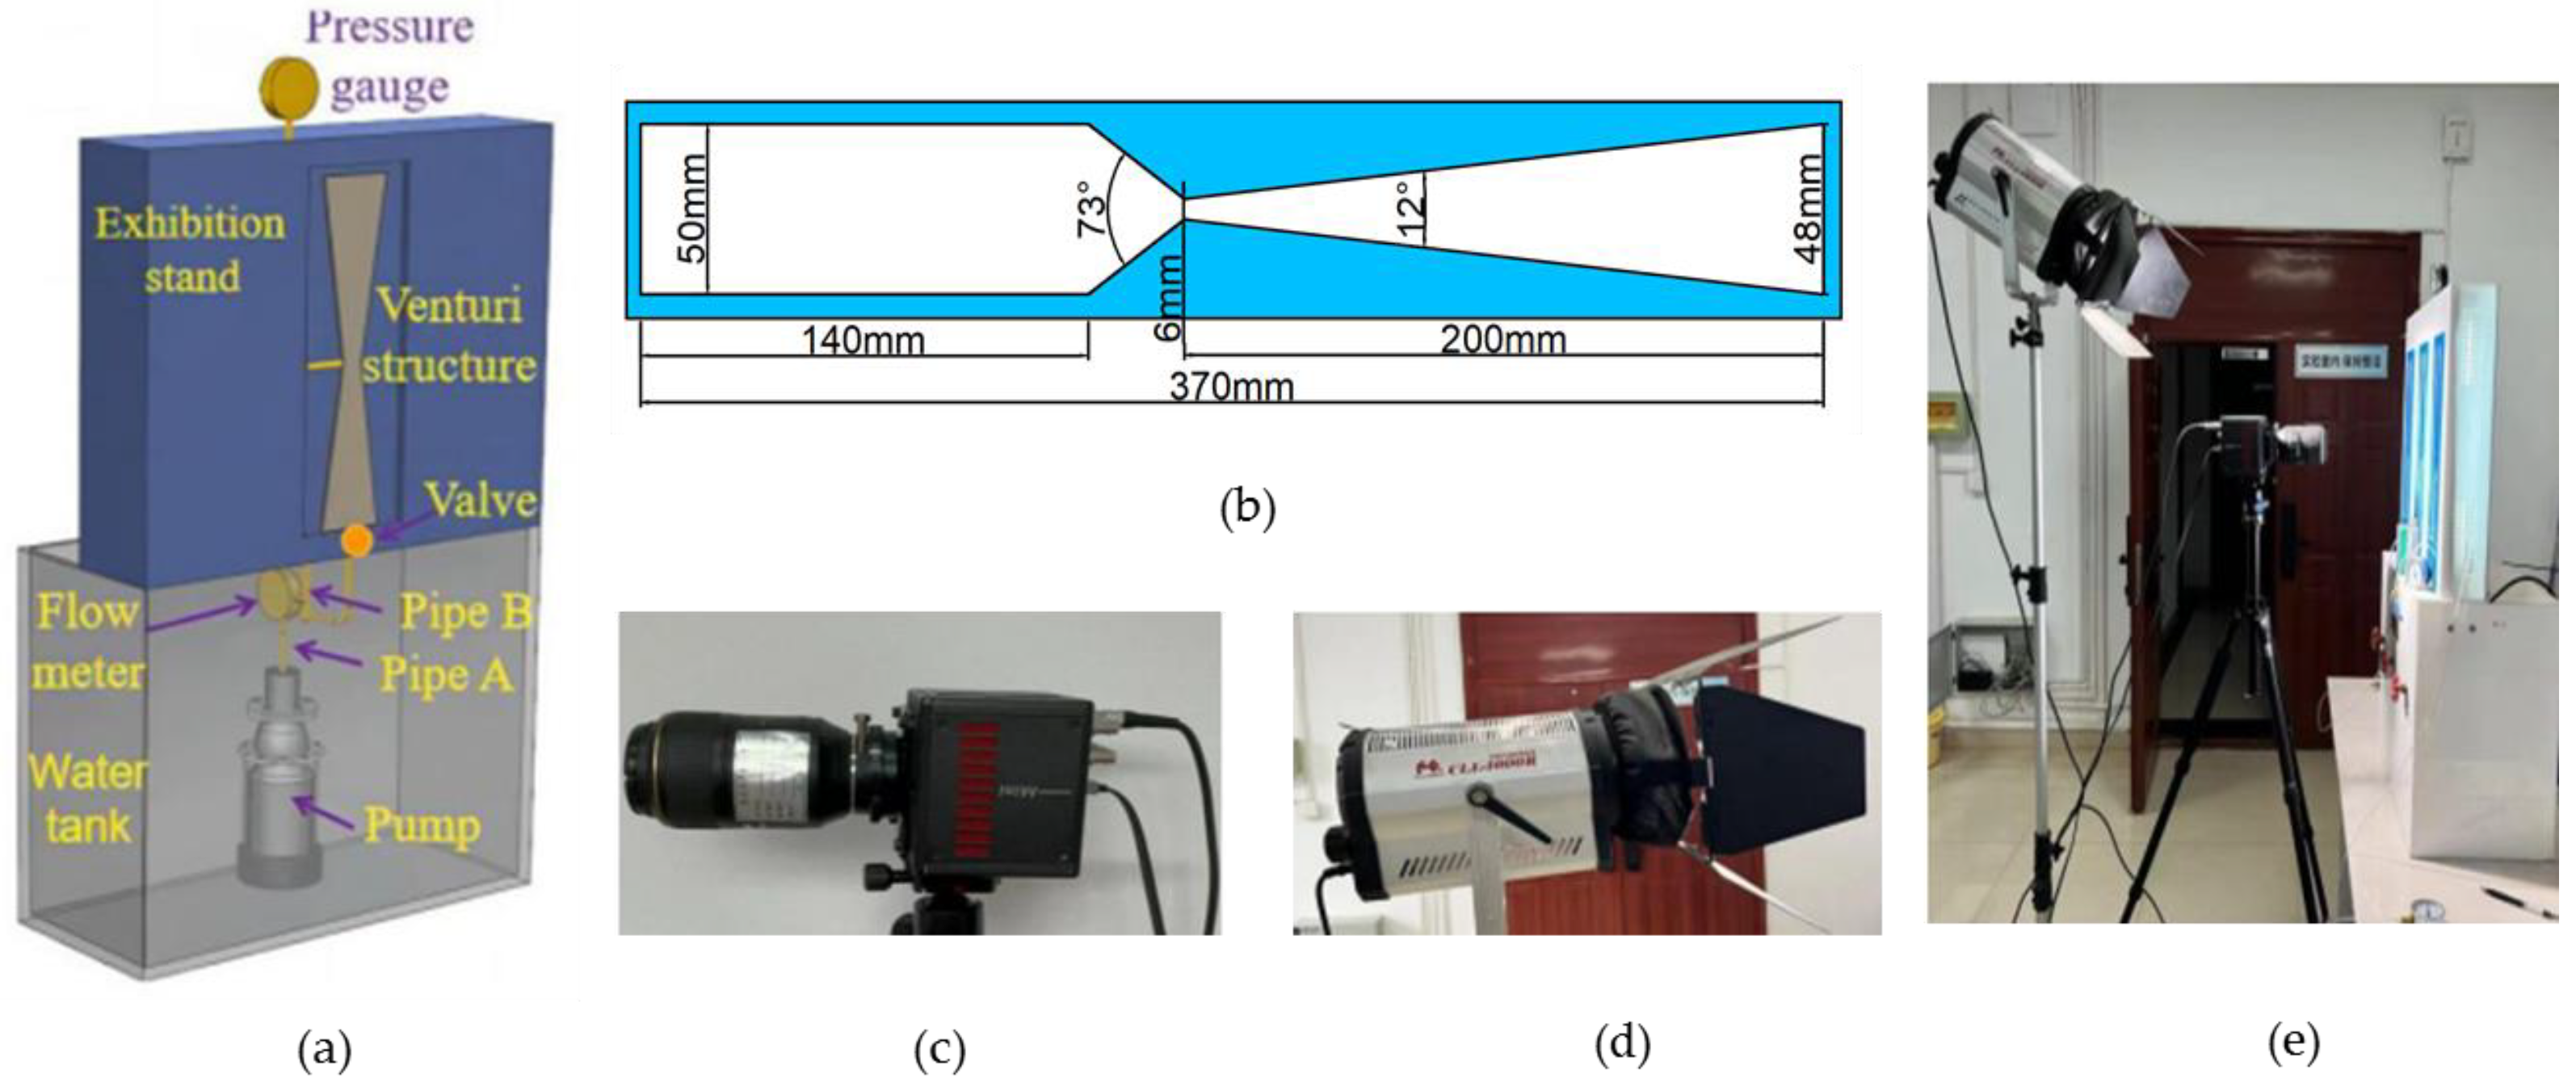
2.1. Experimental Apparatus
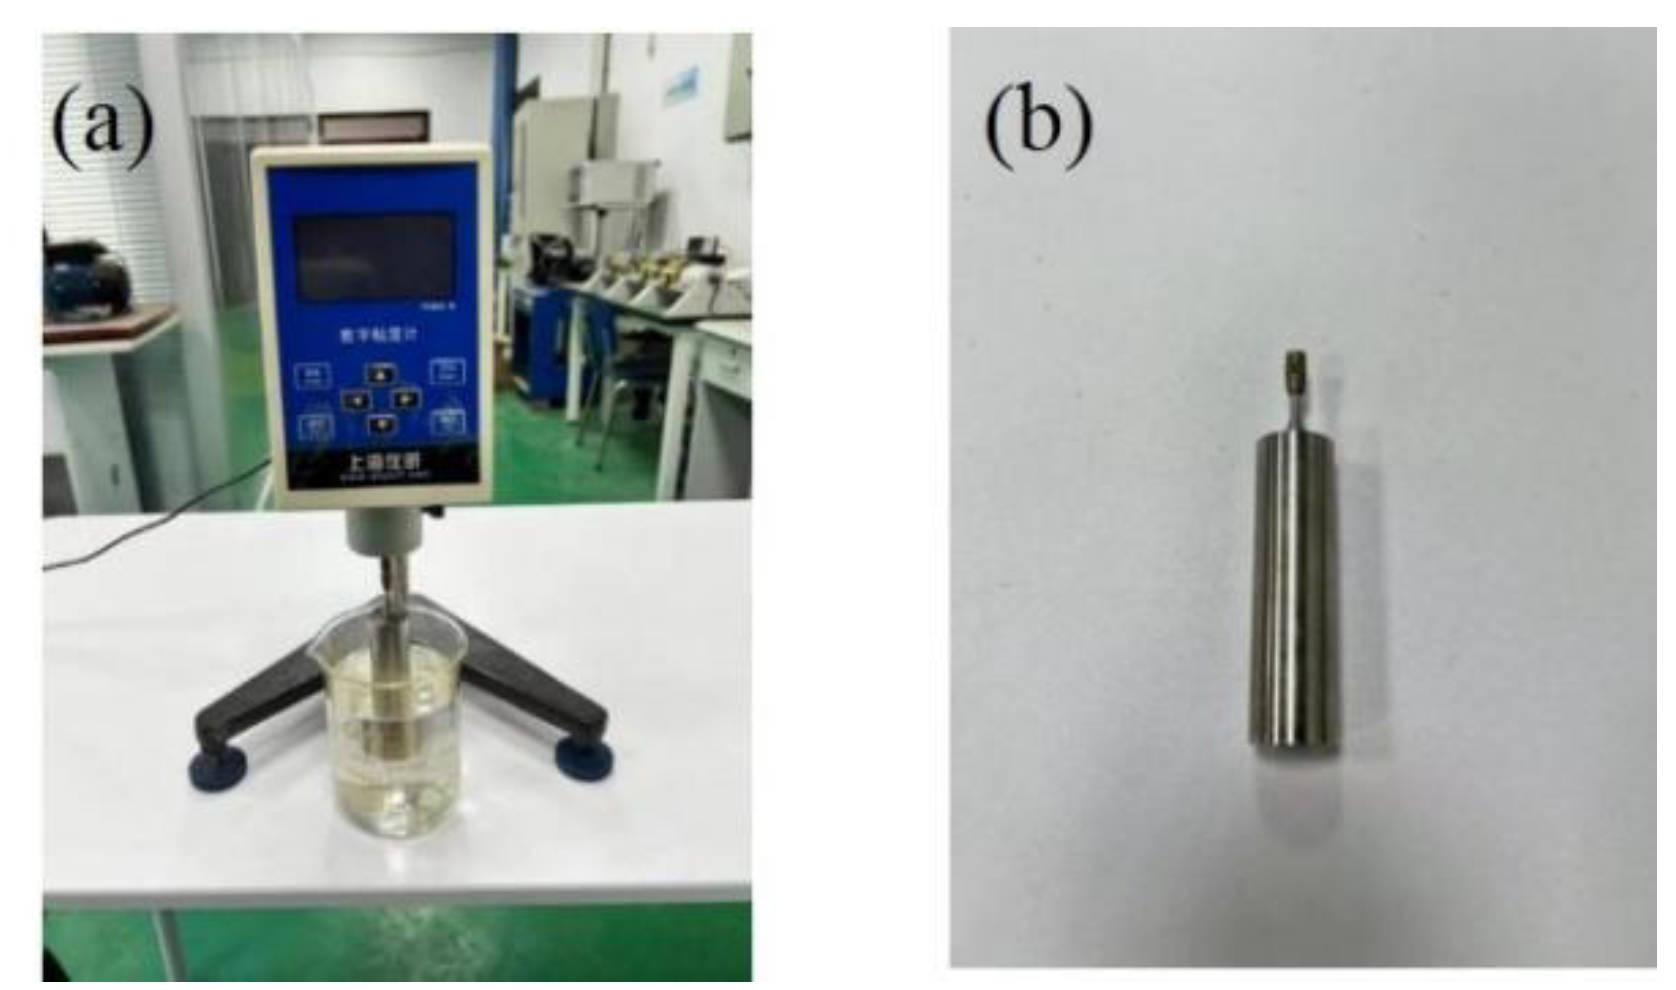
2.2. Measurement of Viscosity
2.3. Experiment Results
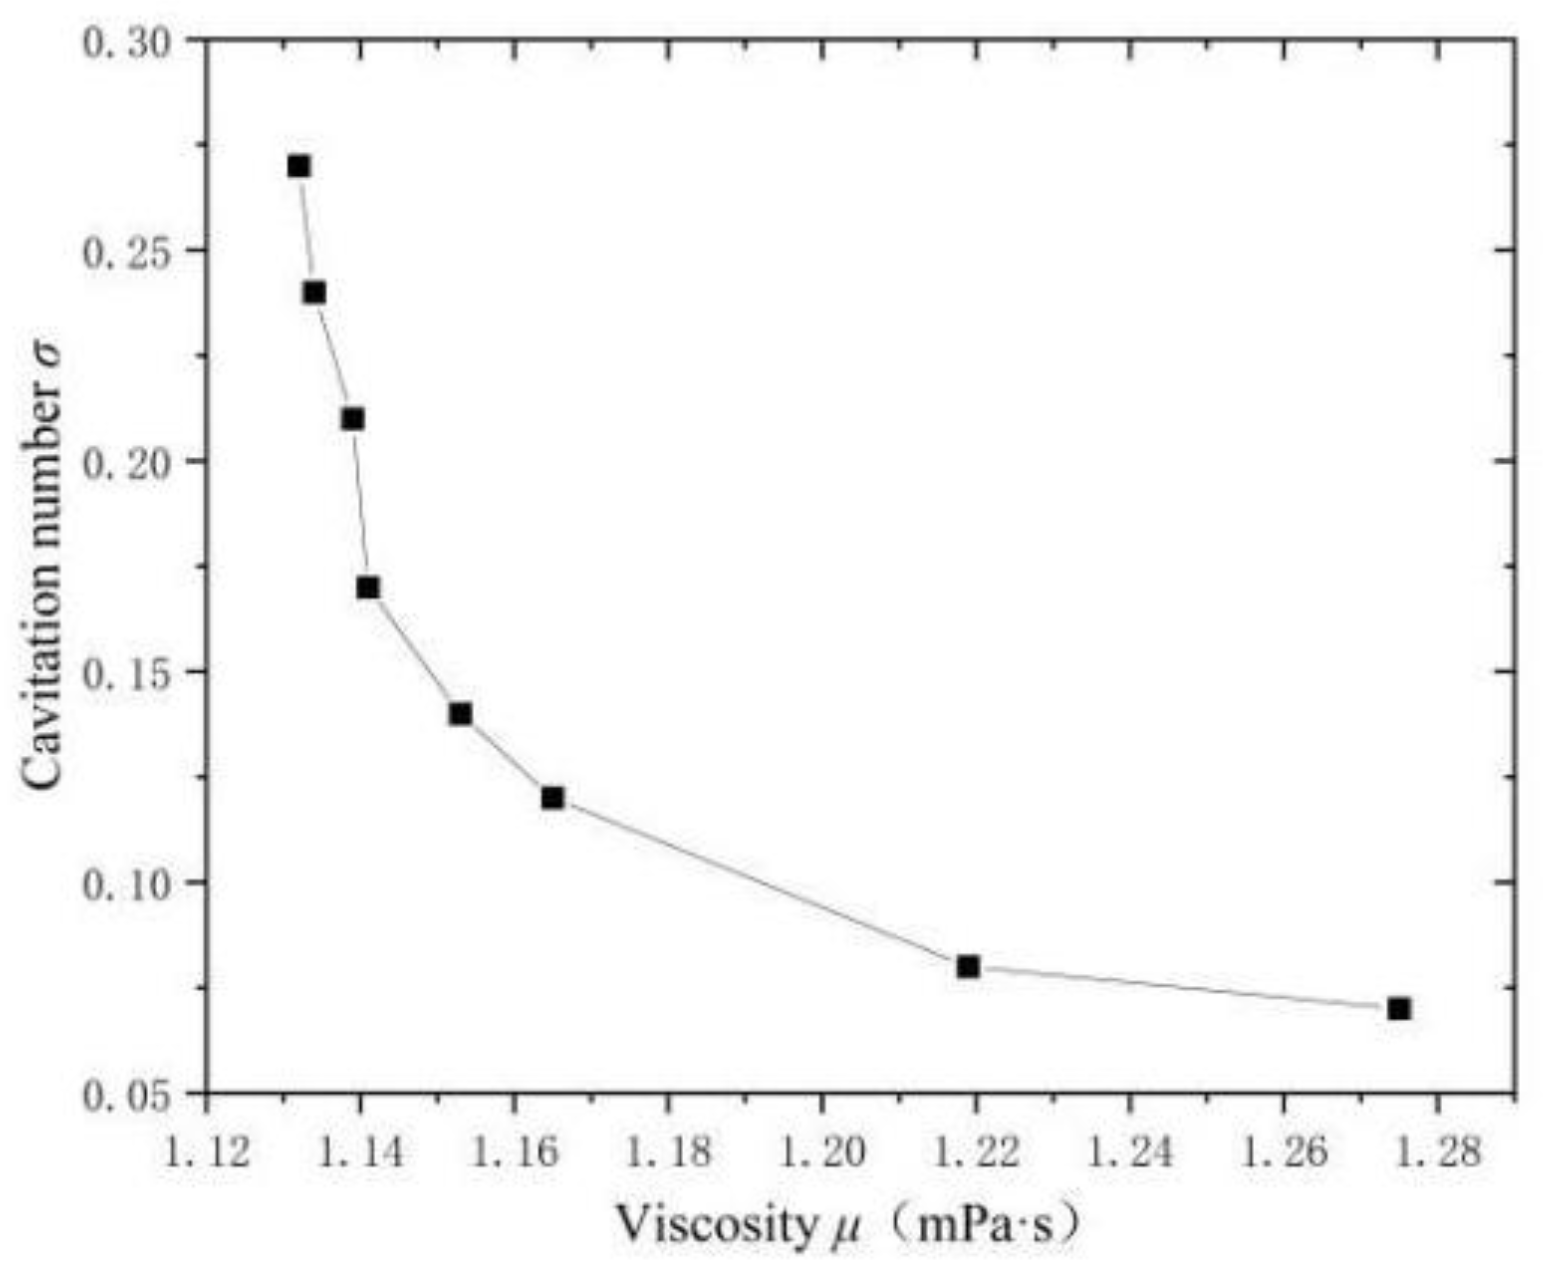
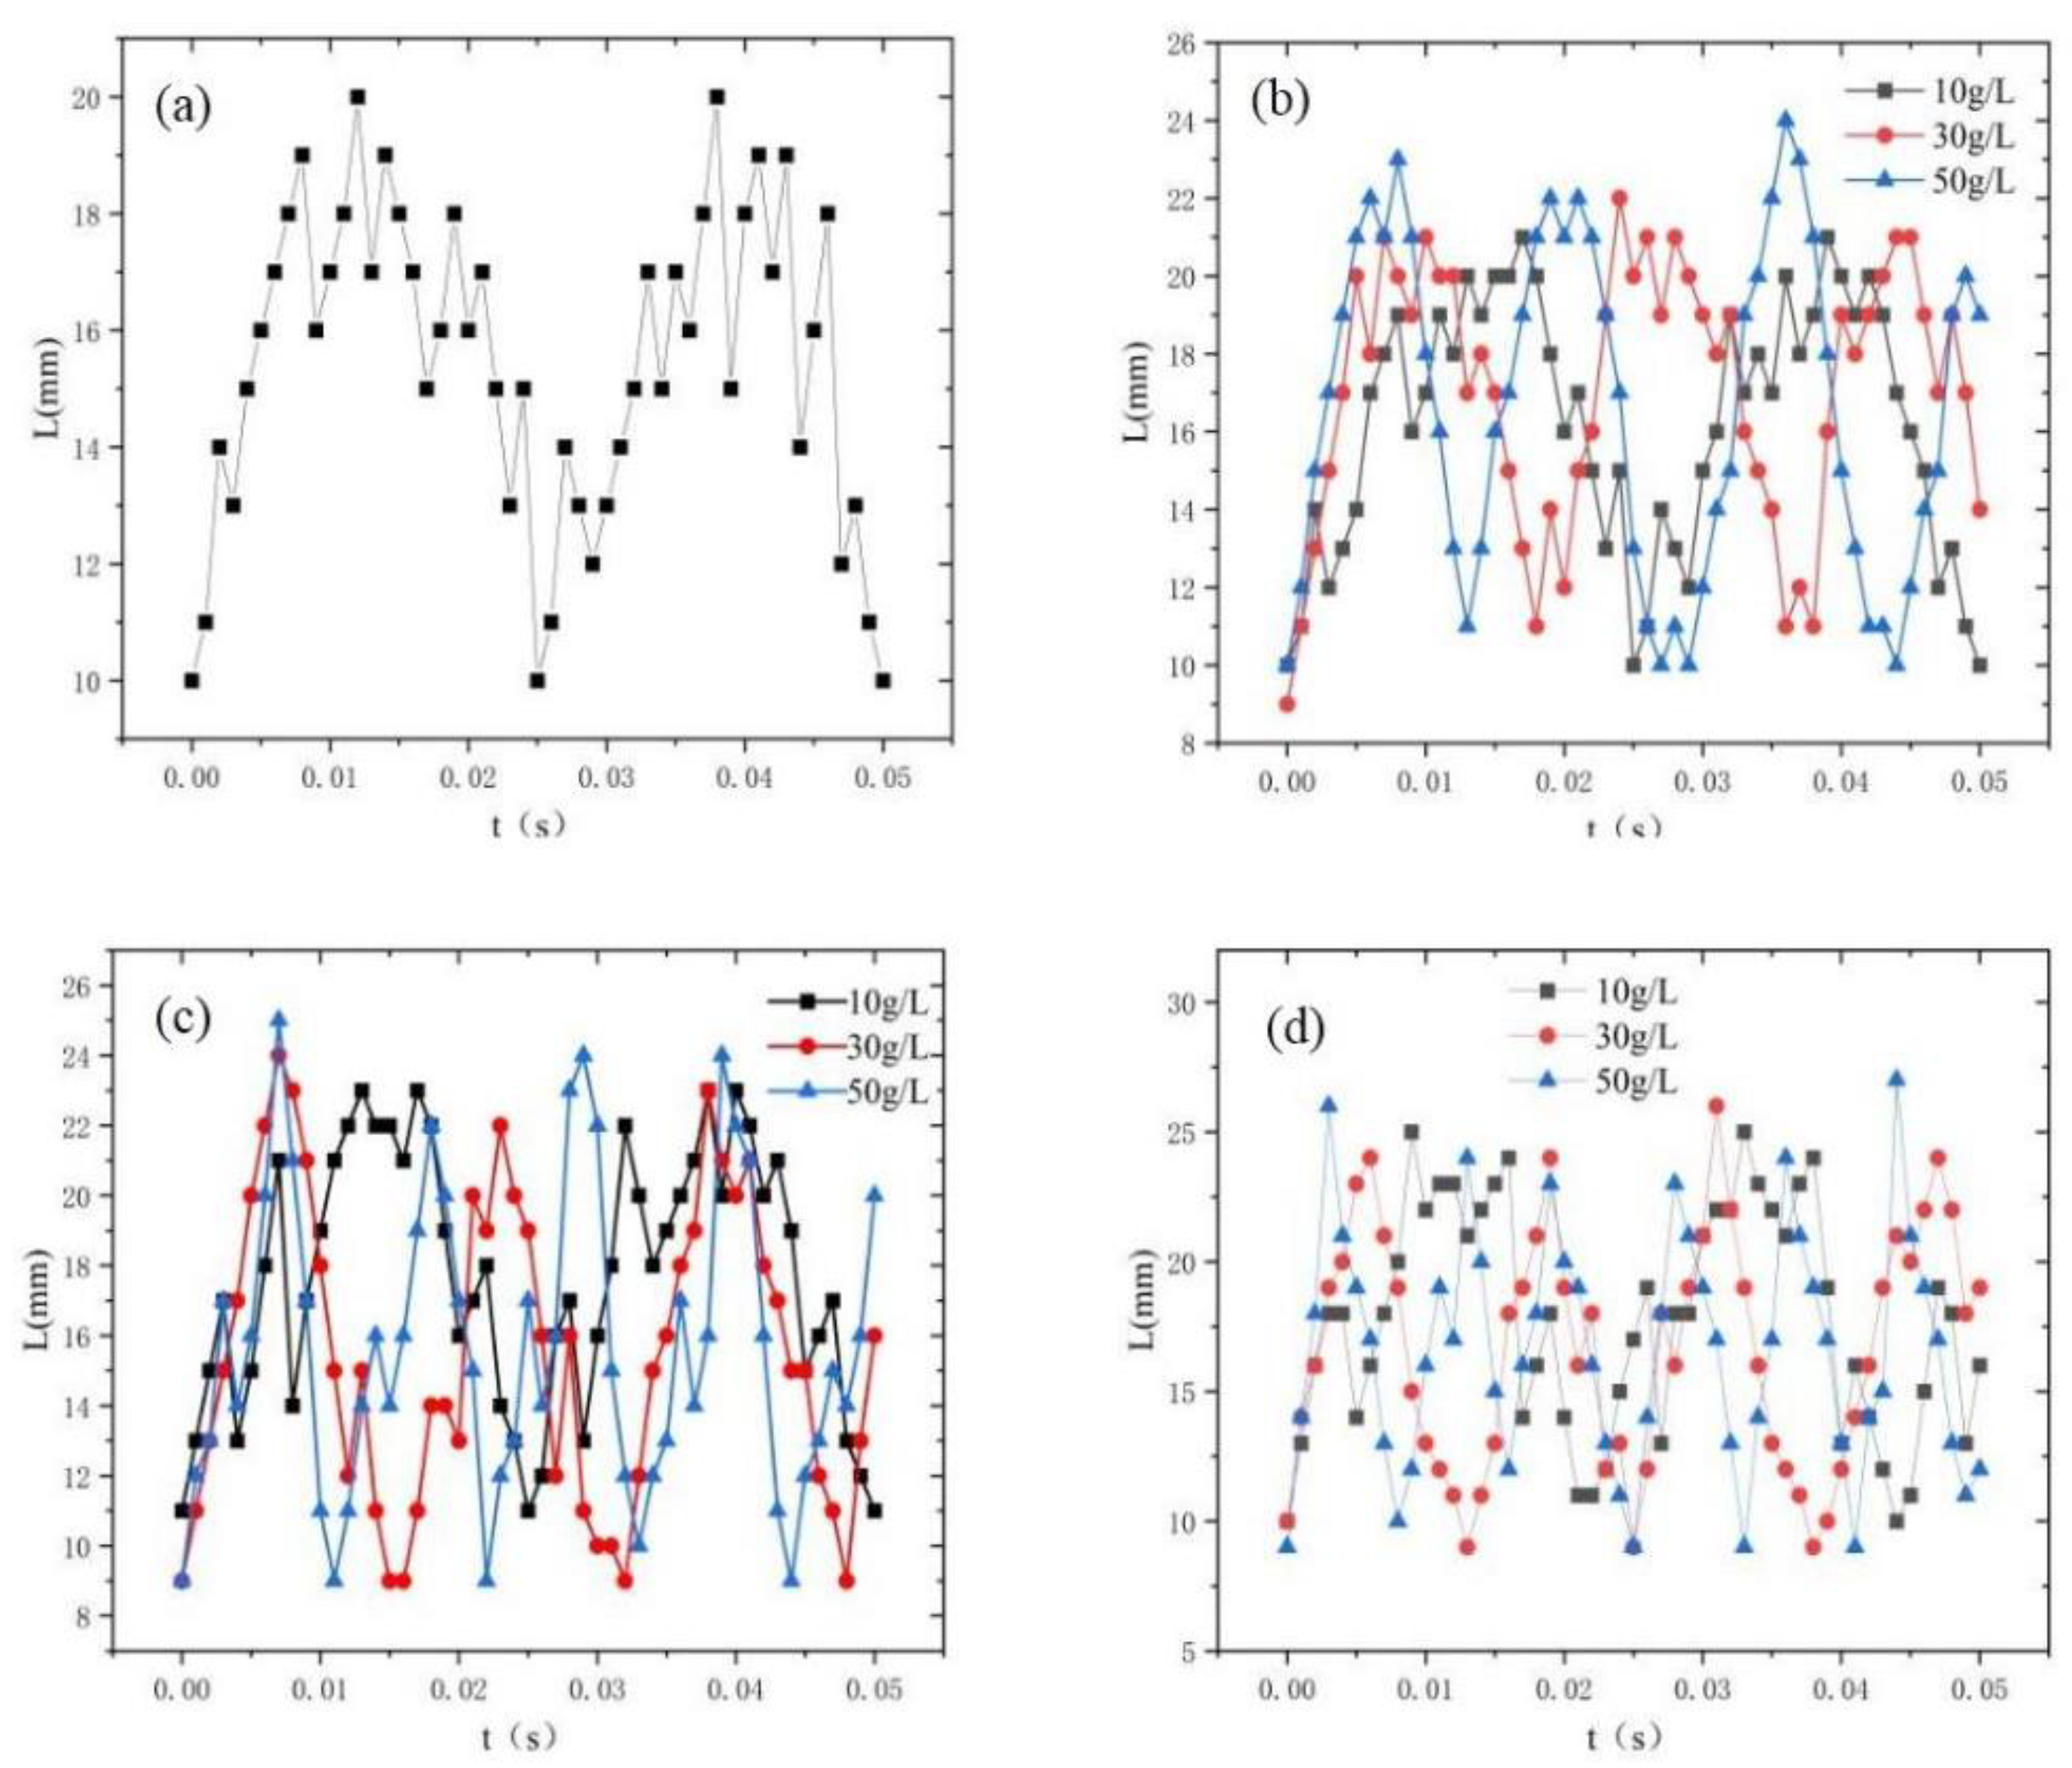
2.3.1. Comparison of the Cavitation Intensity
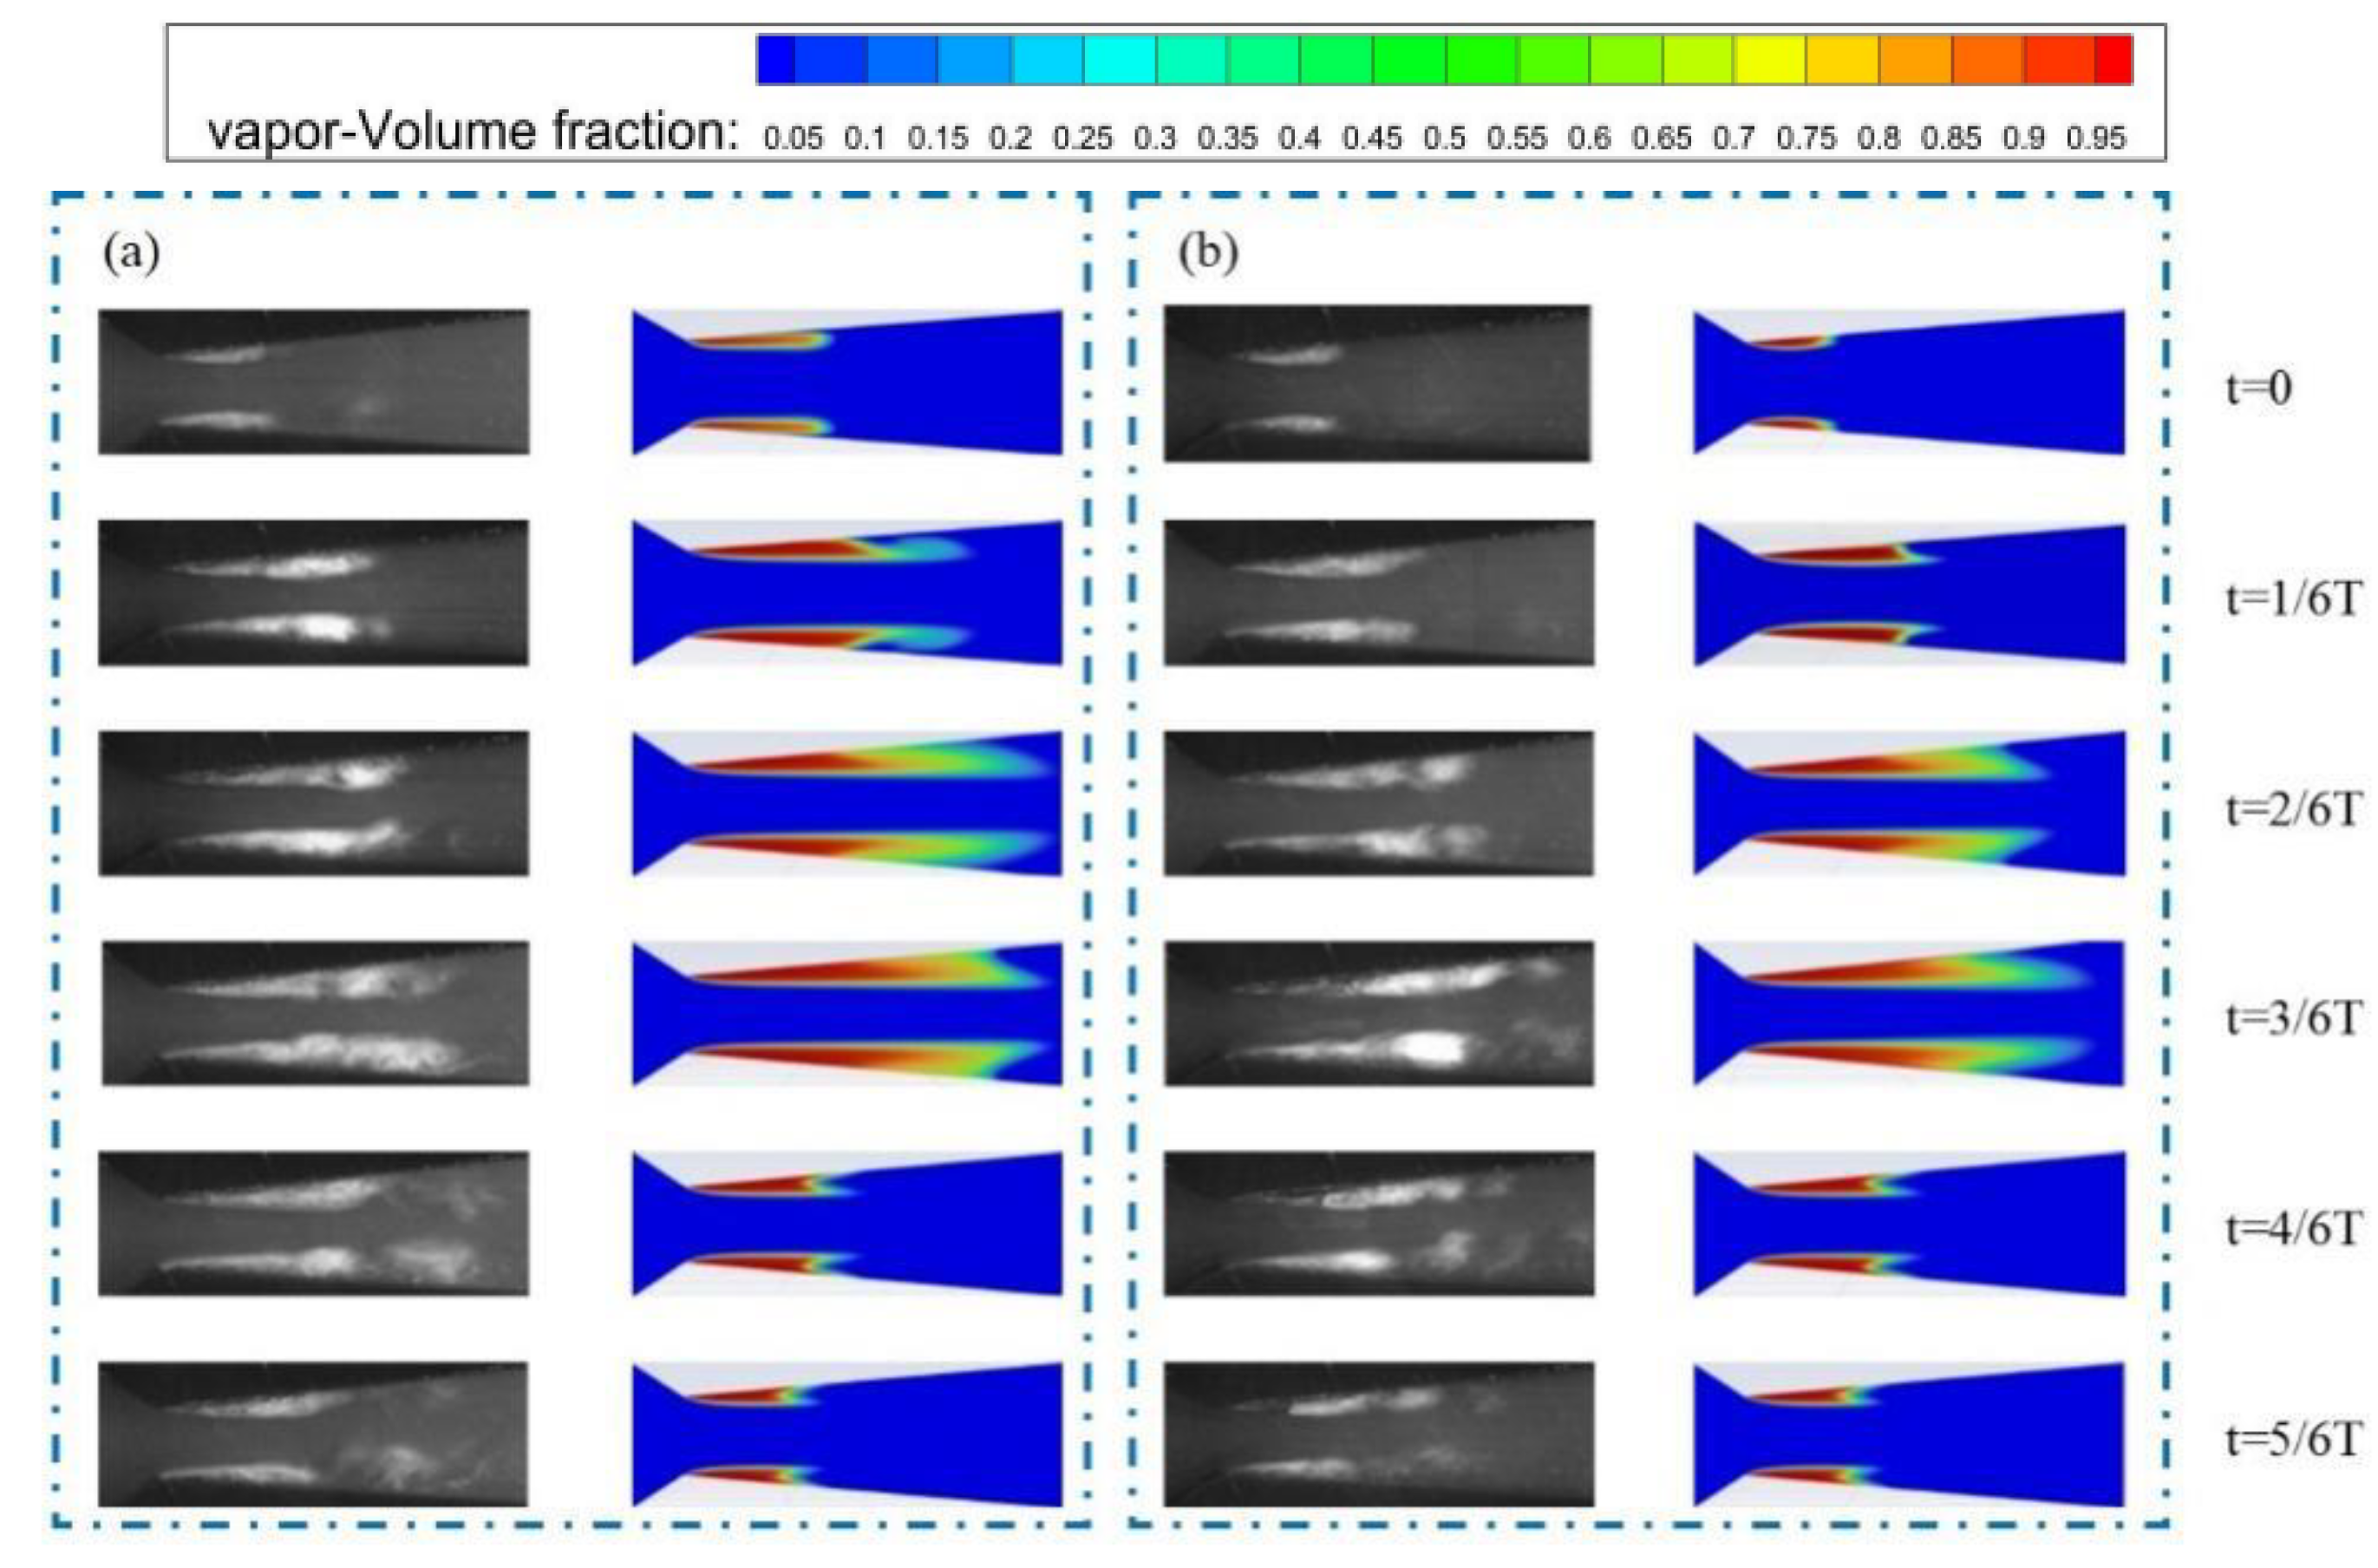
2.3.2. Evolution Process of the Cavitation Cloud
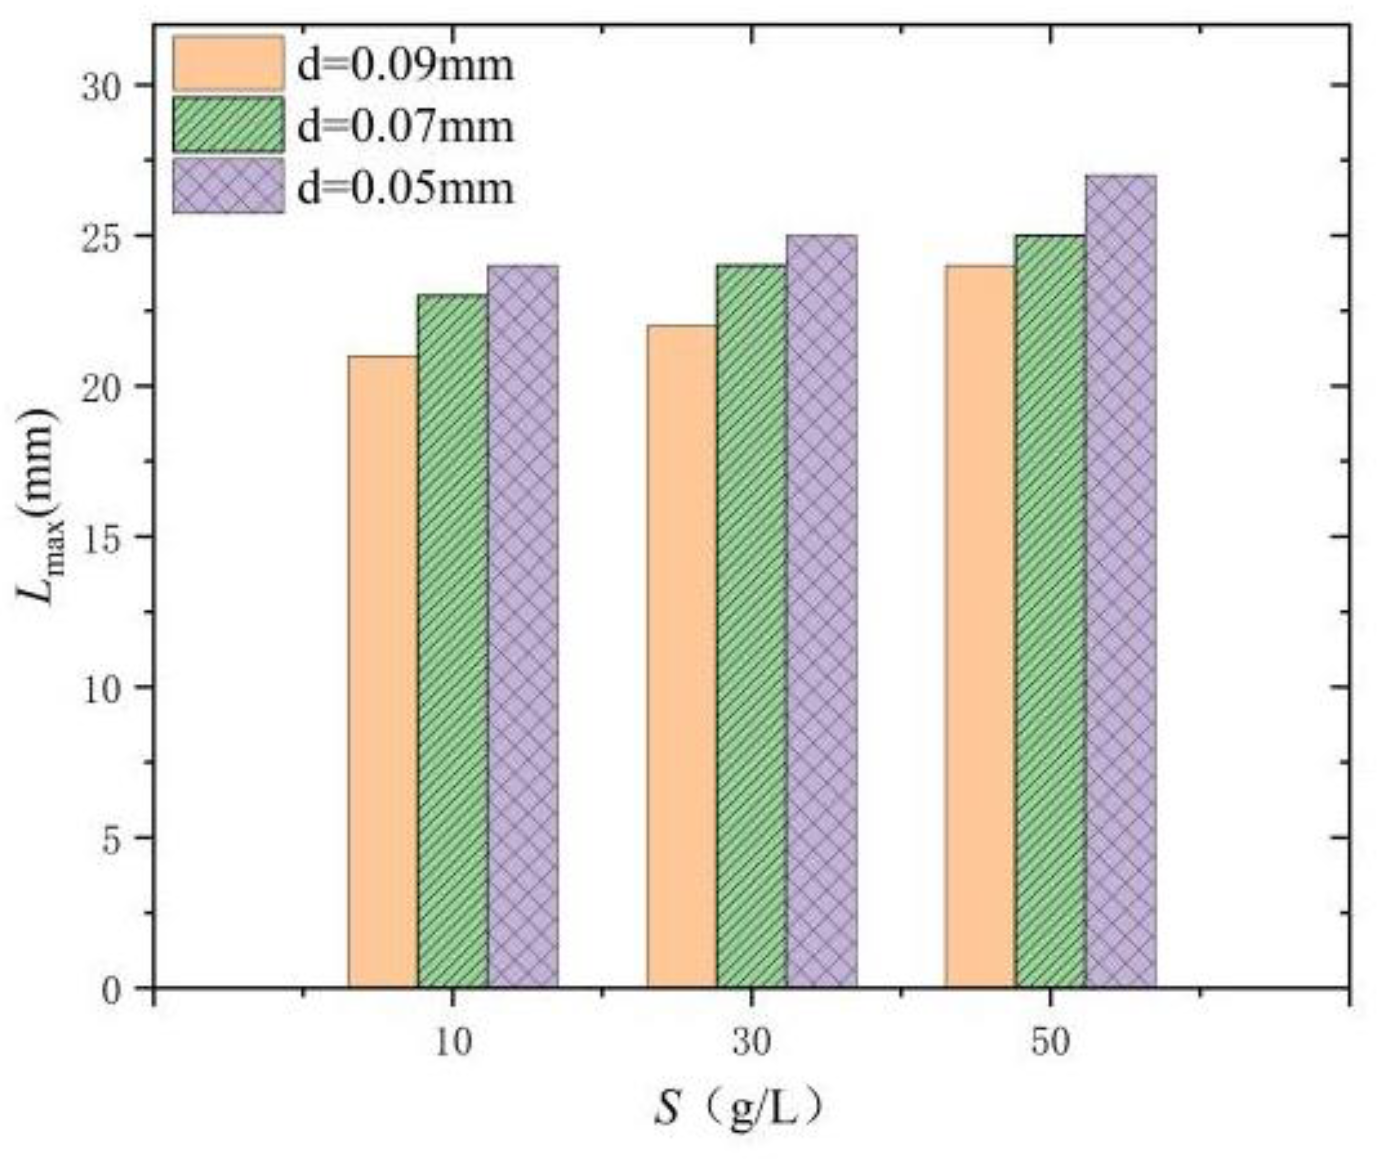
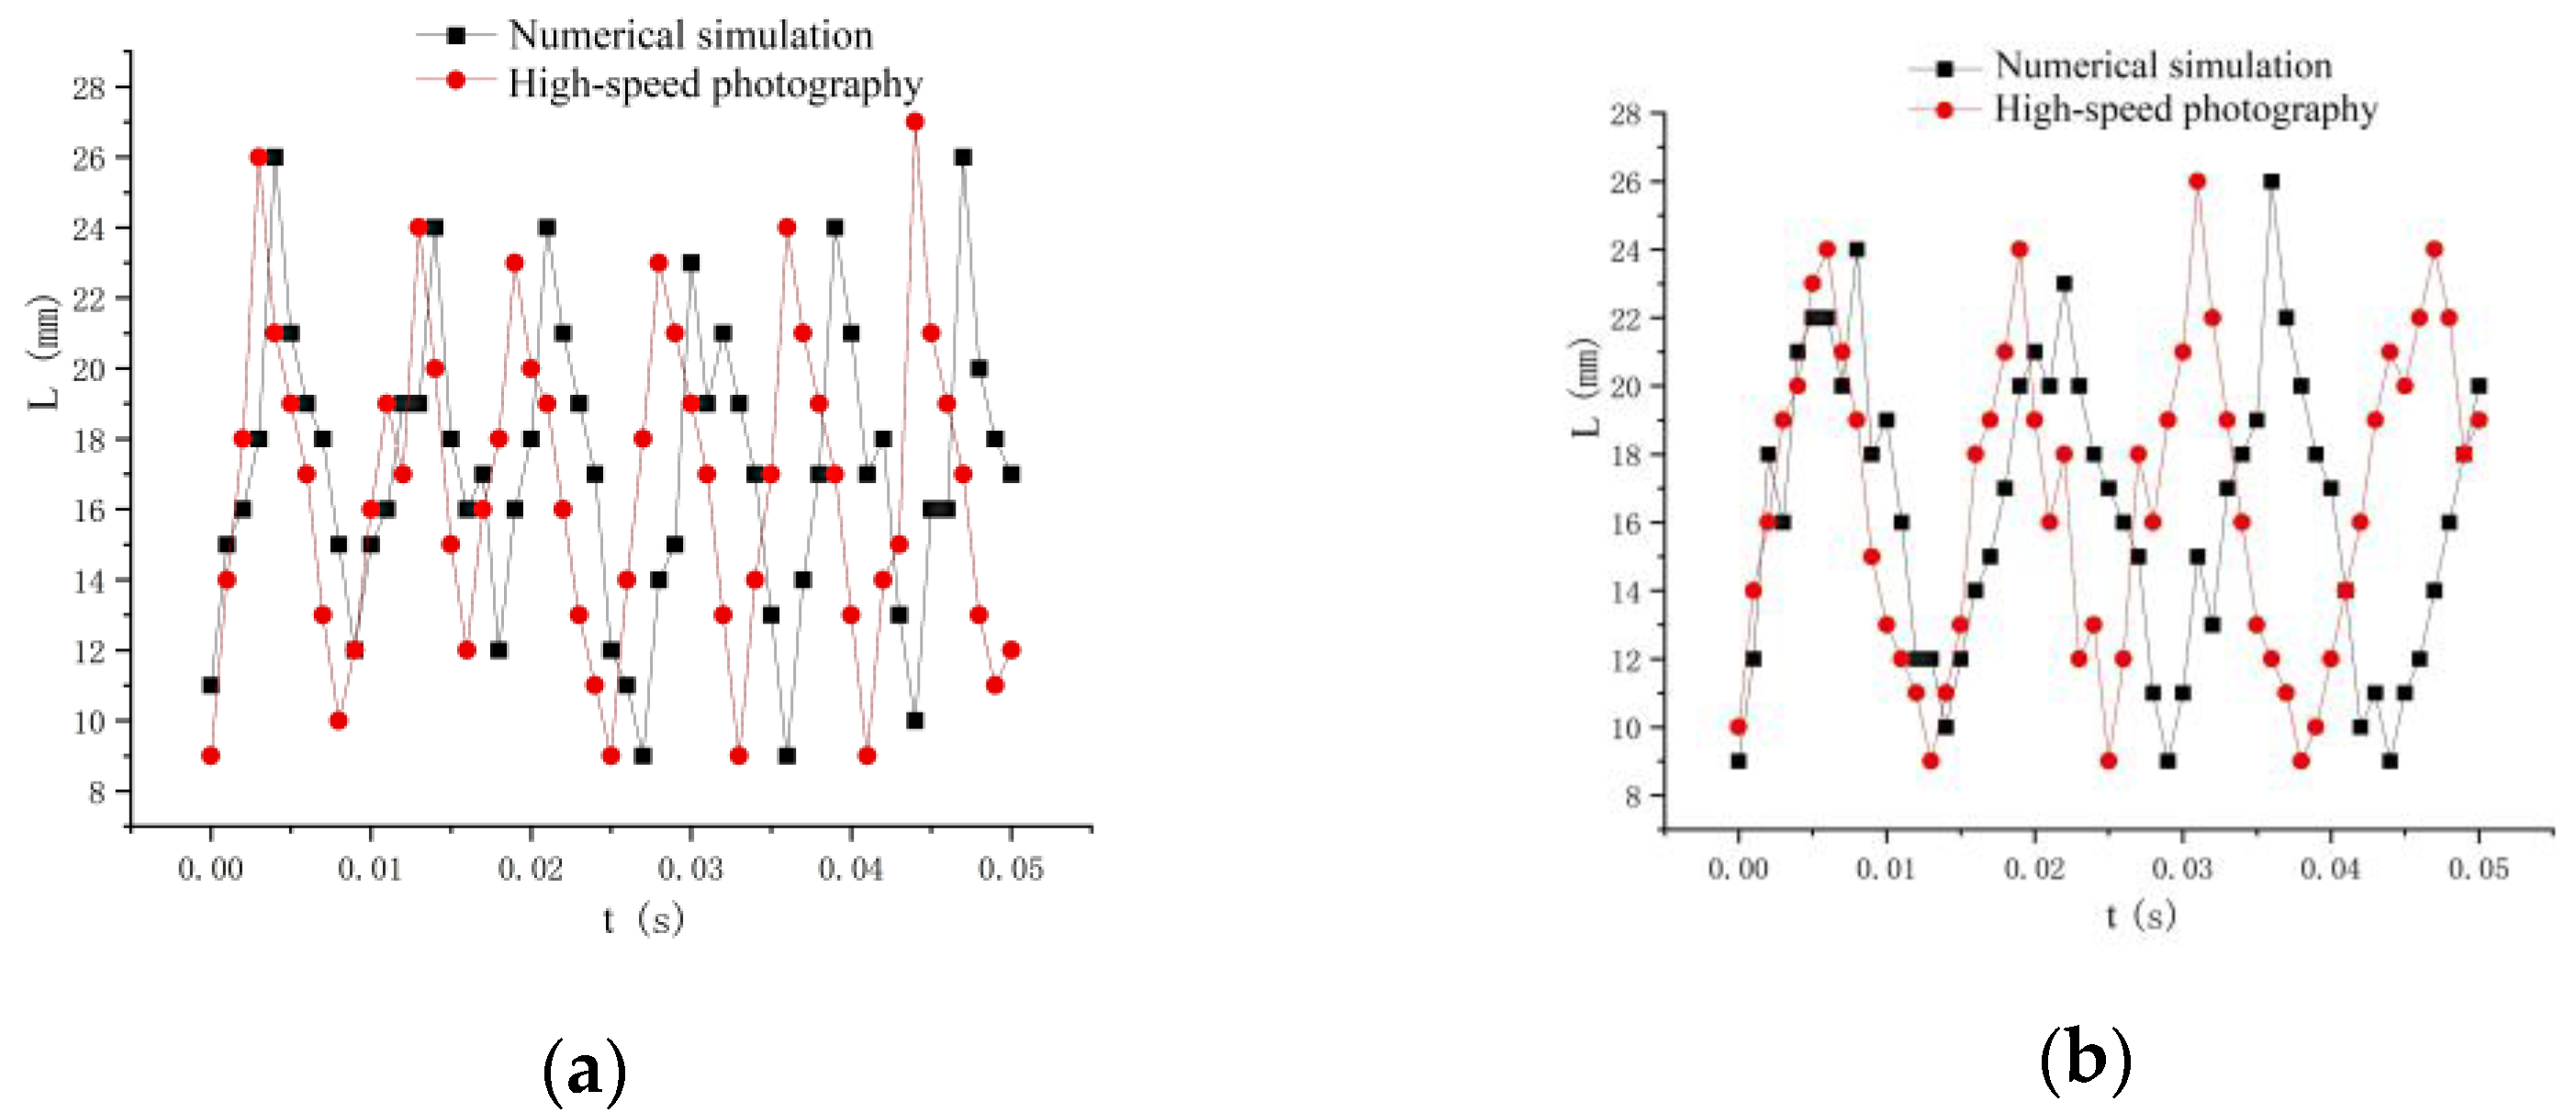
2.3.3. Maximum Length of the Wall-Bounded Cavitation Cloud
3. Numerical Calculation
3.1. Mathematical Model
3.1.1. Solid–Liquid Mixture Model
3.1.2. Solid–Liquid–Vapor Mixture Model
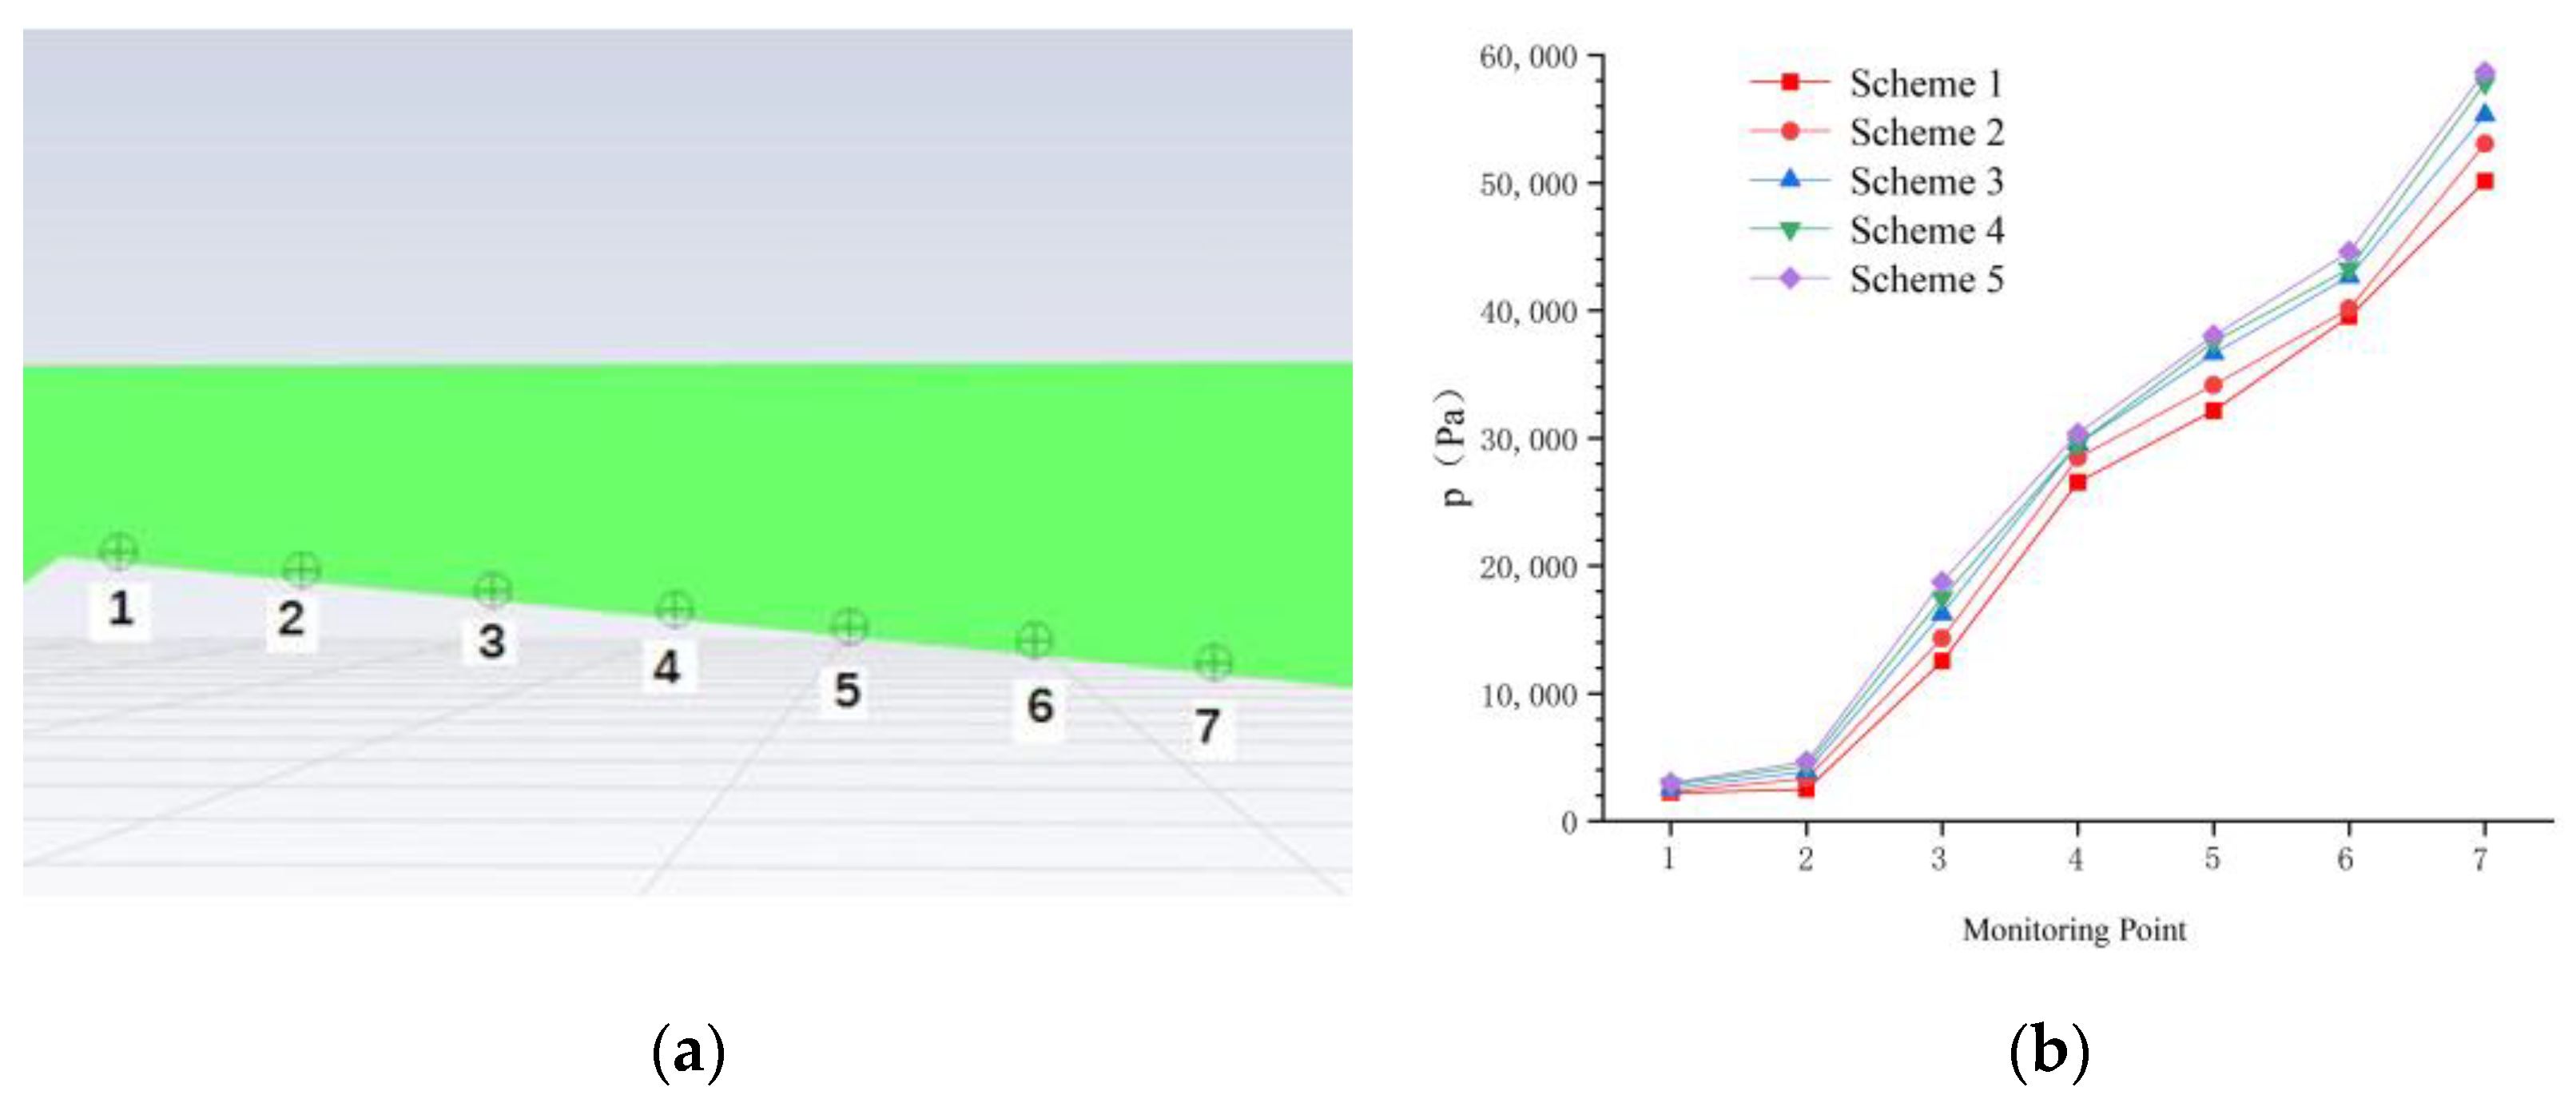
3.2. Grid Generation
3.3. Boundary Conditions and Parameter Settings
3.4. Analysis of the Calculation Results
3.4.1. Comparison of the Cavitation Cloud Morphology and Periodicity
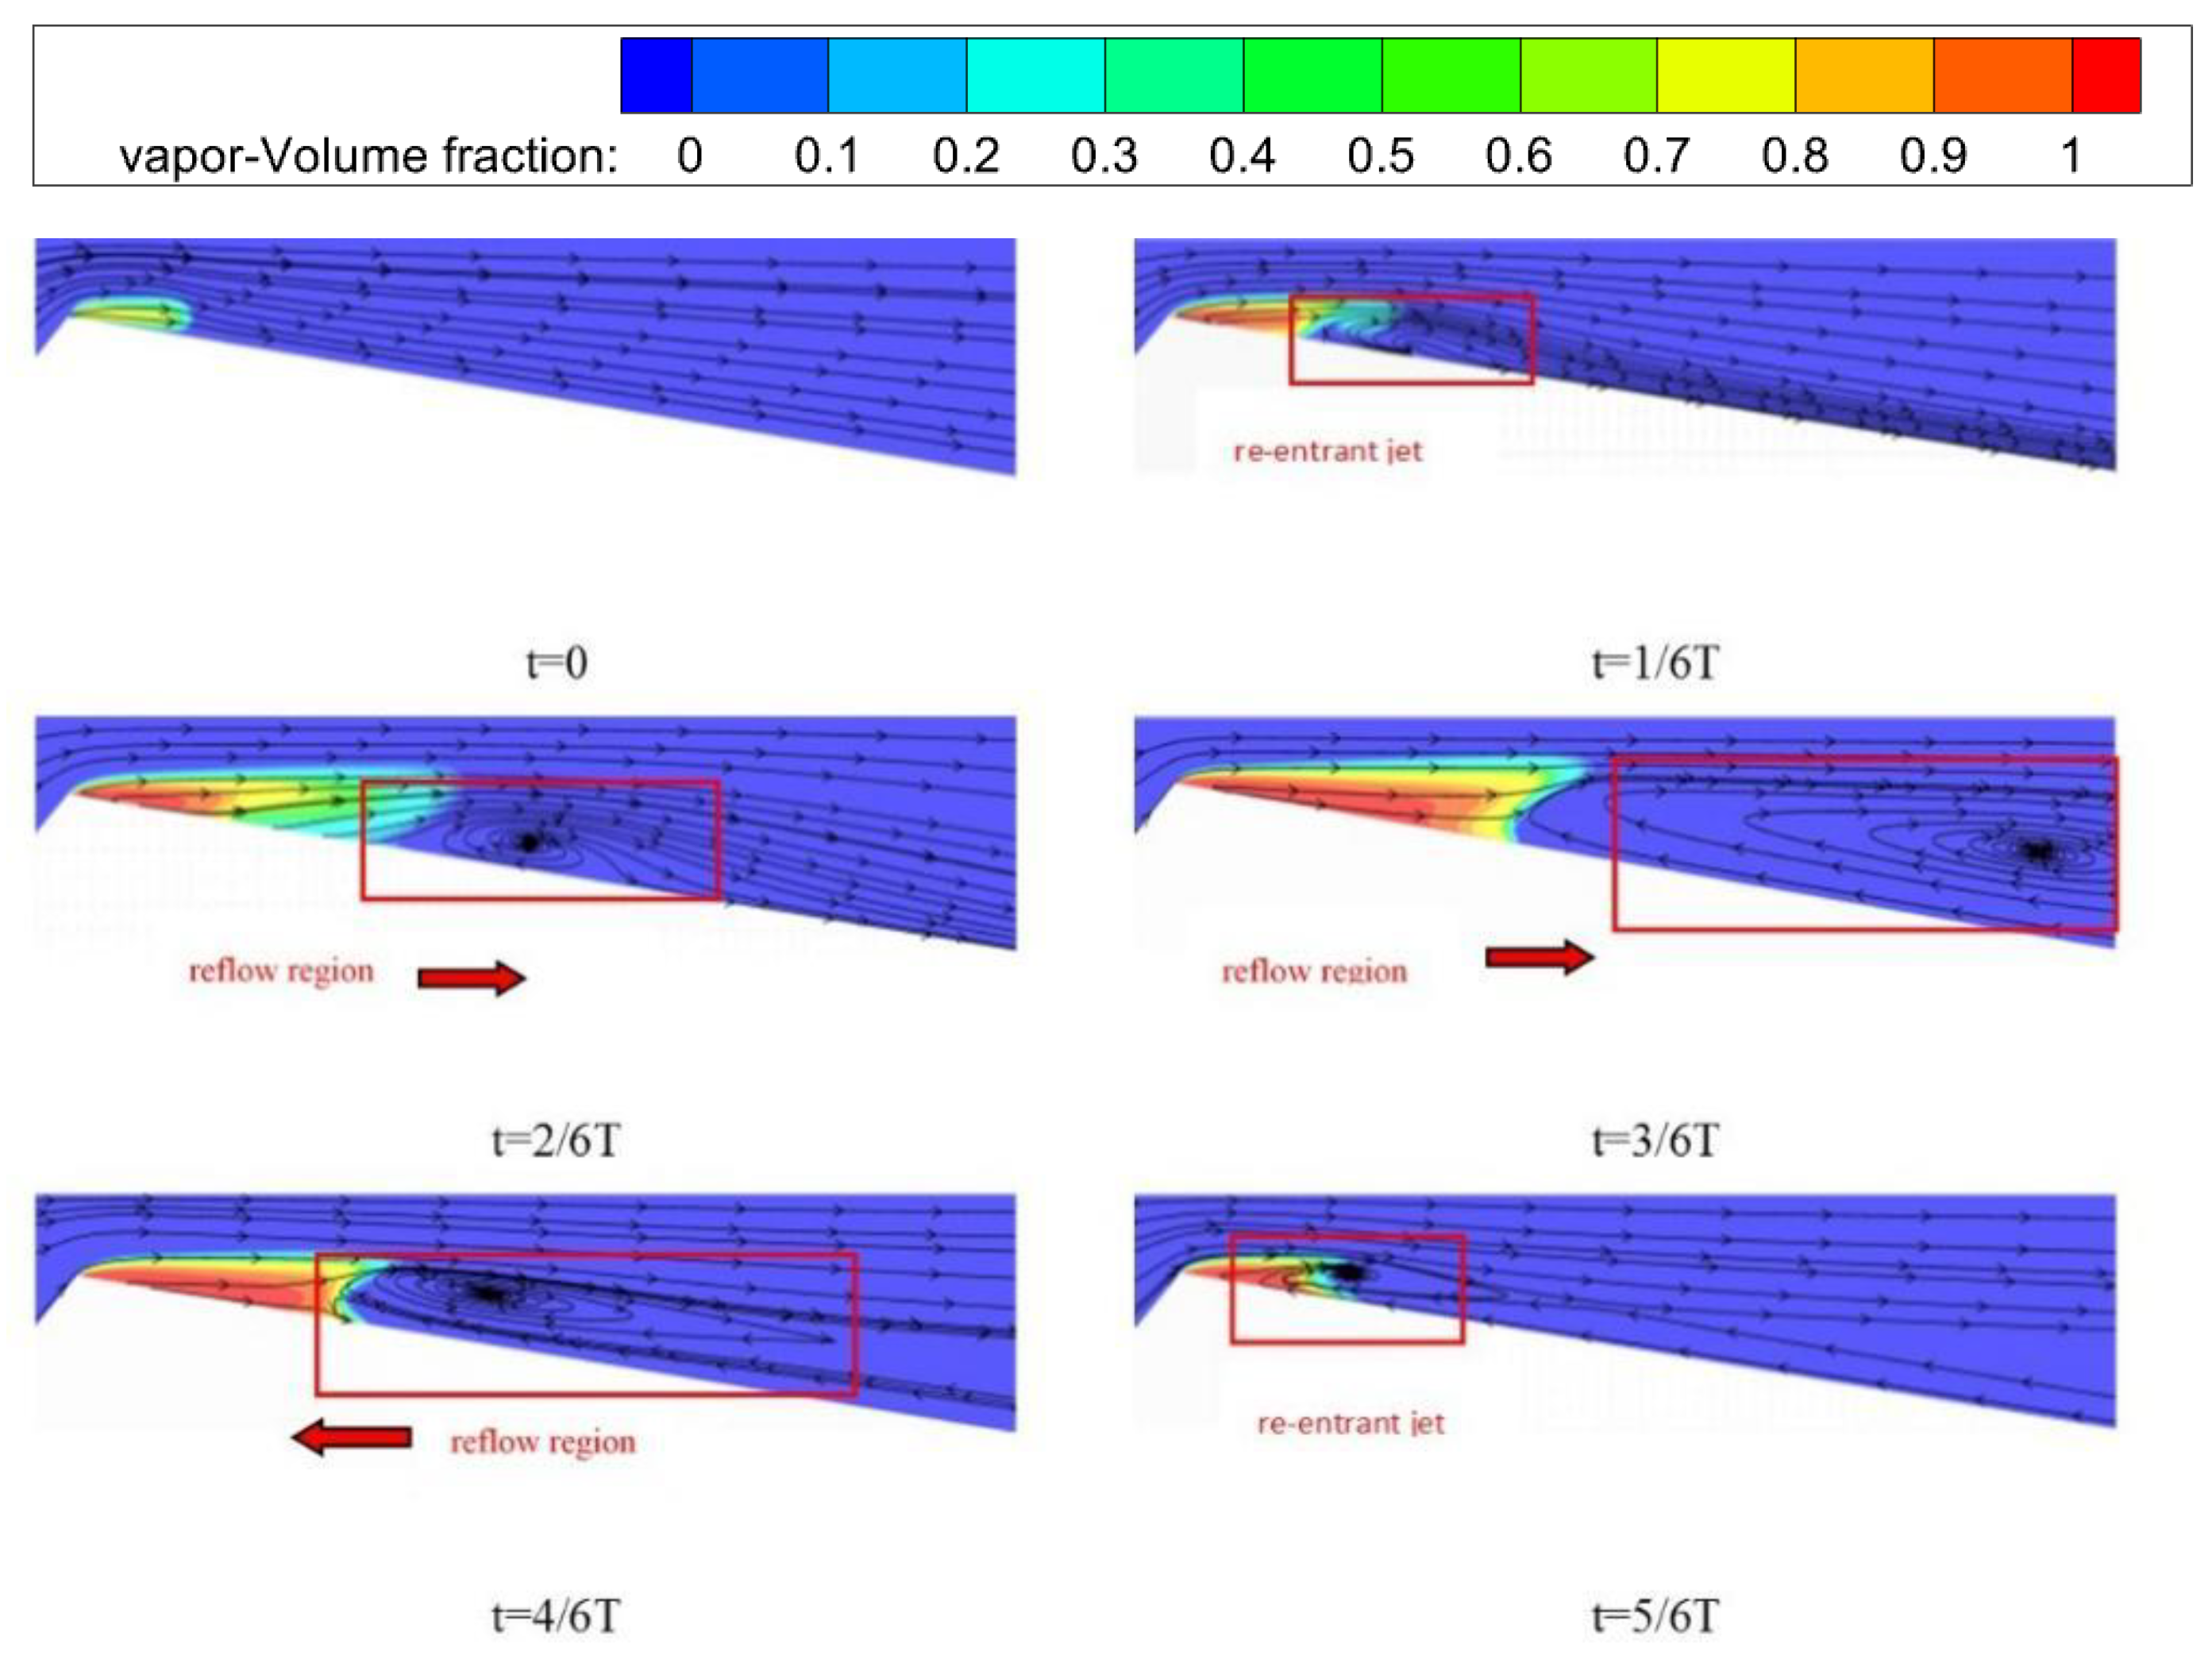
3.4.2. Re-Entrant Jet and Reflow
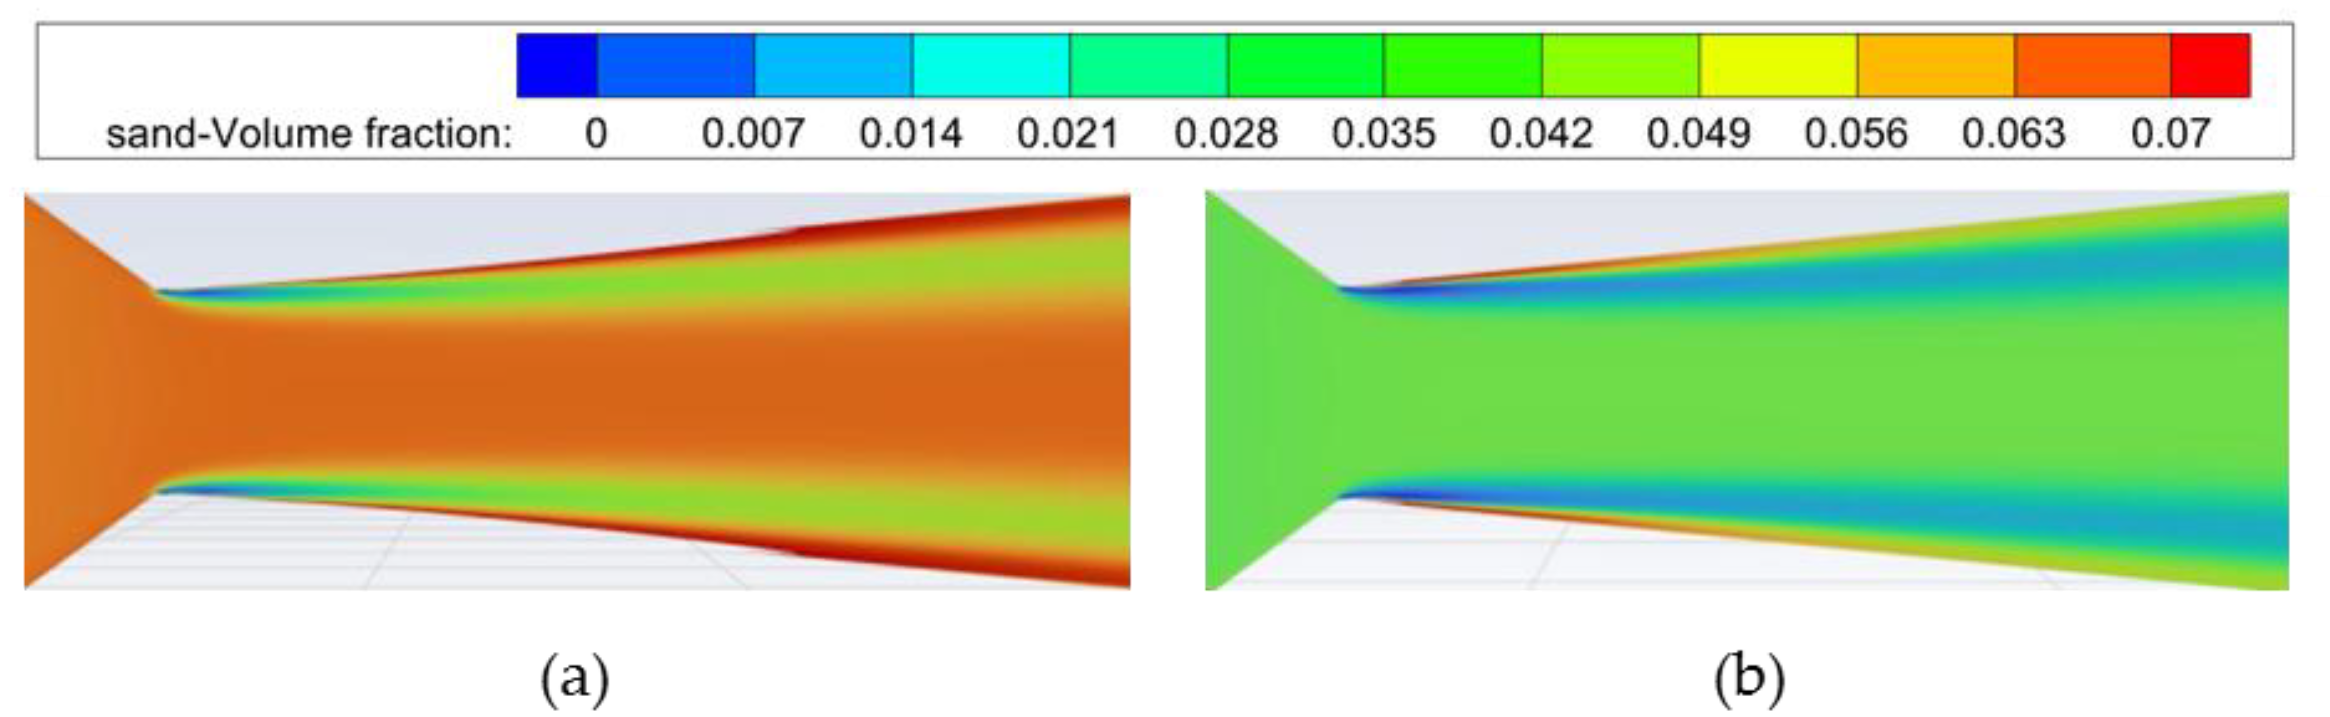
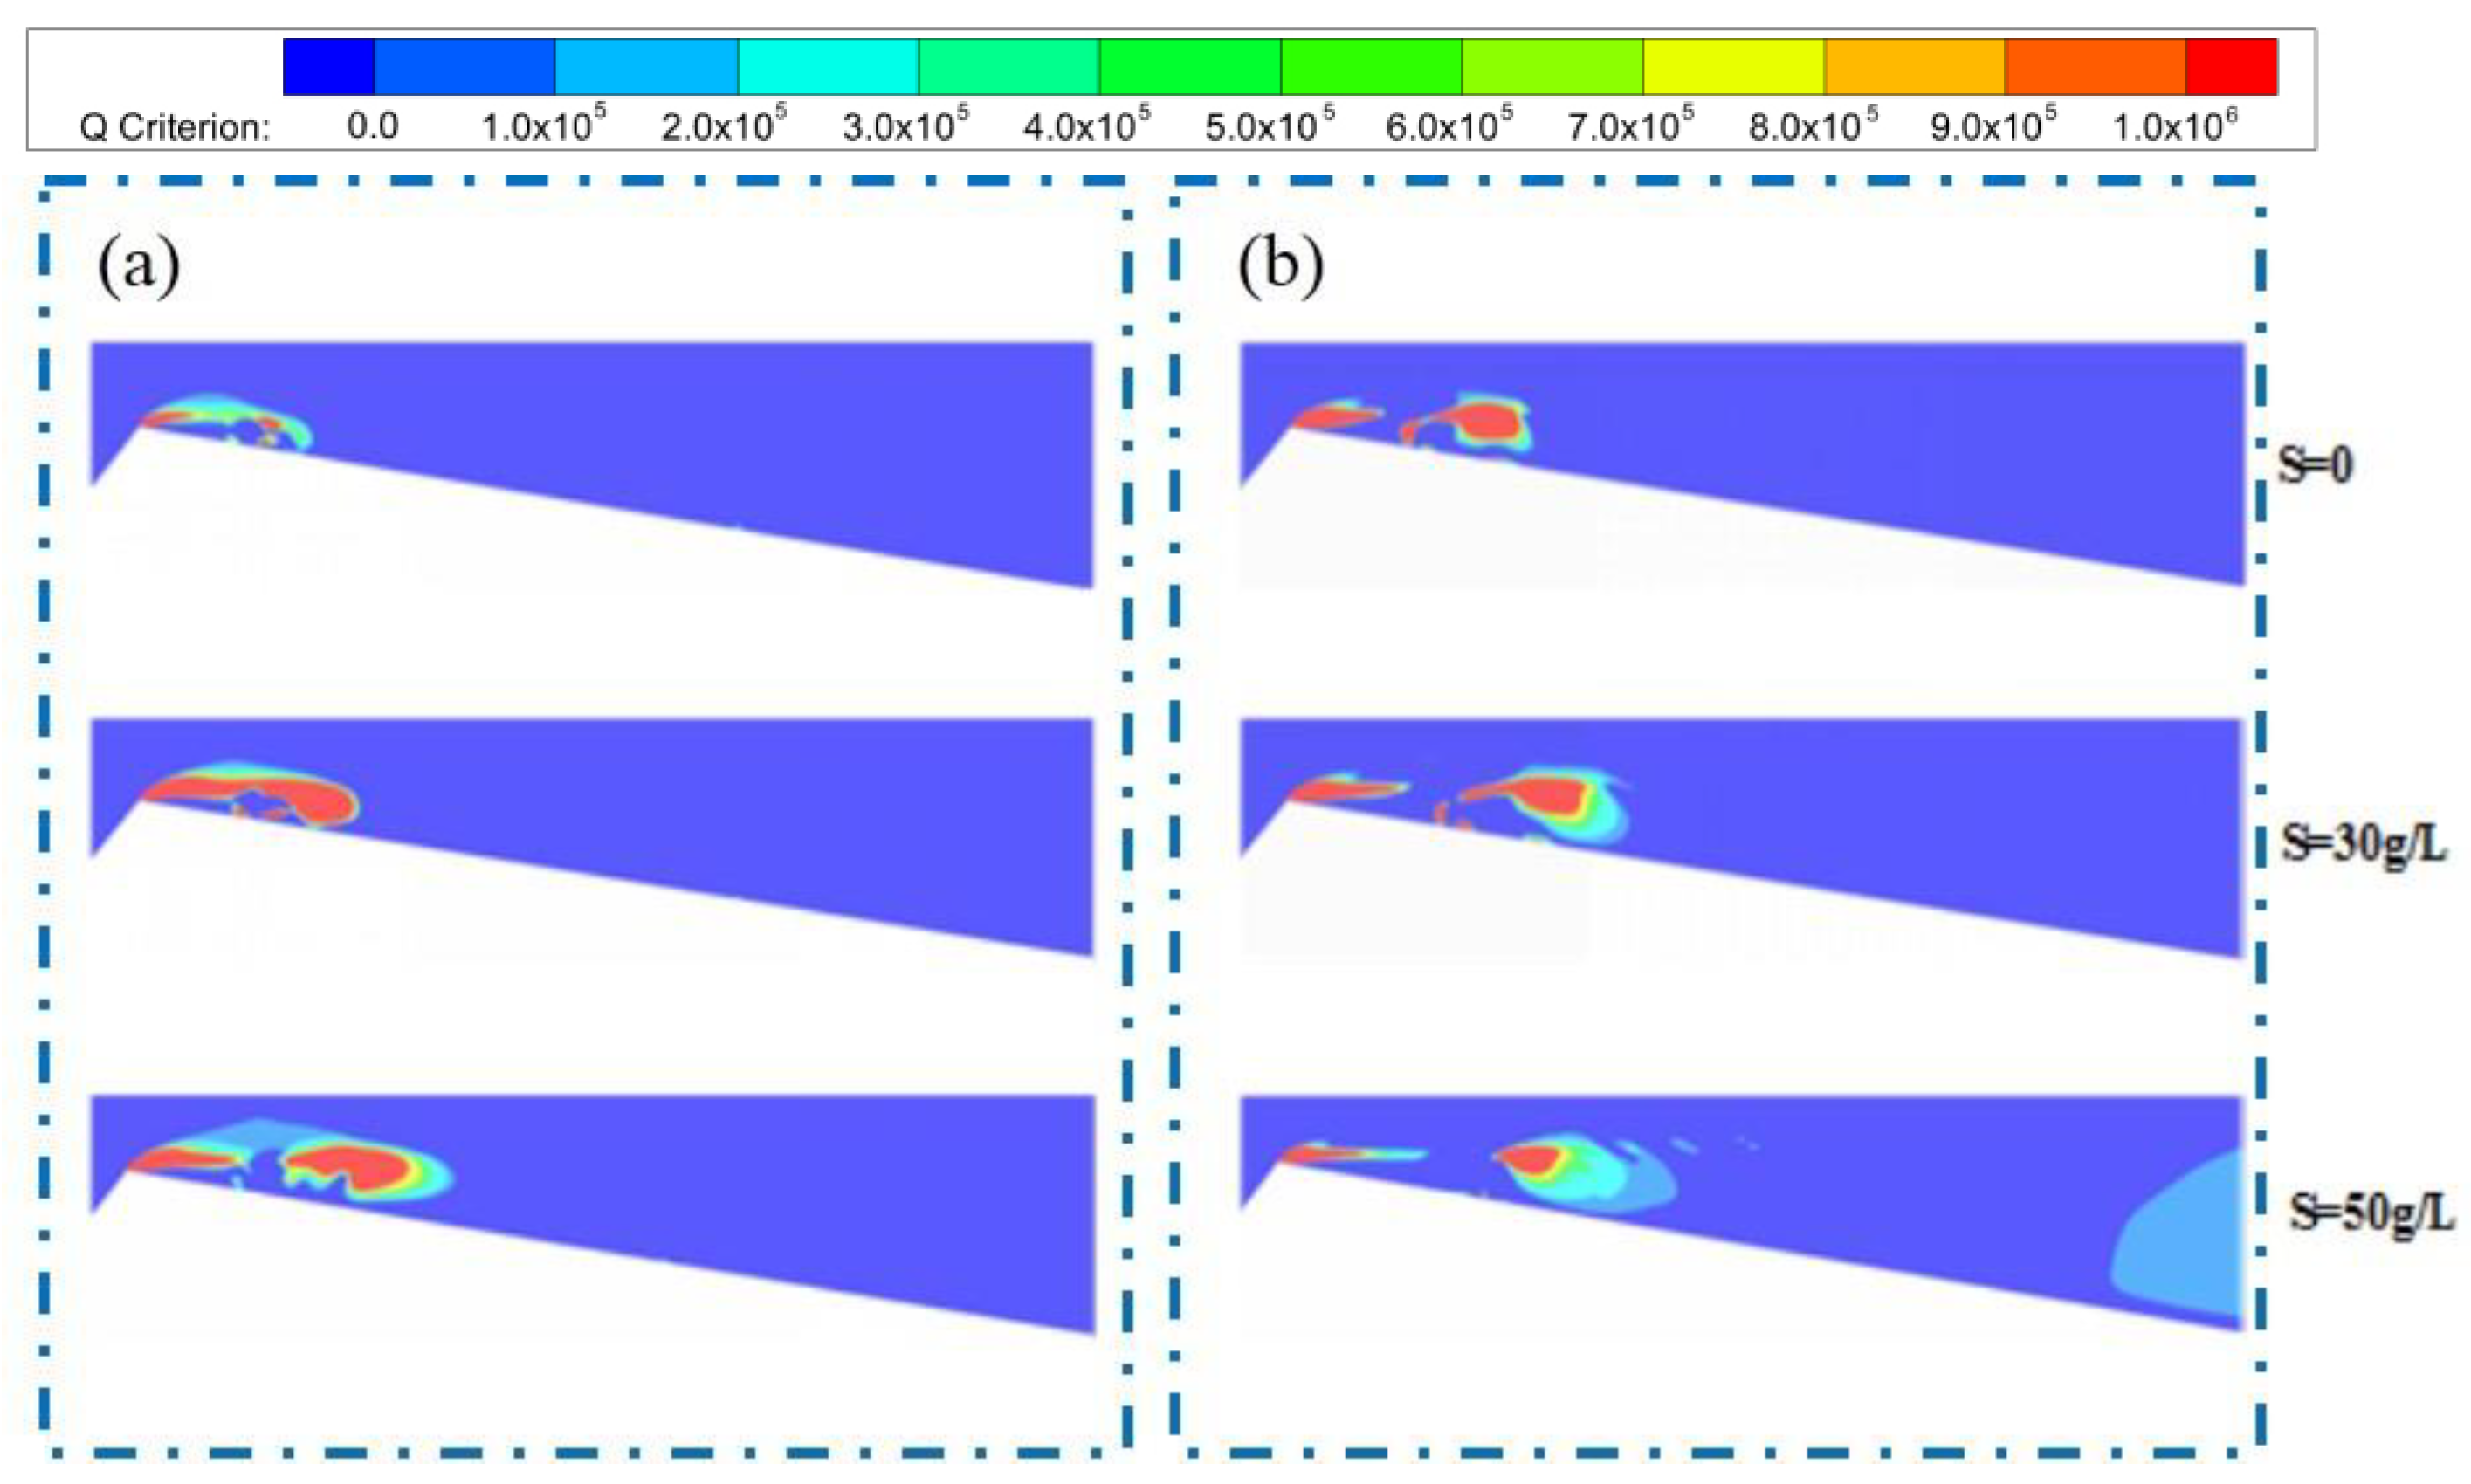
3.4.3. Vortex Distribution and Evolution
4. Conclusions
- The impact of the sediment concentration on the viscosity is more pronounced than that of the particle size. As the sediment concentration increases, the viscosity rises significantly, with this trend becoming more accentuated as the particle size decreases.
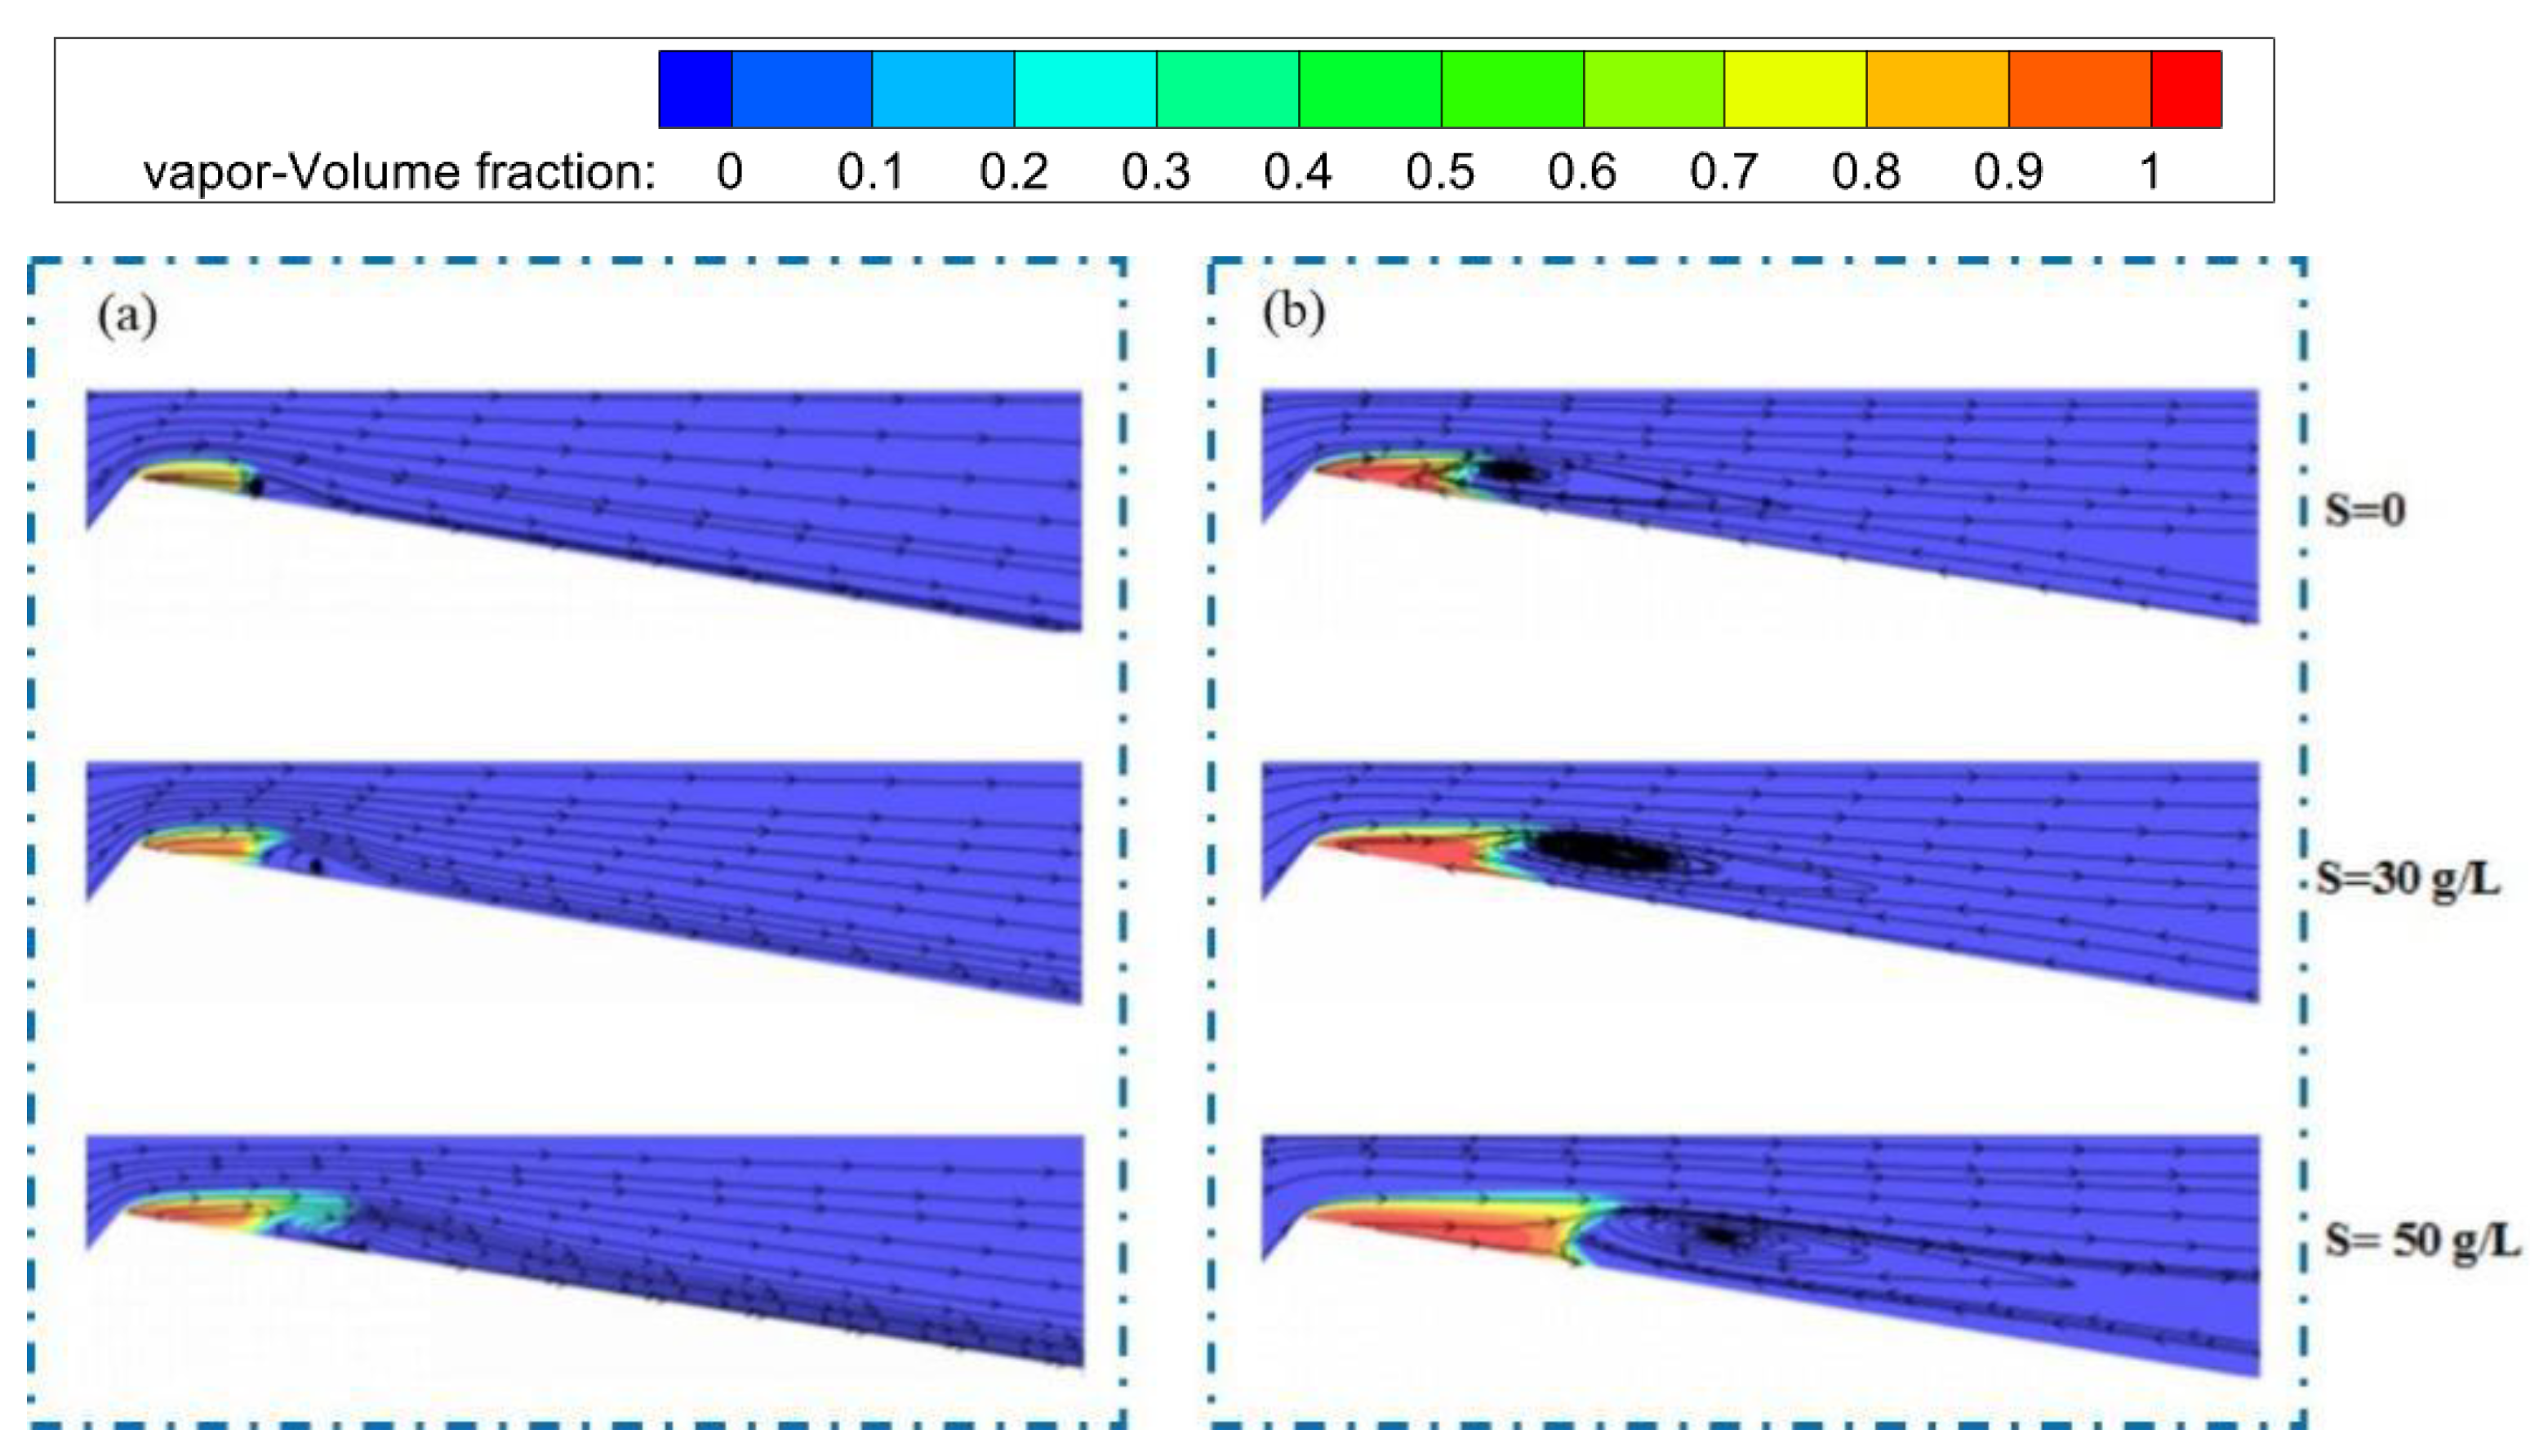
- The results of the experiment and numerical simulation show that an increase in the sediment concentration or a decrease in the sediment size leads to a shorter evolution cycle of the cavitation cloud and a higher frequency of cavitation cloud shedding, with the sediment concentration exerting a more substantial influence. The cavitation number decreases as well, with the sediment concentration having a more significant effect. When the concentration reaches 50 g/L, the cavitation number is less than 0.1. Therefore, attention should be paid to the cavitation generated when the sediment concentration is high during the operation of hydraulic machinery.
- The numerical analyses of the flow field of the cavitation in sediment-laden water reveal that the sediment expands the reflow region and enhances the re-entrant jet, thereby promoting cavitation cloud shedding due to the more pronounced shear effect. Additionally, the sediment contributes to a more complex vortex structure: on one hand, it enhances the interaction with smooth, sheet-like vortices attached to the wall, leading to increased vortex shedding; on the other hand, it consumes more energy during the vortex return, thus forming more small-scale vortices.
- When the sediment concentration increases, it can increase the viscosity of the sediment-laden water. On the one hand, it increases the pressure gradient, leading to the enhancement of the re-entrant jet and accelerating the shedding of the cavitation cloud. At the same time, the viscous resistance is strengthened, which expands the range of the cavitation zone. In engineering, the geometric shape of the runner blades of a turbine can be optimized to reduce the relative flow velocity of the fluid, thereby decreasing the pressure gradient and weakening the shear effect.
Author Contributions
Funding
Data Availability Statement
Conflicts of Interest
Abbreviations
| Symbol | Physical meaning |
| μ | dynamic viscosity |
| M | torque |
| S | sediment concentration |
| d | particle diameter |
| σ | cavitation number |
| Q | flow rate |
| L | cavitation cloud length |
| Lmax | maximum cavitation cloud length |
| Lc | L/Lmax |
| T | cavitation cycle |
| density of sediment-laden water | |
| water’s density | |
| sediment’s density | |
| density of phase p | |
| vapor’s density | |
| mixed density of sediment-laden water and vapor | |
| velocity of sediment-laden water | |
| water’s velocity | |
| sediment’s velocity | |
| velocity of phase p | |
| vapor’s velocity | |
| mixed velocity of sediment-laden water and vapor | |
| drift velocity | |
| water’s volume fraction | |
| sediment’s volume fraction | |
| volume fraction of sediment-laden water | |
| vapor’s volume fraction | |
| volume fraction of phase p | |
| dynamic viscosity of sediment-laden water | |
| dynamic viscosity of vapor | |
| mixed dynamic viscosity of sediment-laden water and vapor | |
| net mass transfer rate | |
| RB | bubble radius |
| evaporation coefficient | |
| condensation coefficient | |
| saturated vapor pressure |
References
- Noon, A.A.; Kim, M.-H. Sediment and Cavitation Erosion in Francis Turbines—Review of Latest Experimental and Numerical Techniques. Energies 2021, 14, 1516. [Google Scholar] [CrossRef]
- Jia, J.A. Technical Review of Hydro-Project Development in China. Engineering 2016, 2, 302–312. [Google Scholar] [CrossRef]
- Thapa, B.; Chaudhary, P.; Dahlhaug, O.G.; Upadhyay, P. Study of combined effect of sand erosion and cavitation in hydraulic turbines. In Proceedings of the International Conference on Small Hydropower (Hydro Sri Lanka: Fluid Dynamics), Kandy, Sri Lanka, 22–24 October 2007; pp. 22–24. [Google Scholar]
- Teran, L.A.; Rodriguez, S.A.; Laín, S.; Jung, S. Interaction of particles with a cavitation bubble near a solid wall. Phys. Fluids 2018, 30, 123304. [Google Scholar] [CrossRef]
- Kumar, P.; Saini, R. Study of cavitation in hydro turbines—A review. Renew. Sustain. Energy Rev. 2010, 14, 374–383. [Google Scholar] [CrossRef]
- Felix, D.; Albayrak, I.; Abgottspon, A.; Boes, R.M. Hydro-abrasive erosion of hydraulic turbines caused by sediment—A century of research and development. IOP Conf. Ser. Earth Environ. Sci. 2016, 49, 122001. [Google Scholar] [CrossRef]
- Sun, J.; Ge, X.F.; Zhou, Y.; Liu, D.M.; Liu, J.; Li, G.Y.; Zheng, Y. Research on synergistic erosion by cavitation and sediment: A review. Ultrason. Sonochemistry 2023, 95, 106399. [Google Scholar] [CrossRef]
- Karimi, A.; Martin, J.L. Cavitation erosion of materials. Int. Met. Rev. 1986, 31, 1–26. [Google Scholar] [CrossRef]
- Arora, M.; Ohl, C.D.; Lohse, D. Effect of nuclei concentration on cavitation cluster dynamics. J. Acoust. Soc. Am 2007, 121, 3432–3436. [Google Scholar] [CrossRef]
- Lian, J.; Gou, W.; Li, H.; Zhang, H. Effect of sediment size on damage caused by cavitation erosion and abrasive wear in sediment-water mixture. Wear 2018, 398–399, 201–208. [Google Scholar] [CrossRef]
- Raichenko, I.A.; Byakova, V.A. Theory of initial growth of a microcavity in a liquid metal around a gas-releasing particle. Part 1. Physical and mathematical models. Powder Metall. Met. Ceram. 2021, 40, 606–611. [Google Scholar] [CrossRef]
- Morch, K.A. Cavitation nuclei and bubble formation—A dynamic liquid-solid interface Problem. J. Fluids Eng. 2000, 122, 494–498. [Google Scholar] [CrossRef]
- Shen, Y.; Yasui, K.; Zhu, T.; Ashokkumar, M. A model for the effect of bulk liquid viscosity on cavitation bubble dynamics. Phys. Chem. Chem. Phys. 2017, 19, 20635–20640. [Google Scholar] [CrossRef] [PubMed]
- Liu, X.M.; He, J.; Lu, J.; Ni, X.W. Effect of liquid viscosity on a liquid jet produced by the collapse of a laser-induced bubble near a rigid boundary. Jpn. J. Appl. Phys. 2009, 48, 016504. [Google Scholar] [CrossRef]
- Wu, J.-H.; Gou, W.-J. Critical size effect of sand particles on cavitation damage. J. Hydrodyn. Ser. B 2013, 25, 165–166. [Google Scholar] [CrossRef]
- Chen, S.Y.; Xu, W.L.; Luo, J.; Li, J.B.; Zhai, Y.W. Experimental study on the mesoscale causes of the effect of sediment size and concentration on material cavitation erosion in sandy water. Wear 2021, 488, 204114. [Google Scholar] [CrossRef]
- Zhong, Y.; Minemura, K. Measurement of erosion due to particle impingement and numerical prediction of wear in pump casing. Wear 1996, 199, 36–44. [Google Scholar] [CrossRef]
- Wang, Y.; Wu, J.; Ma, F. Cavitation–silt erosion in sand suspensions. J. Mech. Sci. Technol. 2018, 32, 5697–5702. [Google Scholar] [CrossRef]
- Huang, S.; Ihara, A.; Watanabe, H.; Hashimoto, H. Effects of Solid Particle Properties on Cavitation Erosion in Solid-Water Mixtures. J. Fluids Eng. 1996, 118, 749–755. [Google Scholar] [CrossRef]
- Wang, J.; Chen, H.; Qin, L.; Li, Y.; Chen, D. Key roles of micro-particles in water on occurrence of cavitation-erosion of hydro-machinery. Chin. Sci. Bull. 2008, 53, 1603–1607. [Google Scholar] [CrossRef]
- Wang, L.; Zhu, R.; Chang, J. Effect of sand concentration in water on cavitation pressure in Qingtongxia and Bapanxia hydropower stations. J. Hydroelectr. Eng. 2008, 27, 44–47. [Google Scholar]
- Zhang, Y.; Qian, Z.; Ji, B.; Wu, Y. A review of microscopic interactions between cavitation bubbles and particles in silt-laden flow. Renew. Sustain. Energy Rev. 2016, 56, 303–818. [Google Scholar] [CrossRef]
- Chang, J. Cavitation and cavitation erosion of pump and turbine with silt-laden water as working medium. J. Drain. Irrig. Mach. Eng. 2010, 28, 93–99. [Google Scholar]
- Hu, H.X.; Zheng, Y.G. The effect of sand particle concentrations on the vibratory cavitation erosion. Wear 2017, 384–385, 95–105. [Google Scholar] [CrossRef]
- Xu, W.; Zhang, Y.; Luo, J.; Arong; Zhang, Q.; Zhai, Y. The impact of particles on the collapse characteristics of cavitation bubbles. Ocean. Eng. 2017, 131, 15–24. [Google Scholar] [CrossRef]
- Romero, R.; Teran, L.; Coronado, J.; Ladino, J.; Rodríguez, S. Synergy between cavitation and solid particle erosion in an ultrasonic tribometer. Wear 2019, 428–429, 395–403. [Google Scholar] [CrossRef]
- Yan, D.; Wang, J.; Liu, F. Inhibition of the ultrasonic microjet-pits on the carbon steel in the particles-water mixtures. AIP Adv. 2015, 5, 077159. [Google Scholar] [CrossRef]
- Bahadur, S.; Badruddin, R. Erodent particle characterization and the effect of particle size and shape on erosion. Wear 1990, 138, 189–208. [Google Scholar] [CrossRef]
- Levy, A.V.; Chik, P. The effects of erodent composition and shape on the erosion of steel. Wear 1983, 89, 151–162. [Google Scholar] [CrossRef]
- Chen, H.; Wang, J.; Chen, D. Cavitation damages on solid surfaces in suspensions containing spherical and irregular microparticles. Wear 2009, 266, 345–348. [Google Scholar] [CrossRef]
- Li, S.; Khoo, B.C.; Zhang, A.M.; Wang, S. Bubble-sphere interaction beneath a free surface. Ocean. Eng. 2018, 169, 469–483. [Google Scholar] [CrossRef]
- Li, S.; Zhang, A.M.; Han, R.; Liu, Y.Q. Experimental and numerical study on bubble sphere interaction near a rigid wall. Phys. Fluids 2017, 29, 092102. [Google Scholar] [CrossRef]
- Li, S.; Zhang, A.M.; Wang, S.; Han, R. Transient interaction between a particle and an attached bubble with an application to cavitation in silt-laden flow. Phys. Fluids 2018, 30, 082111. [Google Scholar] [CrossRef]
- Poulain, S.; Guenoun, G.; Gart, S.; Crowe, W.; Jung, S. Particle motion induced by bubble cavitation. Phys. Rev. Lett. 2015, 114, 214501. [Google Scholar] [CrossRef] [PubMed]
- Arora, M.; Ohl, C.D.; Morch, K.A. Cavitation inception on microparticles: A self-propelled particle accelerator. Phys. Rev. Lett. 2004, 92, 174501. [Google Scholar] [CrossRef]
- Borkent, B.M.; Arora, M.; Ohl, C.D.; De Jong, N. The acceleration of solid particles subjected to cavitation nucleation. J. Fluid Mech. 2008, 610, 157–182. [Google Scholar] [CrossRef]


| S (g/L) | 10 | 30 | 50 | |
|---|---|---|---|---|
| d (mm) | ||||
| 0.09 | 1.132 | 1.141 | 1.219 | |
| 0.07 | 1.134 | 1.153 | 1.275 | |
| 0.05 | 1.139 | 1.165 | 1.756 | |
| d (mm) | S (g/L) | Pthroat (Pa) | σ |
|---|---|---|---|
| 0.09 | 10 | 22,325 | 0.27 |
| 30 | 14,325 | 0.17 | |
| 50 | 8325 | 0.08 | |
| 0.07 | 10 | 19,325 | 0.24 |
| 30 | 11,825 | 0.14 | |
| 50 | 7325 | 0.07 | |
| 0.05 | 10 | 17,325 | 0.21 |
| 30 | 10,325 | 0.12 | |
| 50 | 6325 | 0.06 |
| Scheme | 1 | 2 | 3 | 4 | 5 |
|---|---|---|---|---|---|
| Grid number | 2,351,584 | 3,569,521 | 5,665,841 | 7,670,400 | 8,641,851 |
| S (g/L) | t | Experiment Lc | Numerical Simulation Lc | Error (%) |
|---|---|---|---|---|
| 50 | 0 | 0.36 | 0.39 | 8.33 |
| 50 | 1/6T | 0.59 | 0.56 | −5.08 |
| 50 | 2/6T | 0.87 | 0.98 | 12.64 |
| 50 | 4/6T | 0.65 | 0.43 | −12.31 |
| 50 | 5/6T | 0.41 | 0.36 | −12.20 |
| 30 | 0 | 0.35 | 0.28 | −8.57 |
| 30 | 1/6T | 0.67 | 0.58 | −13.43 |
| 30 | 2/6T | 0.83 | 0.80 | −3.61 |
| 30 | 4/6T | 0.77 | 0.75 | −2.60 |
| 30 | 5/6T | 0.34 | 0.32 | −5.88 |
Disclaimer/Publisher’s Note: The statements, opinions and data contained in all publications are solely those of the individual author(s) and contributor(s) and not of MDPI and/or the editor(s). MDPI and/or the editor(s) disclaim responsibility for any injury to people or property resulting from any ideas, methods, instructions or products referred to in the content. |
© 2025 by the authors. Licensee MDPI, Basel, Switzerland. This article is an open access article distributed under the terms and conditions of the Creative Commons Attribution (CC BY) license (https://creativecommons.org/licenses/by/4.0/).
Share and Cite
Yang, Z.; Yu, G.; Zhao, Q. Experimental Study and Numerical Simulation of Sediment’s Promoting Effect on Cavitation Based on Flow Field Analysis. Processes 2025, 13, 1299. https://doi.org/10.3390/pr13051299
Yang Z, Yu G, Zhao Q. Experimental Study and Numerical Simulation of Sediment’s Promoting Effect on Cavitation Based on Flow Field Analysis. Processes. 2025; 13(5):1299. https://doi.org/10.3390/pr13051299
Chicago/Turabian StyleYang, Zeyuan, Gang Yu, and Qin Zhao. 2025. "Experimental Study and Numerical Simulation of Sediment’s Promoting Effect on Cavitation Based on Flow Field Analysis" Processes 13, no. 5: 1299. https://doi.org/10.3390/pr13051299
APA StyleYang, Z., Yu, G., & Zhao, Q. (2025). Experimental Study and Numerical Simulation of Sediment’s Promoting Effect on Cavitation Based on Flow Field Analysis. Processes, 13(5), 1299. https://doi.org/10.3390/pr13051299