Article

A CFD Study of Thermodynamics and Efficiency Metrics in a Hydrogen-Fueled Micro Planar Combustor Housing Dual Heat-Recirculating Cylindrical Combustors for MTPV Applications

Department of Mechanical Engineering, College of Engineering, King Faisal University, Al-Ahsa 31982, Saudi Arabia
Processes 2025, 13(4), 1142; https://doi.org/10.3390/pr13041142
Submission received: 15 March 2025 / Revised: 5 April 2025 / Accepted: 8 April 2025 / Published: 10 April 2025
(This article belongs to the Special Issue CFD Applications in Renewable Energy Systems)

Abstract

:
The micro combustor is the energy source of micro-thermophotovoltaic systems; thus, optimizing its design is one of the key parameters that lead to an increase in output energy. Therefore, to enhance the system’s overall efficiency, this numerical work introduces a new design configuration for parallel-flow (PF) and counter-flow (CF) hydrogen-fueled micro cylindrical combustors integrated into a micro planar combustor. To overcome the short residence time in micro combustor applications causing high heat dissipation, the micro cylindrical combustors house heat-recirculating channels to allow more heat to transfer to the external walls. In pursuit of this target, simulations are carried out to analyze the thermodynamic and system efficiency parameters. In addition, different initial operating conditions are varied to optimize the system, including inlet velocity and equivalence ratio. The results reveal that the PF and CF structures result in significantly higher wall temperatures and more uniform wall temperature variations than the conventional design (CD). Despite the high entropy generations, the exhaust gas temperatures of the PF and CF are 591 K and 580 K lower than the CD, respectively, and both the PF and CF result in 14% increases in radiation efficiency. Increasing the inlet velocity improves the key thermal parameters in the new designs; however, the system efficiency experiences a drastic reduction. The power output density highlights the unity equivalence ratio as optimal. The PF and CF designs yield roughly identical findings, but the CF exhibits more uniform wall temperatures in most cases due to the equal thermal energy from opposite sides.

1. Introduction

Recently, micro-electro-mechanical systems have been advanced tremendously due to the technological revolution empowering high-performance applications in various domains, such as biomedicine [1], wireless communications [2], micro aircraft [3], and hydrogen production [4]. The importance of developing micro- or even nano-technologies lies in their long service lives, small sizes, easy integration, and high energy outputs [5,6]. The combustion-based micro power generation systems, particularly micro-thermophotovoltaic (MTPV), have become an active research field as they feature low harmful emissions, static design, and easy maintenance [7,8]. In addition, the components of MTPV technology are amongst its focal advantages, as it consists of a micro combustor, the filter, and the photovoltaic cell [9]. In MTPV systems, the thermal energy released by the combustion of a gaseous fuel in the micro combustor is radiated to photovoltaic cells to generate electricity [10]. The reliability, stability, and efficiency of MTPV technology rely on the micro combustor’s output power density, as the latter is the energy source for the former. At a fixed energy input, the key variables that determine the micro combustor’s energy output are the wall temperature and the uniformity thereof. The former determines the amount of energy radiated from the micro combustor to the PV cells, whereas the latter ensures the uniformity of radiation energy with respect to the area of the external walls. Several parameters restrict the heat transfer capacity and system efficiency of micro combustors, including the high ratio of surface area-to-volume, extensive energy dissipation, and short dwell time [11,12].
To address these challenges, scholars have proposed different methods of boosting the energy conversion efficiency of micro combustors, such as employing catalysts [13,14], bluff bodies [15,16] and porous media [17,18]. Moreover, the addition of hydrogen has demonstrated great potential for improving the heat transfer mechanisms of combustion-based applications [19,20] owing to its high flame speed, high diffusion coefficient, and high energy content [20,21]. For instance, Zhao et al. [20] investigated the potential impacts of hydrogen additions on the thermal and efficiency parameters in an ammonia-fueled micro planar combustor featuring a heat recirculating structure. It was found that enriching the ammonia–air mixture with hydrogen causes the mean wall temperature and exergy efficiency to significantly increase, while the heat dissipation resulting from the total entropy generation is decreased from 46.58 W to 36.24 W for the mass blended hydrogen ratio of 0.4 and 0.7, respectively. Similar findings were reported in [22], highlighting that the high hydrogen substitution intensifies the combustion process, leading to further improvements in the exergy and radiation efficiencies. Nieto-Londoño et al. [23] studied the effects of a hydrogen-enriched methane–air mixture in millimeter-scale reactors on flame dynamics and stabilization. The results reveal that using more hydrogen leads to more intense combustion and a reduction in CO2 emissions, due to the high reactivity coefficient of hydrogen and the fact that it contains zero carbon atoms in its chemical formula, respectively. As hydrogen has proven to be more than 300 times as efficient as batteries [22], the utilization of a green alternative fuel like hydrogen advances the energy and technology sectors in the transition toward dependency on renewable energy sources to achieve sustainability and decarbonization.
Maximizing the benefits of hydrogen in microscale systems requires certain factors to be taken into account to accommodate the high flame propagation of hydrogen and the compact dimensions of the micro devices. Thus, many new design configurations for micro combustors have been proposed in the literature. For example, Dai et al. [24] conducted a numerical investigation on the effects of a multi-baffle structure inserted into a hydrogen-fueled micro planar combustor on energy conversion efficiency. The authors reported that incorporating multi-baffles improves outer wall temperature and wall temperature uniformity, leading to enhanced total energy outputs, particularly when the multi-baffles are placed in the center of the geometry. Li et al. [25] examined the performance of a micro cylindrical combustor featuring center-cleared twisted tapes powered by hydrogen. The outcomes reveal that the new design promotes turbulence, lowers the resistance of flow, and increases the surface area, resulting in improved heat transfer coefficients and, accordingly, key thermal parameters. Cai et al. [22] investigated the system efficiency of a hydrogen–ammonia-fueled micro cylindrical combustor featuring periodic wall structures. They highlighted that wall periodicity leads the external walls to absorb more heat and, consequently, increases the radiation efficiency and mean wall temperature. Zhang et al. [26] examined the non-premixed combustion behavior and exergy of a hydrogen-fueled micro combustor with a vase-shaped configuration and tangential inlet. It was found that the tangential inlet improves the mixing process, whereas the vase shape leads to highly increased exergy efficiency and extends the blow-out limit. Sheykhbaglou et al. [27] studied the key thermal parameters of an ammonia–hydrogen-fueled micro combustor employing a novel bluff-body and swirl-stabilized structure. As highlighted by the authors, the bluff-body with a hemisphere-shaped configuration results in a 44% radiation efficiency. Furthermore, the vane angle, ranging between 15 and 60 degrees, decreases the NOx emissions and increases the mean wall temperature, the level of wall temperature uniformity, and radiation efficiencies.
In addition to the outlined studies, researchers have reported that separating the high-temperature flame in a micro planar combustor is an effective means of improving thermal flow dynamics and system efficiency. Tang et al. [28] performed a numerical investigation of the effects of inserting parallel separating plates into a micro planar combustor on the heat transfer process. They outlined that, compared to the conventional design, the separation of the hot-gas flow is conducive to promoting the coefficient of heat transfer by ~141 W/(m2∙K), which consequently improves the mean temperature over the external walls by more than 100 K. Su et al. [29] studied the key thermal parameters of a multiple-channel micro planar combustor. The findings demonstrate that employing several flow paths results in improvements in the mean wall temperature, radiation energy, and radiation efficiency by 38.9 K, 6.17 W, and 2.17%, respectively, in comparison to the single-channel configuration.
These investigations brought to attention above, along with others in the literature, have highlighted the importance of optimizing the design configuration of the micro combustor and separating the flow in enhancing the heat transfer from the combustion to the external walls. Additionally, with the same volume of the combustion chamber and cross-sectional area, it has been noted that the micro planar combustor radiates more thermal energy than the cylindrical shape [30], making it the favorite geometry for MTPV systems. Consequently, there remains significant room for improvement in such applications in terms of developing highly efficient systems in the energy sector. Thus, as improving the micro combustor structure, partitioning the inlet stream channel, and utilizing a planar shape for micro combustors promote radiation efficiency and output power density, this paper introduces a micro planar combustor with parallel-flow (PF) and counter-flow (CF) heat-recirculating micro cylindrical combustors built in, without altering their external lengths and widths. In a previous work [31], a novel structure for a hydrogen-fueled micro cylindrical combustor with a single-path inlet and double-path outlet featuring a heat-recirculating configuration was proposed. The results reveal that, compared to the traditional design, the new design lowers the exhaust gas temperature by 171.6 K, and improves the mean wall temperature, exergy efficiency, and radiation efficiency by 63.4 K, 4.31%, and 9.92%, respectively. For this, the current numerical work aims to demonstrate the effects of a micro planar combustor housing dual micro cylindrical combustor geometries, as proposed in [31], on the thermal and efficiency variables. Section 2 describes the dimensions of the proposed design configuration, simulation modeling approaches, initial and boundary conditions, the mesh independence test, and the validation process. Section 3 compares the new geometric structure to the conventional design with respect to the thermodynamic parameters and system efficiency, and discusses the effects of varying the inlet velocity and equivalence ratio. Section 4 highlights an overview of the core outcomes of the numerical investigation.

2. Materials and Methods

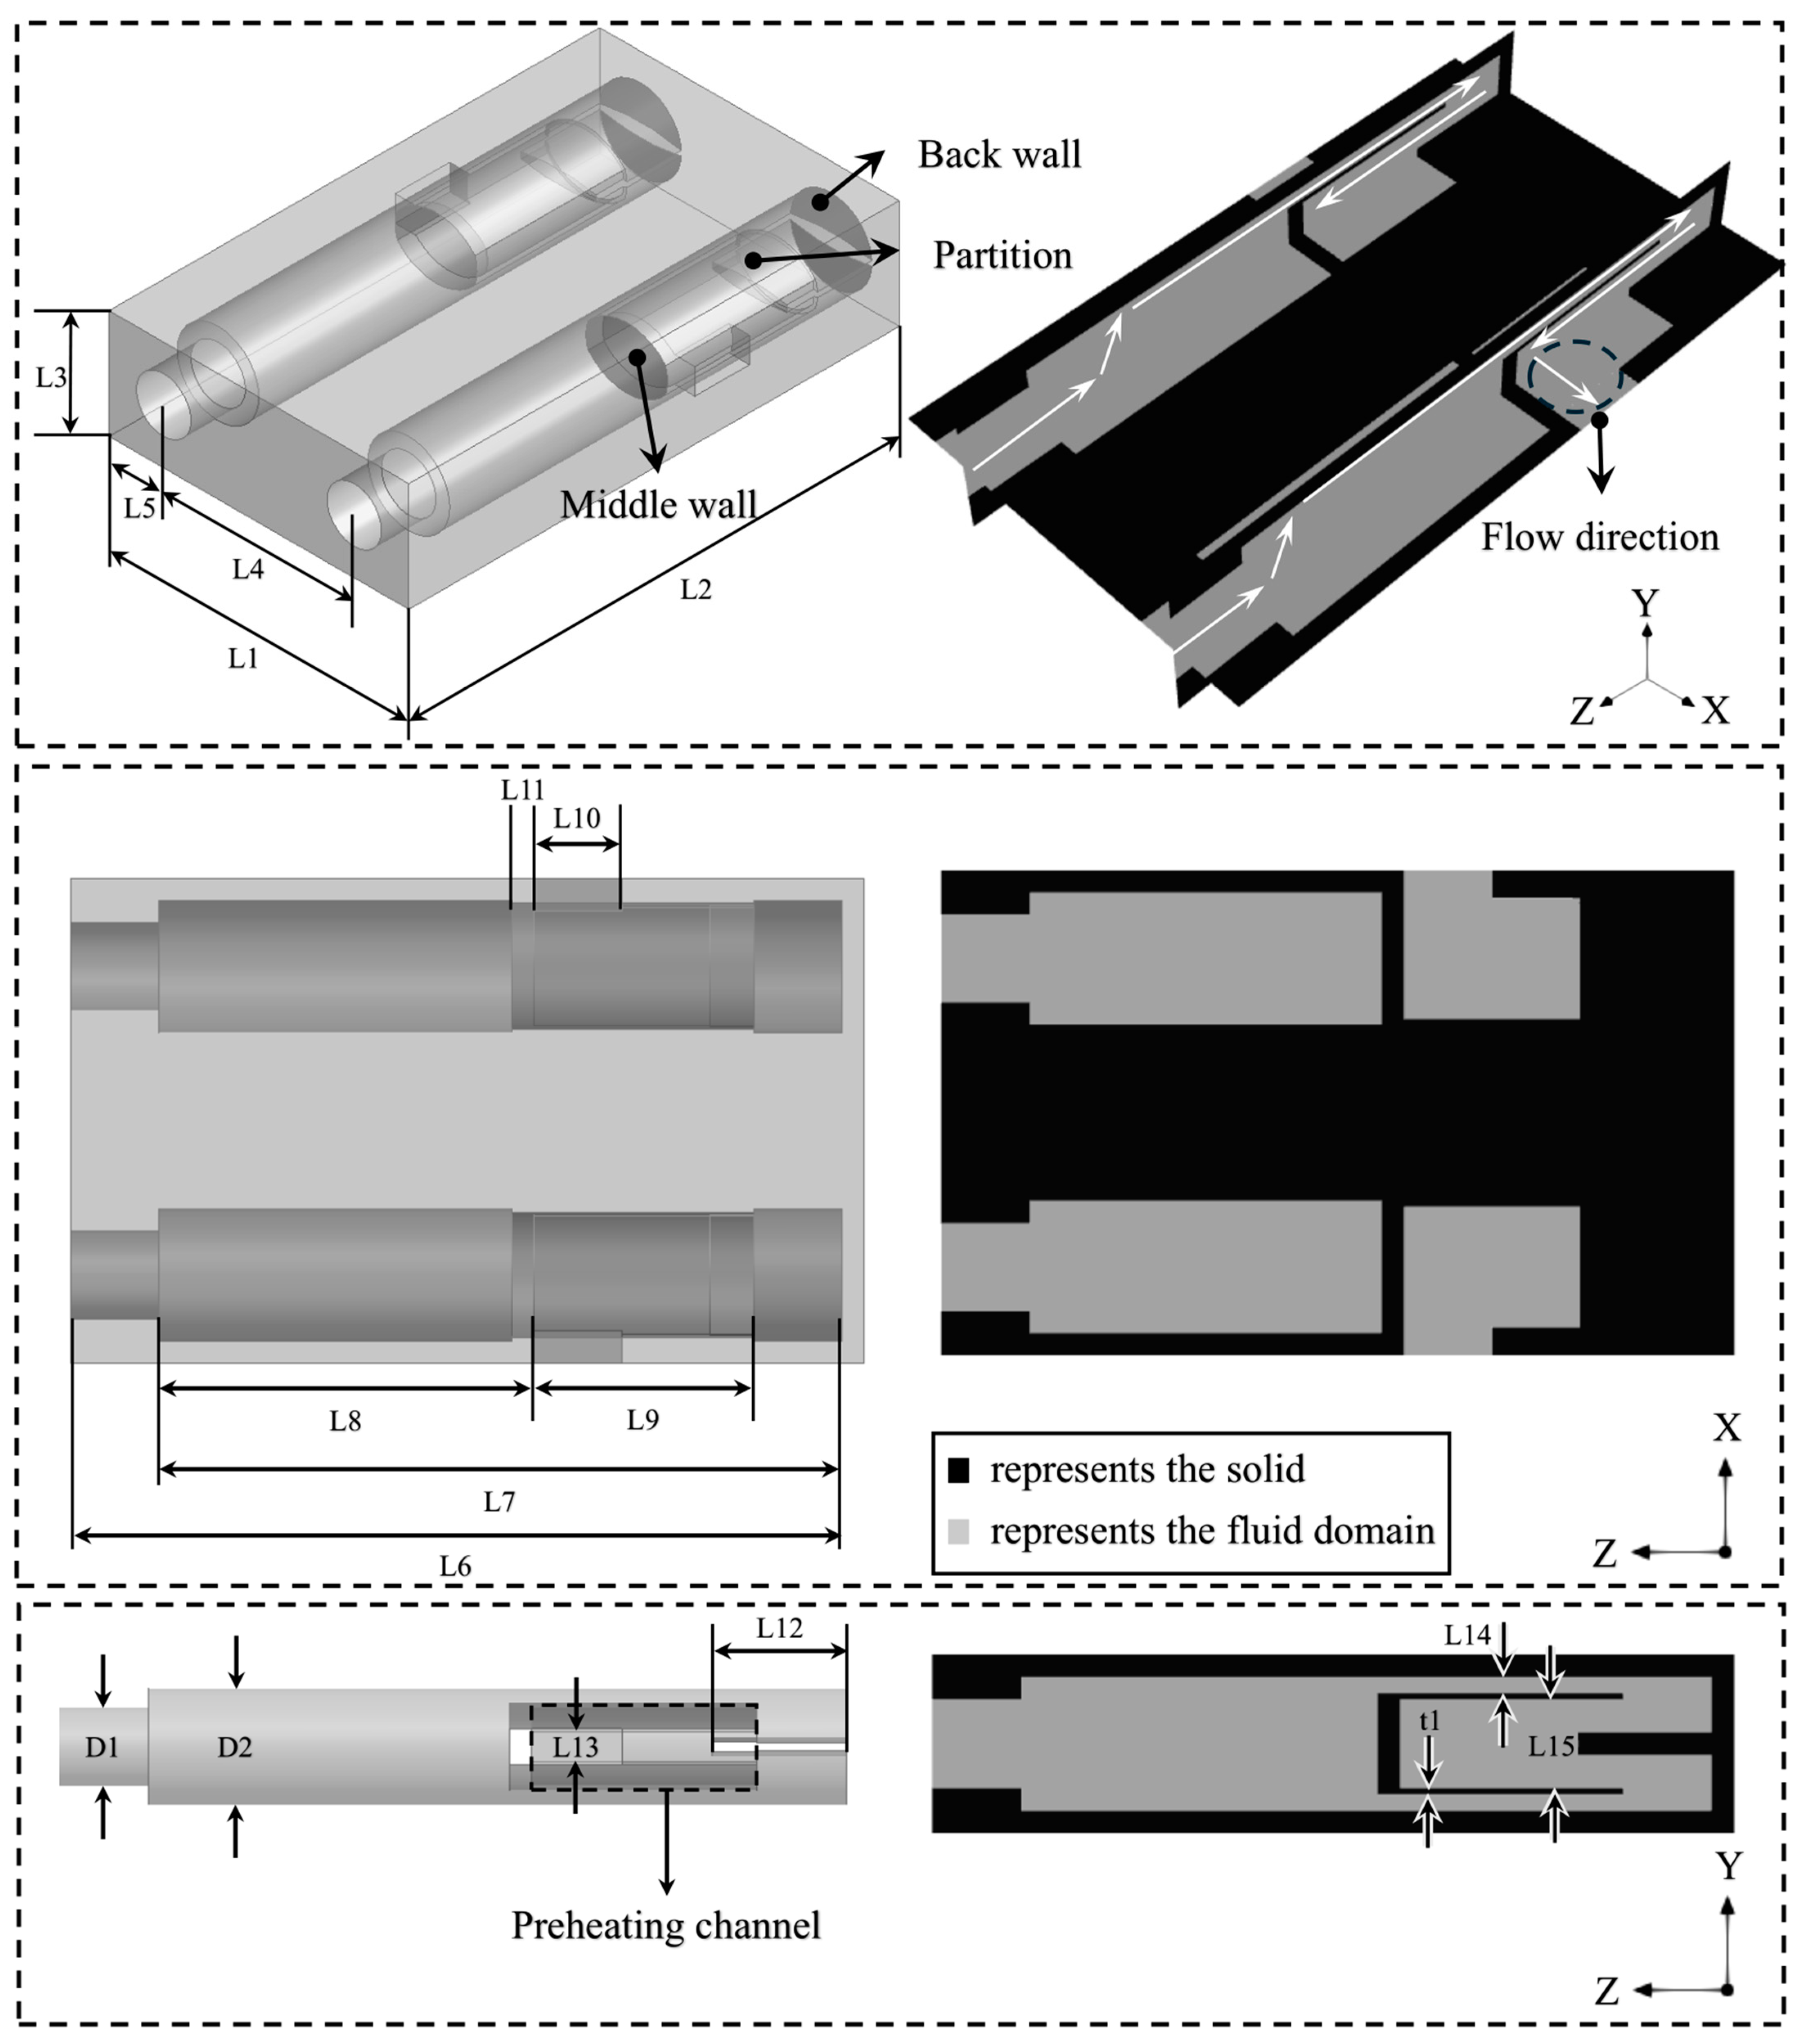
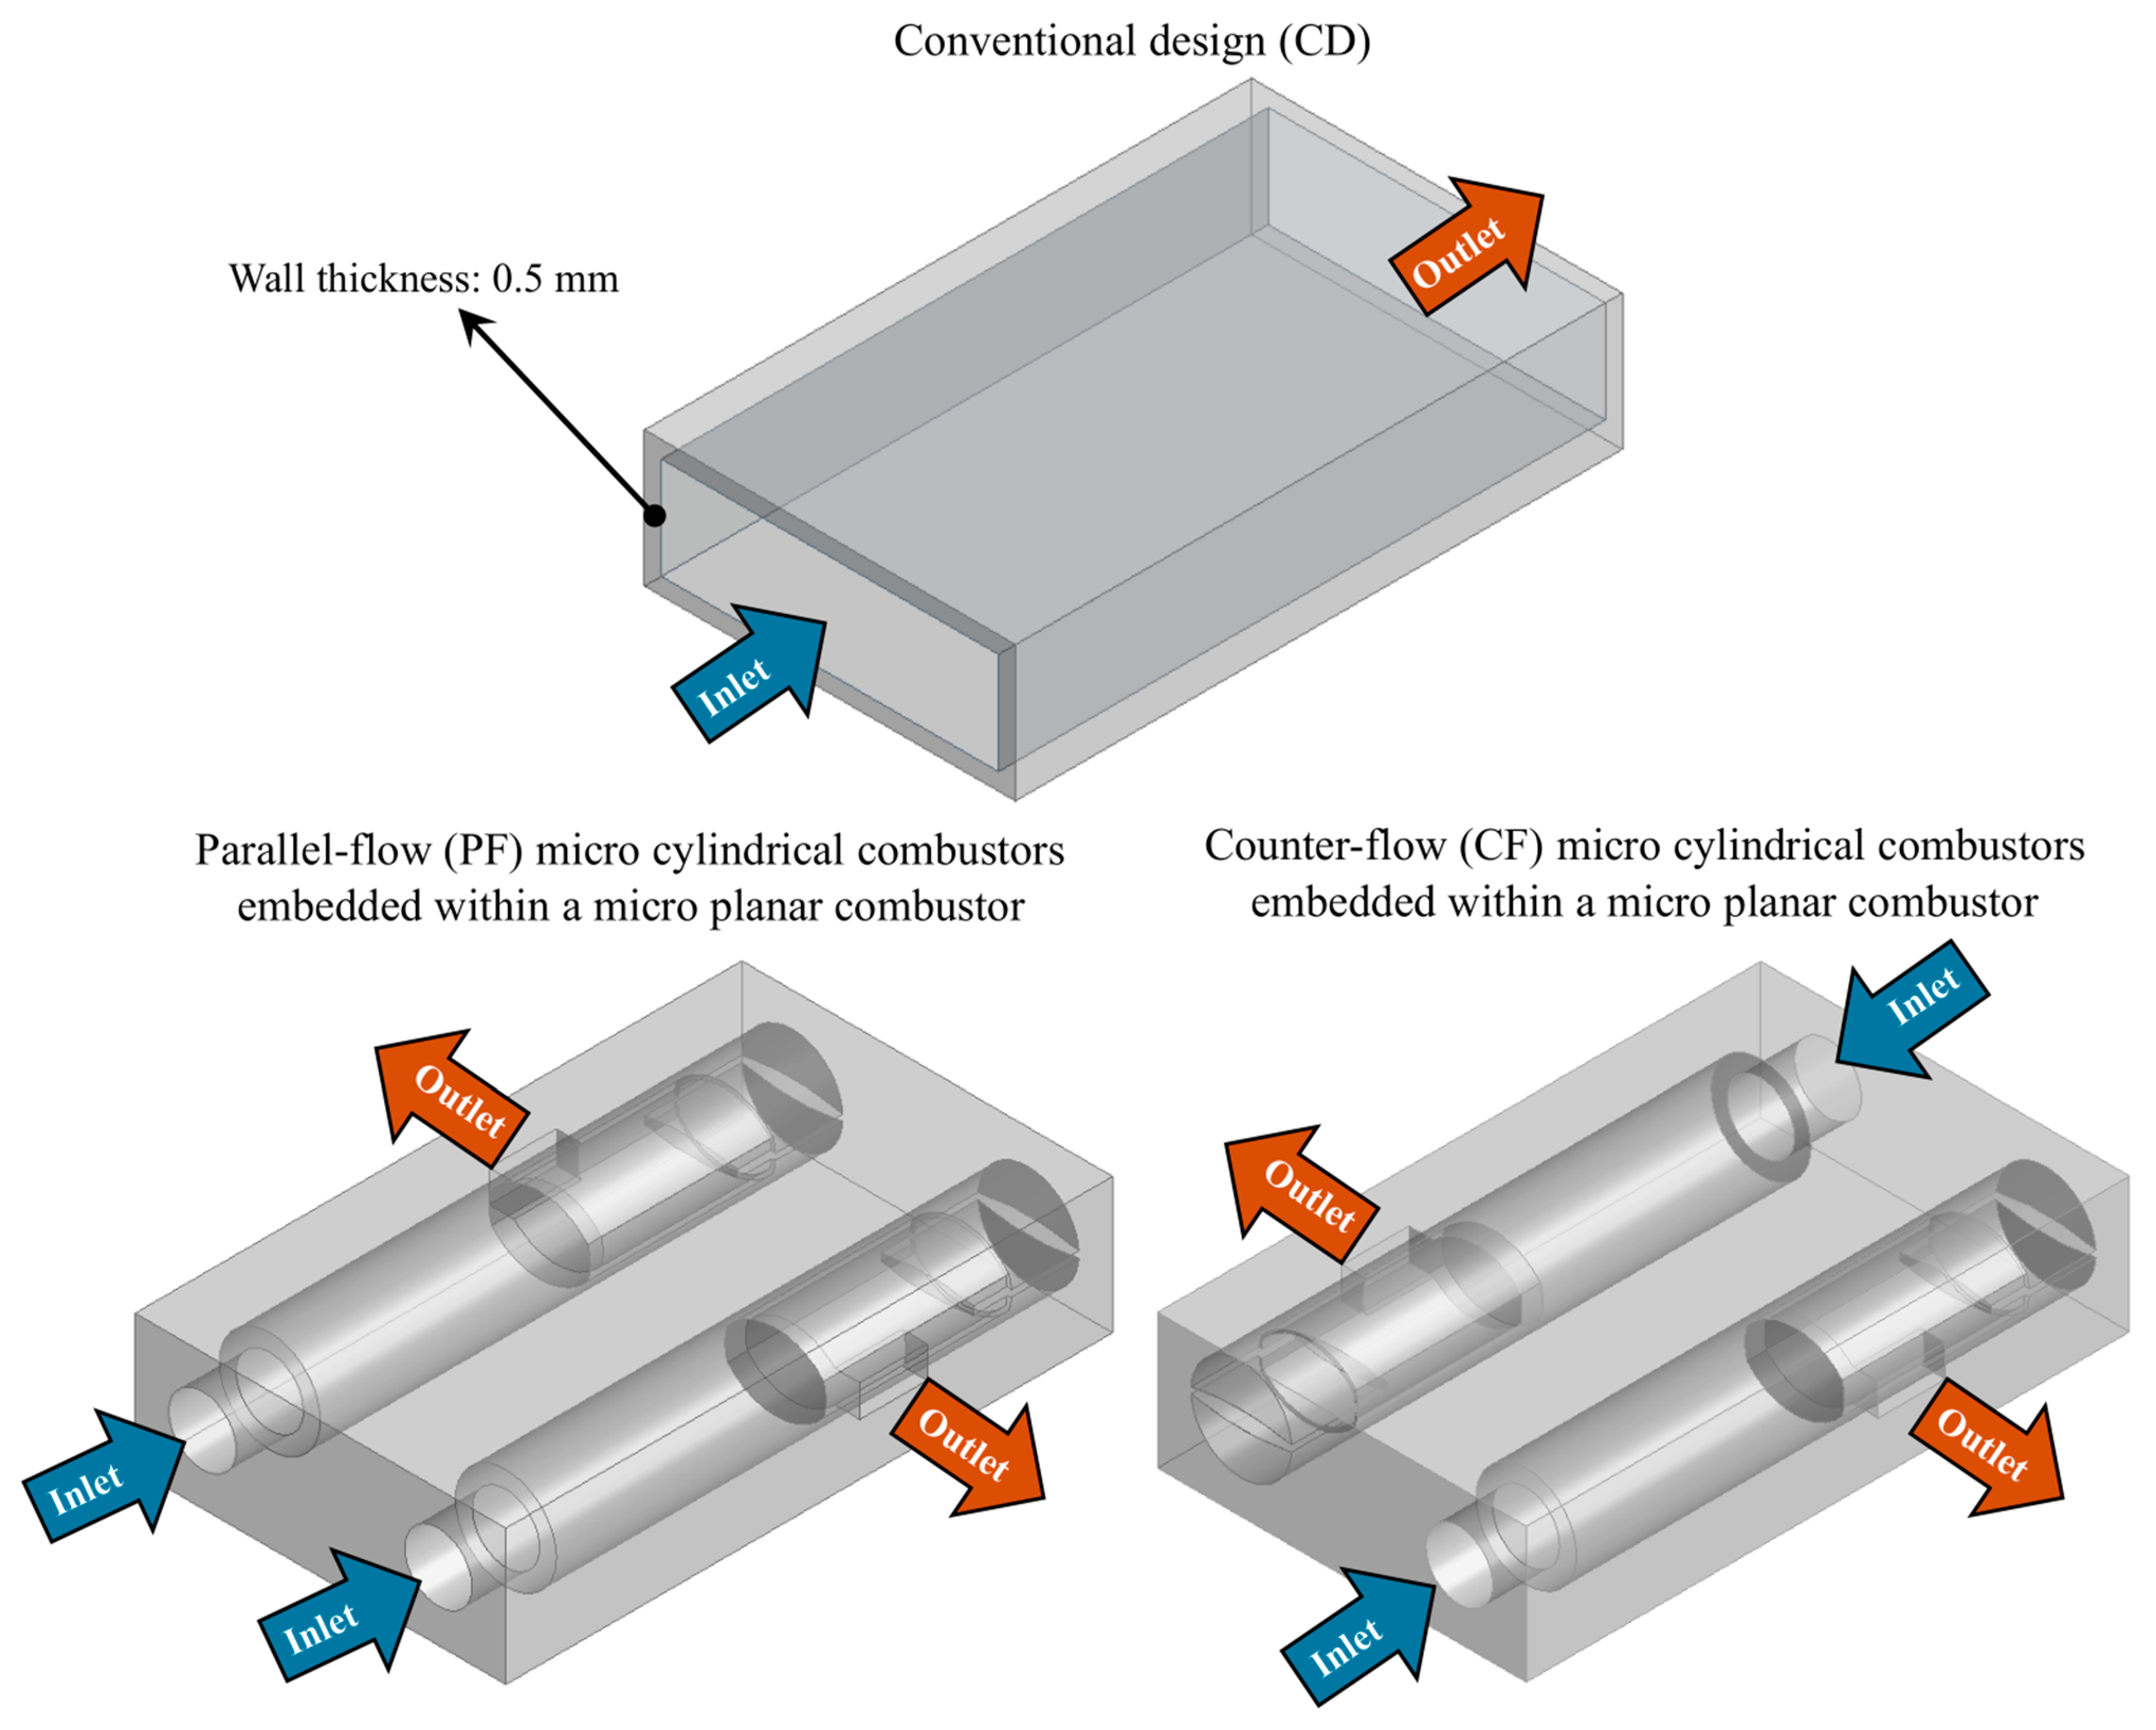
2.1. Geometric Model

Figure 1 illustrates the newly proposed configuration of a micro planar combustor with two micro cylindrical combustors embedded inside, which was constructed using ANSYS Design Modeler R2 2023. The dimensions of geometry are listed in Table 1.
In contrast to the previous investigation [31], a slight modification is here made to the micro cylindrical combustor—one outlet is eliminated due to the different widths between the micro planar and cylindrical combustors. In each micro cylindrical combustor, Figure 1 illustrates that the new design consists of one inlet and one outlet channel, a middle wall, a back wall, a heat-recirculating room, and a partition. Inserting a middle wall is important for holding the high-temperature flame, allowing more heat to transfer to the external walls. The back wall also reverses the hot gases toward the preheating structure, which increases the residence time of the flow and preheats the inlet mixture flowing from the inlets. To avoid the backflow phenomenon, a partition is employed to force the heat-containing streams to flow into the preheating channels. It is noteworthy that this investigation aims to assess how the PF and CF directions affect the thermal fluid dynamics and performance parameters. The layout of the outlined configurations is shown in Figure 2 along with the conventional design.

2.2. Govering Equations

AMSYS Fluent R2 2023 [32] software was used to solve the conservation equations for the numerical investigations. These equations are mass, momentum, energy and 1-N species, where N donates the total number of species in the chemically reacting mixture, for which the transport equations read as follows.
Mass:
· ( ρ v ) = 0
Momentum:
ρ v · v = P + · ( τ τ )
where
τ = μ [ v + ( v ) T 2 3 v Ι ]
Energy:
· ( v ( ρ E + p ) ) = · ( k e f f T j h j J j + ( τ · v ) ) + S h
Species:
· ( ρ v Y i + J i ) = R i
where ρ denotes the density, μ the molecular viscosity, P the static pressure, S h the enthalpy source term of the fluid, v the velocity vector, R i the reaction net rate of production of species i , τ the Reynolds stress, J i the diffusion flux of species i , τ the viscous stress, Y i the local mass fraction of species i , Ι the unit tensor, J j the diffusion flux of species j , T the temperature, k e f f the effective conductivity, h j the enthalpy of species j , and E the total energy of the fluid.
The gravity, surface reaction, and Dufour effect were not incorporated in the current steady-state numerical work due to their negligible effects [20,33,34]. Moreover, the Mach number is low, implying that the flow is incompressible. However, the Reynolds number of non-reacting flow calculations exceeds 500 [35]; thus, the turbulent modeling approach, namely, the Realizable k - ϵ model [36], is utilized to compute the effects of turbulence on combustion.

2.3. Numerical Setup and Boundary Conditions

The turbulence–chemistry interaction is computed using the eddy dissipation concept (EDC) [37,38,39] to incorporate the chemical mechanism of hydrogen combustion, which consists of 9 species and 19 chemical reactions, as listed in Table 2 [40]. The coupling between pressure and velocity is performed by means of the SIMPLE algorithm approach. The second-order upwind scheme is implemented to spatially discretize the transport equations. All residuals undergo a convergence criterion of 10−6. A temperature of 300 K is set for the initial inlet temperature of the premixed mixture. In addition, this work applies velocity inlet and pressure outlet boundary conditions with a turbulent intensity of 5% and a hydraulic diameter of 4 mm at the specified boundary conditions. Zero and no-slip boundary conditions are used for diffusive flux species and interior surfaces, respectively. It is important to mention that the area-weighted average method is applied to evaluate the parameters in this study.
The calculation of the total heat loss ( Q ) through the outer walls reads as follows [41,42]:
Q = Q c o n + Q r a d   h   A c ( T w T ) + ε σ A c ( T w 4 T 4 )
The evaluation of the pressure drop ( P d r o p   ) resulting from the friction and heating effects reads as [43]
P l o s s   = P i n   P o u t  
The Peclet number (Pe), which measures the relative importance of advection to diffusion effects [44,45], is computed as
P e = ρ V d h C p λ
The diffusion ( S g e n d i f f u s s i o n ) , conduction ( S g e n c o n d u c t i o n ) , chemical ( S g e n c h e m i c a l ) and total ( S g e n t o t a l ) entropy generations [46,47] are evaluated as follows:
S gen diffussion = i n ( ρ R D i ) ω i χ i χ i
S g e n c h e m i c a l = i n 1 T μ i γ i
where
μ i = h ¯ i o ( T ) T s ¯ i o ( T ) + R T l n ( χ i P P a t m )
S g e n c o n d u c t i o n = 1 T 2 k m i x ( T ) 2
S g e n t o t a l = V S g e n d i f f u s s i o n d V + V S g e n c h e m i c a l d V + V S g e n c o n d u c t i o n d V
The second law of thermodynamics concept [48,49,50] is applied to account for exergy efficiency. This investigation calculates inlet exergy ( E x i n ) and total exergy losses ( E x e g ) as follows:
E x i n = m ˙ f u e l   × Q L H V  
and
E x e g = E x l o s s + m ˙ i n l e t   × T × c p , o u t l e t × ln T T e g
The uncounted exergy destruction ( E x d e s ) is computed as follows:
E x d e s = E x i n E x e g
The exergy efficiency ( η e x e r g y ) is calculated as
η e x e r g y = ( 1 E x d e s E x i n ) × 100 %
The radiation efficiency ( η r a d i a t i o n ) is evaluated as
η r a d i a t i o n = ( Q r a d m ˙ f u e l   × Q L H V   ) × 100 %
With respect to the area-weighted mean technique ( T m w ) , the wall temperature is evaluated as [51]
T m w = i = 1 n T i A i i = 1 n A i
The uniformity of wall temperature ( R T ) is computed as
R T = ( i = 1 n [ | T i T m w | A i ] T m w i = 1 n A i ) × 100 %

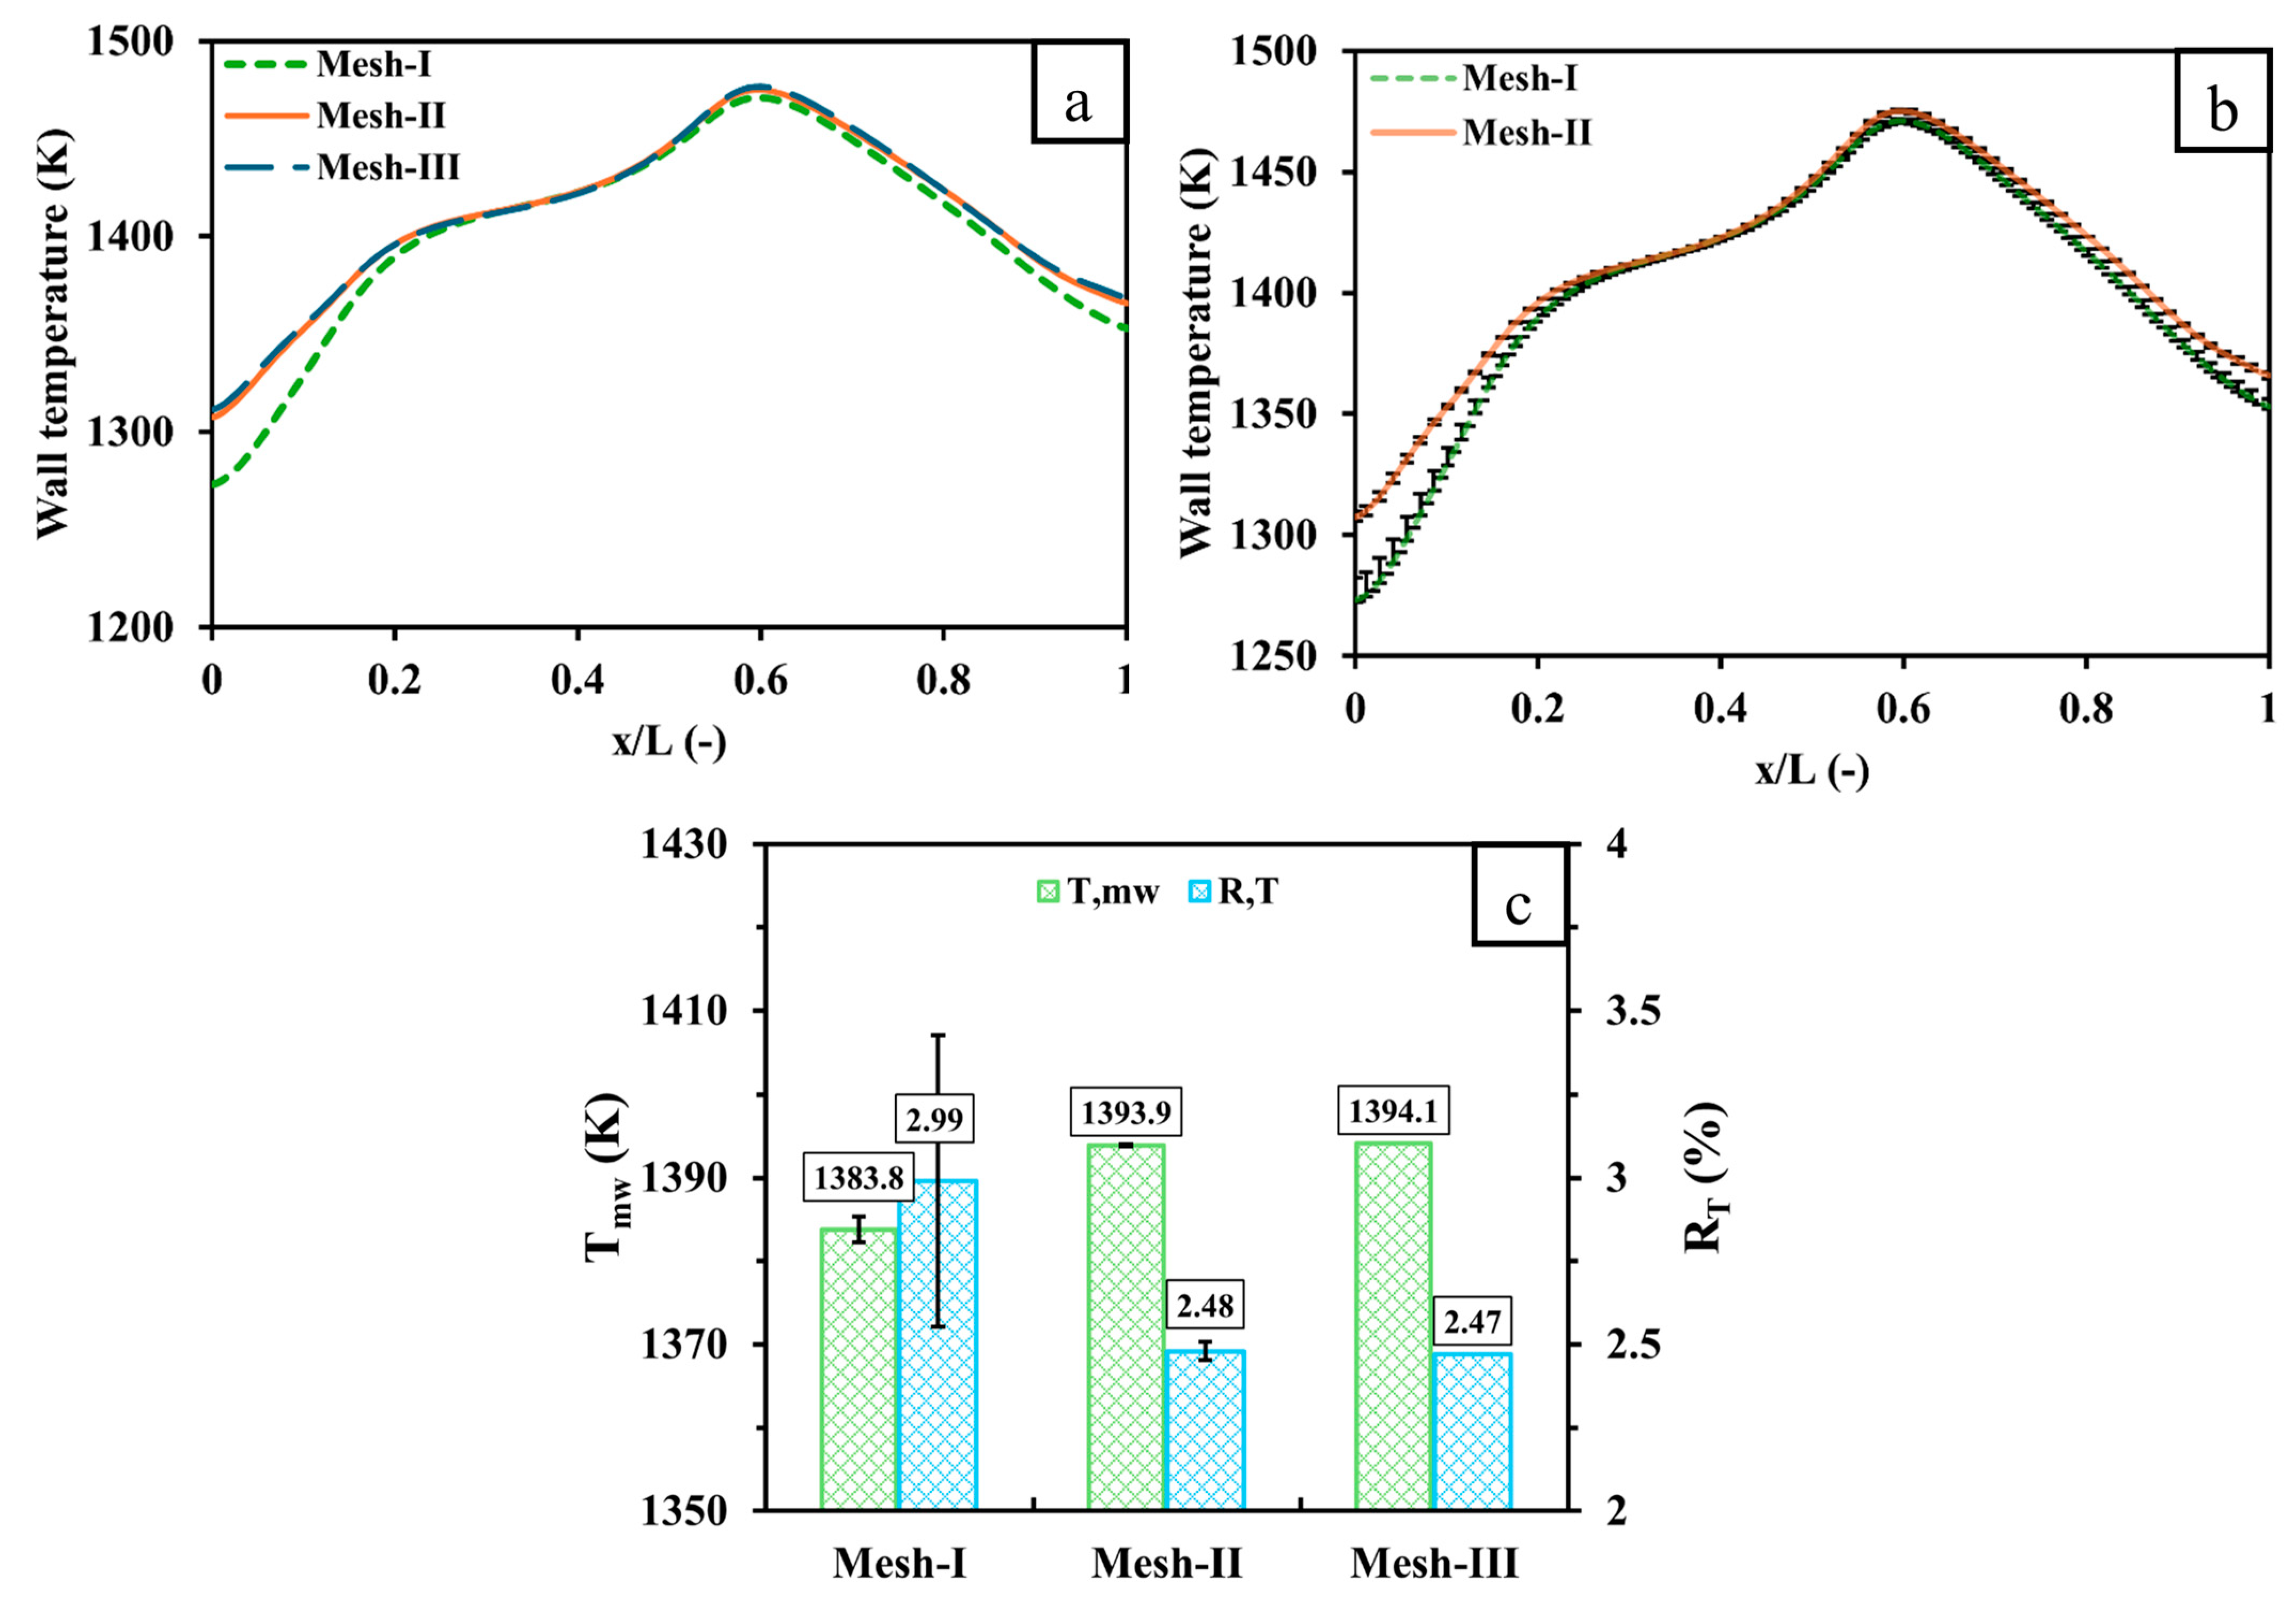
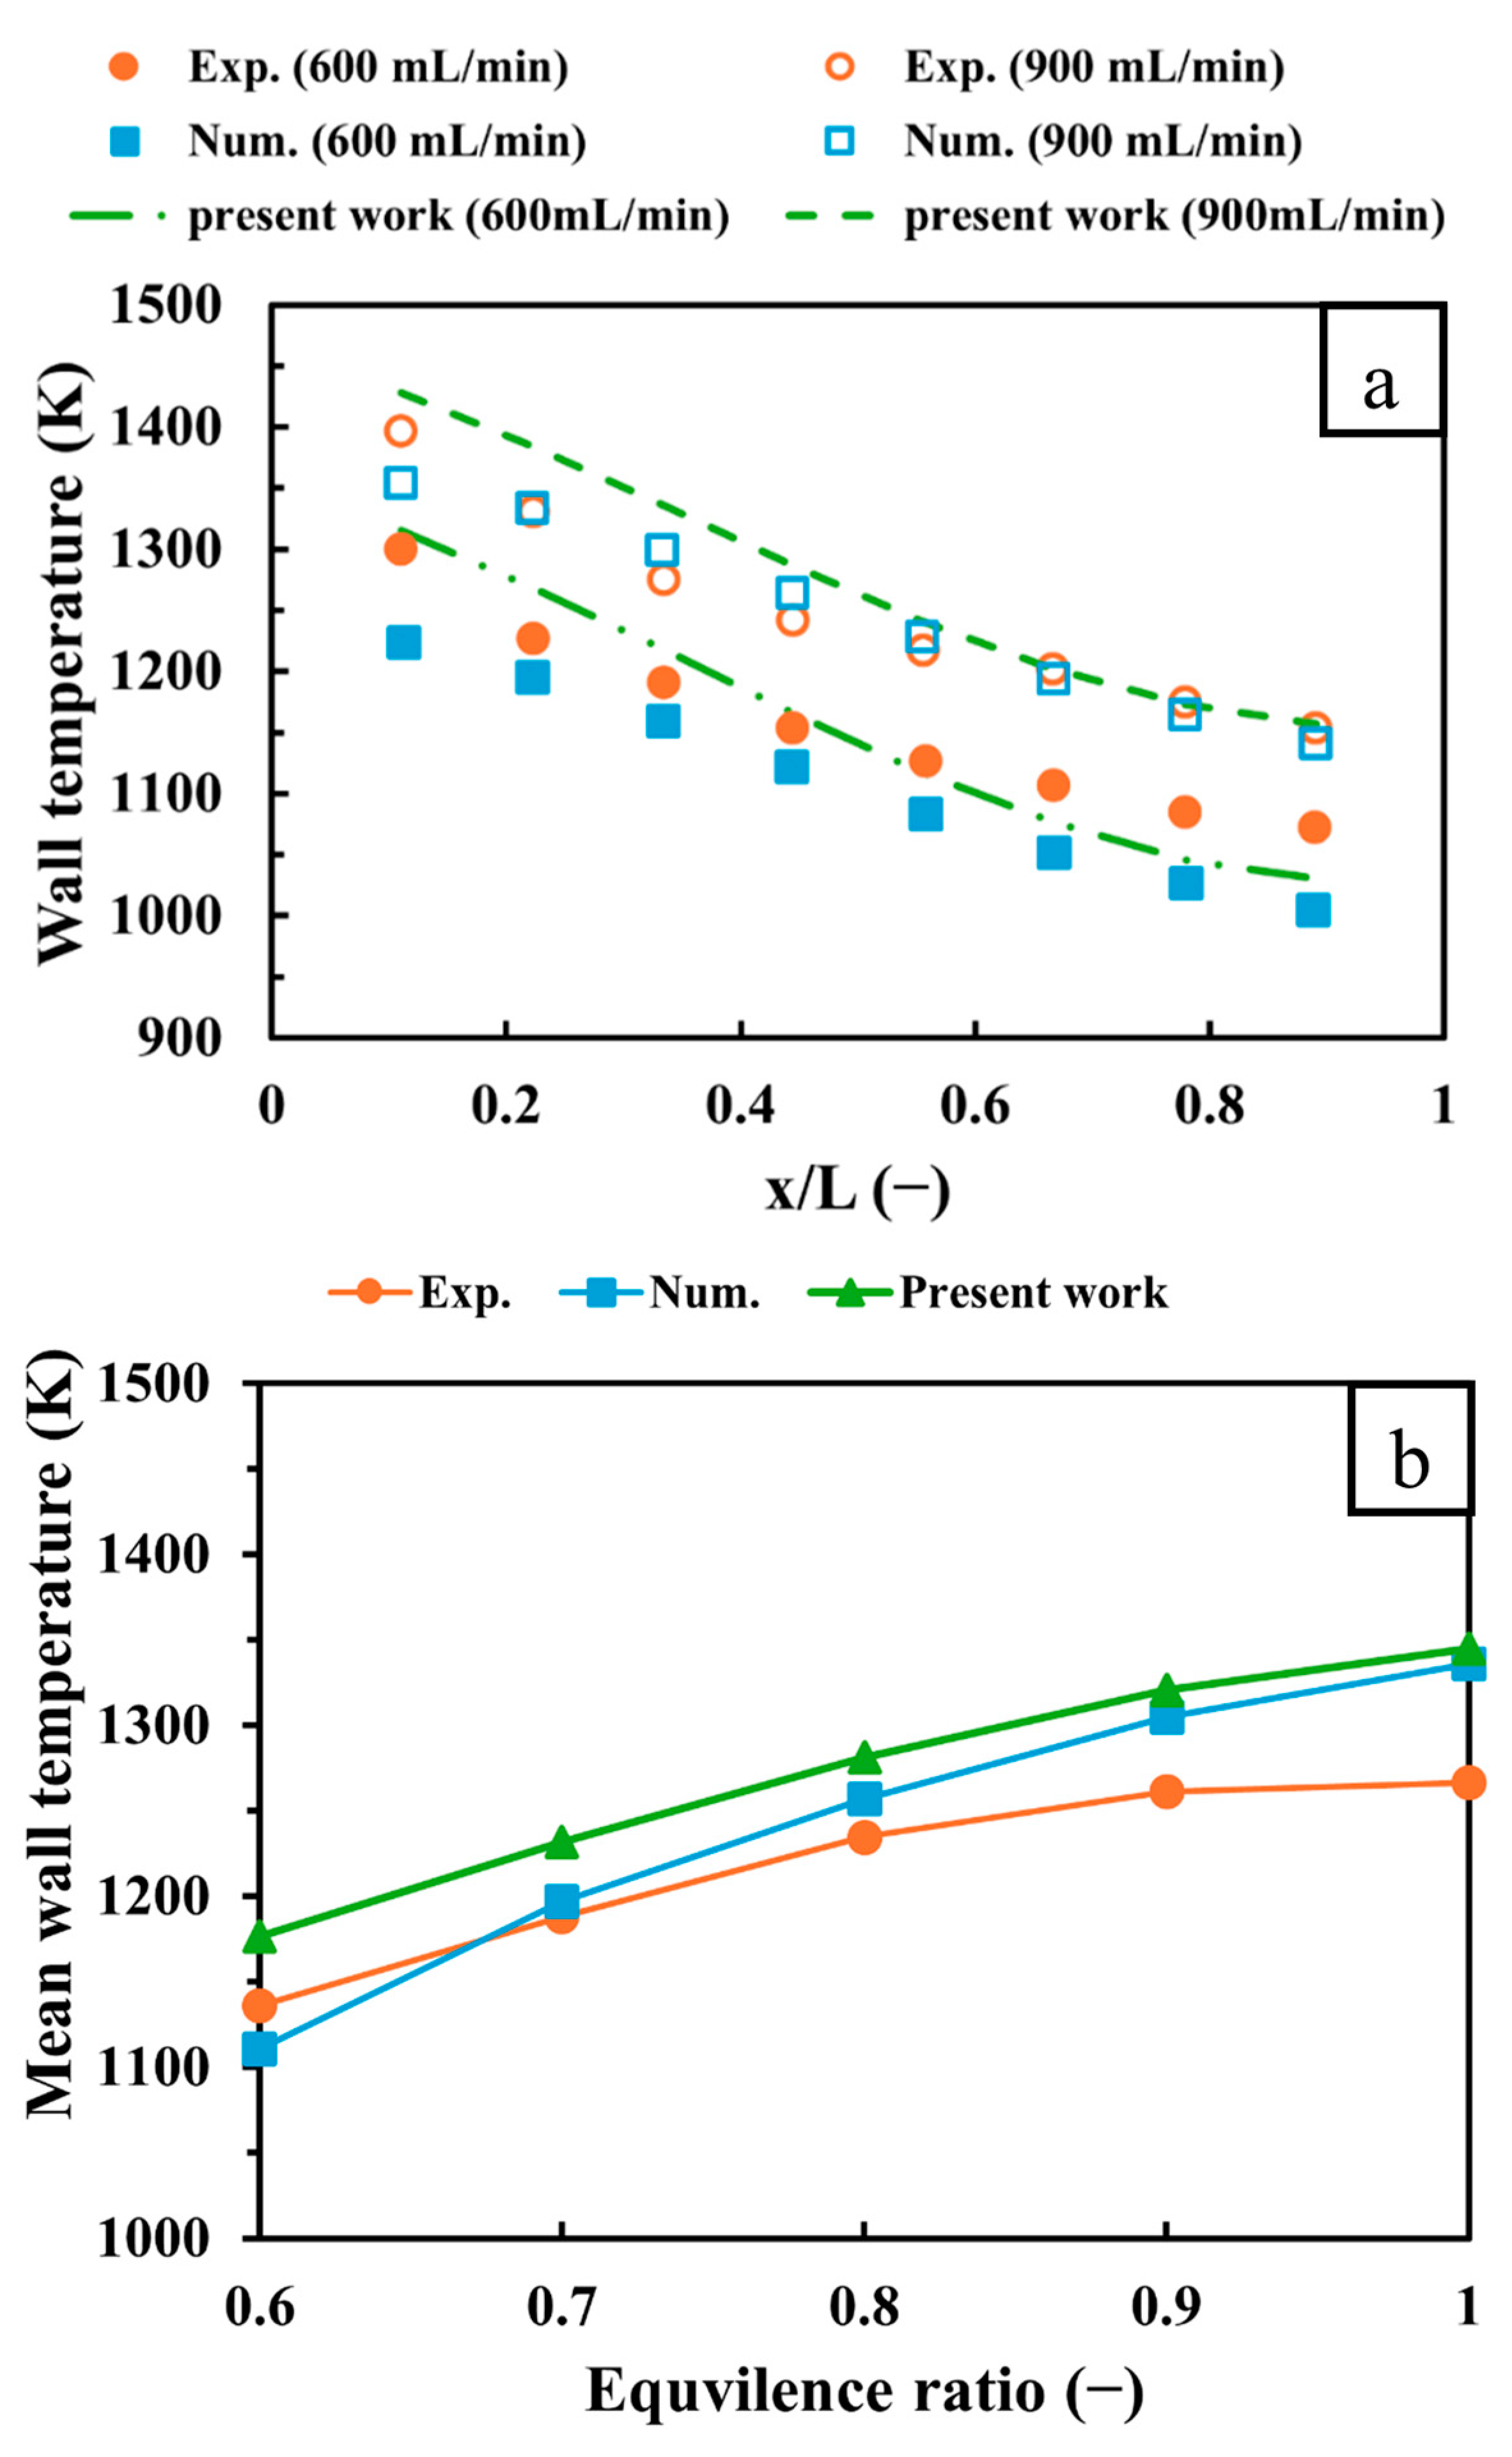
2.4. Grid Independence and Model Validation

For all numerical studies, the mesh independence test is paramount to balance accuracy and computing power. Therefore, this subsection examines coarse, medium, and fine mesh resolutions, which encompass 301,911 cells (Mesh-I), 748,163 cells (Mesh-II), and 1,240,631 (Mesh-III), respectively. The PF configuration is selected for the mesh sensitivity analysis, and the inlet velocity and equivalence ratio are set at 15 m/s and 1, respectively. The Grid Convergence Method (GCI) [52] was employed in the grid sensitivity analysis to measure the discretization error. This technique is used to assess the accuracy of Mesh-I and Mesh-II results with respect to the results of Mesh-III, as the latter is the fine mesh resolution.
Figure 3 depicts a comparison between the three mesh densities highlighted above in terms of the temperature variation over the external walls with respect to the dimensionless length ( x / L ) , T m w and R T . As seen in Figure 3a, the coarse mesh (Mesh-I) demonstrates notable under-predictions of the wall temperature in the inlet and back-wall regions, whereas the wall temperature of the medium-resolution mesh (Mesh-II) is roughly identical to that of the high-resolution case (Mesh-III). This is confirmed by Figure 3b, as the maximum discretization errors of Mesh-I and Mesh-II are 9.30% and 2.05%, respectively, at the geometry inlet. In general, the error bars shown in Figure 3b indicate that using Mesh-II ensures accurate results while maintaining computing power within an acceptable range. Similar findings are shown in Figure 3c, as the discretization errors of T m w and R T for Mesh-I (Mesh-II) are 2.61% and 43.7% (0.1% and 2.76%), respectively. Therefore, Mesh-II is chosen for all simulations presented in this research, as it provides precise outcomes within a reasonable computational time.
To ensure the robustness of the numerical settings and the accuracy of the simulations, a validation process is performed against experimental and numerical studies of both micro planar and cylindrical combustors. Figure 4a shows a comparison of the current work’s outcomes with prior experimental [28] and numerical [53] results in terms of the wall temperature variation at 600 and 900 mL/min volume flow rates of hydrogen in a micro planar combustor design. The validation demonstrates that the present work accurately predicts the wall temperature in the inlet region at a 600 mL/min hydrogen discharge, as confirmed by the experiment; however, it underestimates the wall temperature in the outlet region by an error of roughly 3.92% compared to the experimental results. The maximum error for the same volume flow rate is found to be around 7.45% in comparison with the numerical work. For a 900 mL/min hydrogen flow rate, the maximum discrepancies of the wall temperature between the current work and the experimental and numerical data occur at the inlet zone, with 2.25% and 5.45% error rates.
Figure 4b compares the validation of the mean wall temperature of the present work using the micro cylindrical combustor with the experimental [54] and simulated [55] data at a velocity of 12 m/s. As observed, the current work exhibits over-predictions of the mean wall temperature in all test cases, where the maximum errors for the experiment and simulation are approximately 6.19% and 5.96% at equivalence ratios of 1 and 0.6, respectively. Such discrepancies, as shown in Figure 4a,b, can result from measurement inaccuracies of the experiment and the employment of different mesh densities for the simulation. Overall, the percentages of error are acceptable and rational, indicating the applicability and viability of the numerical settings and modeling approaches.

3. Results

3.1. Effects of Two Micro Cylindrical Combustors Embedded Within a Micro Planar Combustor

This sub-section discusses the impacts of the new design on the thermal and thermodynamic parameters, and demonstrates its potential in comparison with the traditional design of the micro planar combustor. In addition, the effects of parallel and counter flows on system efficiency are examined here. As the inlet areas between the CD configuration and PF and CF configurations are different, fixing the inlet velocity leads to a scientifically invalid comparison due to the resulting different power inputs. For this, the comparisons of CD, PF, and CF structures are presented here at an input power of 275 W and a unity equivalence ratio.
Figure 5 illustrates the variations of T m w and R T of CD, PF, and CF structures at an input power and equivalence ratio of 275 W and 1, respectively. As observed, PF and CF exhibit an effective means of enhancing T m w compared to CD by roughly more than 118.3 K. Furthermore, the newly proposed designs demonstrate more evenly distributed temperature over the outer walls of the micro combustor as R T is reduced in the PF and CF configurations, in comparison to the CD configuration, by 3.7% and 3.65%, respectively. The parameters presented in Figure 5 are considered as two of the most important thermal performance parameters, as higher values of T m w indicate an improvement in the heat transfer mechanisms from the combustion to the micro combustor’s walls, while lower levels of R T refer to a very uniform promotion of heat transfer throughout the geometry. On the other hand, T m w and R T are roughly identical between PF and CF, implying that the direction of inlet flows has no notable effects.
Figure 6 displays the effects of CD, PF, and CF cases on the distribution of temperature throughout the domain at a 275 W input power and a unity equivalence ratio. As can be seen in Figure 6, the high-temperature flame occupies a wider range in CD as compared to PF and CF. However, the dwell time of flow is significantly shorter in the former case, whereas establishing the middle and back walls in the two latter cases increases the residence period of the great thermal energy stream, increasing the heat transfer capacity to the external surfaces. This is brought about as the middle wall holds a high thermal energy, while the back wall redirects the hot flows toward the preheating channels to act as a thermal energy source for the inlet flow. The highlighted effects confirm the considerable improvements in T m w and R T , as shown in Figure 5.
Figure 7 shows the impacts of CD, PF, and CF on how the Pe number varies at a 275 W input power and a unity equivalence ratio. For all test cases, high degrees of Pe number distributions are confined in the inlet region owing to the high density of the unburnt gases. In contrast to the CD case, the contour representations of the Pe number reveal that the PF and CF cases demonstrate intermediate variations of Pe number in the outlets of the micro combustor and in the narrow channel between the preheating room and external walls. This illustrates that the outlined regions experience a dominance of advection effects over those of diffusion, yielding a greater transfer of heat in the new designs.
Figure 8 depicts representations of how the total entropy generation varies in the CD, PF, and CF test cases. As expected, the areas occupied by high entropy generation are confined within the region of the onset of combustion in all cases. The causes of this lie in that the aforementioned region experiences high chemical reaction rates, high temperature gradients, and high concentration gradients of species, which govern the entropy productions in terms of chemistry, heat conduction, and diffusion, respectively. The direction of flow plays no critical role in the entropy generation, as the spatial variations of total entropy in the PF and CF cases are quite similar to each other.
Figure 9 provides volume integral forms of total entropy production with the illustration of the percentage participation of each mechanism under different design configurations. The PF and CF structures are conducive to dissipating a higher amount of energy, unlike the CD structure, as the percentages of S g e n increase between the two former cases and the latter case are 827.1% and 824.1%, respectively. These high increases can be attributed to the high temperature gradients between the high-temperature flame and the walls of the preheating channel, which notably increase the heat conduction mechanism of entropy. In addition to this, the high intensities of combustion in the new designs are caused by higher chemical reaction rates and, therefore, lead to higher rates of production and destruction of species, which consequently promote chemical and diffusion mechanisms of entropy, respectively.
Figure 10 compares between CD, PF, and CF in terms of the pressure loss, exhaust gas temperature ( T e g ) , and exergy and radiation efficiencies. As seen in Figure 10a, PF and CF, in contrast to CD, show significantly increased pressure loss due to the notably higher rate of collision between the stream flowing from the inlets and the middle and back barriers, which raises the necessity of additional pumping power. However, such walls elongate the dwell period of flow inside the micro combustor, and thus improve the heat transfer to the outer walls. This leads to benefits from extremely high thermal energy, as the T e g values of PF and CF are much lower than that of CD by 591 K and 580 K, respectively. This is despite the fact that the higher entropy generation in PF and CF, as shown Figure 9, capitalizing on greater thermal energy (as confirmed by the trends of T e g ), increases the exergy (radiation) efficiency of PF and CF compared to CD, by 7.2% (14%) and 7.3% (14%), respectively, as illustrated in Figure 10b. On the other hand, no remarkable discrepancies are observed in relation to the operation conditions of a 275 W input power and a unity equivalence ratio.

3.2. Effects of Inlet Velocity

The initial operation conditions are critical to optimizing the system performance. Thus, the variation of inlet velocity, which controls the input power, and its effects on the thermal parameters and output power density are discussed here. As the new designs (PF and CF configurations) notably improve T m w , R T , energy and radiation efficiencies compared to the traditional structure of the micro planar combustor (CD configuration), as previously presented, only PF and CF are investigated in this sub-section at an equivalence ratio of 1 and inlet velocities of 6, 9, 12, and 15 m/s, which are equivalent to input powers of 109.7 W, 164.5 W, 219.3 W, and 275 W, respectively.
Figure 11 shows the effects of inlet velocities on T m w and R T for PF and CF designs. For both cases, altering V i n from low to high is conducive to increasing T m w due to feeding the systems with more energy, and therefore absorbing more thermal energy into the walls. In contrast, reducing V i n results in a fluctuating trend of R T , as it decreases and then increases. The optimal uniform wall temperatures of PF and CF are recorded at 12 m/s and 9 m/s, respectively. It is worth noting that the CF case demonstrates more equal variations of temperature over the micro combustor’s walls for all V i n values when compared to the PF case, owing to the production of thermal energy from opposite sides of the domain.
Figure 12 illustrates the variations in temperature for PF and CF configurations at different levels of V i n . As can be seen in Figure 12, increasing V i n leads to the enrichment of the combustor with more fuel, and consequently increases the in-combustor temperature. This results in the release of more thermal energy, thus transferring more heat to the external walls, which confirms the increase in T m w at higher V i n . In addition, escalating V i n causes the onset of combustion to shift to a greater distance from the inlet due to the high diffusion of hydrogen. This effect controls the flame position and how long the flame propagates throughout the micro combustor, which accordingly determines the uniformity of wall temperature. As shown in Figure 12, the amount of energy entrained into the micro combustor at an inlet velocity of 9 m/s for the CF case results in the ideal flame shape for achieving the best R T (See Figure 11), particularly when the flame heats the walls equally from opposing sides.
Figure 13 provides a contour representation of Pe number distributions in PF and CF with respect to various V i n values. Disregarding the high Pe number near the inlets, caused by the high density of unburnt flowing mixture, the increase in V i n in all test cases shows high Pe numbers in the outlets, and in the narrow channel separating the outer walls and the preheating path. This indicates that the advection effects dominate in the highlighted regions, implying an improvement in the heat transfer mechanisms.
Figure 14 depicts how the total entropy generation spatially varies over the micro combustor domain in the PF and CF configurations under various values of V i n . As observed in all cases, the area occupied by the highest values in both PF and CF closely resembles the shape of the flame in the region of combustion initiation. This is mainly caused by the great chemical activities occurring in the outlined area, which result in tremendously high rates of generation and consumption of species. For this, supplying more fuel to the system at higher V i n enhances chemistry and, hence, elongates the regions of high entropy generation. Reversing the flow results in no notable effects in the entropy generation, as the PF and CF configurations are identical in terms of the promotion of entropy.
Figure 15 demonstrates the magnitude of S g e n and the participation of conduction, chemical, and diffusion entropy generation for PF and CF at different values of V i n . As highlighted before, increasing V i n leads to increases in the input power of the system, resulting in intensive combustion. Thereby, approaching greater degrees of V i n causes the magnitude of entropy generation to significantly increase. All mechanisms of entropy production are found to be proportionally escalated when increasing V i n ; however, the chemical mechanism seems to prevail owing to the vigorous chemical rates at such conditions. The values of total entropy generation between PF and CF are similar, proving that reversing one flow direction does not impact entropy generation.
Figure 16 shows the variations in trends of pressure loss, T e g , and exergy and radiation efficiencies for PF and CF configurations in a range of values of V i n . Increasing the flow velocity of the inlet mixture remarkably promotes the collision rate of the hot gases with the middle and back walls, leading to significant escalations in the pressure loss in PF and CF cases, as shown in Figure 16a. Moreover, the transition of V i n from low to high in all test cases feeds the system with more energy and, therefore, increases T e g , indicating a greater waste of energy from the system. This suggests that the capacity of the investigated application is limited in terms of benefiting from high energy content. This conclusion is supported by the variations of exergy and radiation efficiencies demonstrated in Figure 16b, which reveal decreasing trends when approaching higher V i n . Trivial discrepancies are recorded in the system’s efficiency when comparing PF and CF, referring to the negligible effects of the flow direction.

3.3. Effects of Inlet Equivalence Ratio

Complete combustion depends on a wide variety of variables. One of these parameters is the inlet equivalence ratio ( Φ ) , which controls the ratio of fuel and air and therefore plays a critical role in the fuel economy. This part discusses the effects of varying Φ from 0.6 to 1.2 for PF and CF cases at a 275 W input power.
Figure 17 outlines the effects of fuel-lean and fuel-rich conditions on T m w and R T for PF and CF. As can be seen in Figure 17, T m w drastically increases from the low-fuel condition ( Φ < 1 ) to the stoichiometric condition ( Φ = 1 ) , and then decreases when transitioning to the high-fuel condition ( Φ > 1 ) , which trends are caused by insufficient amounts of fuel and oxygen, respectively. However, inconsistent patterns of R T are found between PF and CF configurations, as the former and latter achieve the optimal R T values of 2.15% and 1.97% at Φ of 0.8 and 0.6, respectively.
Figure 18 displays the variation in temperature across the micro combustor at different levels of Φ for PF and CF test cases. As observed in Figure 18, the fuel-lean conditions ( Φ < 1 ) foster low temperatures and a further initiation of combustion from the inlets due to the low quantity of hydrogen and difficulties in triggering the combustion, respectively. Hydrogen’s high diffusivity is expected to shift the onset of combustion further downstream; however, combustion in the fuel-rich condition ( Φ > 1 ) occurs relatively closer to the inlet compared to the stoichiometric condition ( Φ = 1 ) , suggesting that the strength of the mixture to ignition at Φ > 1 dominates over the high diffusion mobility of hydrogen.
Figure 19 presents the contours of Pe number distributions at different Φ values, between 0.6 and 1.2, for PF and CF structures. The Pe number distributions show a pronounced decrease after the onset of combustion with an increasing Φ . This can be attributed to the high diffusivity of hydrogen, as a higher Φ implies an increase in hydrogen content in the premixed mixture, thereby increasing the diffusion effect over that of advocation at such conditions.
Figure 20 depicts how the total entropy generations are spatially varied with respect to different levels of Φ for PF and CF structures. It is shown in Figure 20 that high entropy production covers a wider area in the micro combustor domain at lower values of Φ . The causes of this lie in the fact that the fuel-lean mixture is difficult to ignite, and therefore a longer distance is required to initiate the combustion. The line separating the unburnt and burnt gases is known for its intense chemical processes, which notably generate entropy at higher degrees.
Figure 21 demonstrates the magnitude of entropy generation along with the contributions of each entropy process at a range of Φ from 0.6 to 1.2 for PF and CF configurations. As seen in Figure 21, entropy generation exhibits increasing and decreasing trends from lean to stoichiometric conditions and from stoichiometric to rich conditions, respectively, suggesting that the Φ = 1 case results in a higher combustion intensity. In addition, the outcomes reveal that a higher Φ increases the participation rate of the chemical mechanism, whereas the percentage of heat conduction mechanism proportionally decreases, indicating the dominance of the chemistry rate over the temperature gradients under such conditions.
Figure 22 outlines the impacts of varying Φ values on pressure loss and T e g , as well as exergy and radiation efficiencies. The pressure loss findings, as shown in Figure 22a, demonstrate gradual reductions for both configurations as Φ increases, indicating that the fuel-rich conditions require less pumping power. However, Teg encounters an increase in Φ from 0.6 to 1 and then a decrease from 1 to 1.2, which trends are caused by the low consumption rates of oxygen and hydrogen, respectively. Regarding system efficiency, both exergy and radiation efficiencies achieve their peaks at a Φ of 1. Despite the T e g trend, the unity equivalence ratio case provides the optimal balance between fuel and air, as it exhibits the greatest power output density and T m w .

4. Conclusions

This numerical work investigates a novel micro combustor consisting of a PF and CF micro planar combustor with two micro cylindrical combustors embedded inside. The micro cylindrical combustors feature heat-recirculating channels to increase the dwell time of flow, and also to act as a preheating source for inlet premixed mixtures. The thermodynamic and performance parameters of the proposed configuration compared to the conventional one are analyzed to demonstrate the potential of the former. In addition, the inlet velocity and equivalence ratio are varied to optimize the system’s output power density. The main conclusions drawn from the simulations are as follows:
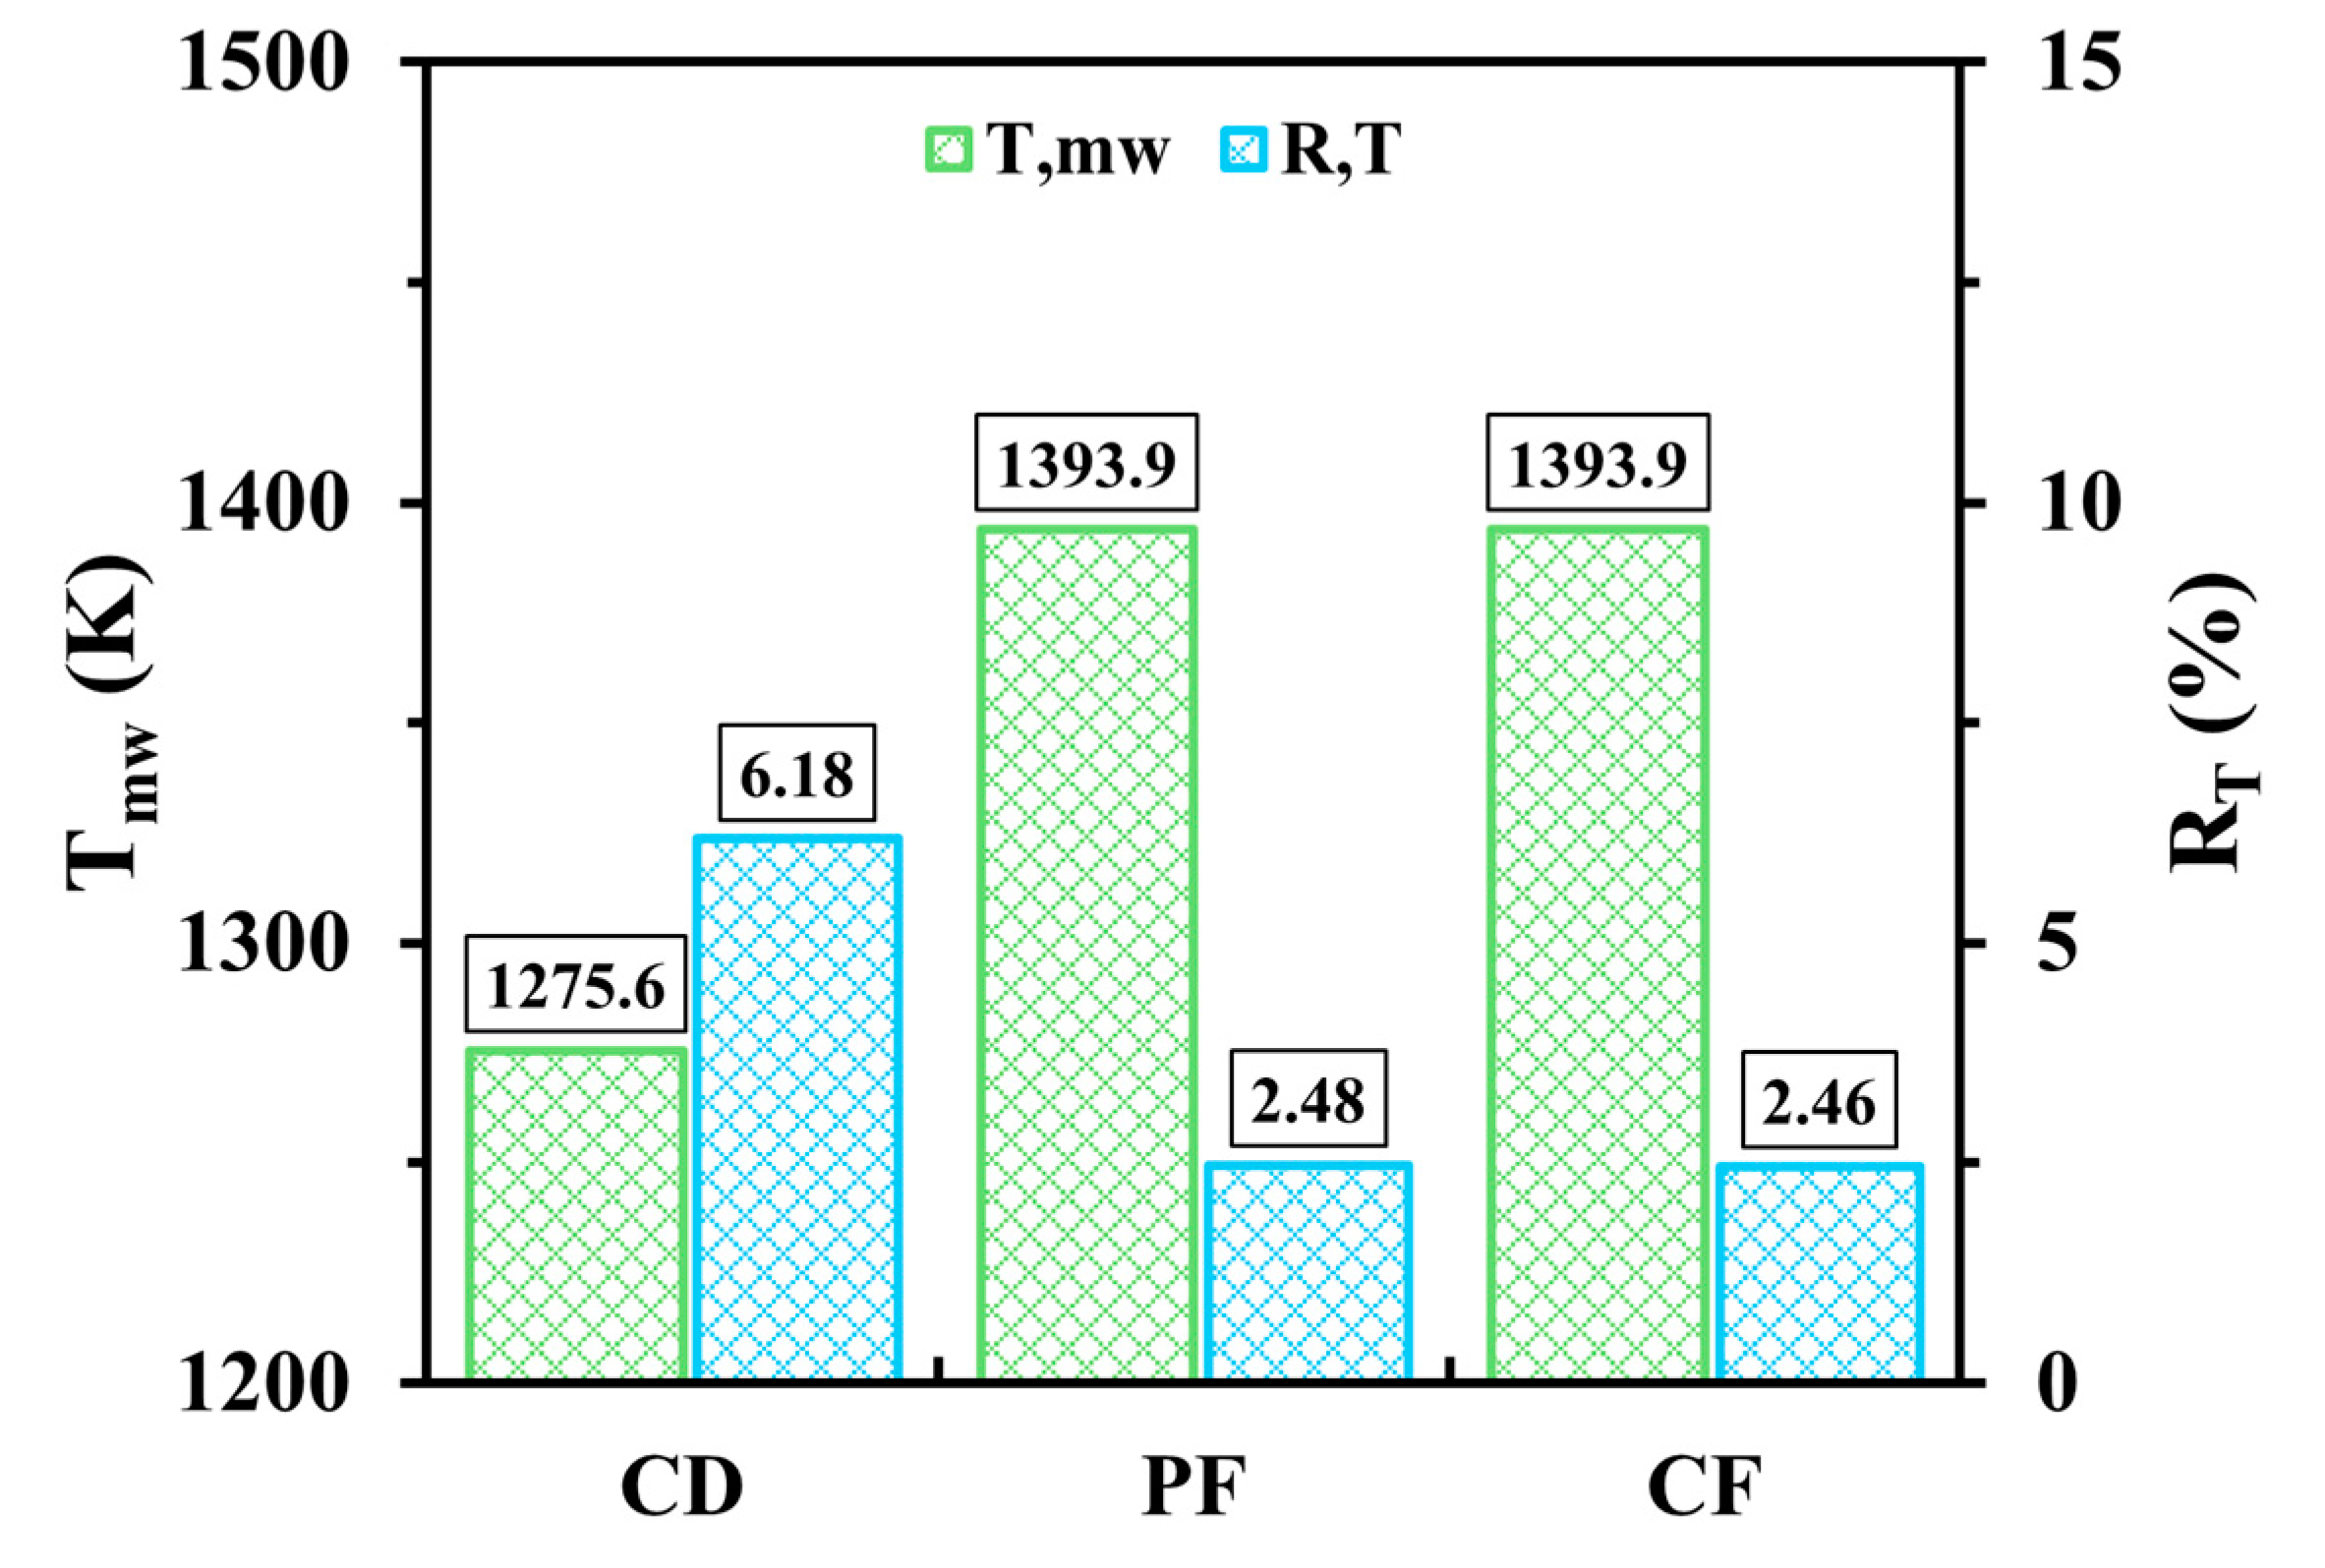
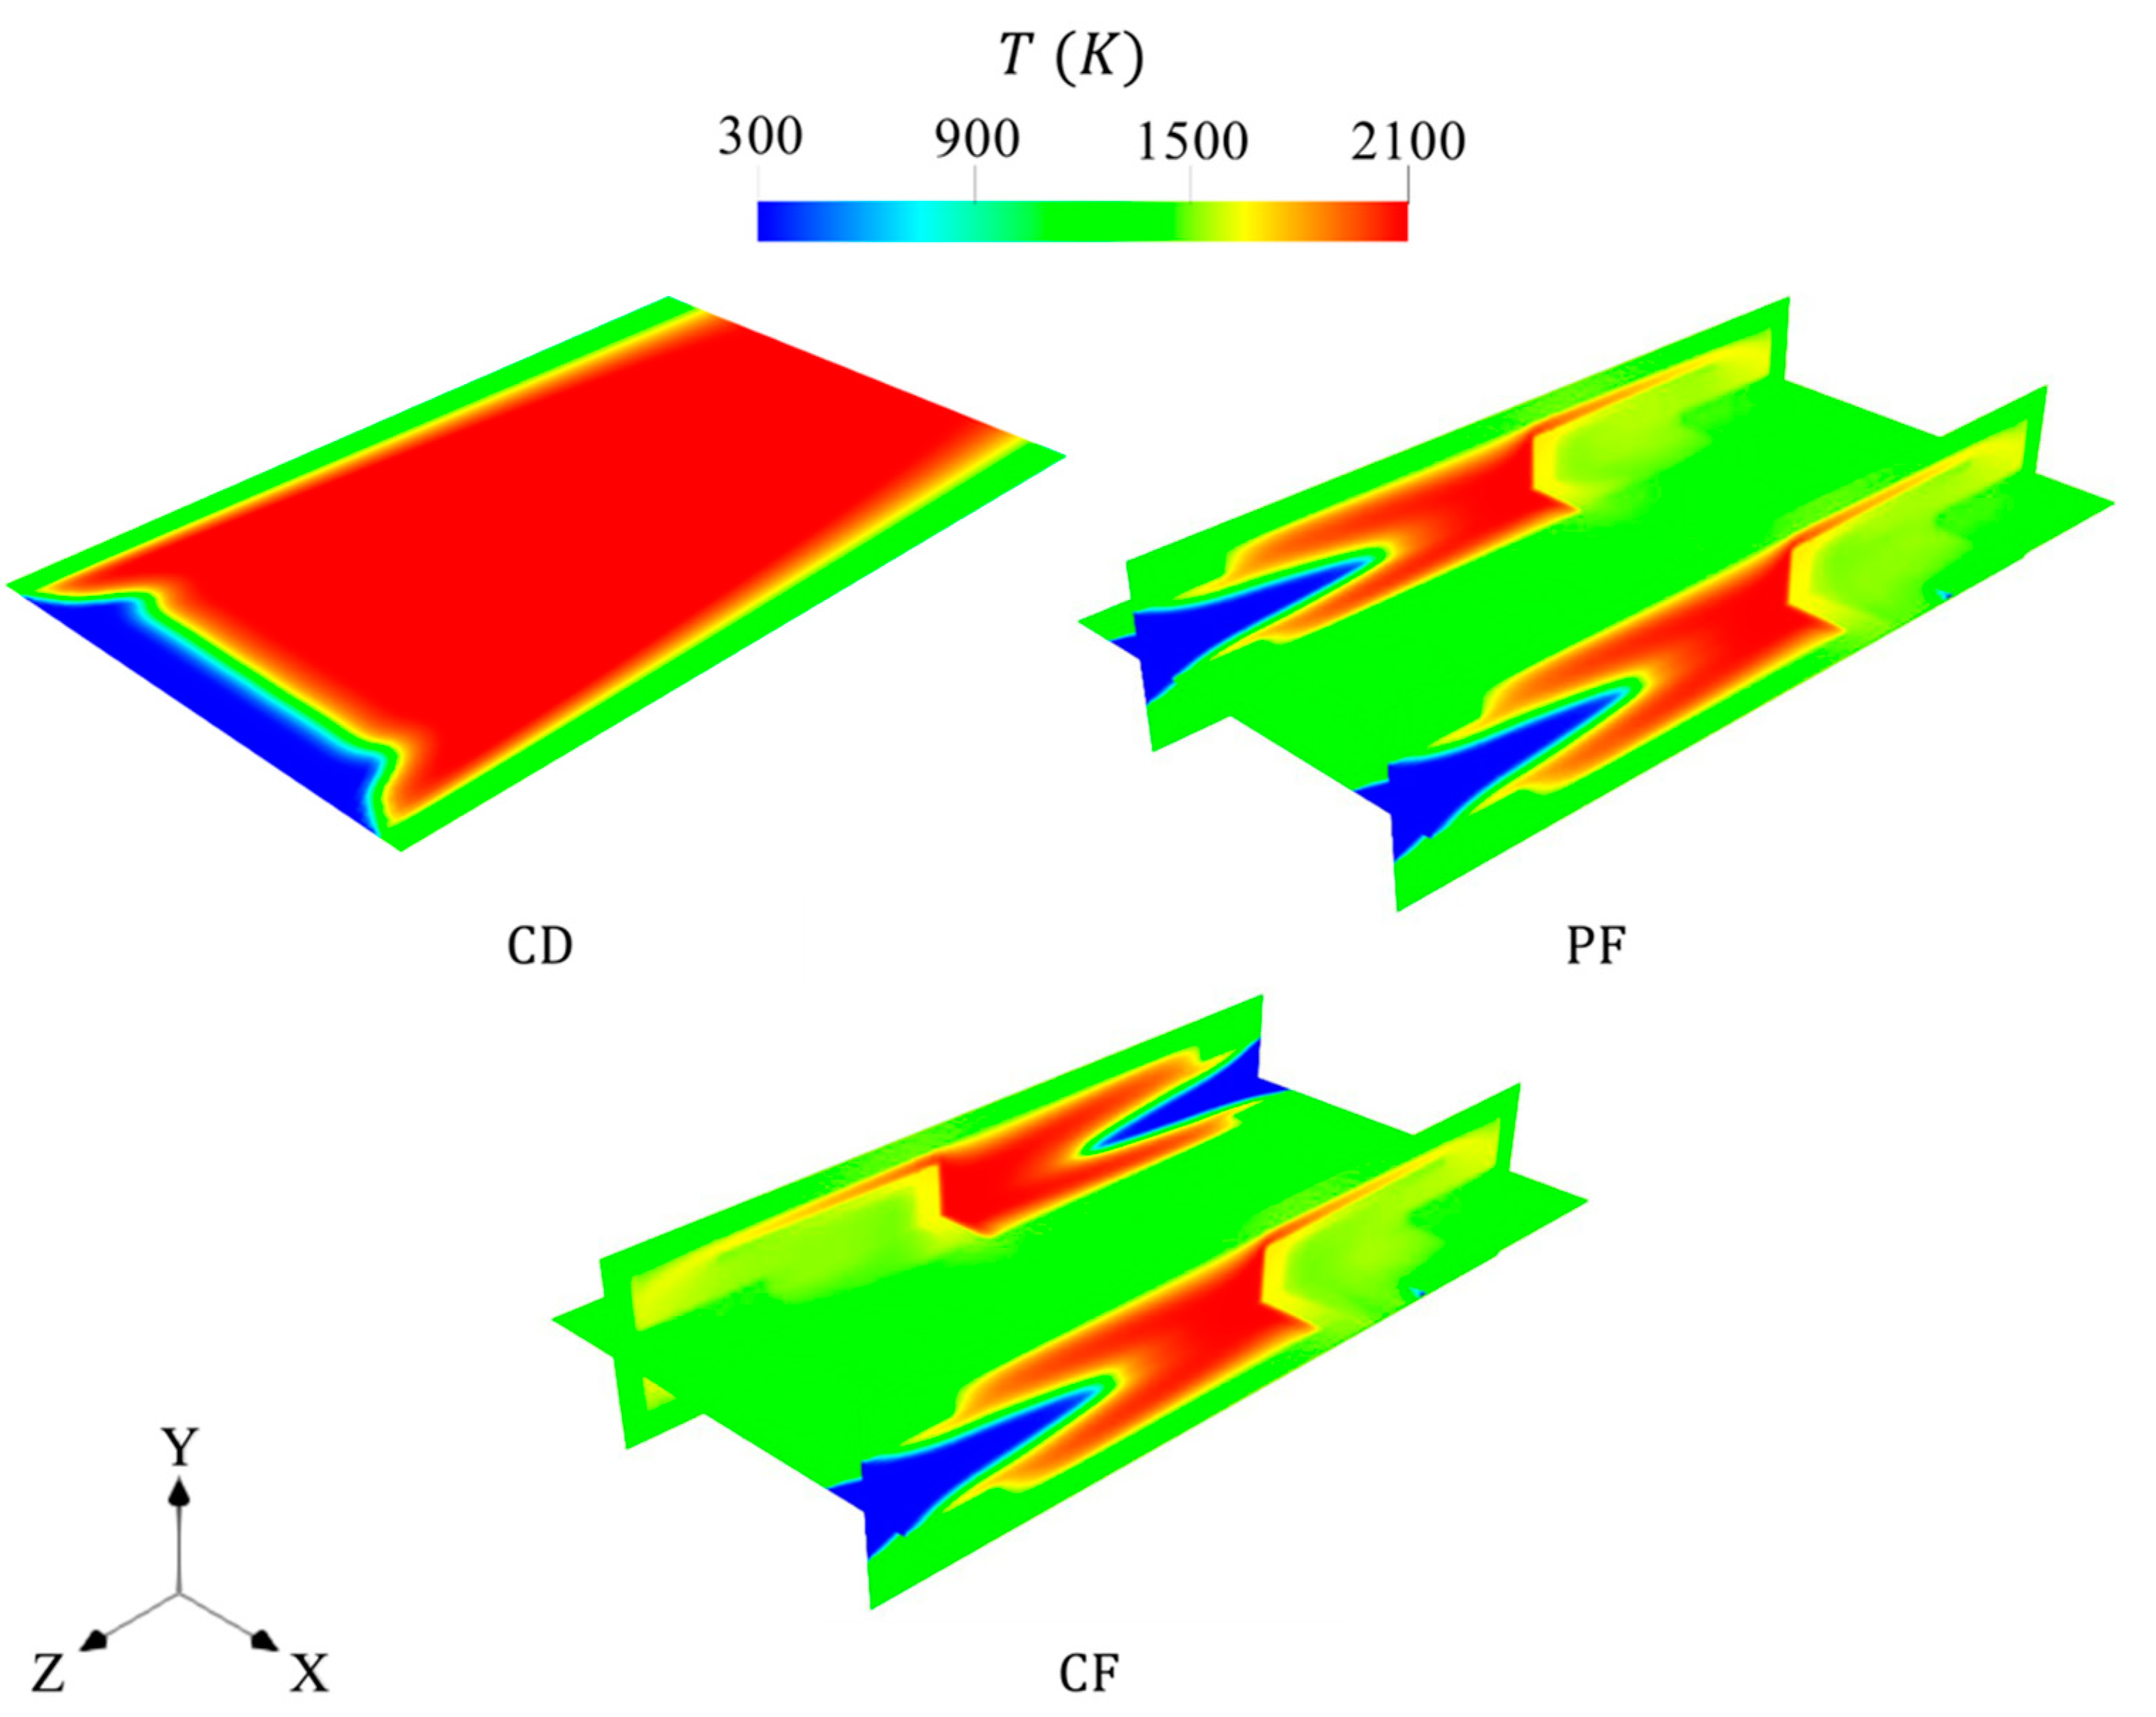
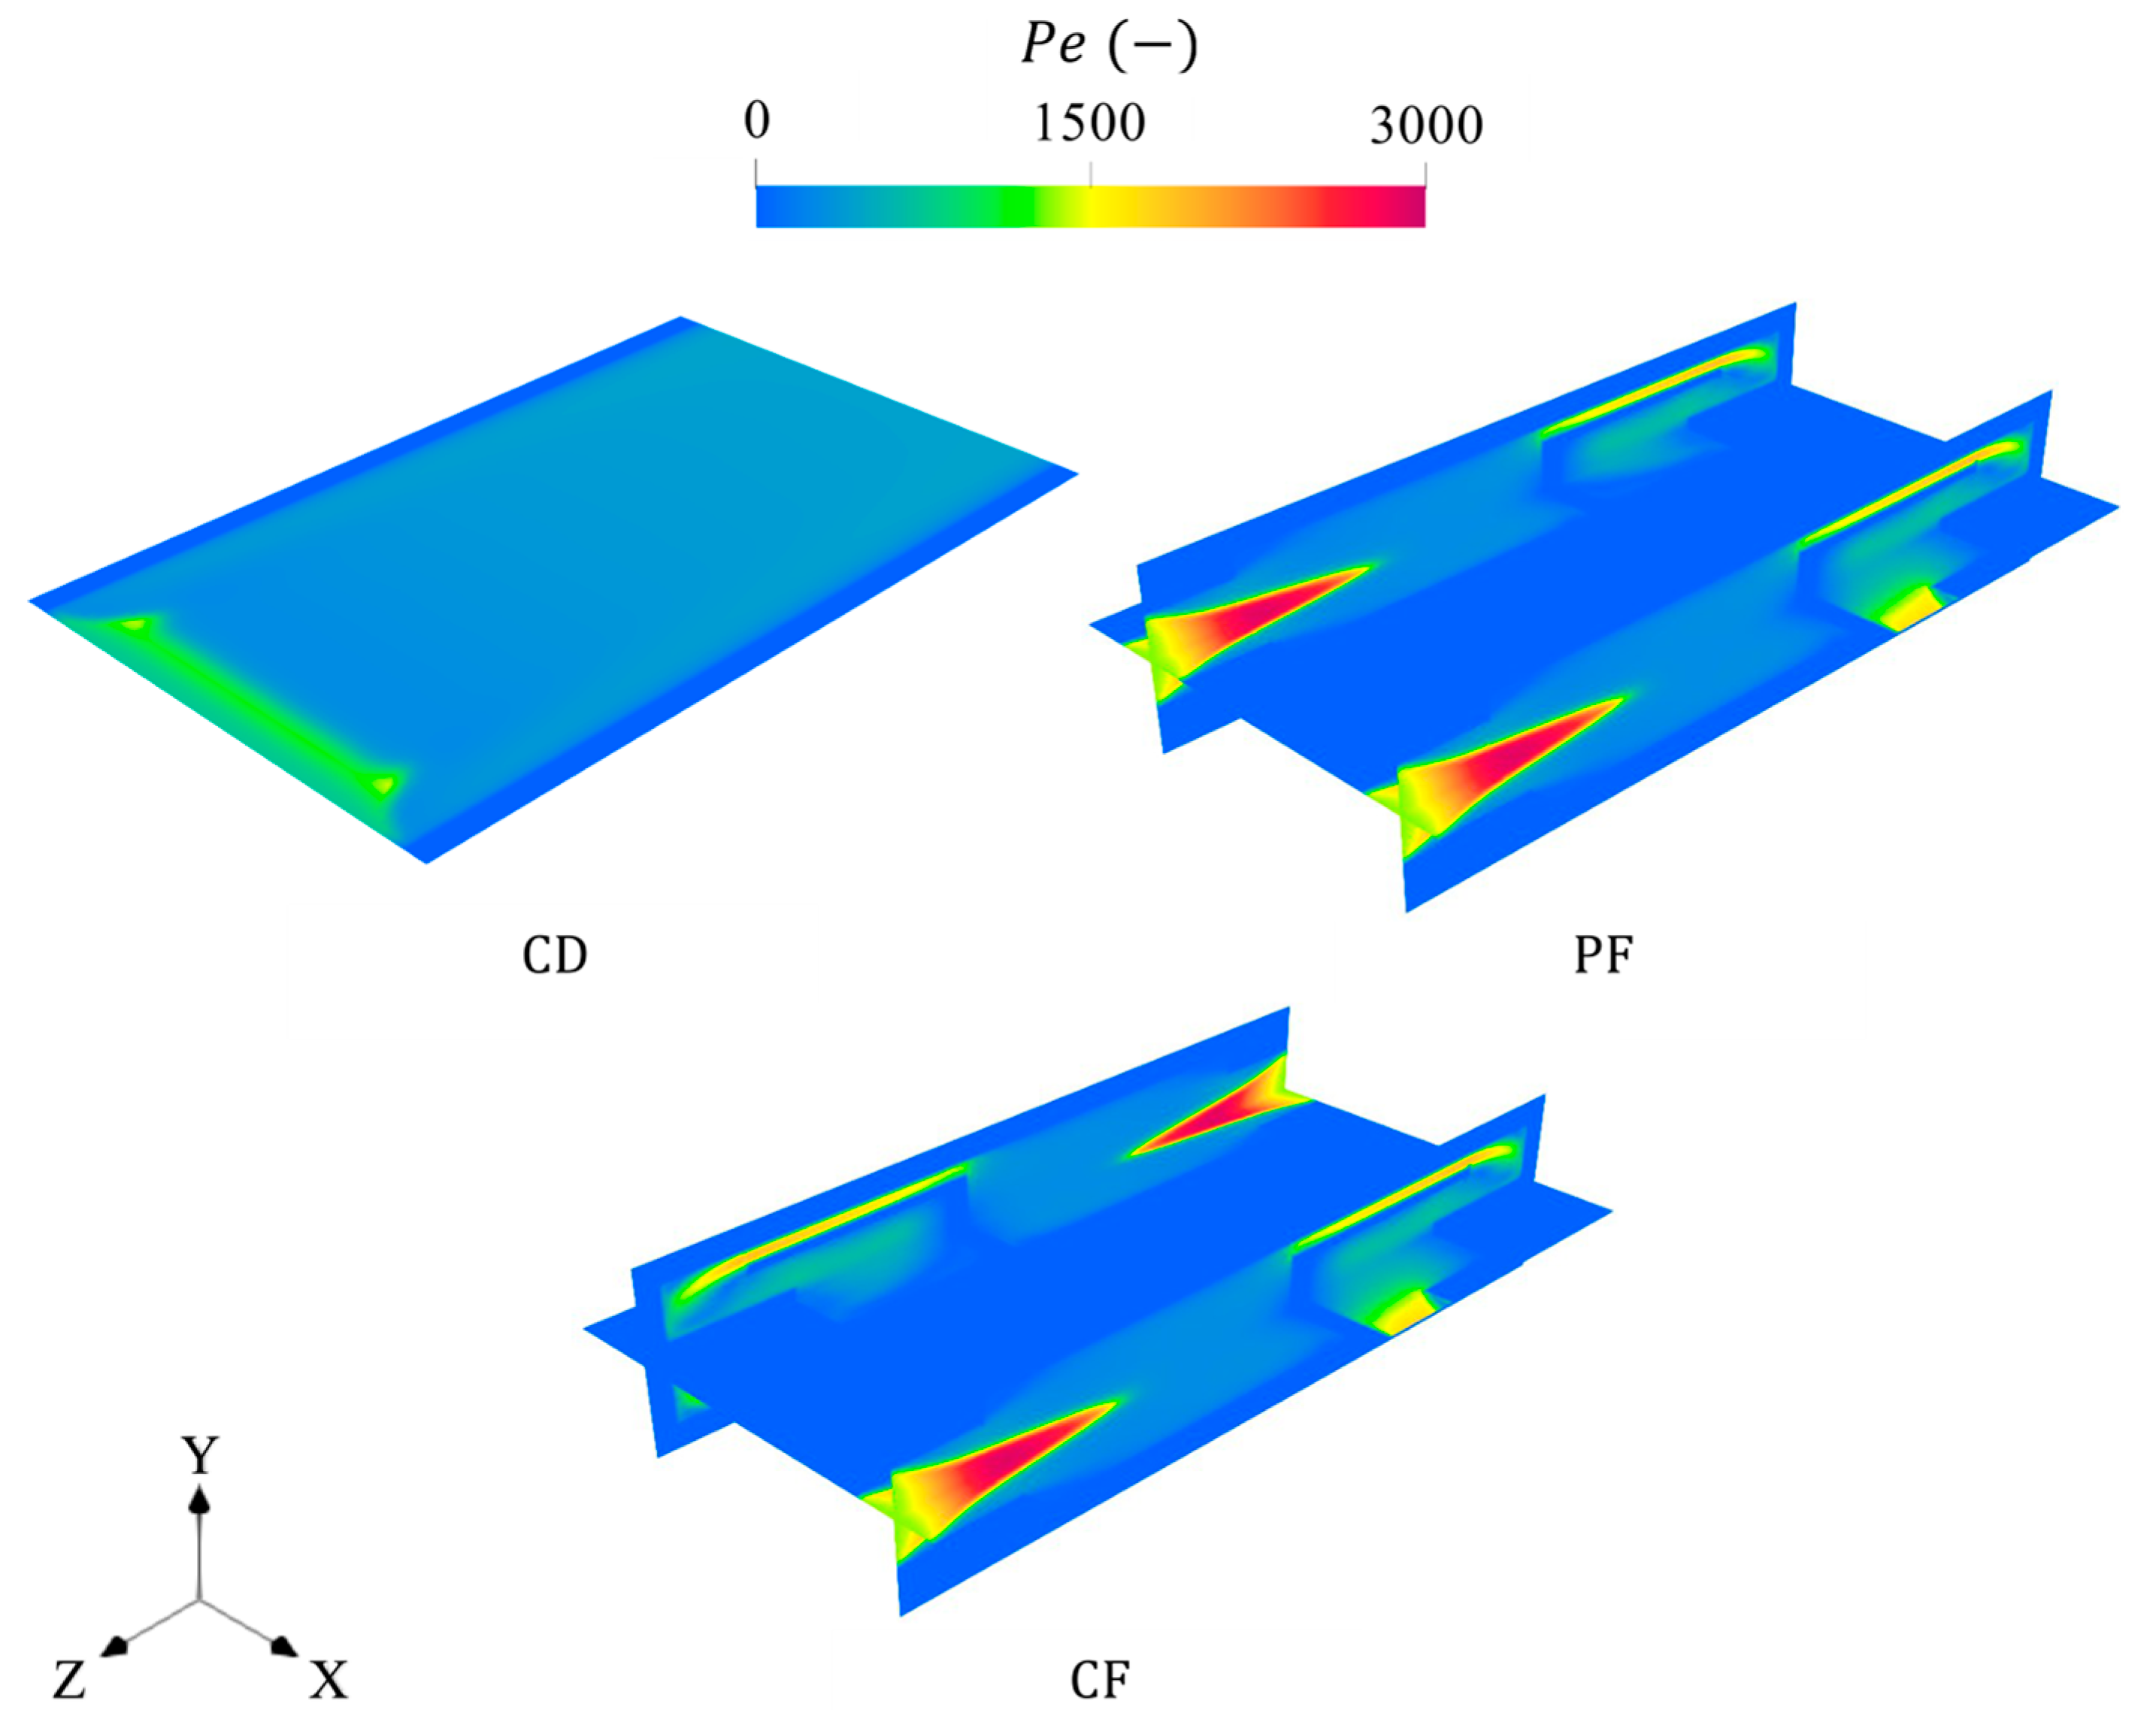
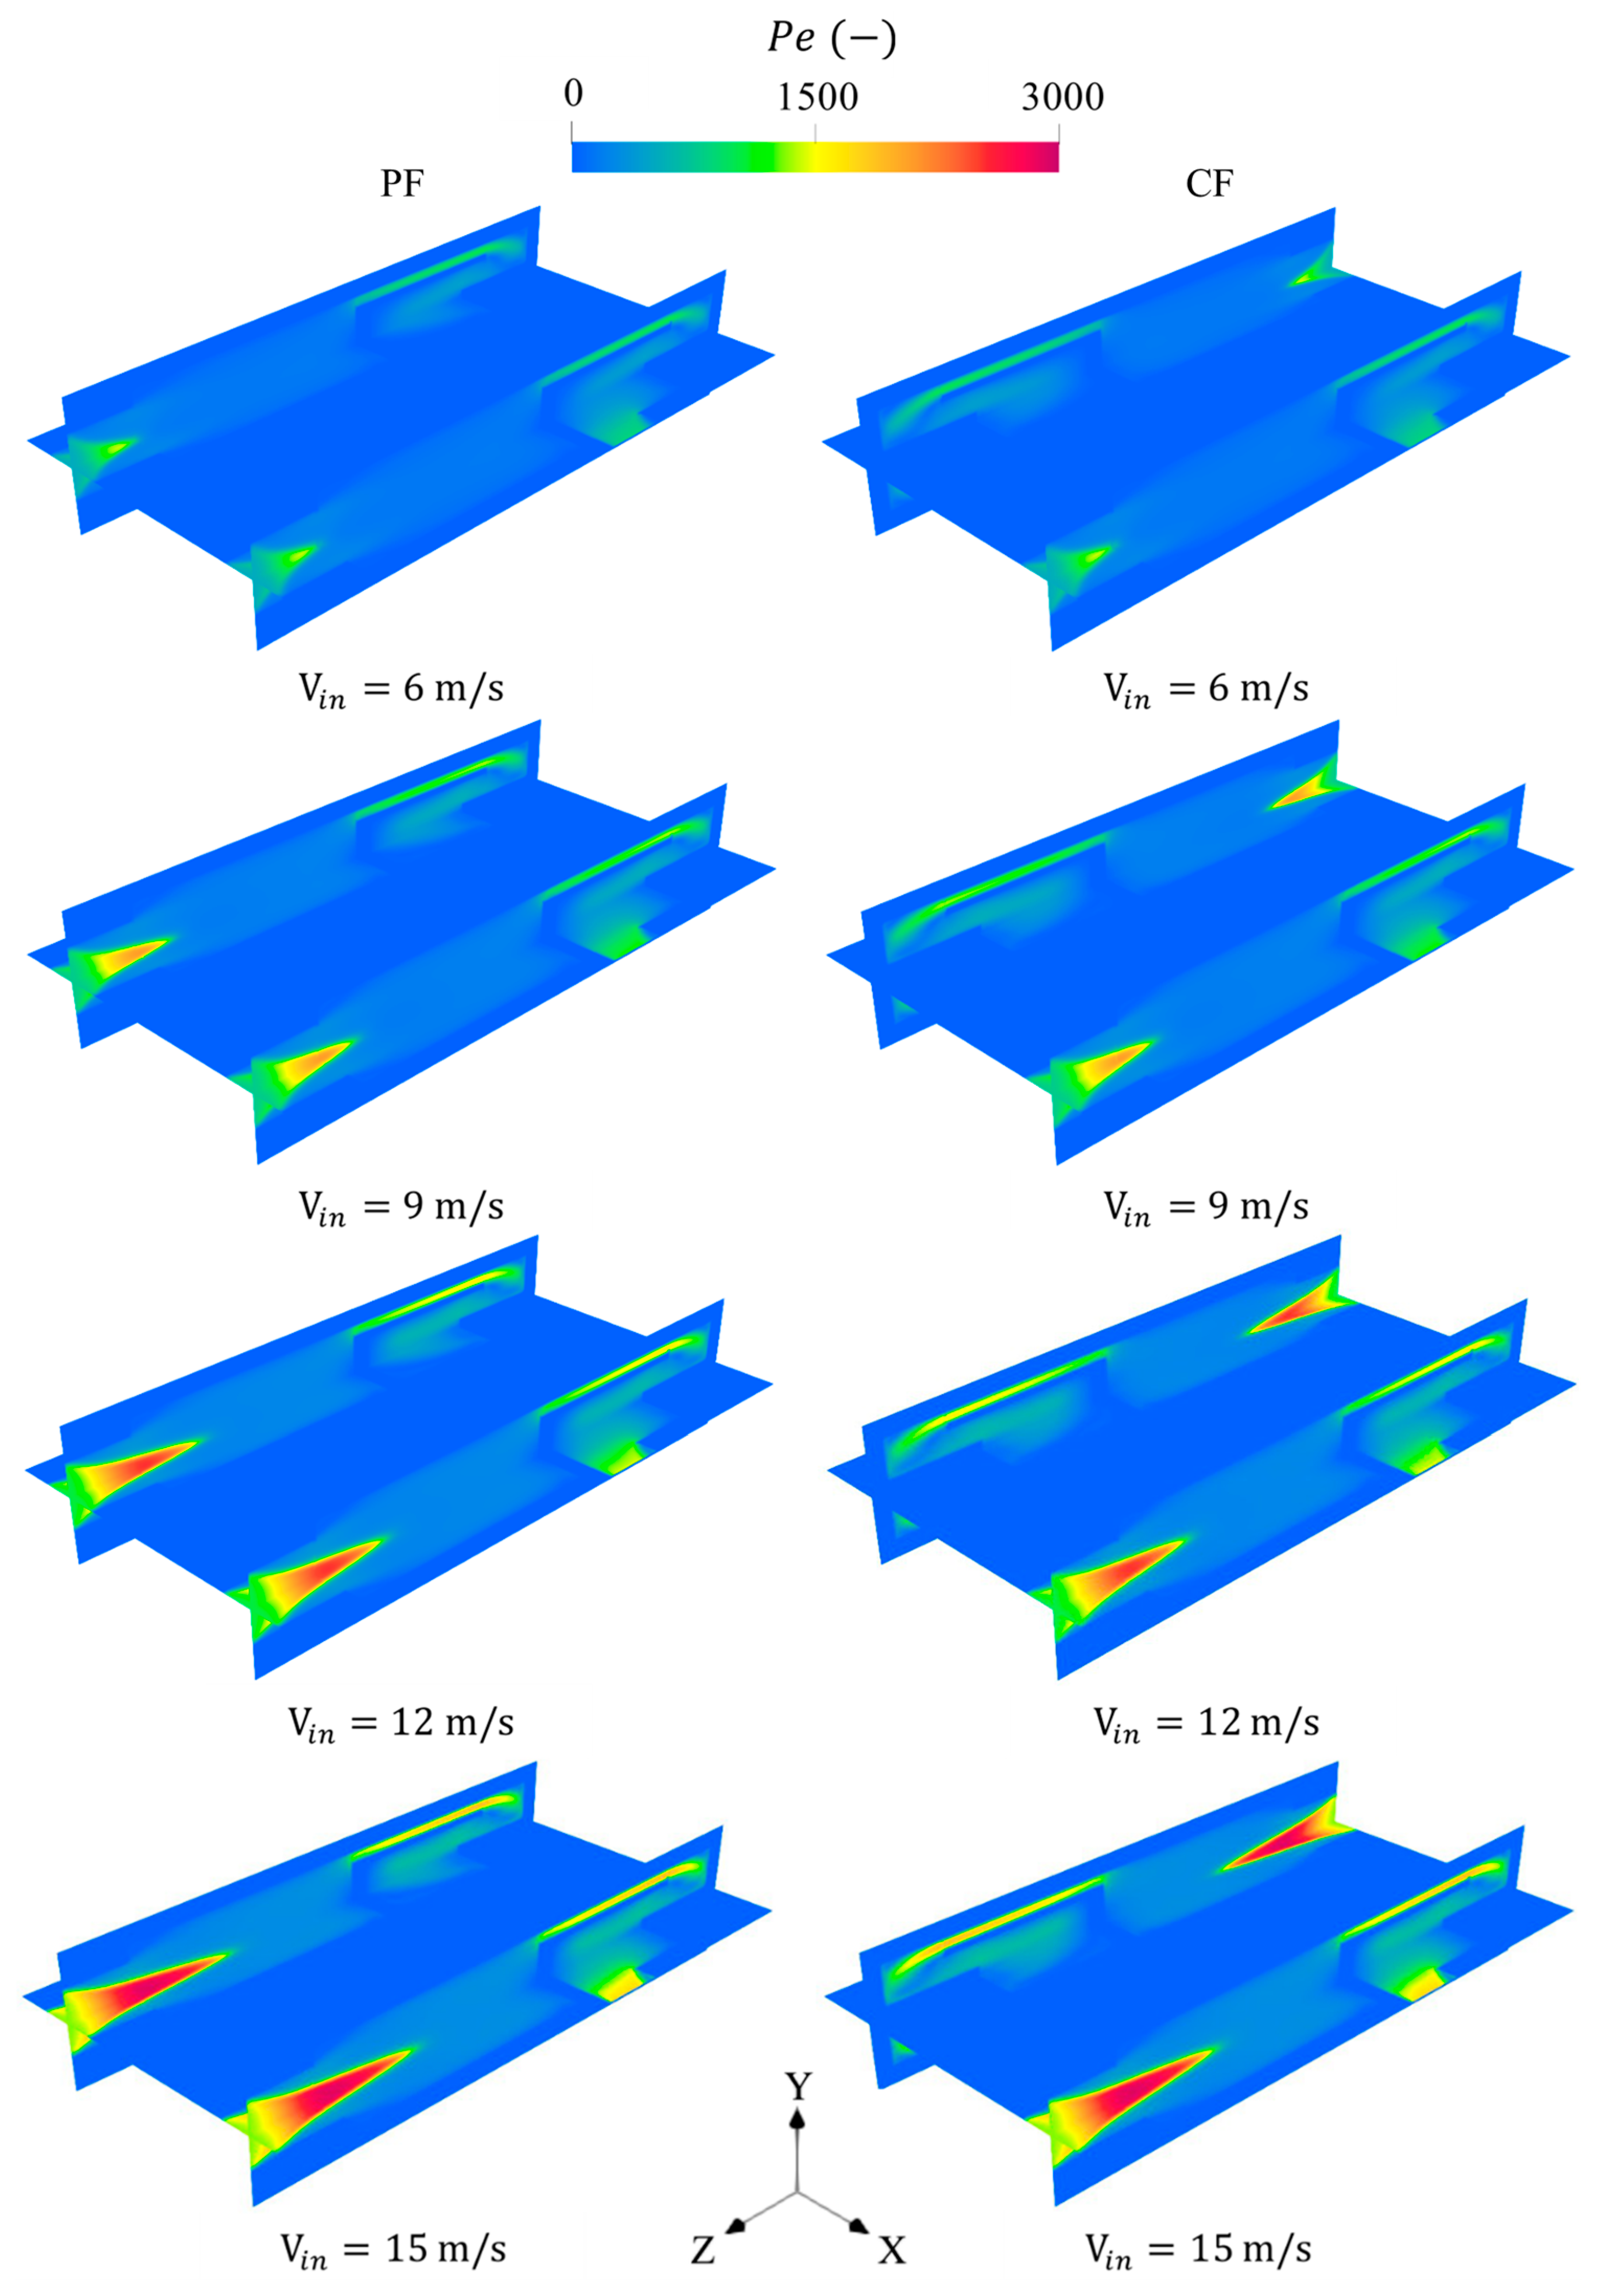
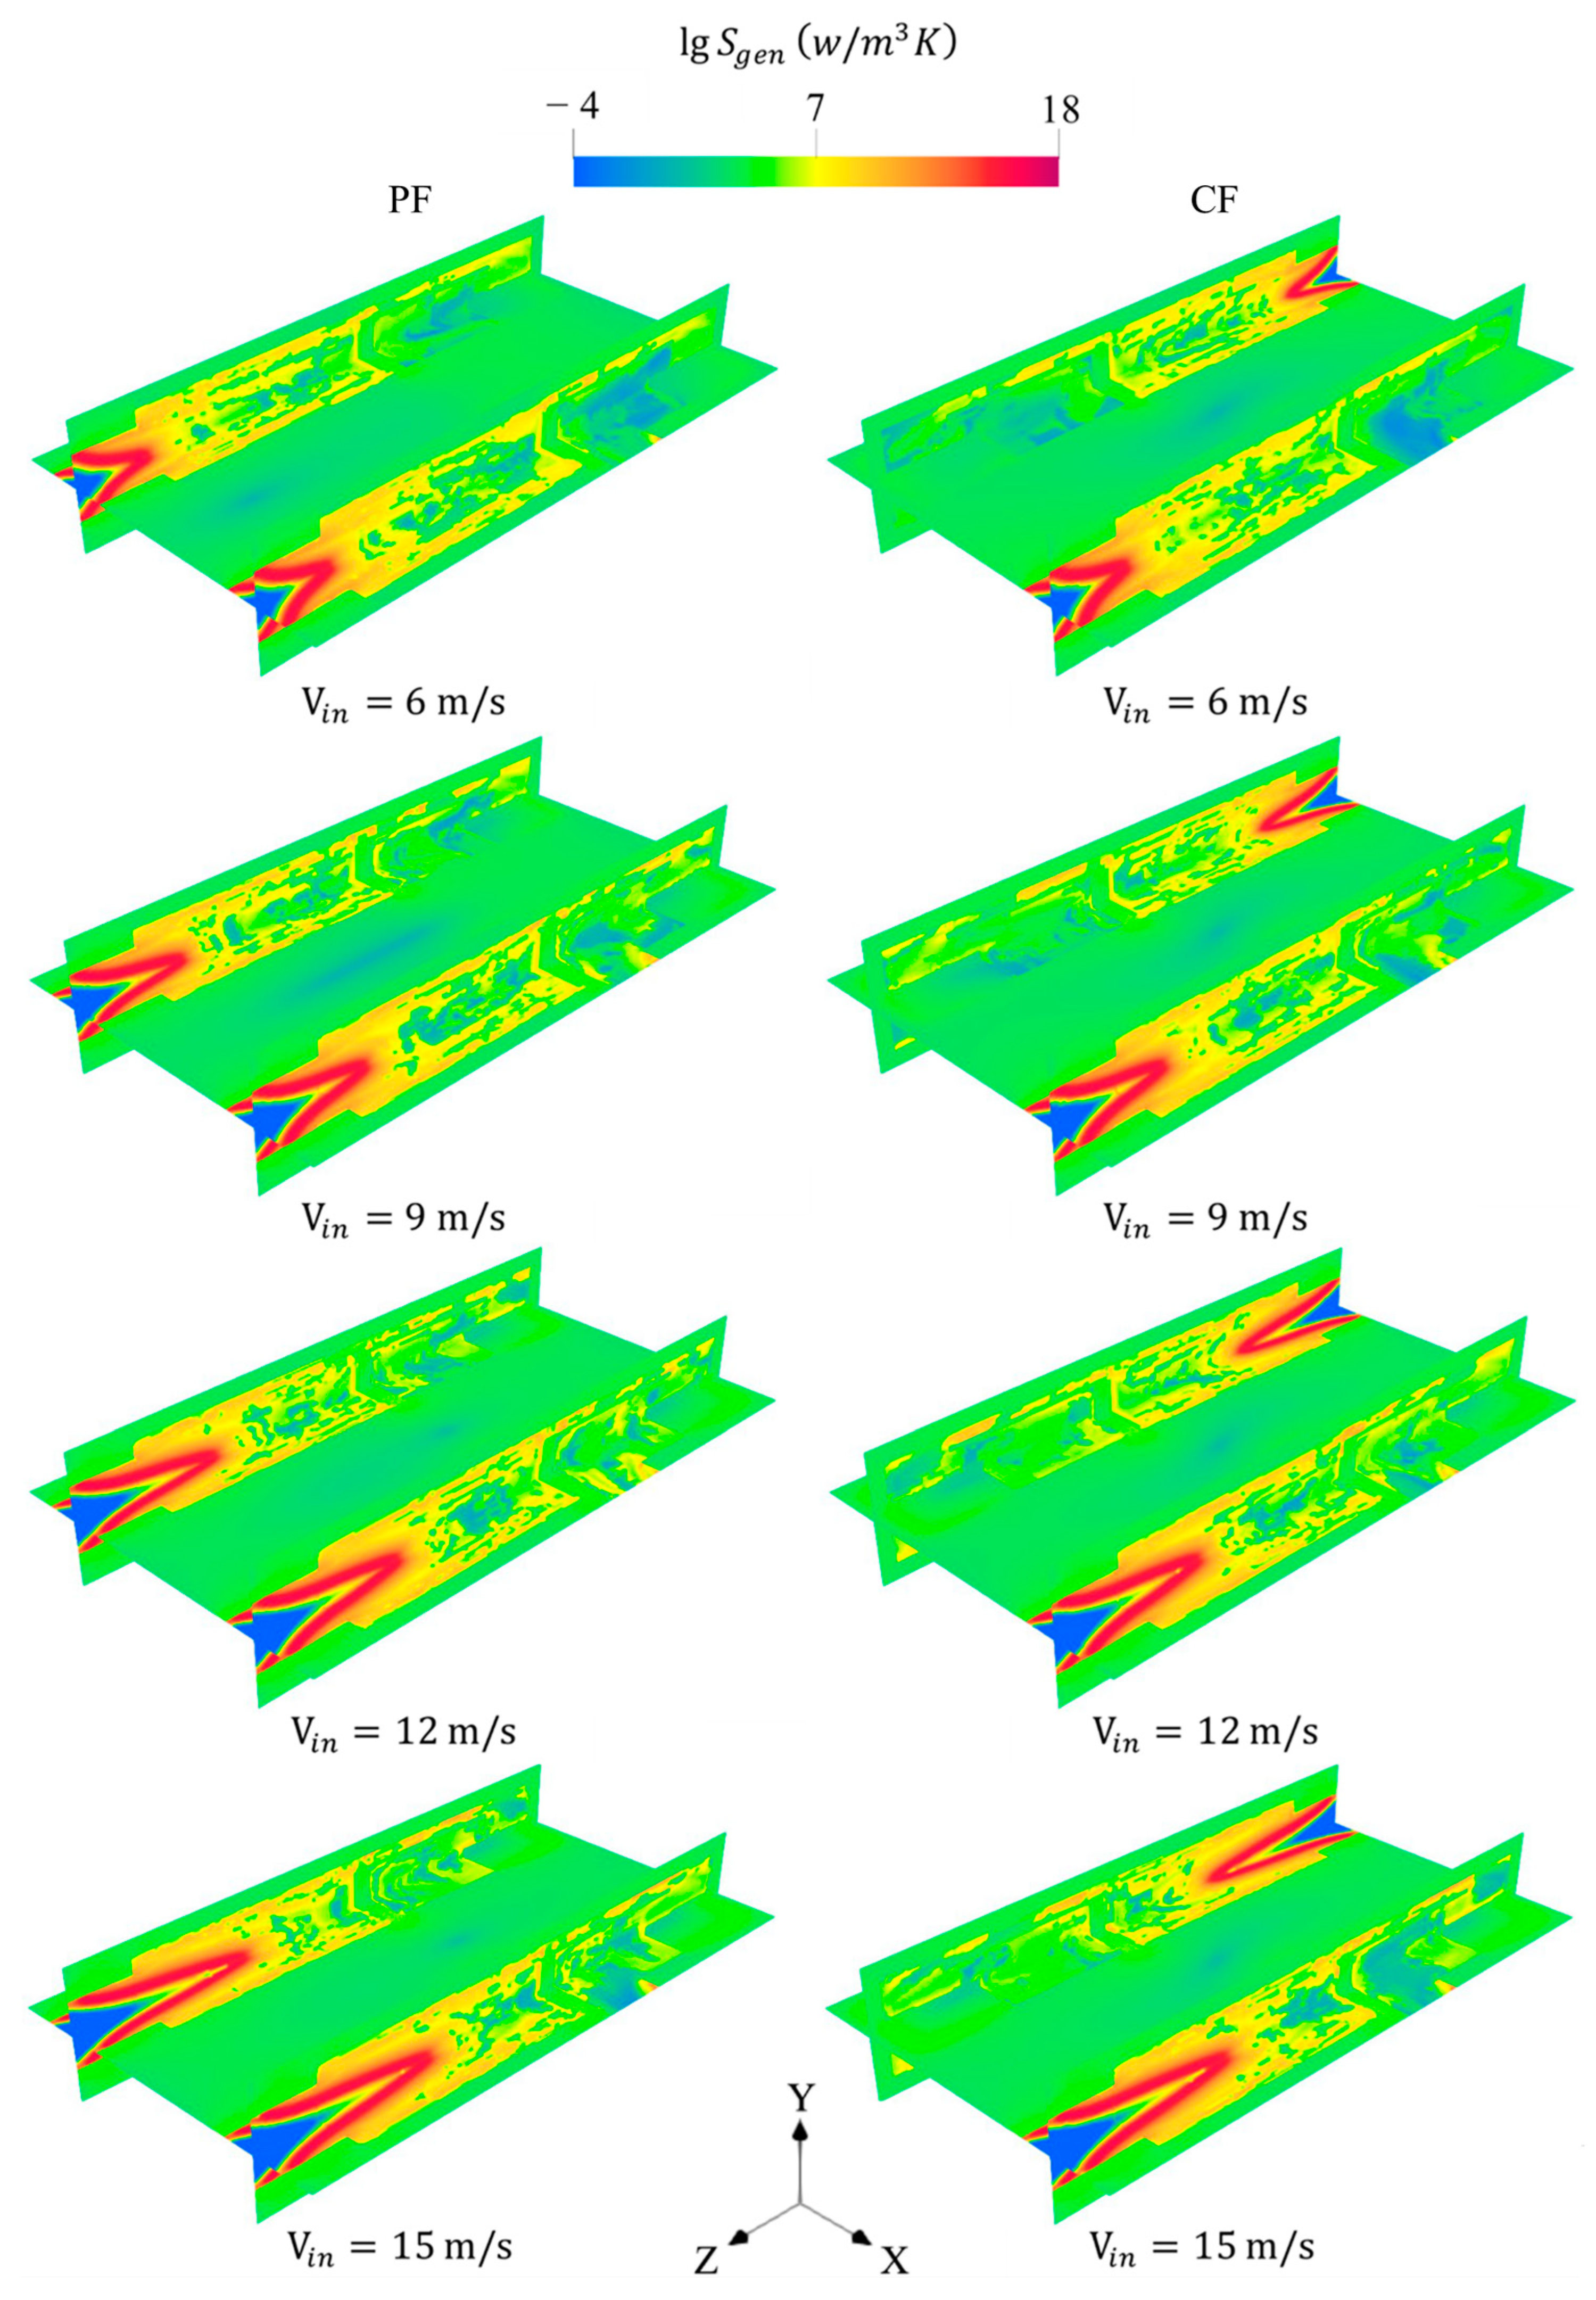
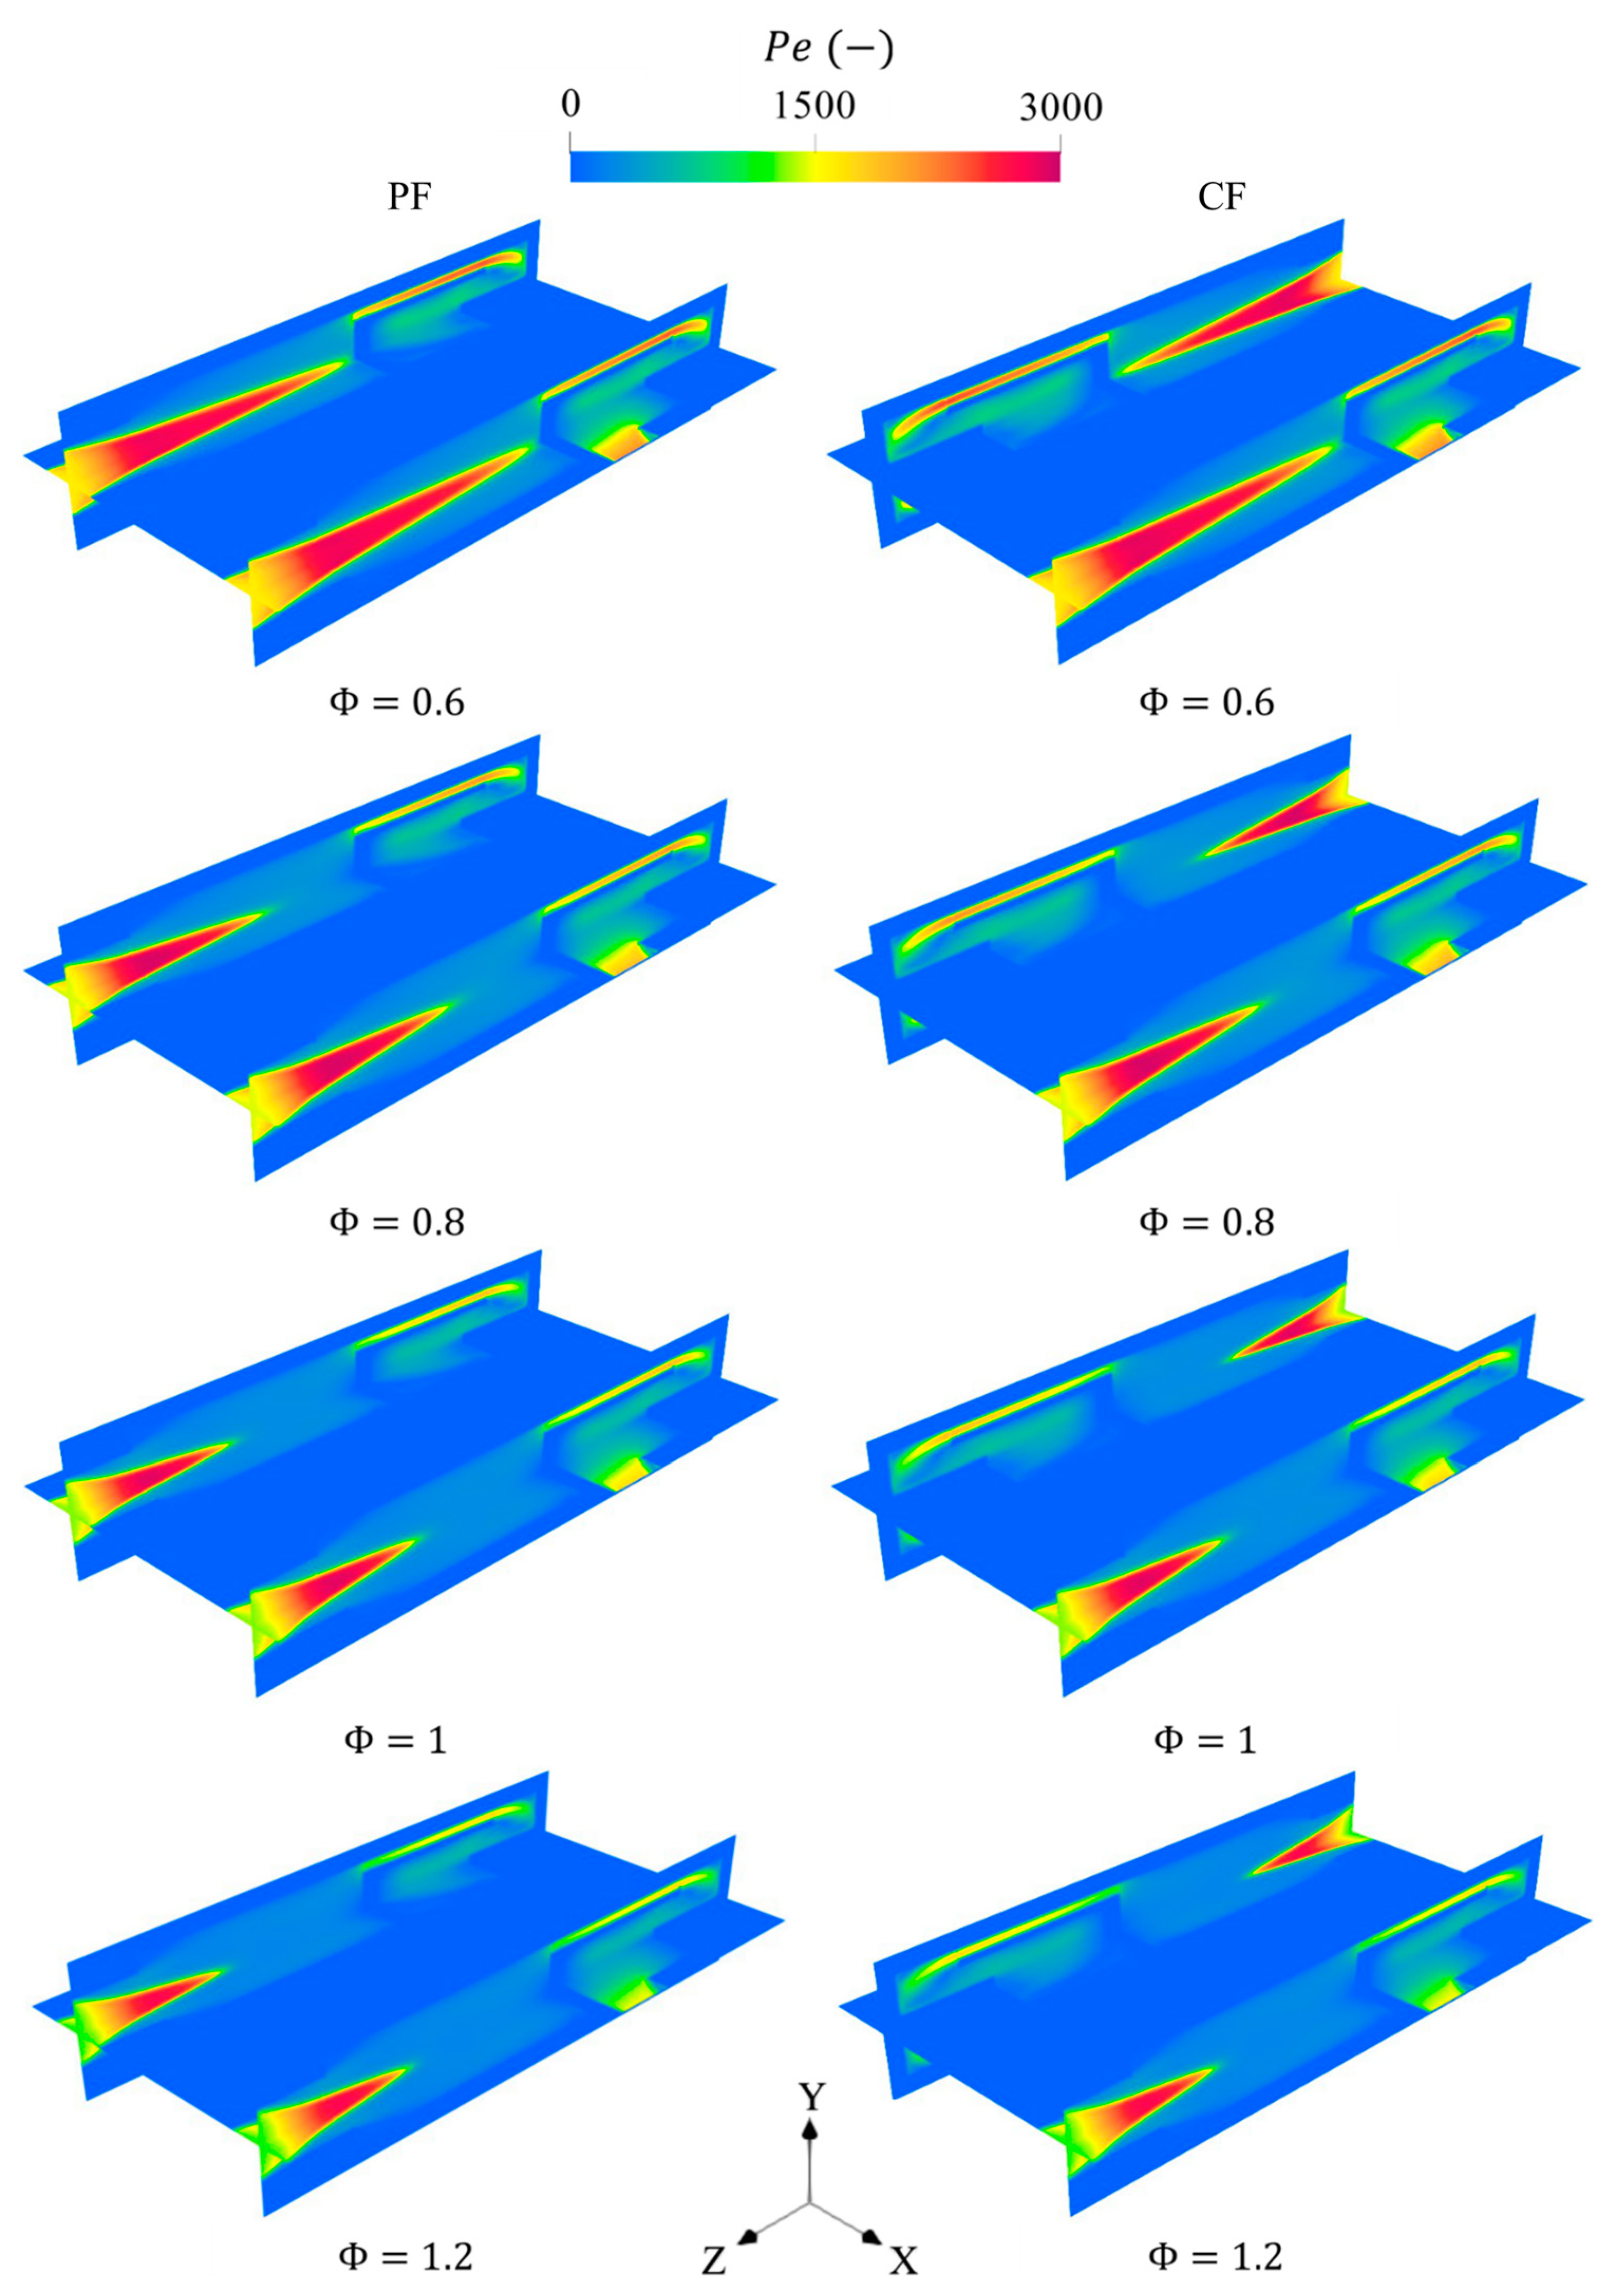
  • The PF and CF structures significantly improve T m w and R T compared to CD structure, indicating enhancements in the rate of absorption of heat produced by combustion by the external walls. This is confirmed by the greater variations in Pe number for the two former cases, implying that the advocation effects dominate over those of diffusion. It is noteworthy that both PF and CF result in pronounced increases in the magnitude of S g e n compared to the CD configuration, indicating high dissipations of energy. However, the PF and CF configurations save more thermal energy, as the T e g values are reduced by 591 K and 580 K compared to the CD configuration, respectively, resulting in higher exergy and radiation efficiencies;
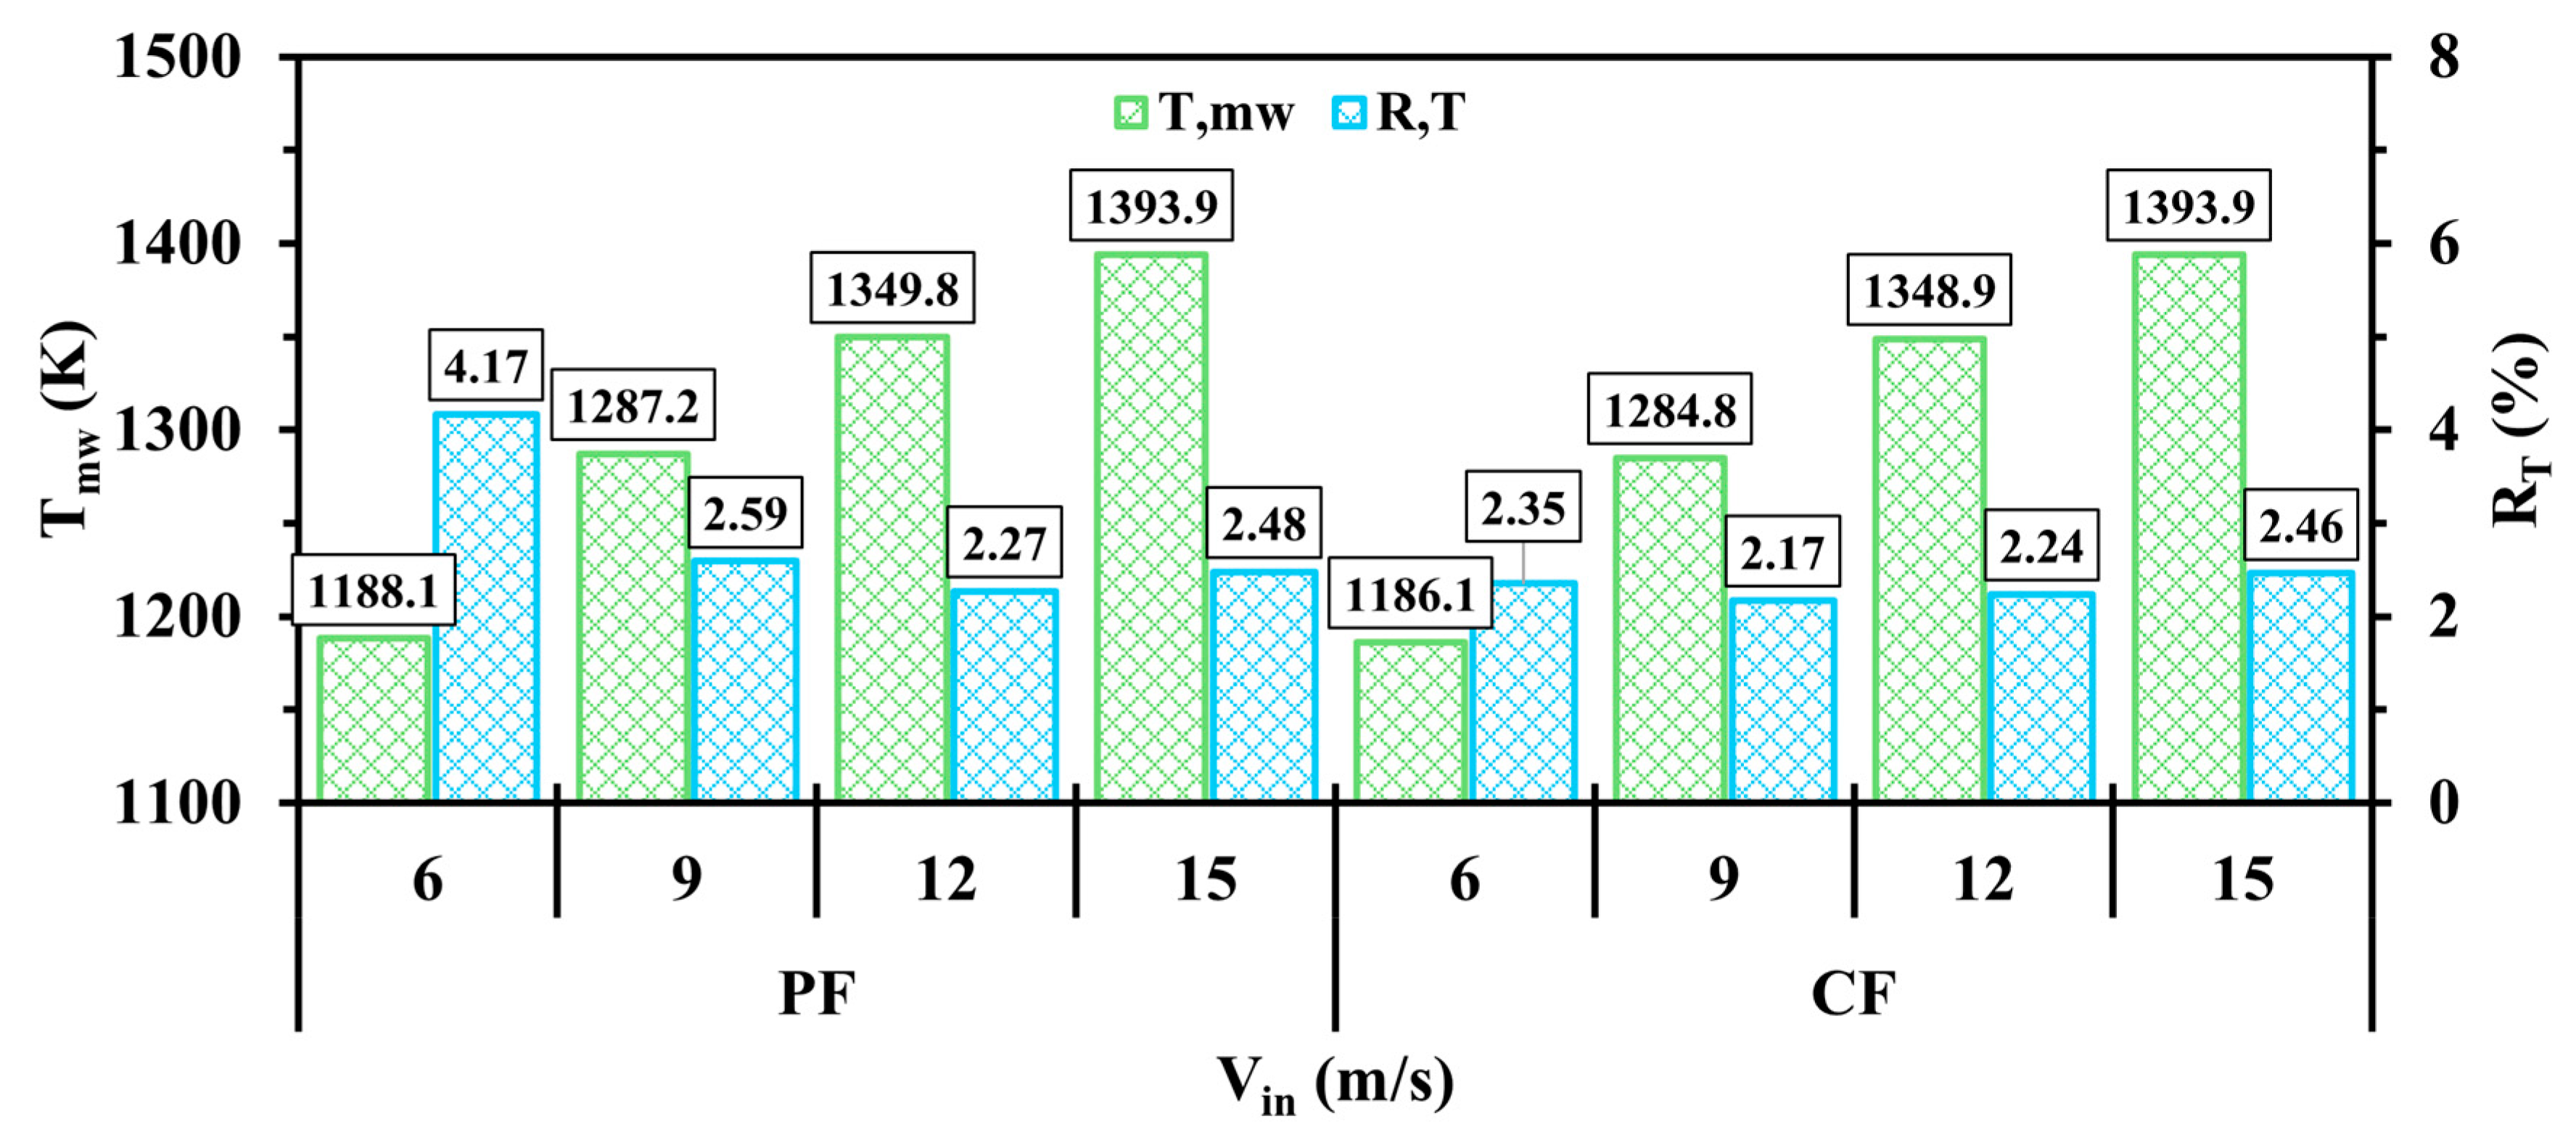
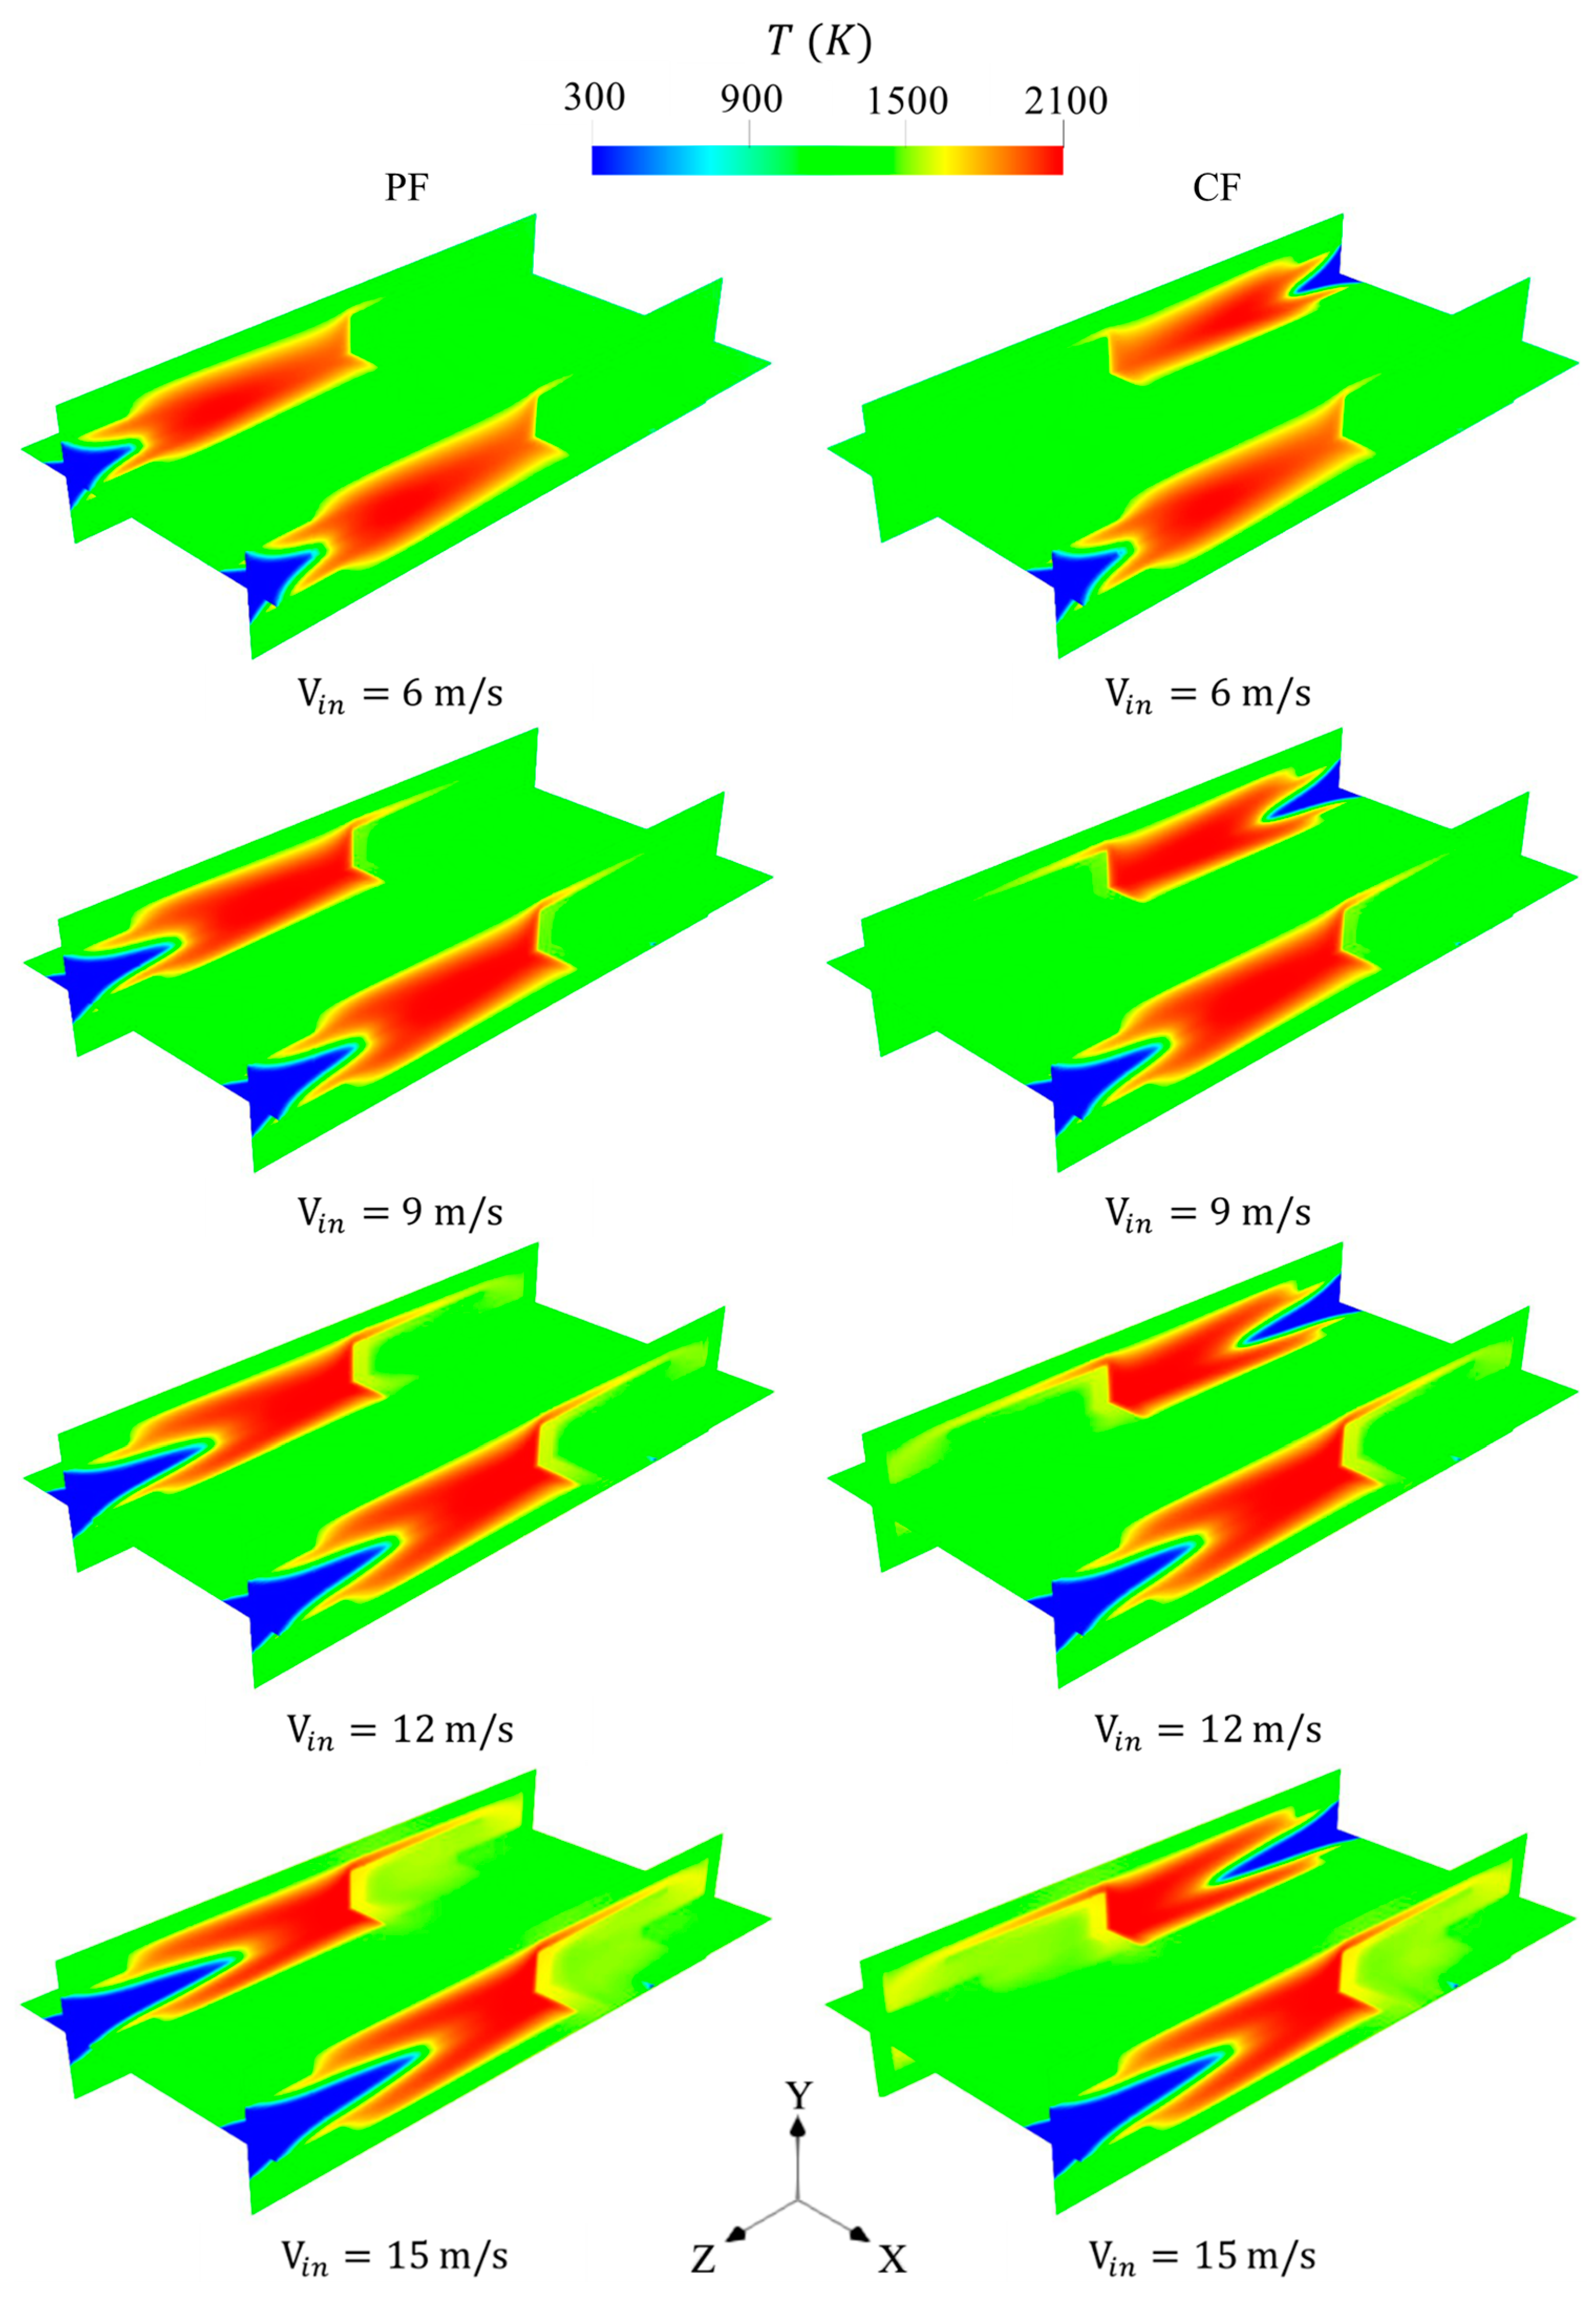
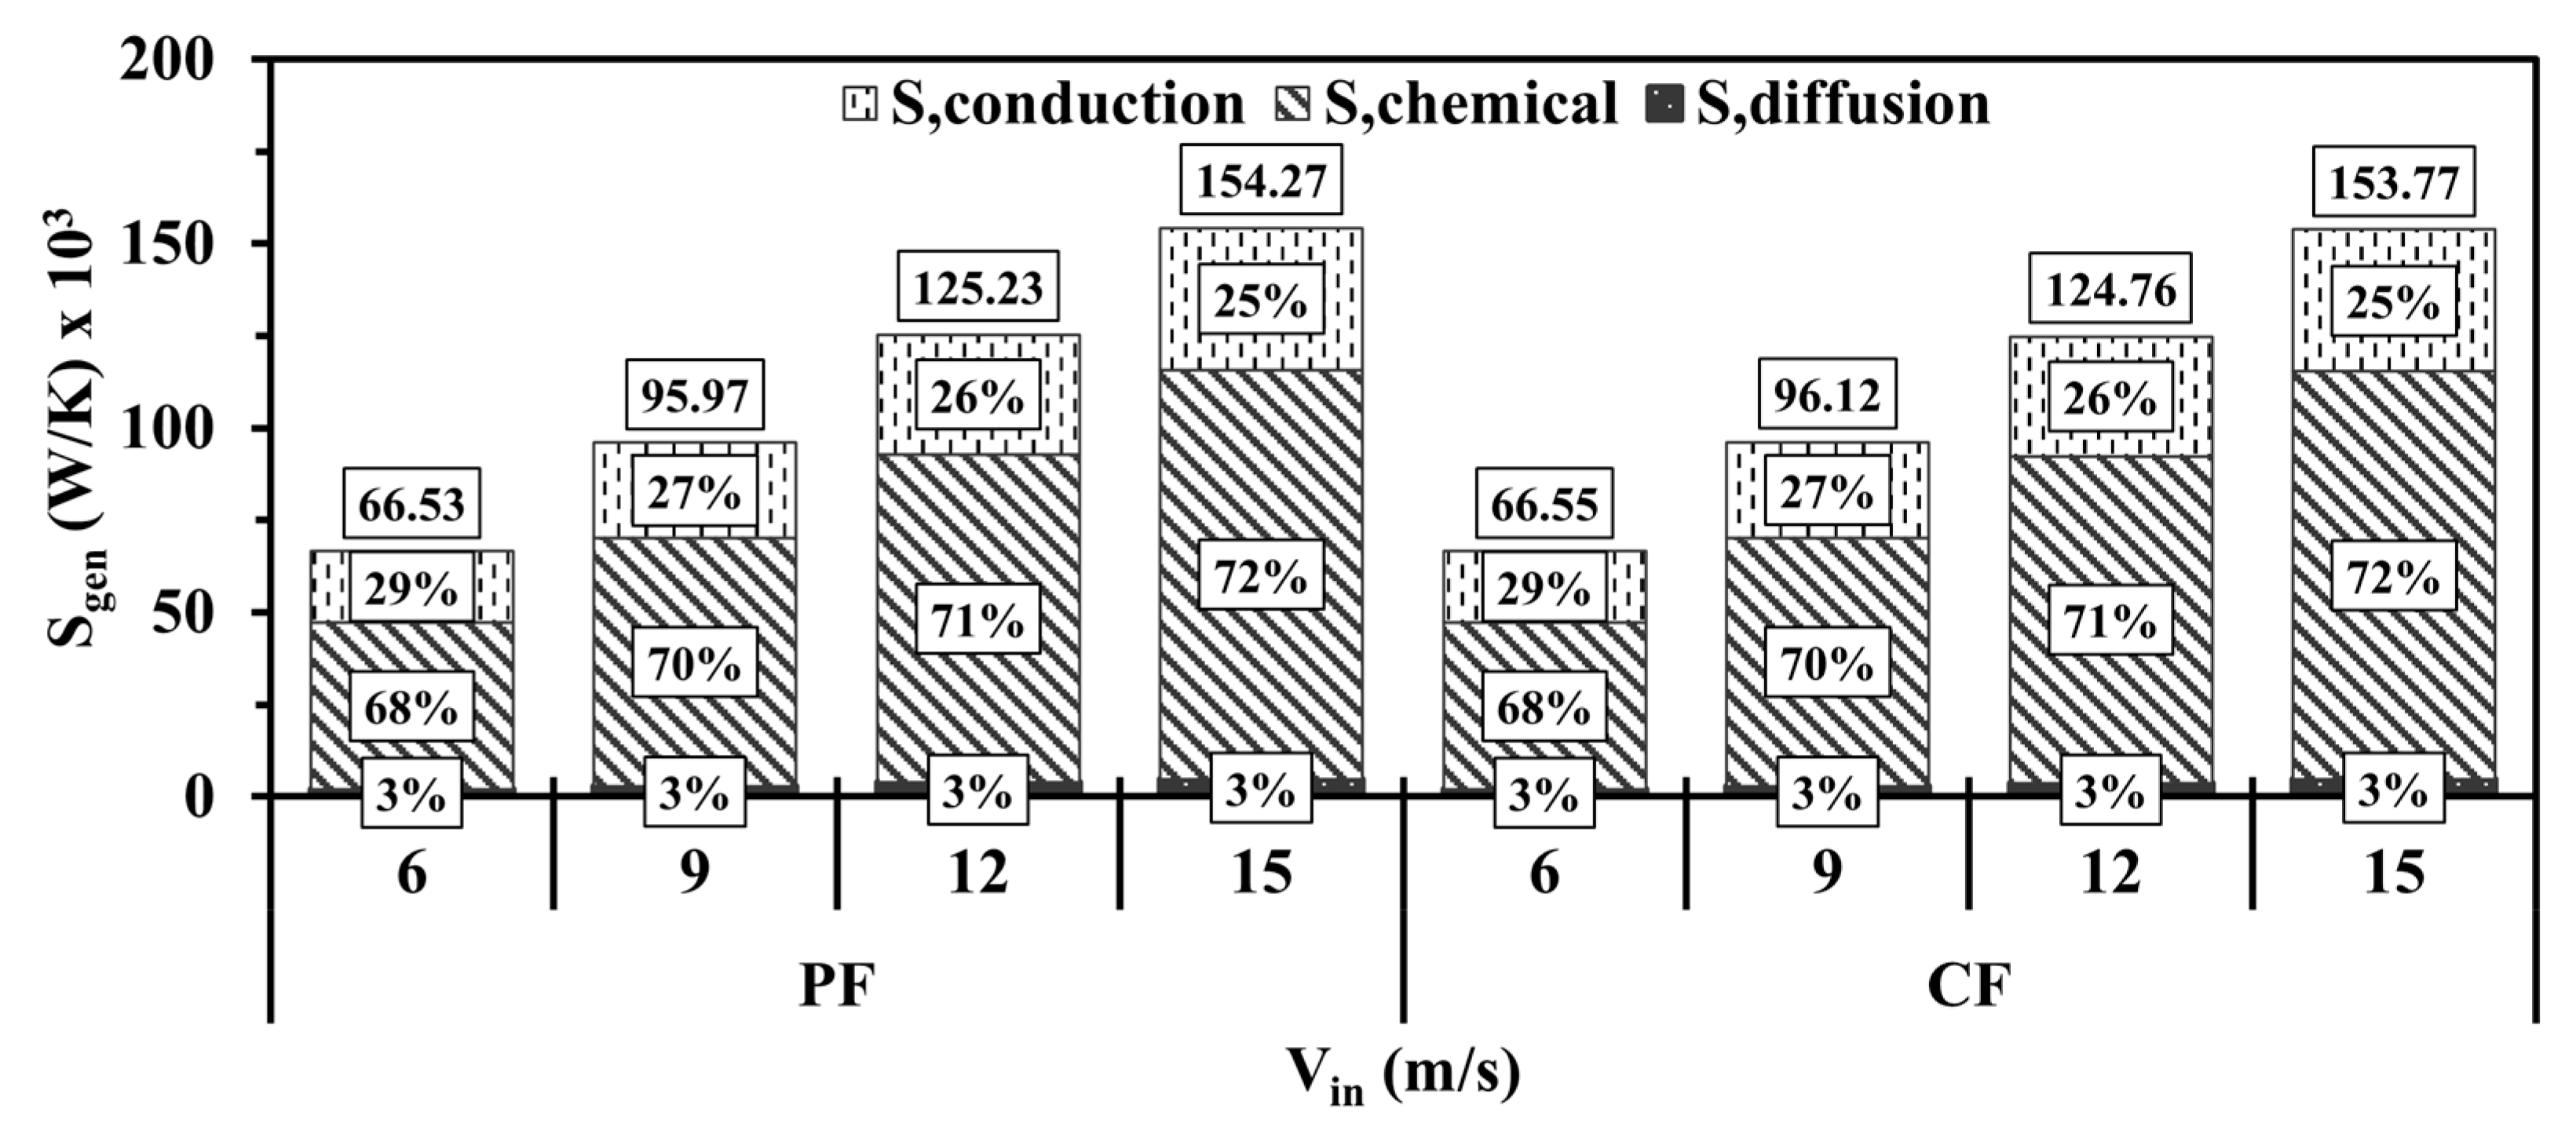
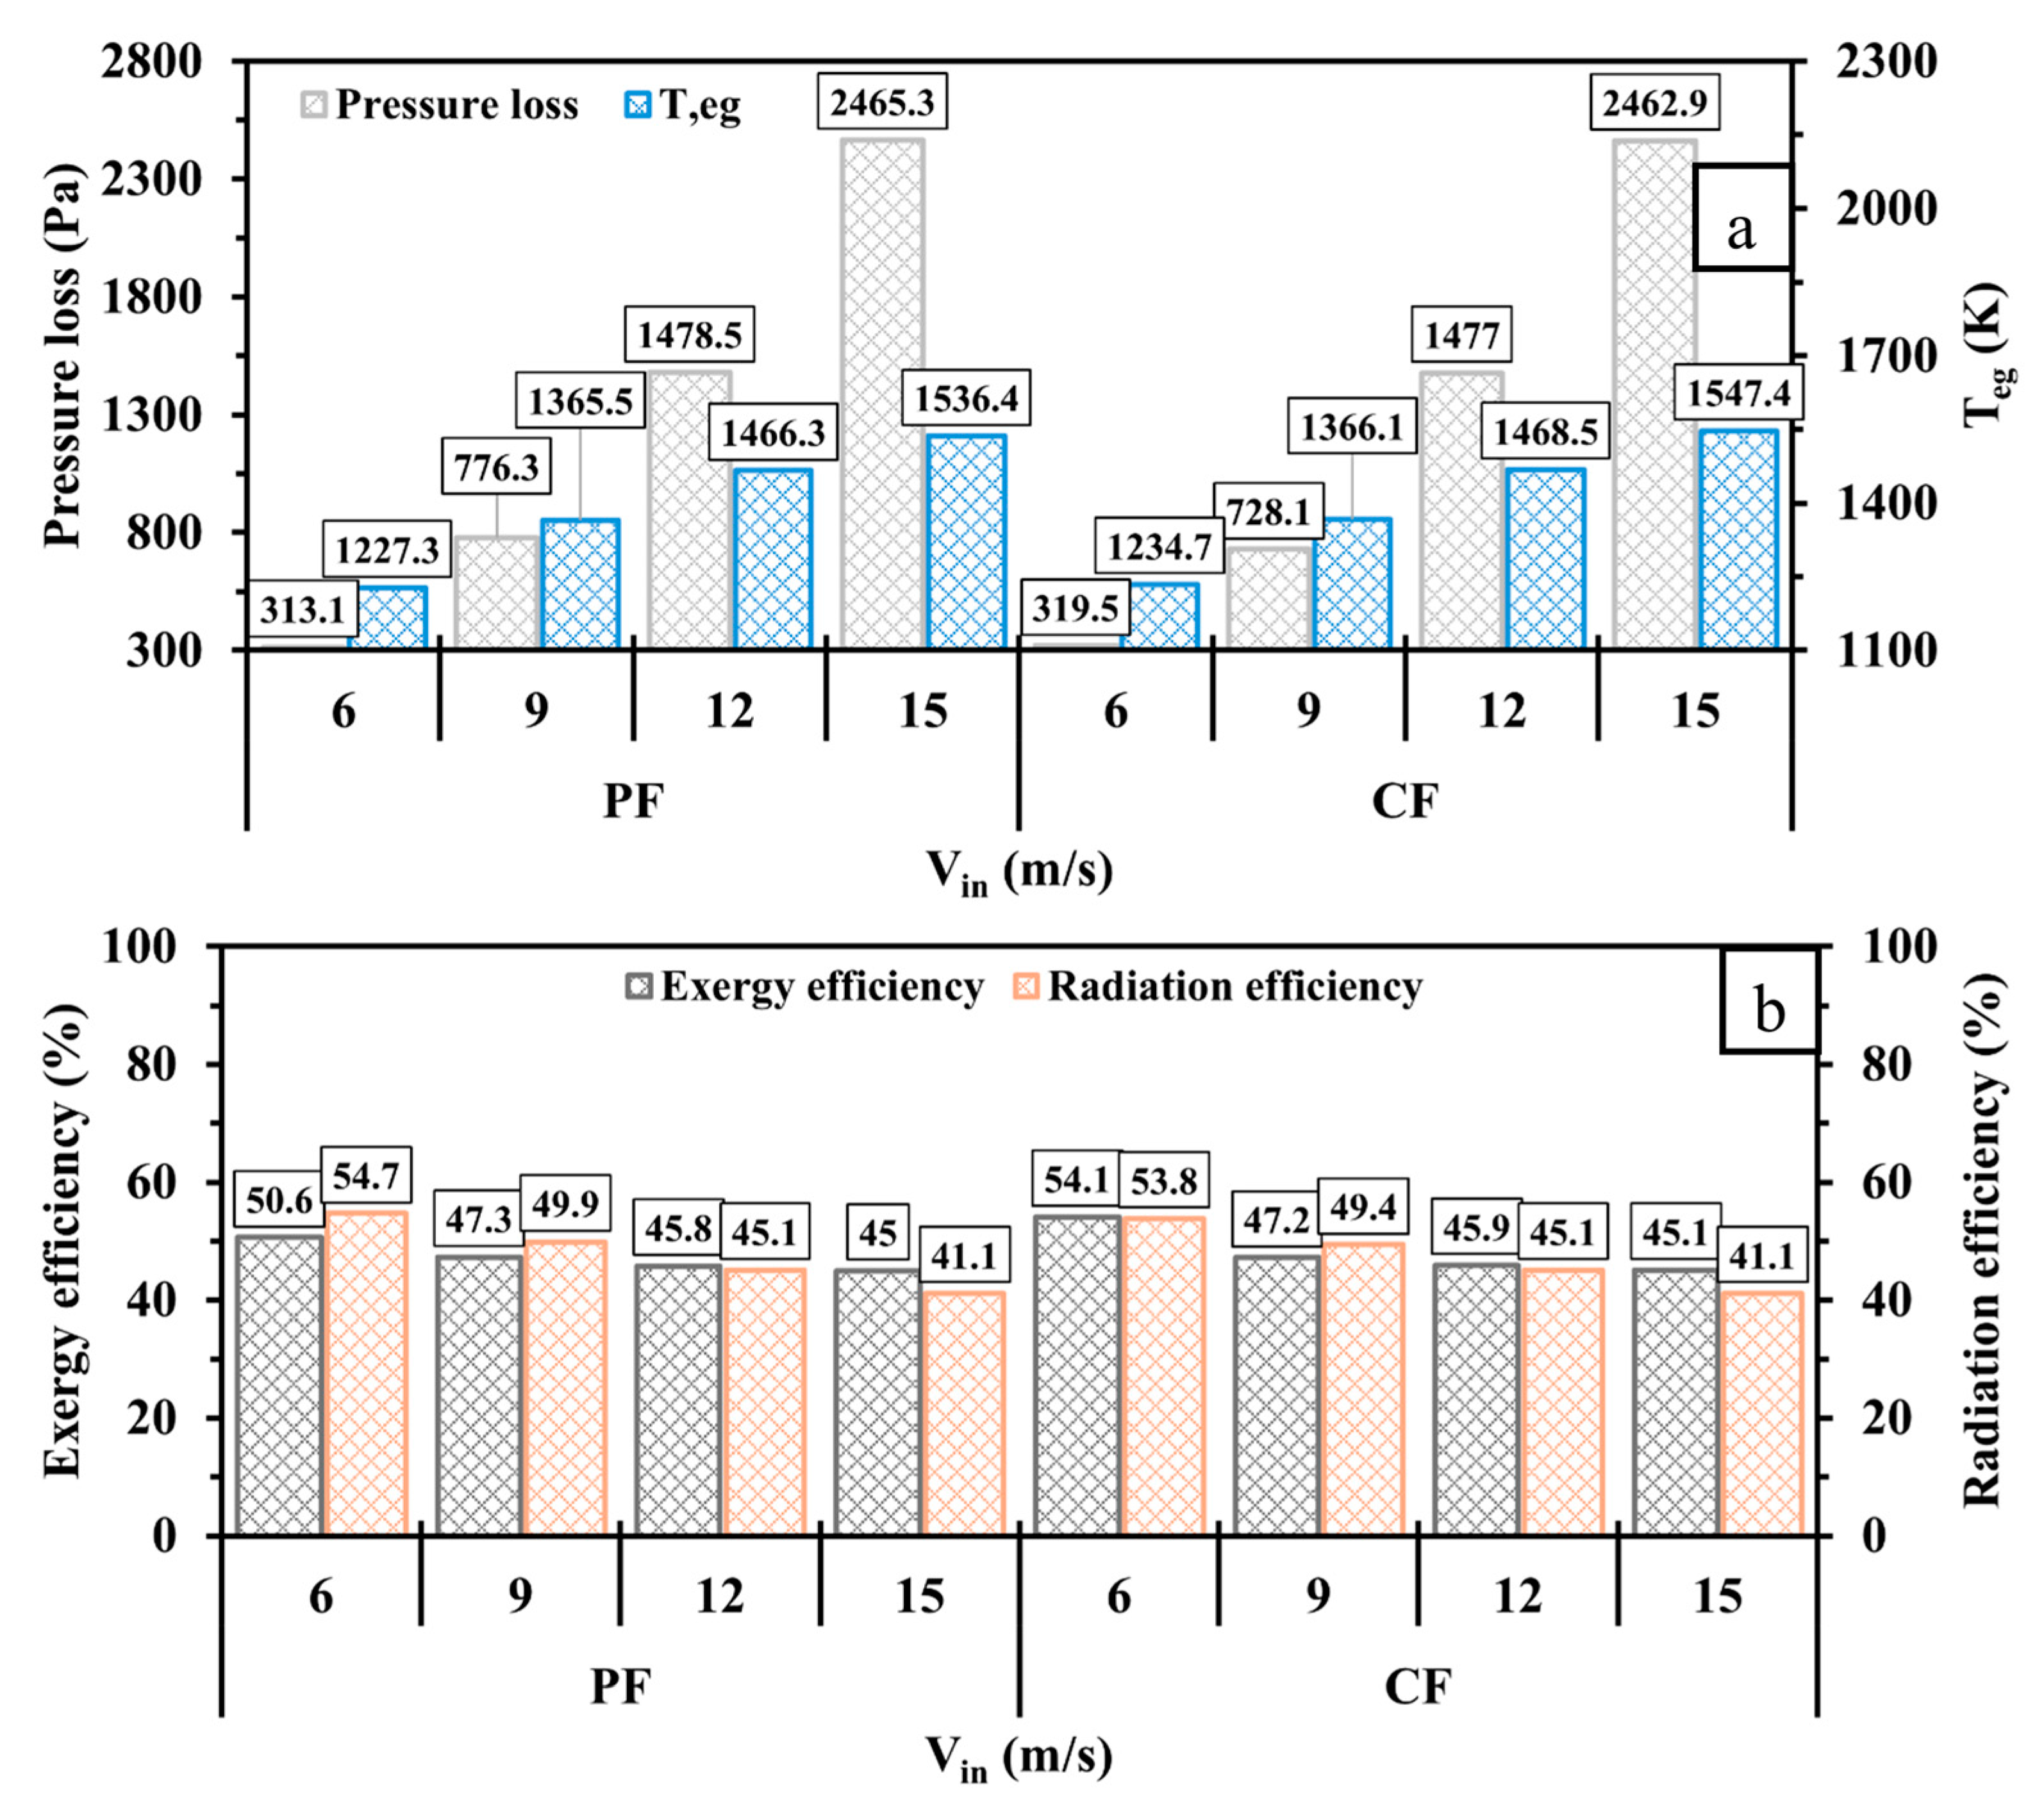
  • Increasing V i n leads to notably advanced T m w values for PF and CF; however, reversing the direction of flow from one inlet in CF provides the optimal R T at a Vin of 9 m/s. Furthermore, the increase in V i n shifts the onset of combustion further downstream, and significantly boosts the S g e n magnitude. It is important to highlight that the chemical entropy generation mechanism is escalated when approaching higher V i n , suggesting intense combustion under such conditions. Nevertheless, altering the V i n value from low to high increases T e g and decreases the exergy and radiation efficiencies due to the low capacity of a combustor at the micro scale to utilize greater input powers;
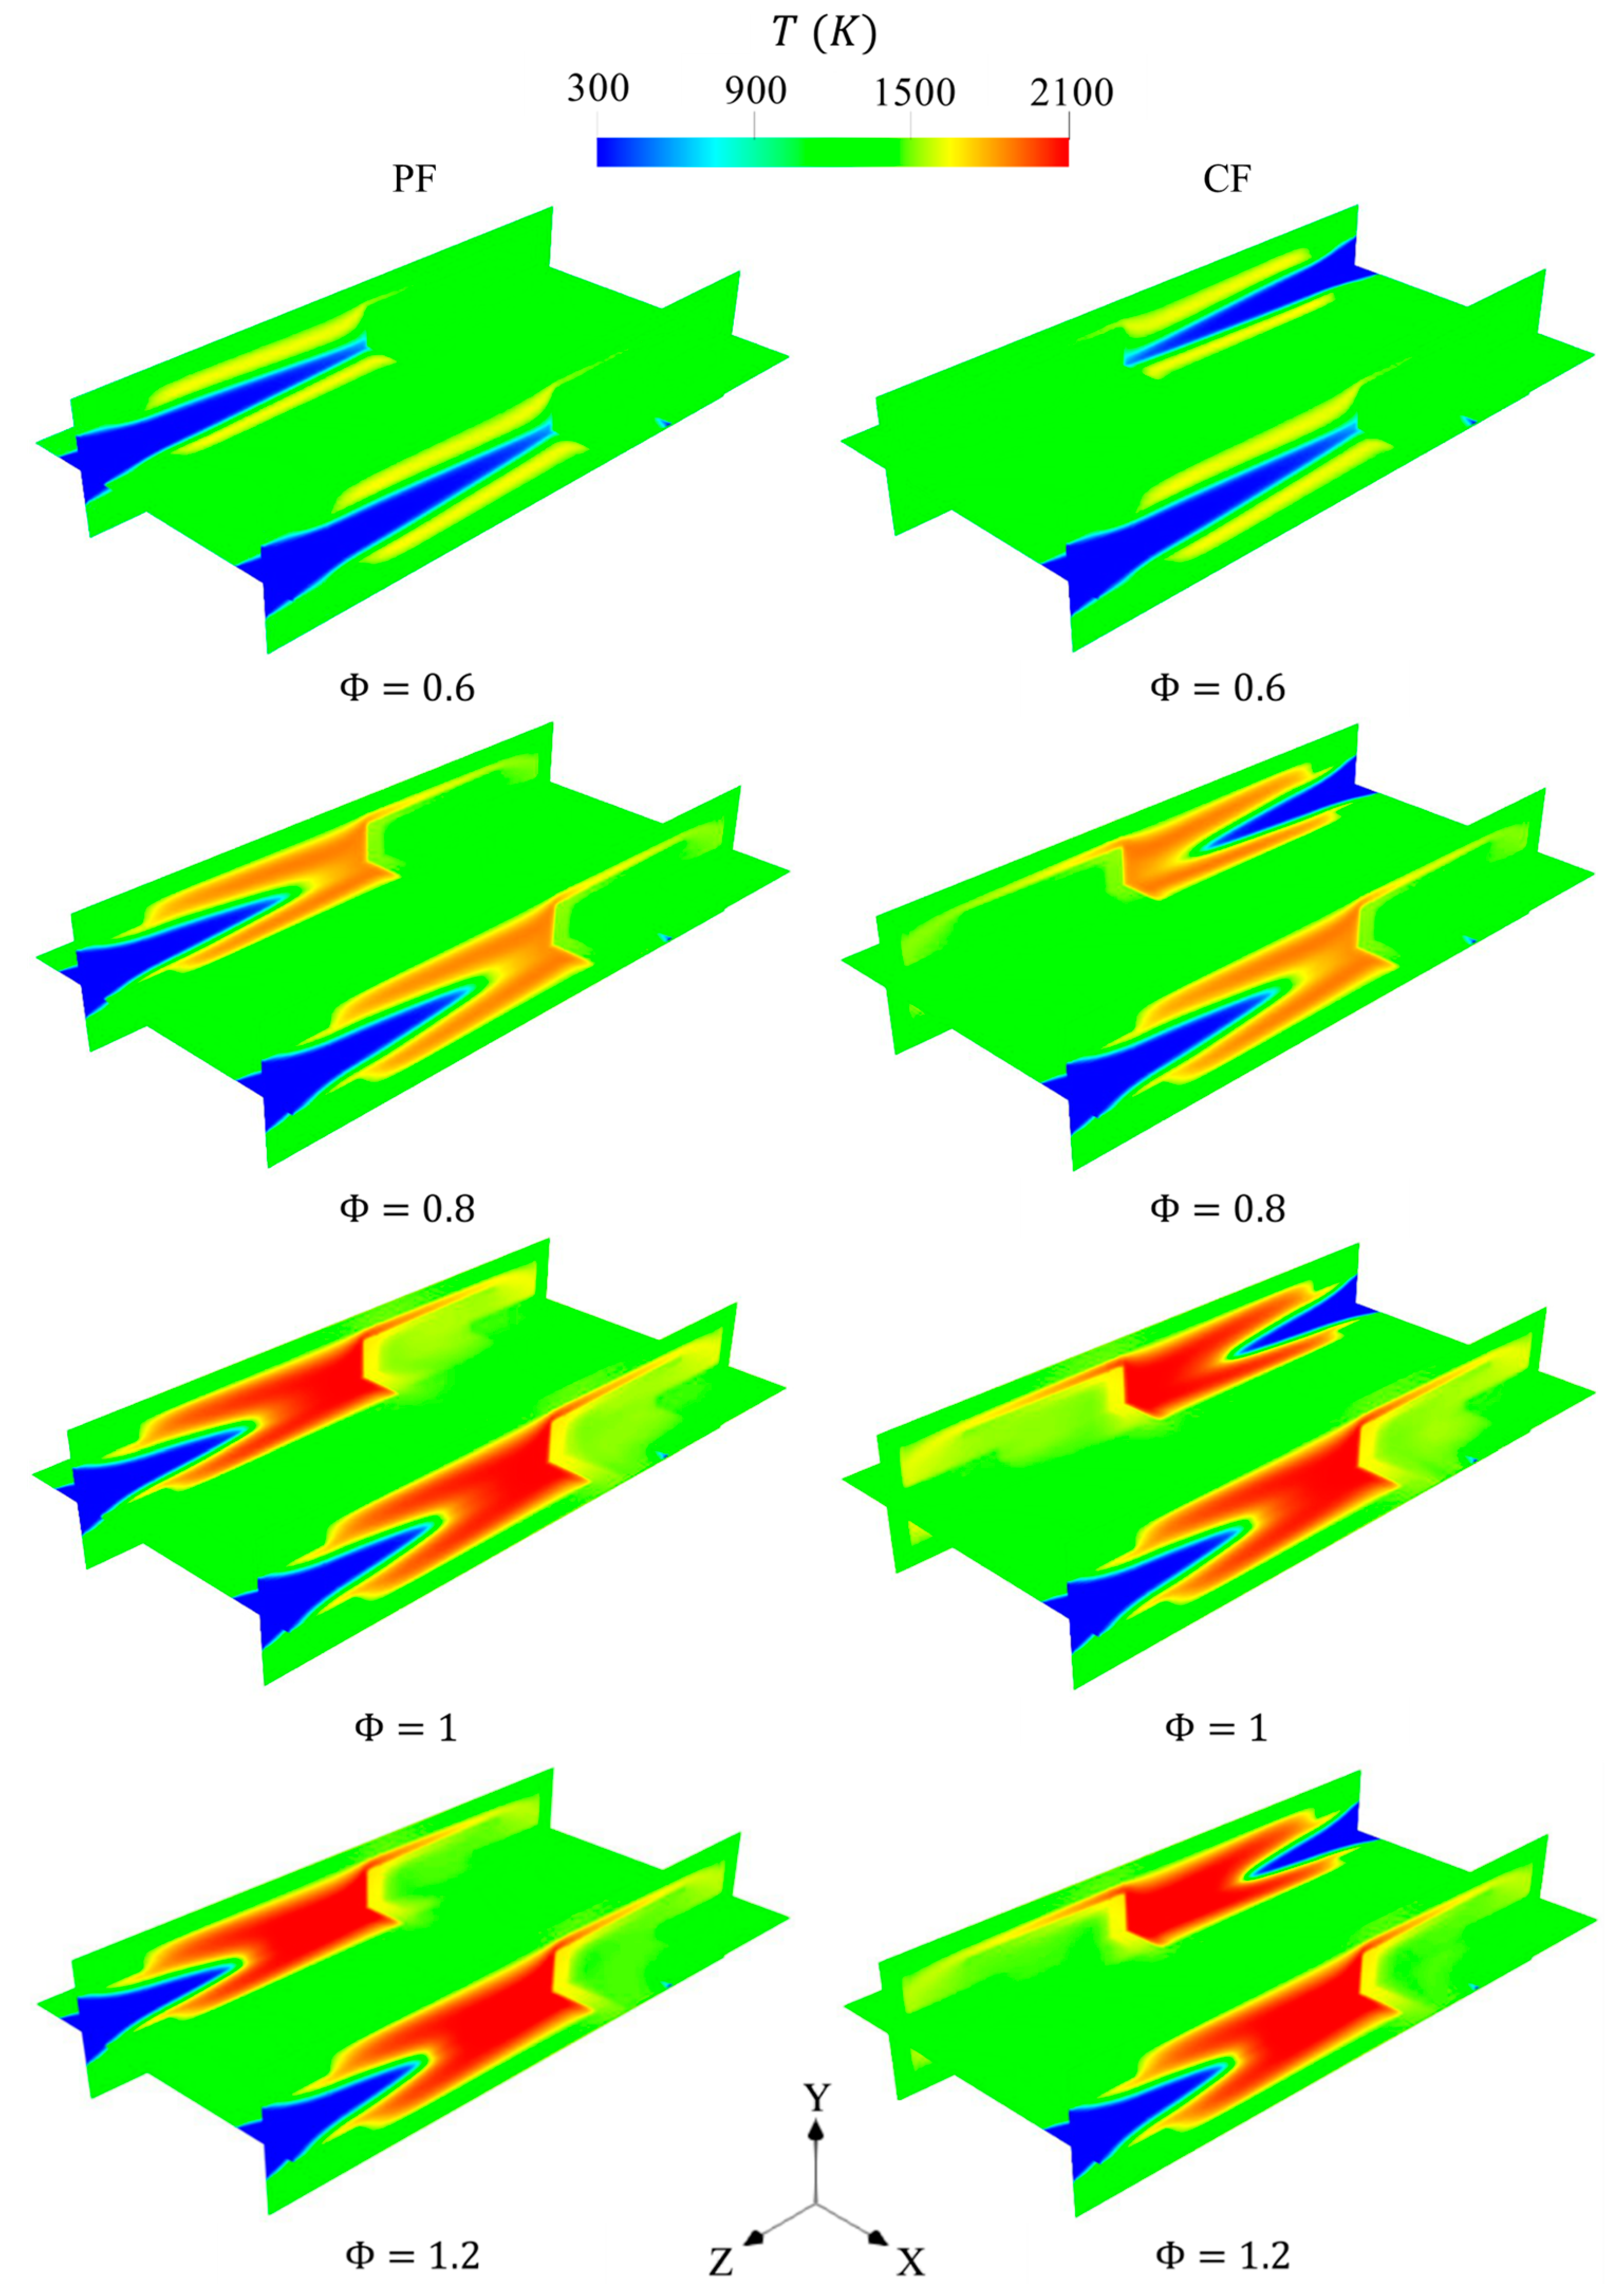
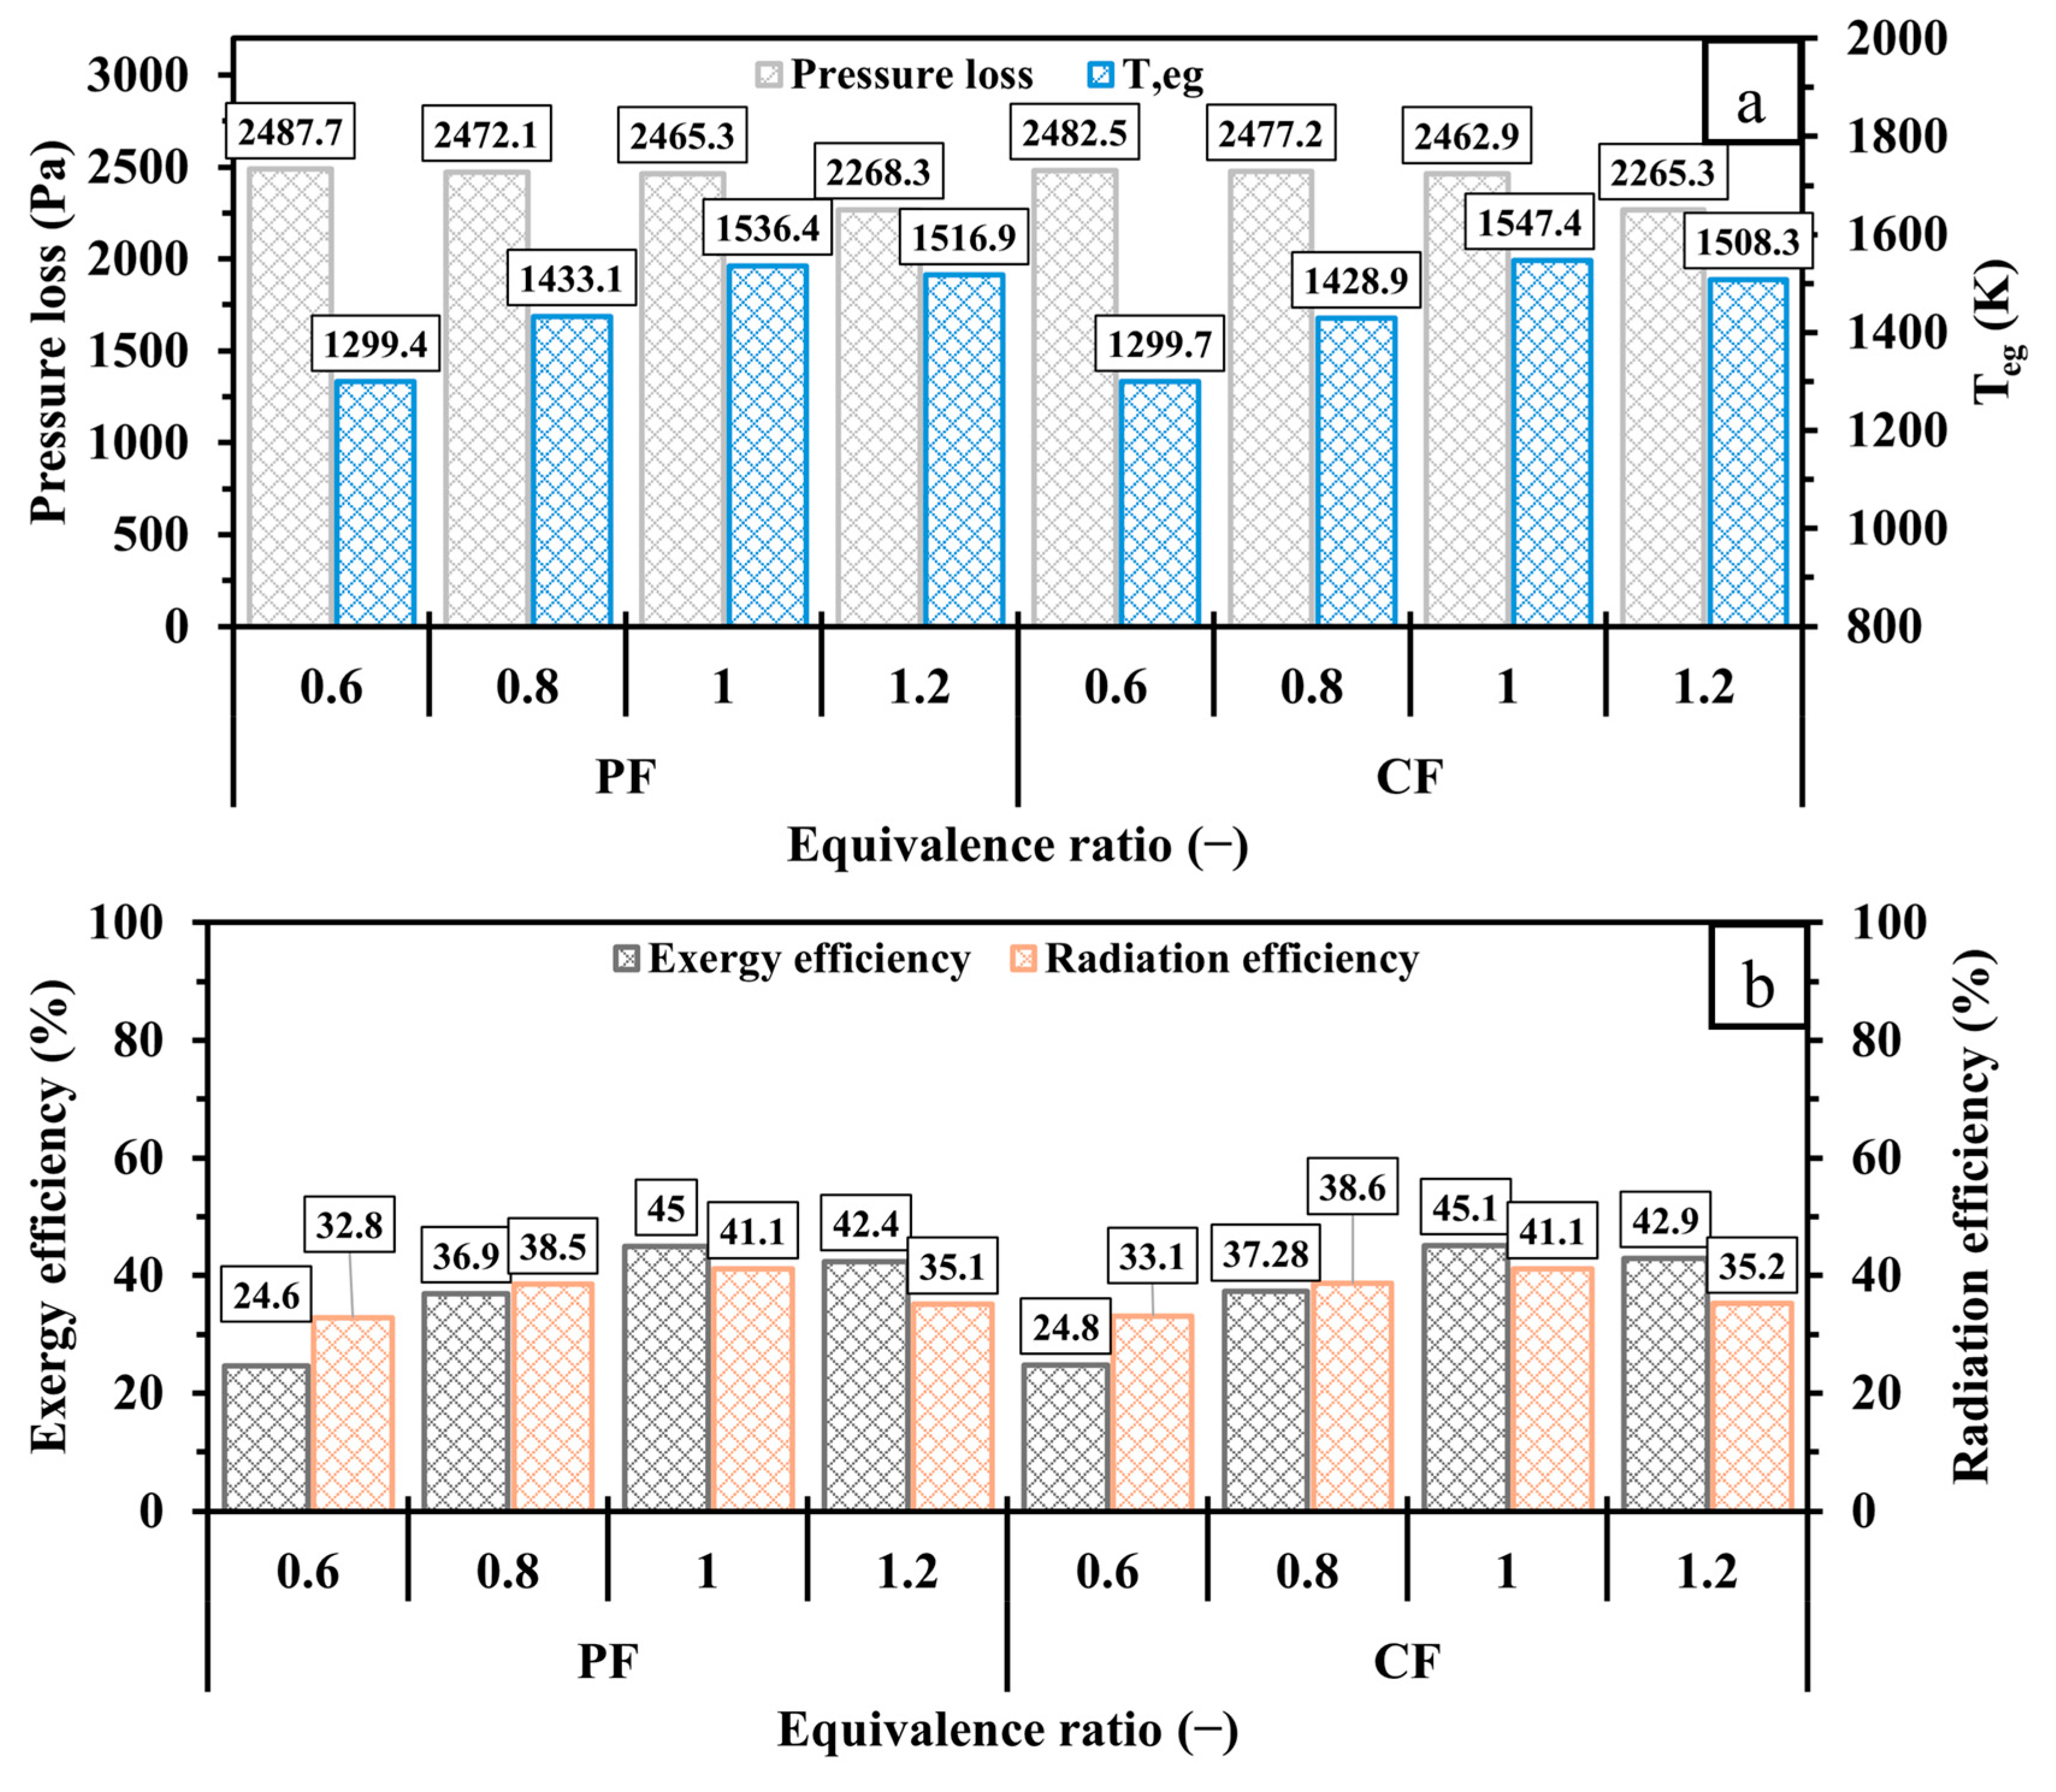
  • For both PF and CF test cases, the T m w and the exergy and radiation efficiencies are improved when increasing Φ from lean to stoichiometric, and are reduced under rich conditions, due to the low consumption rates of oxygen and hydrogen, respectively. This implies that the unity equivalence ratio optimizes the fuel and air ratio. Further, the vigorous chemistry in the highlighted case enhances S g e n and T e g . In comparison with PF, CF shows relatively better R T in most states of Φ owing to the equal amounts of thermal energy released from opposite sides of the micro combustor.

Funding

This work was supported by the Deanship of Scientific Research, King Faisal University, Saudi Arabia [Grant No.: KFU251361].

Data Availability Statement

The data presented in the study are included in the article; further inquiries can be directed to the corresponding author.

Acknowledgments

The author gratefully thanks the Deanship of Scientific Research at King Faisal University (Saudi Arabia) for supporting this research as a part of the Research Grants Program [Raed Grant No.: KFU251361]. The author also would like to gratefully acknowledgment King Abdullah University of Science and Technology (KAUST) for their support in permitting the use of the high-end computing facilities to conduct the numerical investigations.

Conflicts of Interest

The author declares that he has no known competing financial interests or personal relationships that could have appeared to influence the work reported in this paper.

Abbreviations

The following abbreviations are used in this manuscript:
E Total total energy of the fluid ( J · kg 1 )
P e Peclet number ( )
R i Reaction net rate of production of species i
h Natural convection heat transfer coefficient ( W · m 2 · K 1 )
v Vector velocity ( m · s 1 )
Q r a d Heat losses by radiation ( W )
Q c o n Heat losses by convection ( W )
k e f f Effective thermal conductivity ( W · m 2 · K 1 )
Y i Local mass fraction of species i  ( )
S h Source term of enthalpy ( W · m 3 )
k m i x Mixture thermal conductivity ( W · m 1   K 1 )
A c External wall surface area ( m 2 )
A i External wall area of cell i  ( m 2 )
J j Diffusion flux of species j (mol·m−2·s−1)
S g e n d i f f u s s i o n Mass diffusion mechanism of entropy generation ( W · K 1 )
S g e n c h e m i c a l Chemical reaction of entropy generation ( W · K 1 )
S g e n c o n d u c t i o n Heat conduction of entropy generation ( W · K 1 )
S g e n t o t a l Total entropy generation ( W · K 1 )
s ¯ n o Entropy of species i at reference conditions ( J · kg 1 · K 1 )
h ¯ n o Enthalpy of species i at reference conditions ( J · kg 1 )
E x i n Inlet exergy (W)
E x d e s Uncounted exergy destruction (W)
E x e g Total exergy losses ( W )
E x l o s s Energy loss from the combustion exhaust gas ( W )
R T Wall temperature uniformity ( % )
P Pressure (Pa)
P a t m Atmospheric pressure ( 101 , 325   Pa )
TiOuter wall temperature of cell i  ( K )
T e g Exhaust gas temperature ( K )
T w , m Area-weighted mean wall temperature ( K )
T Ambient temperature ( K )
T w Temperature of external wall ( K )
R Gas constant ( J · kg 1   K 1 )
DiMass diffusivity of species i  ( m 2 · s 1 )
C p   Specific heat capacity ( J · kg 1   K 1 )
V Velocity (m·s−1)
Q L H V   Lower heating value ( MJ · kg 1 )
m ˙ f u e l   Fuel mass flow rate ( kg · s 1 )
m ˙ i n l e t   Inlet stream mass flow rate ( kg · s 1 )
h j Specific nthalpy of species j  ( J · kg 1 )
Greek letters
ρ Mixture gas density ( kg · m 3 )
τ Viscous stress ( N · m 2 )
τ Reynolds stress ( N · m 2 )
μ i Chemical potential of species i  ( J · kg 1 )
ω i Mass fraction of species, i
η e x e r g y Exergy efficiency ( % )
η r a d i a t i o n Radiation efficiency ( % )
σ Stephan–Boltzmann constant ( 5.67 × 10 8   W · m 2 K 4 )
ε Emissivity of the solid surface
λ Thermal conductivity ( W · m 1   K 1 )
γ i Production rate of species i  ( mol · L 1 · s 1 )
Φ Equivalence ratio ( )
χ i Mole fraction of species, i

References

  1. Chircov, C.; Grumezescu, A.M. Microelectromechanical Systems (MEMS) for Biomedical Applications. Micromachines 2022, 13, 164. [Google Scholar] [CrossRef]
  2. Percy, J.J.; Kanthamani, S. Revolutionizing Wireless Communication: A Review Perspective on Design and Optimization of RF MEMS Switches. Microelectron. J. 2023, 139, 105891. [Google Scholar] [CrossRef]
  3. Bai, S.; Ding, R.; Chirarattananon, P. A Micro Aircraft with Passive Variable-Sweep Wings. IEEE Robot. Autom. Lett. 2022, 7, 4016–4023. [Google Scholar] [CrossRef]
  4. Ding, J.; E, J.; Cai, L.; Luo, B.; Li, J. Development of a Reaction Mechanism of Hydrogen Production through Rich Methane-Acetylene Blending in a Porous Medium Micro-Combustor. Energy Convers. Manag. 2025, 325, 119360. [Google Scholar] [CrossRef]
  5. Song, L.; Zhang, S.; Wang, Q.; Chen, W.; Liu, B.; Zhao, Y.-D. Light-Controlled Microbots Gathering as a Sterilization Platform for Highly Efficient Capturing, Concentrating and Killing Targeted Bacteria. Chem. Eng. J. 2022, 435, 135067. [Google Scholar] [CrossRef]
  6. Tang, A.; Cai, T.; Li, C.; Zhou, C.; Gao, L. Flame Visualization and Spectral Analysis of Combustion Instability in a Premixed Methane/Air-Fueled Micro-Combustor. Energy 2024, 294, 130793. [Google Scholar] [CrossRef]
  7. Zhao, H.; Zhao, D.; Sun, D.; Semlitsch, B. Electrical Power, Energy Efficiency, NO and CO Emissions Investigations of an Ammonia/Methane-Fueled Micro-Thermal Photovoltaic System with a Reduced Chemical Reaction Mechanism. Energy 2024, 305, 132248. [Google Scholar] [CrossRef]
  8. Cai, S.; Yang, W.; Ding, Y.; Zeng, Q.; Wan, J. Hydrogen-Air Premixed Combustion in a Novel Micro Disc-Burner with an Annular Step. Fuel 2022, 313, 123015. [Google Scholar] [CrossRef]
  9. Cai, L.; E, J.; Li, J.; Ding, J.; Luo, B. A Comprehensive Review on Combustion Stabilization Technologies of Micro/Meso-Scale Combustors for Micro Thermophotovoltaic Systems: Thermal, Emission, and Energy Conversion. Fuel 2023, 335, 126660. [Google Scholar] [CrossRef]
  10. E, J.; Mei, Y.; Feng, C.; Ding, J.; Cai, L.; Luo, B. A Review of Enhancing Micro Combustion to Improve Energy Conversion Performance in Micro Power System. Int. J. Hydrogen Energy 2022, 47, 22574–22601. [Google Scholar] [CrossRef]
  11. Amani, E.; Daneshgar, A.; Hemmatzade, A. A Novel Combined Baffle-Cavity Micro-Combustor Configuration for Micro-Thermo-Photo-Voltaic Applications. Chin. J. Chem. Eng. 2020, 28, 403–413. [Google Scholar] [CrossRef]
  12. He, Z.; Yan, Y.; Fang, R.; Ou, Z.; Zhang, Z.; Yang, Z.; Zhang, Z. Numerical Investigation of a Novel Micro Combustor with a Central and Bilateral Slotted Blunt Body. Int. J. Hydrogen Energy 2021, 46, 23564–23579. [Google Scholar] [CrossRef]
  13. Kaisare, N.S.; Di Sarli, V. The Effect of Catalyst Placement on the Stability of a U-Bend Catalytic Heat-Recirculating Micro-Combustor: A Numerical Investigation. Catalysts 2021, 11, 1560. [Google Scholar] [CrossRef]
  14. Yan, Y.; Wu, G.; Huang, W.; Zhang, L.; Li, L.; Yang, Z. Numerical Comparison Study of Methane Catalytic Combustion Characteristic between Newly Proposed Opposed Counter-Flow Micro-Combustor and the Conventional Ones. Energy 2019, 170, 403–410. [Google Scholar] [CrossRef]
  15. Yilmaz, H. Investigation of Combustion and Emission Performance of a Micro Combustor: Effects of Bluff Body Insertion and Oxygen Enriched Combustion Conditions. Int. J. Hydrogen Energy 2019, 44, 25985–25999. [Google Scholar] [CrossRef]
  16. Zhang, Y.; Lu, Q.; Fan, B.; Long, L.; Quaye, E.K.; Pan, J. Effect of Multiple Bluff Bodies on Hydrogen/Air Combustion Characteristics and Thermal Properties in Micro Combustor. Int. J. Hydrogen Energy 2023, 48, 4064–4072. [Google Scholar] [CrossRef]
  17. Yan, Y.; Zhang, C.; Wu, G.; Feng, S.; Yang, Z. Numerical Study on Methane/Air Combustion Characteristics in a Heat-Recirculating Micro Combustor Embedded with Porous Media. Int. J. Hydrogen Energy 2022, 47, 20999–21012. [Google Scholar] [CrossRef]
  18. Li, J.; Xiao, H.; Li, Q.; Shi, J. Heat Recirculation and Heat Losses in Porous Micro-Combustors: Effects of Wall and Porous Media Properties and Combustor Dimensions. Energy 2021, 220, 119772. [Google Scholar] [CrossRef]
  19. Nauman, M.; Pan, J.; Lu, Q.; Zhang, Y.; Liu, C.; Li, F.; Quaye, E.K. Analyzing the Combustion Characteristics of Premixed Methane-Oxygen with Different Hydrogen Addition Ratios in a Catalytic Micro-Combustor. J. Energy Inst. 2024, 114, 101655. [Google Scholar] [CrossRef]
  20. Zhao, H.; Zhao, D.; Becker, S. Thermal Performances Investigation on an Ammonia-Fuelled Heat-Recirculating Micro-Combustor with Reduced Chemical Mechanism. Appl. Therm. Eng. 2024, 236, 121685. [Google Scholar] [CrossRef]
  21. Ni, S.; Zhao, D.; Wu, W.; Guan, Y. NOx Emission Reduction Reaction of Ammonia-Hydrogen with Self-Sustained Pulsating Oscillations. Therm. Sci. Eng. Prog. 2020, 19, 100615. [Google Scholar] [CrossRef]
  22. Cai, L.; E, J.; Zhao, D. Numerical Investigation on NOx Emissions and Thermal Performance of Hydrogen/Ammonia Fueled Micro-Combustors with Periodic Wall Structures. Renew. Energy 2025, 241, 122347. [Google Scholar] [CrossRef]
  23. Nieto-Londoño, C.; Silva-López, W.; Gómez-Velásquez, N. Numerical Assessment of the Combustion of Methane–Hydrogen–Air Mixtures in Micro-Scale Conditions. Processes 2025, 13, 794. [Google Scholar] [CrossRef]
  24. Dai, C.; Zuo, W.; Li, Q.; Zhou, K.; Huang, Y.; Zhang, G.; E, J. Energy Conversion Efficiency Improvement Studies on the Hydrogen-Fueled Micro Planar Combustor with Multi-Baffles for Thermophotovoltaic Applications. Energy 2024, 313, 134099. [Google Scholar] [CrossRef]
  25. Li, J.; E, J.; Ding, J.; Cai, L.; Luo, B. Investigation on Thermophotovoltaic Performance Enhancement of the Hydrogen Fueled Micro Combustors with the Center-Cleared Twisted Tapes for Micro-Thermophotovoltaic System. Appl. Therm. Eng. 2025, 264, 125483. [Google Scholar] [CrossRef]
  26. Zhang, Y.; Lu, Q.; Fan, B.; Chen, W.; Jiang, C.; Pan, J.; Jia, R. Study on the Non-Premixed Combustion Characteristics and Exergy Analysis of H2/Air in Vase-Shaped Micro Combustor. Appl. Therm. Eng. 2023, 233, 121104. [Google Scholar] [CrossRef]
  27. Sheykhbaglou, S.; Dimitriou, P. Numerical Analysis of Combustion and Thermal Performance of a Bluff-Body and Swirl-Stabilized Micro-Combustor with Premixed NH3/H2/Air Flames. Energies 2025, 18, 780. [Google Scholar] [CrossRef]
  28. Tang, A.; Pan, J.; Yang, W.; Xu, Y.; Hou, Z. Numerical Study of Premixed Hydrogen/Air Combustion in a Micro Planar Combustor with Parallel Separating Plates. Int. J. Hydrogen Energy 2015, 40, 2396–2403. [Google Scholar] [CrossRef]
  29. Su, Y.; Cheng, Q.; Song, J.; Si, M. Numerical Study on a Multiple-Channel Micro Combustor for a Micro-Thermophotovoltaic System. Energy Convers. Manag. 2016, 120, 197–205. [Google Scholar] [CrossRef]
  30. Kang, X. Micro/Mesoscale Combustion Based Portable Power Generating System. Ph.D. Thesis, The University of Queensland, Brisbane, QLD, Australia, 2017. [Google Scholar]
  31. Almutairi, F. A Numerical Study on Key Thermal Parameters and NOx Emissions of a Hydrogen-Fueled Double-Channel Outlet Micro Cylindrical Combustor Employing a Heat-Recirculating Configuration for Thermophotovoltaic Applications. Processes 2024, 12, 1848. [Google Scholar] [CrossRef]
  32. ANSYS Fluent User’s Guide; Release 23.2; ANSYS, Inc.: Canonsburg, PA, USA, 2023.
  33. Ni, S.; Zhao, D.; Sellier, M.; Li, J.; Chen, X.; Li, X.; Cao, F.; Li, W. Thermal Performances and Emitter Efficiency Improvement Studies on Premixed Micro-Combustors with Different Geometric Shapes for Thermophotovoltaics Applications. Energy 2021, 226, 120298. [Google Scholar] [CrossRef]
  34. Yang, X.; Yu, B.; Peng, X.; Zhou, H. Investigation of Thermal Performance and Energy Conversion in a Novel Planar Micro-Combustor with Four-Corner Entrances for Thermo-Photovoltaic Power Generators. J. Power Sources 2021, 515, 230625. [Google Scholar] [CrossRef]
  35. Kuo, C.H.; Ronney, P.D. Numerical Modeling of Non-Adiabatic Heat-Recirculating Combustors. Proc. Combust. Inst. 2007, 31, 3277–3284. [Google Scholar] [CrossRef]
  36. Shih, T.-H.; Liou, W.W.; Shabbir, A.; Yang, Z.; Zhu, J. A New K-ϵ Eddy Viscosity Model for High Reynolds Number Turbulent Flows. Comput. Fluids 1995, 24, 227–238. [Google Scholar] [CrossRef]
  37. Zhao, H.; Zhao, D.; Becker, S.; Zhang, Y. NO Emission and Enhanced Thermal Performances Studies on Counter-Flow Double-Channel Hydrogen/Ammonia-Fuelled Microcombustors with Oval-Shaped Internal Threads. Fuel 2023, 341, 127665. [Google Scholar] [CrossRef]
  38. Mousavi, S.M.; Sotoudeh, F.; Jun, D.; Lee, B.J.; Esfahani, J.A.; Karimi, N. On the Effects of NH3 Addition to a Reacting Mixture of H2/CH4 under MILD Combustion Regime: Numerical Modeling with a Modified EDC Combustion Model. Fuel 2022, 326, 125096. [Google Scholar] [CrossRef]
  39. Cai, T.; Zhao, D.; Karimi, N. Optimizing Thermal Performance and Exergy Efficiency in Hydrogen-Fueled Meso-Combustors by Applying a Bluff-Body. J. Clean. Prod. 2021, 311, 127573. [Google Scholar] [CrossRef]
  40. Yang, W.M.; Chua, K.J.; Pan, J.F.; Jiang, D.Y.; An, H. Development of Micro-Thermophotovoltaic Power Generator with Heat Recuperation. Energy Convers. Manag. 2014, 78, 81–87. [Google Scholar] [CrossRef]
  41. Cai, T.; Zhao, D. Effects of Fuel Composition and Wall Thermal Conductivity on Thermal and NOx Emission Performances of an Ammonia/Hydrogen-Oxygen Micro-Power System. Fuel Process. Technol. 2020, 209, 106527. [Google Scholar] [CrossRef]
  42. Li, J.; Huang, J.; Chen, X.; Zhao, D.; Shi, B.; Wei, Z.; Wang, N. Effects of Heat Recirculation on Combustion Characteristics of N-Heptane in Micro Combustors. Appl. Therm. Eng. 2016, 109, 697–708. [Google Scholar] [CrossRef]
  43. He, Z.; Yan, Y.; Zhao, T.; Feng, S.; Li, X.; Zhang, L.; Zhang, Z. Heat Transfer Enhancement and Exergy Efficiency Improvement of a Micro Combustor with Internal Spiral Fins for Thermophotovoltaic Systems. Appl. Therm. Eng. 2021, 189, 116723. [Google Scholar] [CrossRef]
  44. Fan, Y.; Schlick, C.P.; Umbanhowar, P.B.; Ottino, J.M.; Lueptow, R.M. Modelling Size Segregation of Granular Materials: The Roles of Segregation, Advection and Diffusion. J. Fluid Mech. 2014, 741, 252–279. [Google Scholar] [CrossRef]
  45. Figueroa, A.; Meunier, P.; Cuevas, S.; Villermaux, E.; Ramos, E. Chaotic Advection at Large Péclet Number: Electromagnetically Driven Experiments, Numerical Simulations, and Theoretical Predictions. Phys. Fluids 2014, 26, 013601. [Google Scholar] [CrossRef]
  46. Ni, S.; Zhao, D.; Zhu, X. Heat Transfer and Entropy Production Evaluation on Premixed Hydrogen/Air-Fuelled Micro-Combustors with Internal Threads. Fuel 2021, 303, 121325. [Google Scholar] [CrossRef]
  47. Sun, Y.; Zhao, D.; Ni, S.; David, T.; Zhang, Y. Entropy and Flame Transfer Function Analysis of a Hydrogen-Fueled Diffusion Flame in a Longitudinal Combustor. Energy 2020, 194, 116870. [Google Scholar] [CrossRef]
  48. Sahoo, B.B.; Saha, U.K.; Sahoo, N. Diagnosing the Effects of Pilot Fuel Quality on Exergy Terms in a Biogas Run Dual Fuel Diesel Engine. Int. J. Exergy 2012, 10, 77–93. [Google Scholar] [CrossRef]
  49. Stepanov, V.S. Chemical Energies and Exergies of Fuels. Energy 1995, 20, 235–242. [Google Scholar] [CrossRef]
  50. Tong, J.; Cai, T. Enhancing Thermal Performance, Exergy and Thermodynamics Efficiency of Premixed Methane/Air Micro-Planar Combustor in Micro-Thermophotovoltaic Systems. Energies 2023, 16, 118. [Google Scholar] [CrossRef]
  51. Peng, Q.; Yang, W.; E, J.; Li, Z.; Xu, H.; Fu, G.; Li, S. Investigation on H2/Air Combustion with C3H8 Addition in the Combustor with Part/Full Porous Medium. Energy Convers. Manag. 2021, 228, 113652. [Google Scholar] [CrossRef]
  52. Ismail, B.C.; Urmila, G.H.I.A.; Patrick, J.R.; Christopher, J.F.; Hugh, C.; Raad, P.E. Procedure for Estimation and Reporting of Uncertainty Due to Discretization in CFD Applications. J. Fluids Eng. 2008, 130, 078001. [Google Scholar]
  53. Rong, H.; Zhao, D.; Cai, T.; Becker, S. Enhancing Thermal and Exergy Performances in a CO2-Free Micro-Combustor with Reverse Flow Double-Channel Outlet Structure. Appl. Therm. Eng. 2023, 233, 121180. [Google Scholar] [CrossRef]
  54. Yang, W.; Chou, S.; Shu, C.; Xue, H.; Li, Z. Effect of Wall Thickness of Micro-Combustor on the Performance of Micro-Thermophotovoltaic Power Generators. Sens. Actuators A Phys. 2005, 119, 441–445. [Google Scholar]
  55. Zuo, W.; Zhang, Y.; Li, Q.; Li, J.; He, Z. Numerical Investigations on Hydrogen-Fueled Micro-Cylindrical Combustors with Cavity for Micro-Thermophotovoltaic Applications. Energy 2021, 223, 120098. [Google Scholar] [CrossRef]
Figure 1. Schematic diagrams of two micro cylindrical combustors, featuring a heat-recirculating structure, embedded within a micro planar combustor.
Processes 13 01142 g001
Figure 2. Layouts of the conventional design (CD) of the micro planar combustor, and parallel-flow (PF) and counter-flow (CF) micro planar combustors with two cylindrical combustors embedded inside.
Processes 13 01142 g002
Figure 3. A comparison between three different mesh densities, which are 301,911 cells (Mesh-I), 748,163 cells (Mesh-II), and 1,240,631 (Mesh-III), with respect to (a) the temperature over the external wall, (b) the wall temperatures of Mesh-I and -II with their error bars, and (c) T m w and R T with error bars for the results of Mesh-I and -II. The error bars for the results of Mesh-I and -II are generated using the data of Mesh-III. x and L are the distance between inlets and the distance from the inlet to the outlet.
Processes 13 01142 g003
Figure 4. Comparisons of (a) the wall temperature distribution with respect to (x/L) of the present results against the experimental [28] and numerical [53] findings for a micro planar combustor configuration and (b) the mean wall temperature at different equivalence ratios of the present results against the experimental [54] and numerical [55] findings for a micro cylindrical combustor configuration.
Processes 13 01142 g004
Figure 5. A comparison of the T m w and R T values between CD, PF, and CF configurations at an input power of 275 W and an equivalence ratio of unity.
Processes 13 01142 g005
Figure 6. Variations of temperature across CD, PF, and CF configurations at a 275 W input power and a unity equivalence ratio.
Processes 13 01142 g006
Figure 7. Distributions of Pe number throughout the CD, PF, and CF structures at a 275 W input power and a unity equivalence ratio.
Processes 13 01142 g007
Figure 8. Spatial variations of total entropy generations under CD, PF, and CF configurations.
Processes 13 01142 g008
Figure 9. Volume integrations of different entropy mechanisms of CD, PF, and CF configurations.
Processes 13 01142 g009
Figure 10. Comparisons of (a) pressure loss and exhaust gas temperature ( T e g ) and (b) exergy and radiation efficiencies for CD, PF, and CF test cases.
Processes 13 01142 g010
Figure 11. Variations of T m w and R T at different inlet velocities for PF and CF configurations.
Processes 13 01142 g011
Figure 12. Spatial distributions of temperature for PF and CF configurations at various inlet velocities.
Processes 13 01142 g012
Figure 13. Spatial variations of Pe number in the PF and CF cases for different levels of V i n .
Processes 13 01142 g013
Figure 14. Variations of total entropy generations in PF and CF at different values of V i n .
Processes 13 01142 g014
Figure 15. Volume integrations of entropy generation mechanisms for PF and CF at different V i n .
Processes 13 01142 g015
Figure 16. Comparisons of (a) pressure loss and T e g and (b) exergy and radiation efficiencies for PF, and CF test cases under different conditions of V i n .
Processes 13 01142 g016
Figure 17. Comparisons of T m w and R T at different Φ between 0.6 and 1.2 for PF and CF configurations.
Processes 13 01142 g017
Figure 18. Spatial distributions of in-combustor temperature at various values of Φ for PF and CF configurations.
Processes 13 01142 g018
Figure 19. Spatial variations in Pe number at different values of Φ for PF and CF configurations.
Processes 13 01142 g019
Figure 20. Spatial variations in total entropy generation at a variety of Φ values for PF and CF configurations.
Processes 13 01142 g020
Figure 21. Volume integrations of entropy generation processes at various Φ for PF and CF.
Processes 13 01142 g021
Figure 22. Variations of (a) pressure loss and T e g and (b) exergy and radiation efficiencies at different levels of Φ for PF and CF test cases.
Processes 13 01142 g022
Table 1. Dimensions of the new design configuration.
VariablesValue (mm)
CDPFCF
LengthL1111111
L2181818
L3444
L4NA77
L5NA22
L6NA17.517.5
L7NA15.515.5
L8NA8.58.5
L9NA55
L10NA22
L11NA0.50.5
L12NA33
L13NA0.940.94
L14NA0.40.4
L15NA1.951.95
DiameterD1NA22
D2NA33
Thicknesst1NA0.1250.125
Table 2. Reversible chemical reactions of H2–air combustion [40]. A k is the pre-exponential factor of reaction rate, β k is the activation energy of the reaction, E k is the temperature exponent, and M is a third body efficiency.
Reactions A k (m kmol s) β k E k (J/mol)
1. O2 + H = OH + O5.10 × 1013−0.826.91 × 107
2. H2 + O = OH + H1.80 × 1071.003.70 × 107
3. H2 + OH = H2O + H1.20 × 1061.301.52 × 107
4. OH + OH = H2O + O6.00 × 1061.300.00
5. H2 + O2 = OH + OH1.70 × 10100.002.0 × 108
6. H + OH + M = H2O + M a7.50 × 1017−2.600.00
7. O2 + M = O + O + M1.90 × 1080.504.001 × 108
8. H2 + M = H + H + M b2.20 × 1090.503.877 × 108
9. H + O2 + M = HO2 + M c2.10 × 1012−1.000.00
10. H + O2 + O2 = HO2 + O26.70 × 1013−1.420.00
11. H + O2 + N2 = HO2 + N26.70 × 1013−1.420.00
12. HO2 + H = H2 + O22.50 × 10100.002.90 × 106
13. HO2 + H = OH + OH2.50 × 10110.007.90 × 106
14. HO2 + O = OH + O24.80 × 10100.004.20 × 106
15. HO2 + OH = H2O + O25.00 × 10100.004.20 × 106
16. HO2 + HO2 = H2O2 + O22.00 × 1090.000.00
17. H2O2 + M = OH + OH + M1.30 × 10140.001.905 × 108
18. H2O2 + H = H2 + HO21.70 × 1090.001.57 × 107
19. H2O2 + OH = H2O + HO21.0 × 10100.007.50 × 106
a Enhancement factors: H2O = 20.0. b Enhancement factors: H2O = 6.0, H = 2.0, and H2 = 3.0. c Enhancement factors: H2O = 21.0, H2 = 3.3, O2 = 0.0, and N2 = 0.0.
Disclaimer/Publisher’s Note: The statements, opinions and data contained in all publications are solely those of the individual author(s) and contributor(s) and not of MDPI and/or the editor(s). MDPI and/or the editor(s) disclaim responsibility for any injury to people or property resulting from any ideas, methods, instructions or products referred to in the content.

