Article

Optimized Torrefaction of Corn Straw in a Screw Reactor: Energy Balance Analysis and Biochar Production Enhancement

1
School of Mechatronic Engineering, Xianyang Polytechnic Institute, Xi’an 712000, China
2
CHN Energy (Fuzhou) Thermal Power Co., Ltd., Fuzhou 350000, China
3
State Power Investment Corporation Research Institute, Beijing 100034, China
4
Beijing Chaoyang Environment Group Company Limited, Beijing 100024, China
*
Authors to whom correspondence should be addressed.
Processes 2025, 13(5), 1302; https://doi.org/10.3390/pr13051302
Submission received: 27 February 2025 / Revised: 13 April 2025 / Accepted: 23 April 2025 / Published: 24 April 2025

Abstract

:
Torrefaction is a promising pretreatment method to enhance the physical and chemical properties of corn straw for bioenergy applications. In this study, torrefaction experiments were conducted in a continuous screw reactor under varying temperatures and feed rates. The quality of the resulting biochar was assessed using color difference analysis, with a defined threshold to determine product qualification (i.e., compliance rate). Results showed that the compliance rate dropped from 78% to 61% as the feed rate increased from 0.5 kg/h to 1.5 kg/h. To address this, process parameters were optimized. Increasing the flow of the hot carrier gas significantly improved product quality: at a carrier gas temperature of 550 °C, a flow rate of 9.4 kg/h, and a feed rate of 1 kg/h, the compliance rate reached 81%. An energy balance was established through proximate and ultimate analyses and measurements of the higher heating value (HHV). Under optimized conditions, the mass yield (MY) and energy yield (EY) were 58.84% and 66.48%, respectively. Maintaining the carrier gas temperature above 550 °C ensured a stable and self-sustaining torrefaction process. These findings provide practical insights for the design and operation of energy-efficient, continuous biomass torrefaction systems, contributing to the advancement of sustainable biochar production at industrial scales.

1. Introduction

As an important byproduct of agricultural production, corn straw is produced in large quantities and is widely distributed across various regions, making it a biomass resource with great potential. Typically, the occurrence of corn straw can reach up to 2–3 tons per hectare of corn cultivated land [1]. The percentage yield of corn straw, relative to the total corn crop, varies between 10 and 15% depending on factors such as crop variety, growth conditions, and harvesting practices. However, due to its inherent characteristics—such as low bulk density, low energy density, and difficulties in storage and transportation—its direct utilization faces numerous challenges. Traditional disposal methods, such as open-field burning, not only cause environmental pollution but also waste their potential energy value. Therefore, it is particularly important to develop an efficient and environmentally friendly approach for the utilization of corn straw.
Torrefaction is an effective pretreatment method for straw, conducted at temperatures between 200 and 300 °C with a slow heating rate and a longer residence time [2]. After torrefaction, the straw’s carbon-to-hydrogen ratio and carbon-to-oxygen ratio increase, the high heating value (HHV) of the straw increases by approximately 15%, and the moisture content decreases. The torrefied straw exhibits properties more similar to lignite [3,4]. Furthermore, torrefied straw has a certain degree of promoting effect on subsequent straw gasification or further processing into solid or liquid materials [5]. Although significant progress has been made in the field of biomass pyrolysis research in recent years, there remains a knowledge gap regarding the energy balance during low-temperature pyrolysis processes. In particular, how to achieve self-sustaining energy in the pyrolysis process under continuous production conditions is an issue that urgently needs to be addressed. It is worth noting that although some existing studies have explored relevant biomass pyrolysis technologies, certain references are somewhat outdated, especially in the rapidly evolving field of bioenergy. Therefore, this study aims to provide a more solid theoretical foundation for this field by reviewing the latest literature.
For the pretreatment and energy utilization of corn straw, some scholars have designed various thermal conversion devices. Hu et al. [6] designed a novel shaftless spiral continuous reactor for the chemical looping gasification of rice husks, and the results showed that the chemical looping gasification in the shaftless spiral reactor exhibited excellent performance. The gas yield, carbon conversion rate, and gasification efficiency were 73.33%, 63.92%, and 98.26% higher, respectively, compared to the fixed-bed reactor. Porat et al. [7] designed a new type of rotating heating pyrolysis reactor that can be used to process various biomass feedstocks up to 30 L. It is easy to construct, has low operating costs, and low energy consumption. After conducting research on wood chips, the conclusion was drawn that biochar, when subjected to temperatures between 375 and 425 °C, exhibits physical and chemical properties comparable to biochar produced by conventional batch pyrolysis reactors. Zhao et al. [8] designed a five-stage heated spiral pyrolysis reactor, where the temperatures of the five heating sections along the spiral axis were controlled separately by heating furnaces. Additionally, the segmented spiral pyrolysis reactor is equipped with pyrolysis gas cracking devices and pyrolysis gas combustion burners, which enable efficient energy utilization. Qin et al. [9] designed a variable-pitch spiral pyrolysis device to meet the needs of biomass pyrolysis. The study indicates that the sections with a smaller pitch provide reliable sealing while ensuring material transport requirements, while the sections with a wider pitch meet the spatial requirements for pyrolysis, leading to a more thorough reaction. Aladin et al. [10] designed a laboratory-scale pyrolysis device for obtaining bio-oil and biochar. It can achieve zero waste and low energy costs, and the reactor is easy to design, requiring no complex components or maintenance for the reaction system. Lsemin et al. [11] designed a fluidized bed torrefaction reactor for waste biomass, and the reactor is equipped with vertical baffles, which create a circular flow of biomass from the inlet to the outlet, allowing for operating conditions closer to those of a plug–flow reactor without increasing the overall size of the reactor. Liu et al. [12] designed a spiral heating device and conducted torrefaction research on sorghum straw. The results indicated that the heating rate of the straw inside the spiral is influenced by wall temperature and spiral rotation speed. At low temperatures, the straw temperature increases with an increase in rotation speed, while at high temperatures, the effect of rotation speed on straw temperature is weaker than that of residence time. Additionally, they studied the flow behavior of different feed rates inside the spiral and determined that the optimal theoretical heating rate for sorghum straw is 4–4.5 °C/min. Luz et al. [13] used MATLAB R2017a (9.2.0) to develop a torrefaction model for the spiral reactor. They segmented the heat distribution within the spiral tube into the five following aspects: heat conduction from the resistance wire to the tube wall, convection from the tube wall to the material, heat conduction from the tube wall to the air, heat conduction from the tube wall to the material, and radiation from the tube wall to the material. They combined mass and energy equations within the differential evolution algorithm method’s dynamic framework and validated the heat flow during the torrefaction process by comparing it with experimental data. Bruun et al. [14] concluded from simulations of a rotary pyrolysis reactor that the stability of pyrolysis biochar is related to the extent of thermal changes in the feedstock. Additionally, they found that relatively small adjustments in reactor temperature (±25 °C) significantly affect the residual amounts of easily degradable cellulose and hemicellulose in the biochar.
Therefore, although numerous studies have been conducted on the torrefaction of biomass, there remains a lack of comprehensive understanding regarding the detailed reaction characteristics and underlying mechanisms of protein-rich biomass during torrefaction, particularly in relation to nitrogen-containing species transformation. To address this gap, the present study systematically investigates the torrefaction behavior of soybean protein isolate as a model compound, with a focus on nitrogen migration and volatile evolution under varying temperatures. By combining thermogravimetric analysis, FTIR spectroscopy, and gas-phase product characterization, this work reveals the thermal degradation pathways and offers mechanistic insights into nitrogen species transformation during torrefaction. The findings not only contribute to a deeper understanding of biomass nitrogen chemistry but also provide a theoretical basis for cleaner thermochemical conversion of protein-containing biomass. This represents a novel and meaningful contribution to the field, which has not been sufficiently addressed in previous literature.

2. Materials and Methods

2.1. Design, Calculations, and Calibration of the Experimental Platform

2.1.1. Overall Design of the Experimental Platform

To address the need for small-scale experimental torrefaction pretreatment of corn straw, this study designed an independently controlled and highly adaptable spiral reactor for conducting corn straw torrefaction experiments. Figure 1 illustrates the system diagram of this spiral torrefaction apparatus. To ensure the air-tightness of the entire apparatus during the torrefaction process, it is advisable not to have an excessive number of thermocouples; however, the selected testing locations should be both representative and specific. Therefore, in this experimental setup, three specific temperature measurement points were selected, namely, the solid material outlet and the nitrogen hot carrier gas inlet and outlet, to measure the reactor’s operating temperature under different conditions. Additionally, to enhance heat transfer efficiency, a sleeve is installed outside the spiral reactor, with uniform flow holes near the inlet. The installation of the sleeve allows for the efficient release of heat carried by the nitrogen hot carrier gas. Specifically, when the high-temperature nitrogen gas enters the equipment, it needs to fill the entire sleeve before coming into contact with the material inside the spiral, thereby enhancing heat transfer efficiency. The placement of uniform flow holes helps prevent uneven heating caused by excessive pressure inside the sleeve. Furthermore, because standard electric motors cannot meet the low rotational speed requirements of this experiment, a gearbox is installed to control the motor and precisely adjust the speed of the spiral.
In order to conserve nitrogen gas usage, before the experiment, a substantial volume of hot air is introduced into the equipment using an air compressor to elevate the temperature inside the spiral reactor to meet the torrefaction temperature requirement. Following this, hot nitrogen gas is introduced to remove the air from the reactor for the experiment. Prior to commencing the experiment, the variable-frequency motor is adjusted to achieve a material residence time of 60 min. Throughout the experiment, circulating water is employed to cool the bearings and prevent deformation. After the experiment, the resulting biochar from the torrefaction process is collected in a receiving tank for subsequent measurements.

2.1.2. Calculations for Experimental Platform Design

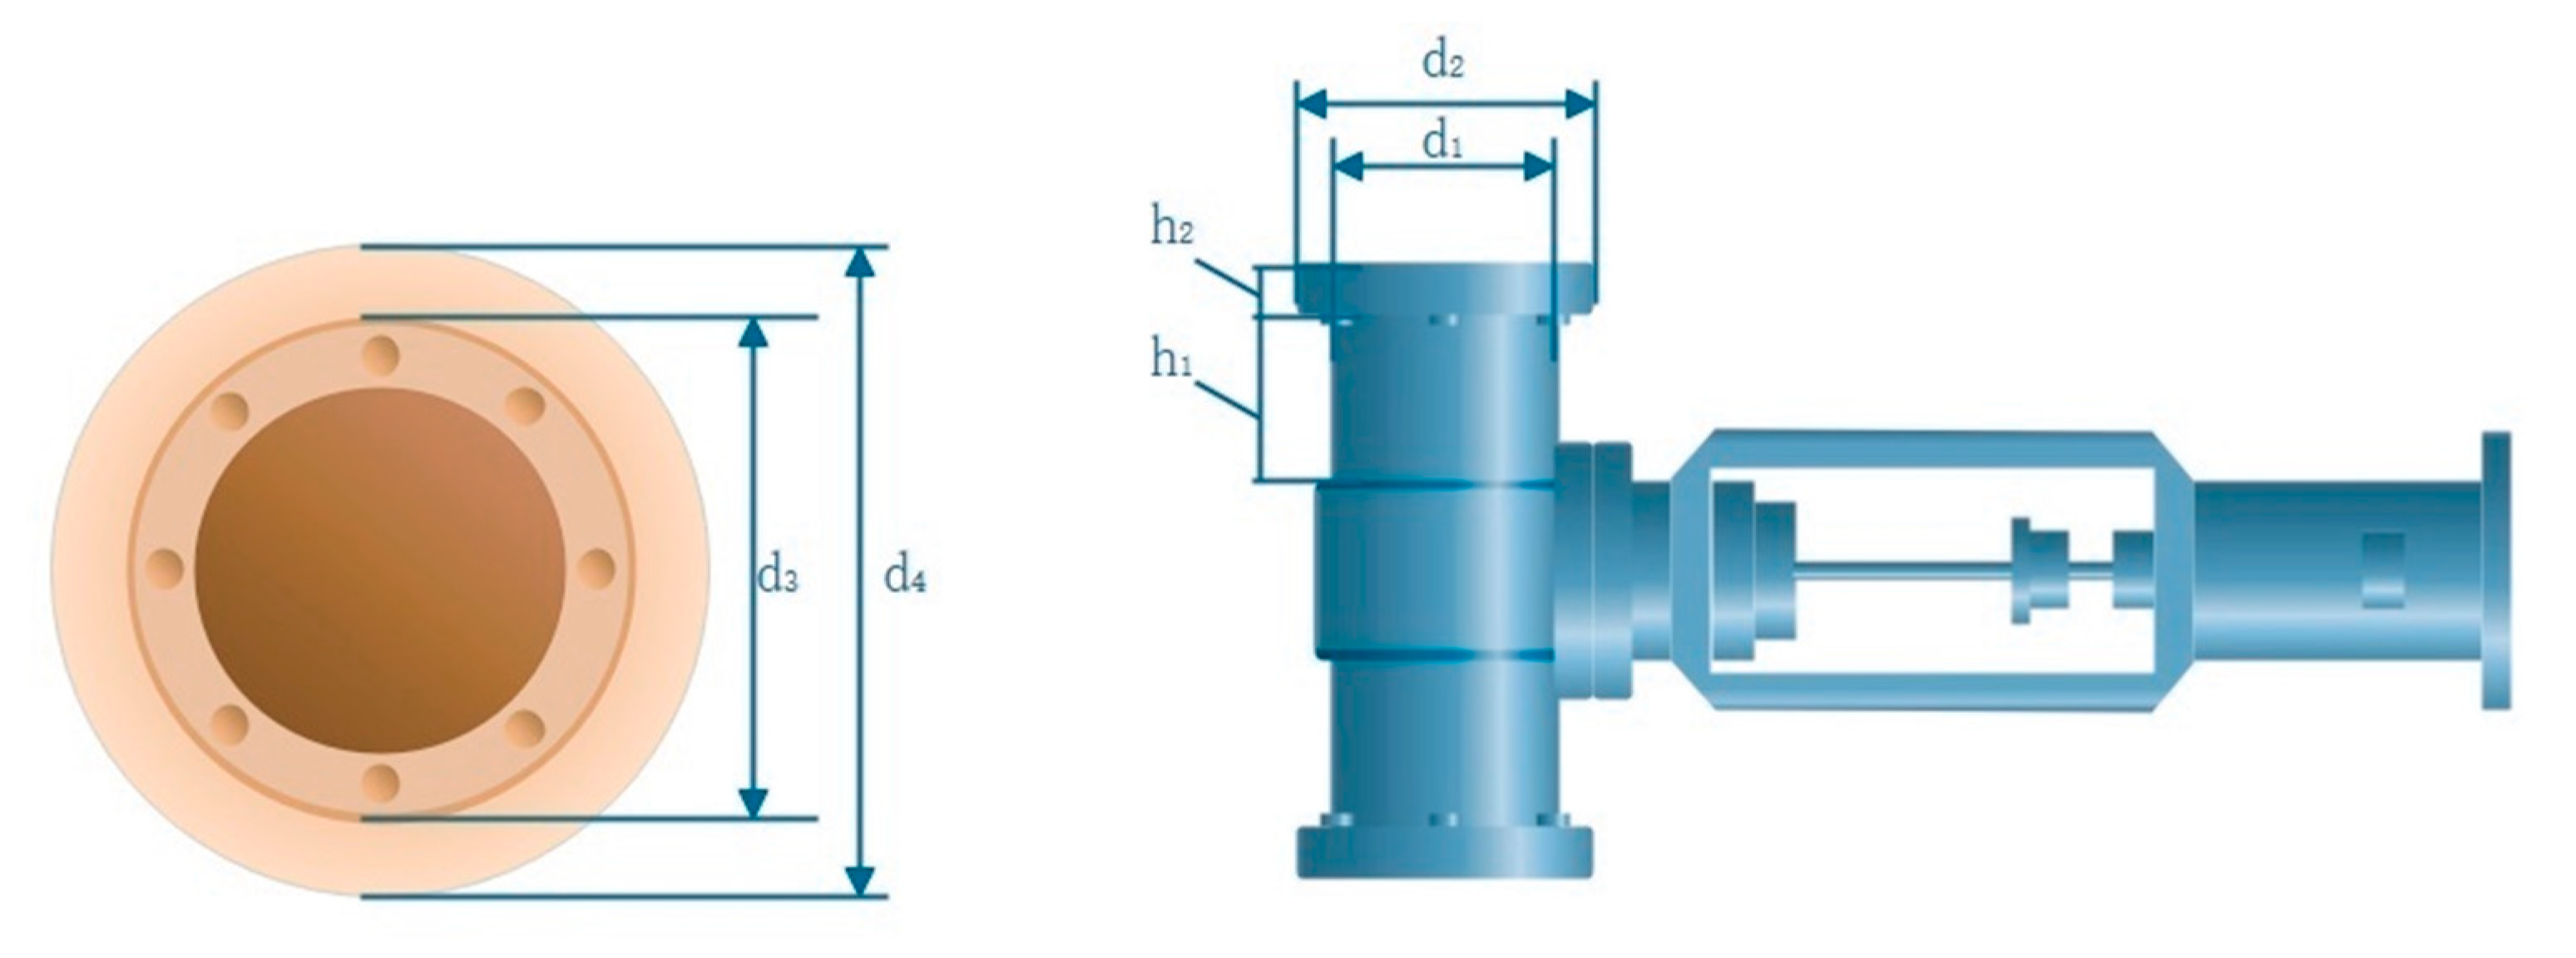
Calculation of Spiral Parameters

D K Q Ψ γ c 5 2
D = ( 0.25 0.4 ) D
S = KD
n n max = A D
Equations (1)–(4) represent the calculation formulas for the spiral outer diameter (D), spiral shaft diameter (d), pitch (S), and the maximum operational rotational speed of the spiral shaft (n) [15]. To calculate these four physical quantities, it is necessary to first determine the comprehensive coefficient (K), fill factor (Ψ), unit volume mass of the material (γ), tilt angle coefficient (C), and flow rate (Q). For corn straw, typically, the K value is taken as 0.05, the fill factor Ψ falls between 0.25 and 0.35, and, here, it is chosen as 0.3. The unit volume mass of biomass γ is generally in the range from 110 to 270 kg/m3 and, here, it is taken as 150 kg/m3. The tilt angle coefficient (C) is considered 1 when the spiral is positioned horizontally. The flow rate (Q) is set at 50 kg/h [16]. In the process of designing the spiral, it is recommended to slightly increase the spiral diameter to meet the requirements of the experimental parameters. Consequently, in this design, D = 200 mm is selected as the blade diameter. In this scenario, the potential range of pitch values falls within 100–440 mm. To ensure uniform torrefaction of the material during the conveying process, it is advisable to maximize the number of spiral blades in the design. Therefore, a design pitch of 100 mm is chosen.

Heat Dissipation Loss Calculation

To determine the heat loss incurred while the equipment operates in an open-air environment, measurements of the dimensions of the valve and bearing side supports are taken. Additionally, the components are simplified and segmented into different cylinders, as shown in Figure 2. Natural convection heat transfer and radiation heat transfer for these different cylinders are calculated separately and then combined to obtain the total heat dissipation. The specific calculation formulas are as follows.
Nu = C ( GrPr ) n
Gr = g α V t l 3 v 3
= ε A σ ( T 1 4 T 2 4 )
In the above formulas, where C and n are constants determined by Gr, g represents the gravitational acceleration (9.8 m/s), αv is the coefficient of volume expansion (taken as 1/T), Δt is the temperature difference between the wall and the fluid, l is the length over which the fluid passes the wall, ε is the emissivity (assumed to be 0.9 for paint), and σ is the Stefan–Boltzmann constant. During the calculations, it is assumed that the environmental temperature is 20 °C, and the average steel temperature exposed to the air is 100 °C. By referencing the thermophysical properties of dry air at atmospheric pressure, it can be determined that at 60 °C, the density of air (ρ) is 1.06 kg/m3, the specific heat at constant pressure (cp) is 1.005 kJ/(kg·K), the thermal conductivity (λ) is 0.029 W/(m.K), and the Prandtl number (Pr) is 0.696.
To simplify the calculation of heat dissipation losses while maintaining accuracy, we made appropriate adjustments to the calculation formulas and provided a more intuitive explanation. Heat dissipation mainly arises from natural convection and radiative heat transfer between the external surfaces of the equipment and the surrounding environment. For natural convection, we used a simplified empirical formula to estimate heat loss. This formula is based on the physical properties of the fluid (such as density, specific heat capacity, and thermal conductivity) and the geometric dimensions of the equipment (such as length and diameter). Under natural convection conditions, fluid motion is driven by temperature differences. We assumed that the flow over vertical surfaces is either laminar or turbulent and calculated the convective heat transfer coefficient using the corresponding Nusselt number correlations. For radiative heat transfer, we applied the Stefan–Boltzmann law. Considering that the equipment surface is typically coated with a material of known emissivity, we used the emissivity of the coating, along with the absolute temperatures of the equipment surface and the ambient environment, to calculate the radiative heat loss. By summing the heat losses from natural convection and radiation, we obtained the total heat dissipation from the equipment. Although this approach simplifies complex theoretical derivations, it preserves the accuracy of the calculations.
The valve and bearing support components are simplified into four different cylinders with varying diameters and heights, with the primary dimensions being as follows: d1 = 0.24 m, h1 = 0.36 m; d2 = 0.30 m, h2 = 0.02 m; d3 = 0.14 m, h3 = 0.1 m; d4 = 0.2 m, h4 = 0.16 m.
In this context, the subscripts 1–4 in the cylinder dimensions, respectively, represent the valve upper part, the valve top disc, the valve–equipment connection point, the bearing housing, and the bearing support, as shown in Figure 2. The calculated results were summed with the radiative heat transfer, resulting in a total heat dissipation of 2016.7 kJ/h.

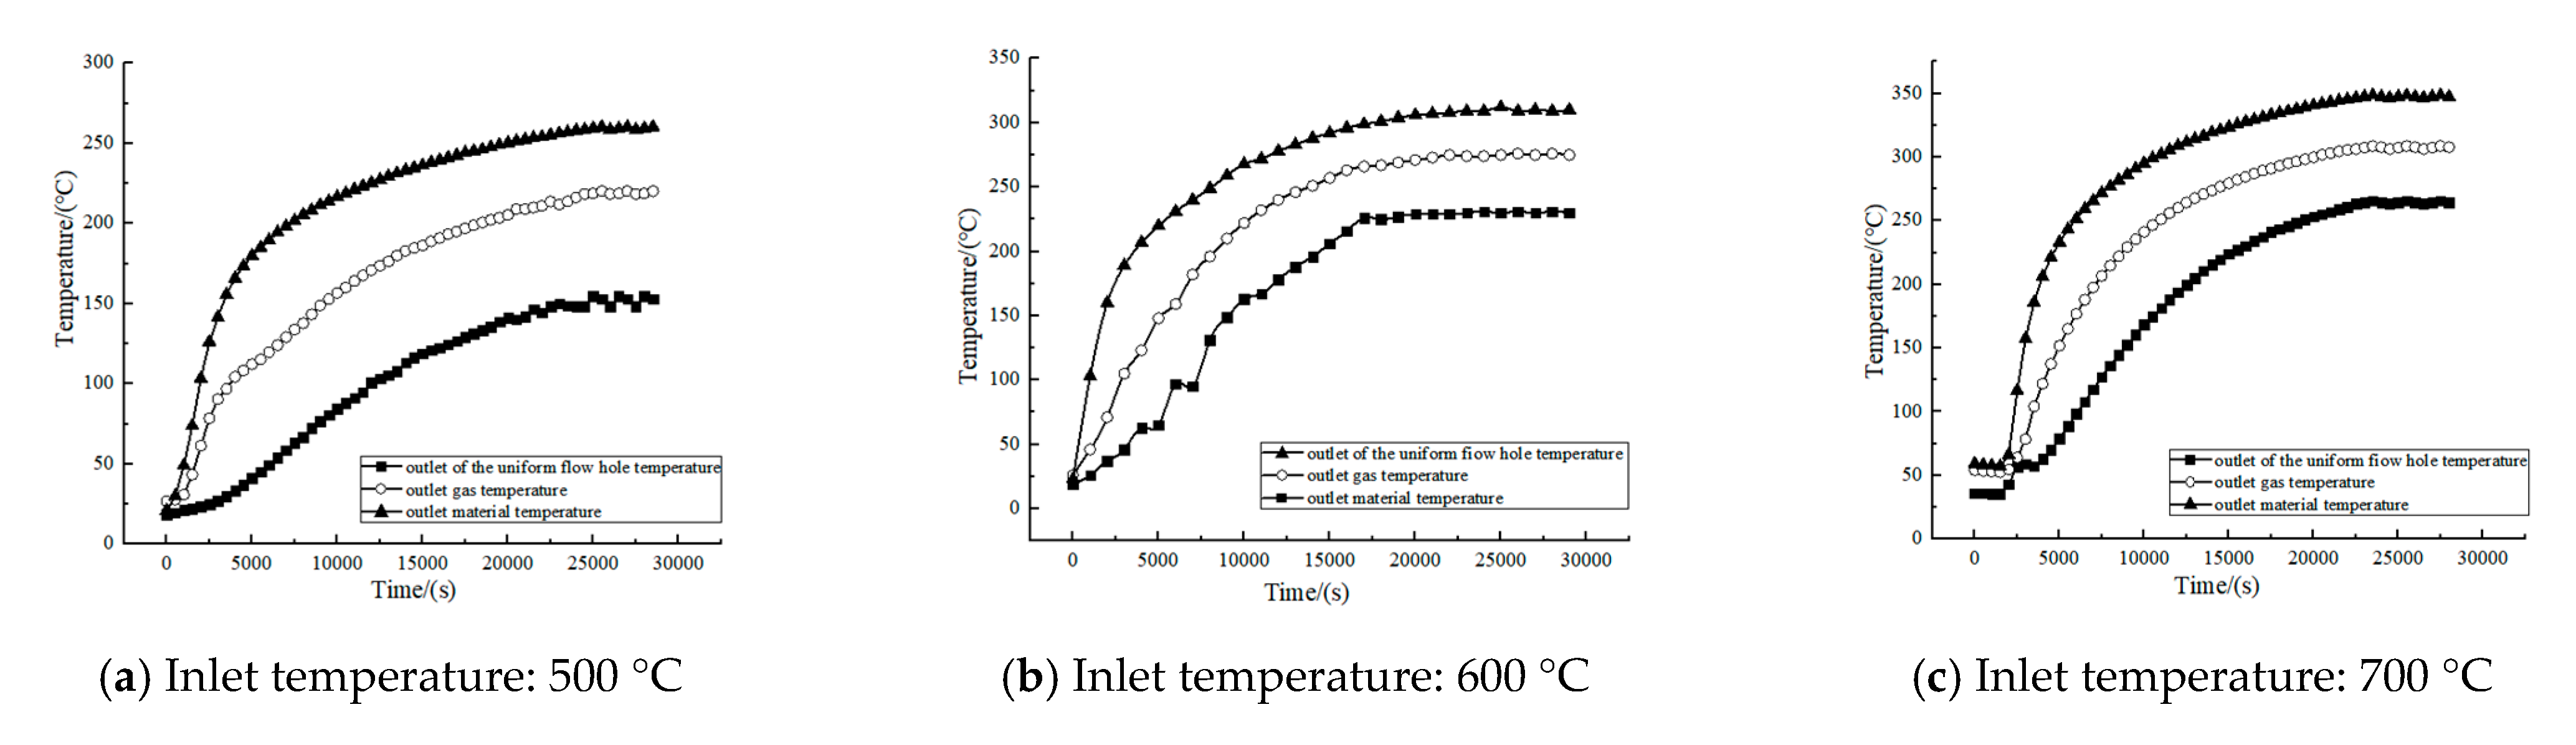
2.1.3. No-Load Thermal State Experiment

Prior to conducting the formal experiments, we performed unloaded hot-state tests to verify the heating performance and temperature stability of the equipment. To ensure the accuracy of the experimental data, we also carried out detailed calibration and validation of the temperature sensors. The calibration process involved the use of standard temperature sources, such as calibrated thermostatic baths or high-precision platinum resistance thermometers. The temperature sensors were placed in these standard sources, and their readings were recorded and compared with the reference temperature values. If deviations were observed, the sensor readings were corrected by adjusting internal parameters (such as resistance values or amplification factors) until they matched the standard temperature. For validation, the stability and repeatability of the sensors were assessed by repeatedly measuring the same temperature point multiple times. Several representative temperature points were selected, and, at each point, repeated measurements (e.g., 10 times) were taken. The mean and standard deviation of the measurements were calculated to evaluate performance. By comparing results across different repetitions, we were able to determine whether the sensor’s stability and repeatability met the experimental requirements. Throughout the calibration and validation process, relevant standards and protocols were strictly followed to ensure the accuracy and reliability of the temperature sensors. This provided a solid foundation for obtaining accurate data in the subsequent experiments.
Before conducting formal experiments, it is necessary to perform a trial run and equipment debugging, hence the no-load thermal state experiment. The experimental results, showing the variation of the reactor temperature over time at different inlet air temperatures, are displayed in Figure 3. From this, it can be observed that at different inlet temperatures, the temperature variations among various measurement points at the same time follow the order of outlet temperature of the uniform flow hole > outlet gas temperature > outlet material temperature. This is due to the flow path of nitrogen gas inside the spiral reactor. Specifically, the high-temperature hot air first enters the casing before entering the inner tube in the spiral heater. When the casing is filled with gas, it flows through the orifice plate into the inner tube. Since the nitrogen gas outlet is located at the top, and during the no-load heating debugging process, the lower valve is tightly closed, nitrogen gas can only be discharged from the upper outlet. As the nitrogen gas flows and releases heat within the spiral heater, it causes the temperature of the nitrogen gas near the gas outlet to gradually decrease.
Torrefaction temperature is a critical factor influencing the torrefaction effectiveness of the material. In Liu’s research on the torrefaction of sorghum grains inside the spiral reactor [6], it was observed that the temperature difference between actual temperature measurements and the torrefaction temperature was approximately 20 °C. Therefore, the outlet gas temperature from Figure 3 is selected as the reference standard. The actual torrefaction temperature inside the spiral reactor is calculated by subtracting 20 °C from the outlet gas temperature once it reaches dynamic equilibrium. From the test results in Figure 3, it can be observed that when the gas hot carrier temperatures are 500 °C, 600 °C, and 700 °C, the corresponding torrefaction temperatures are 200 °C, 250 °C, and 300 °C, respectively.

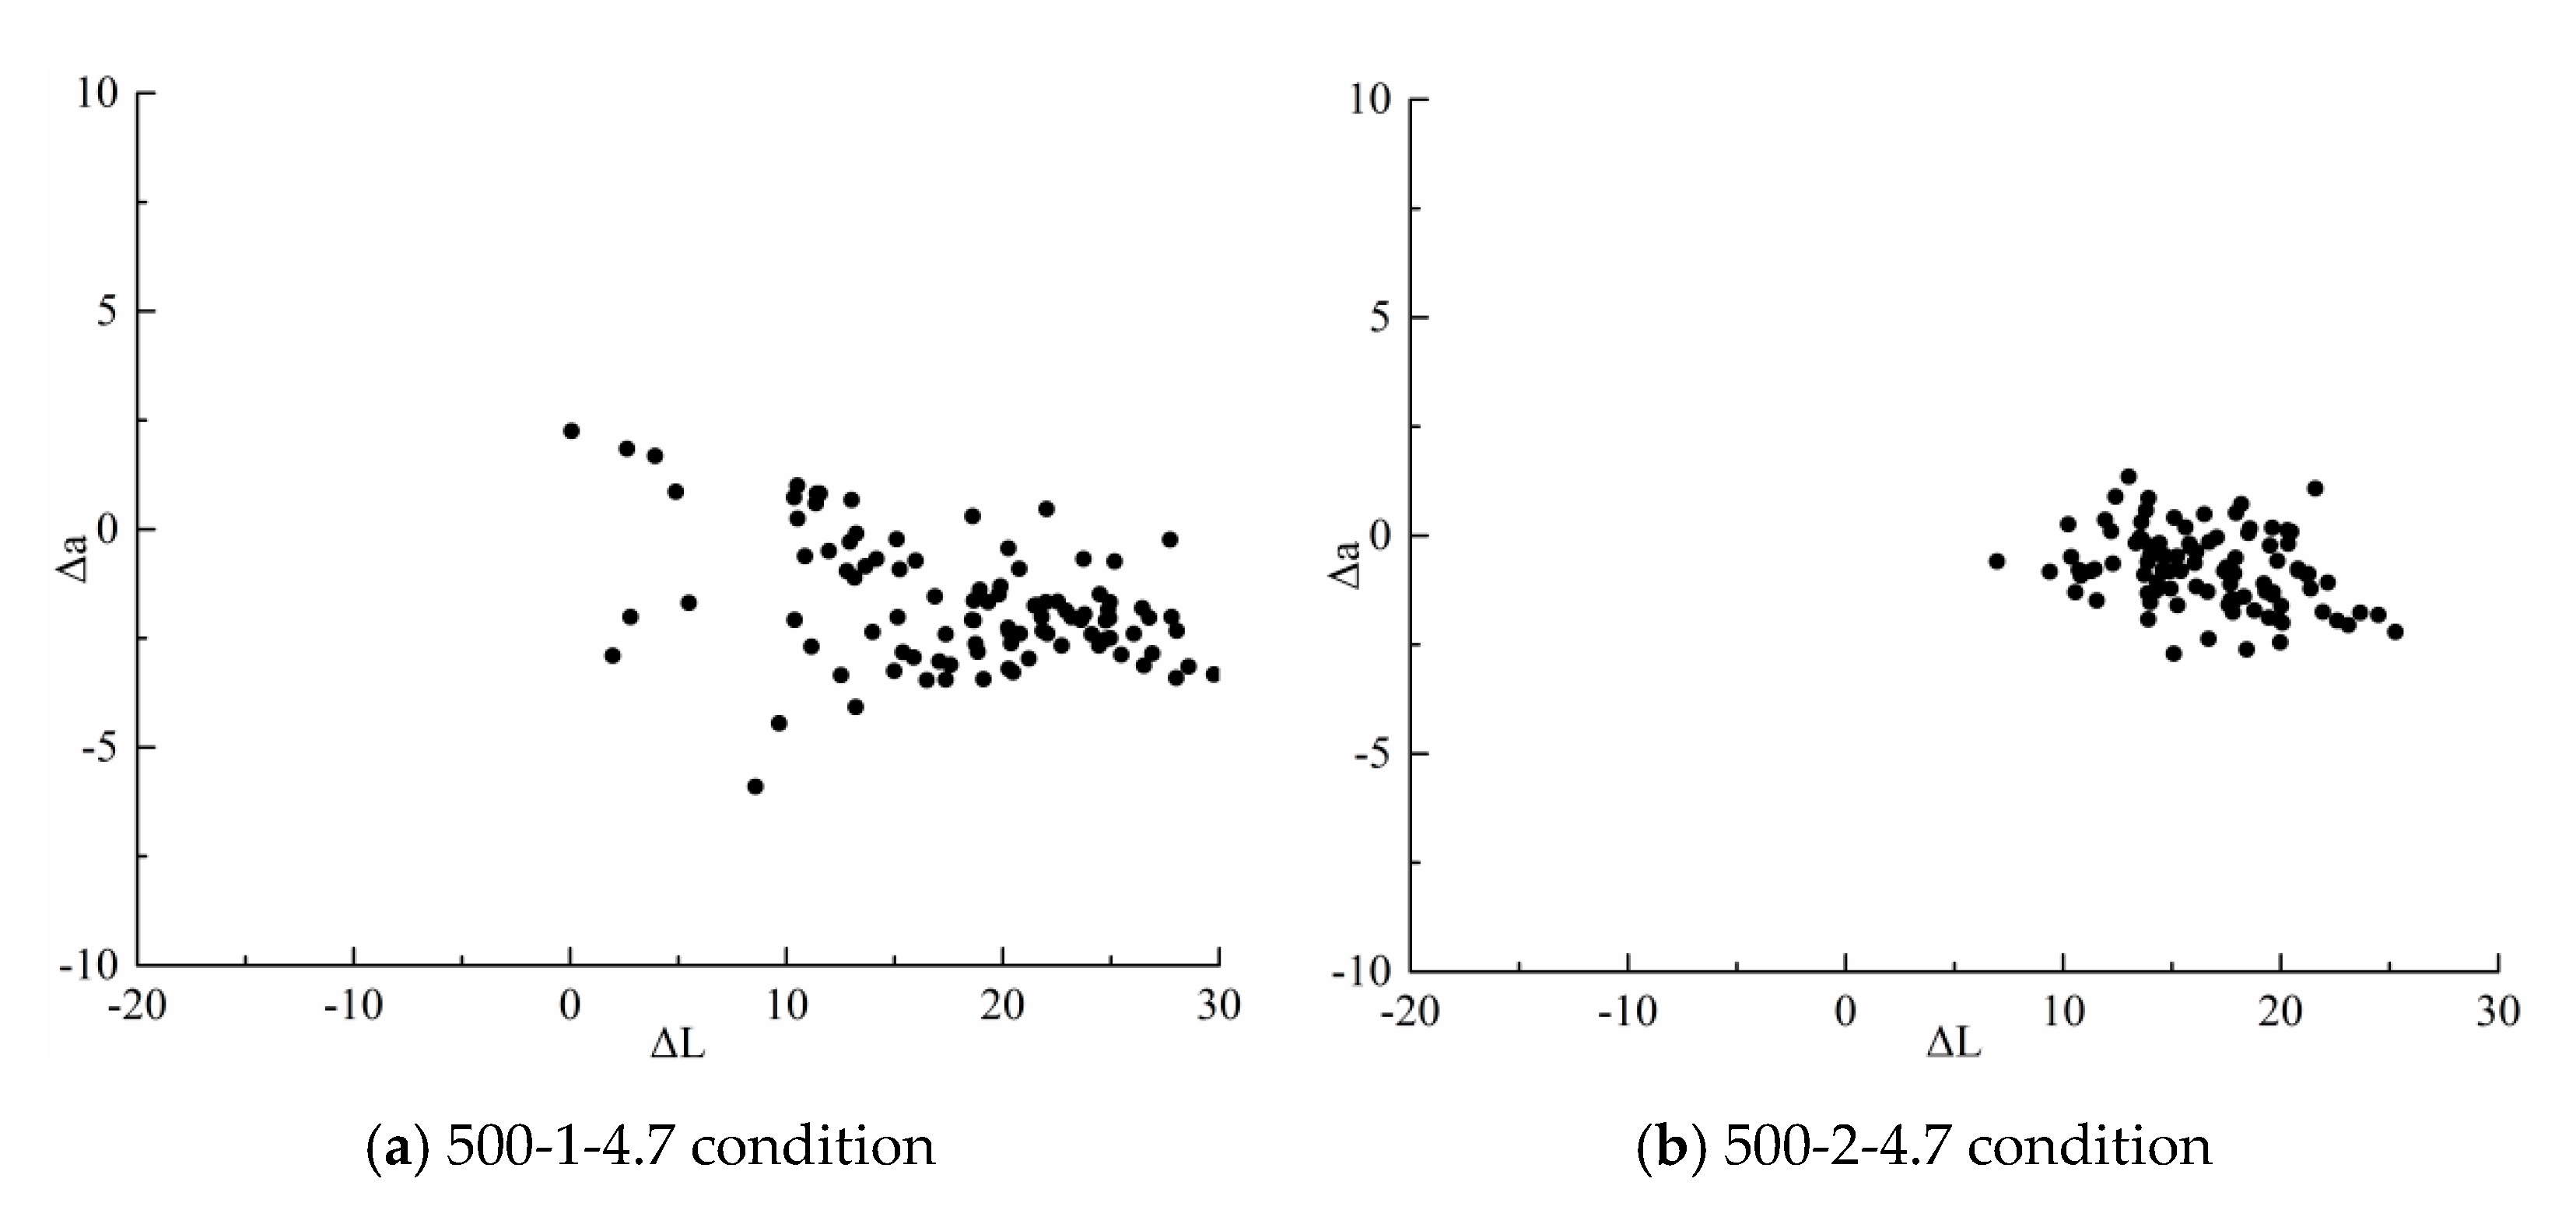
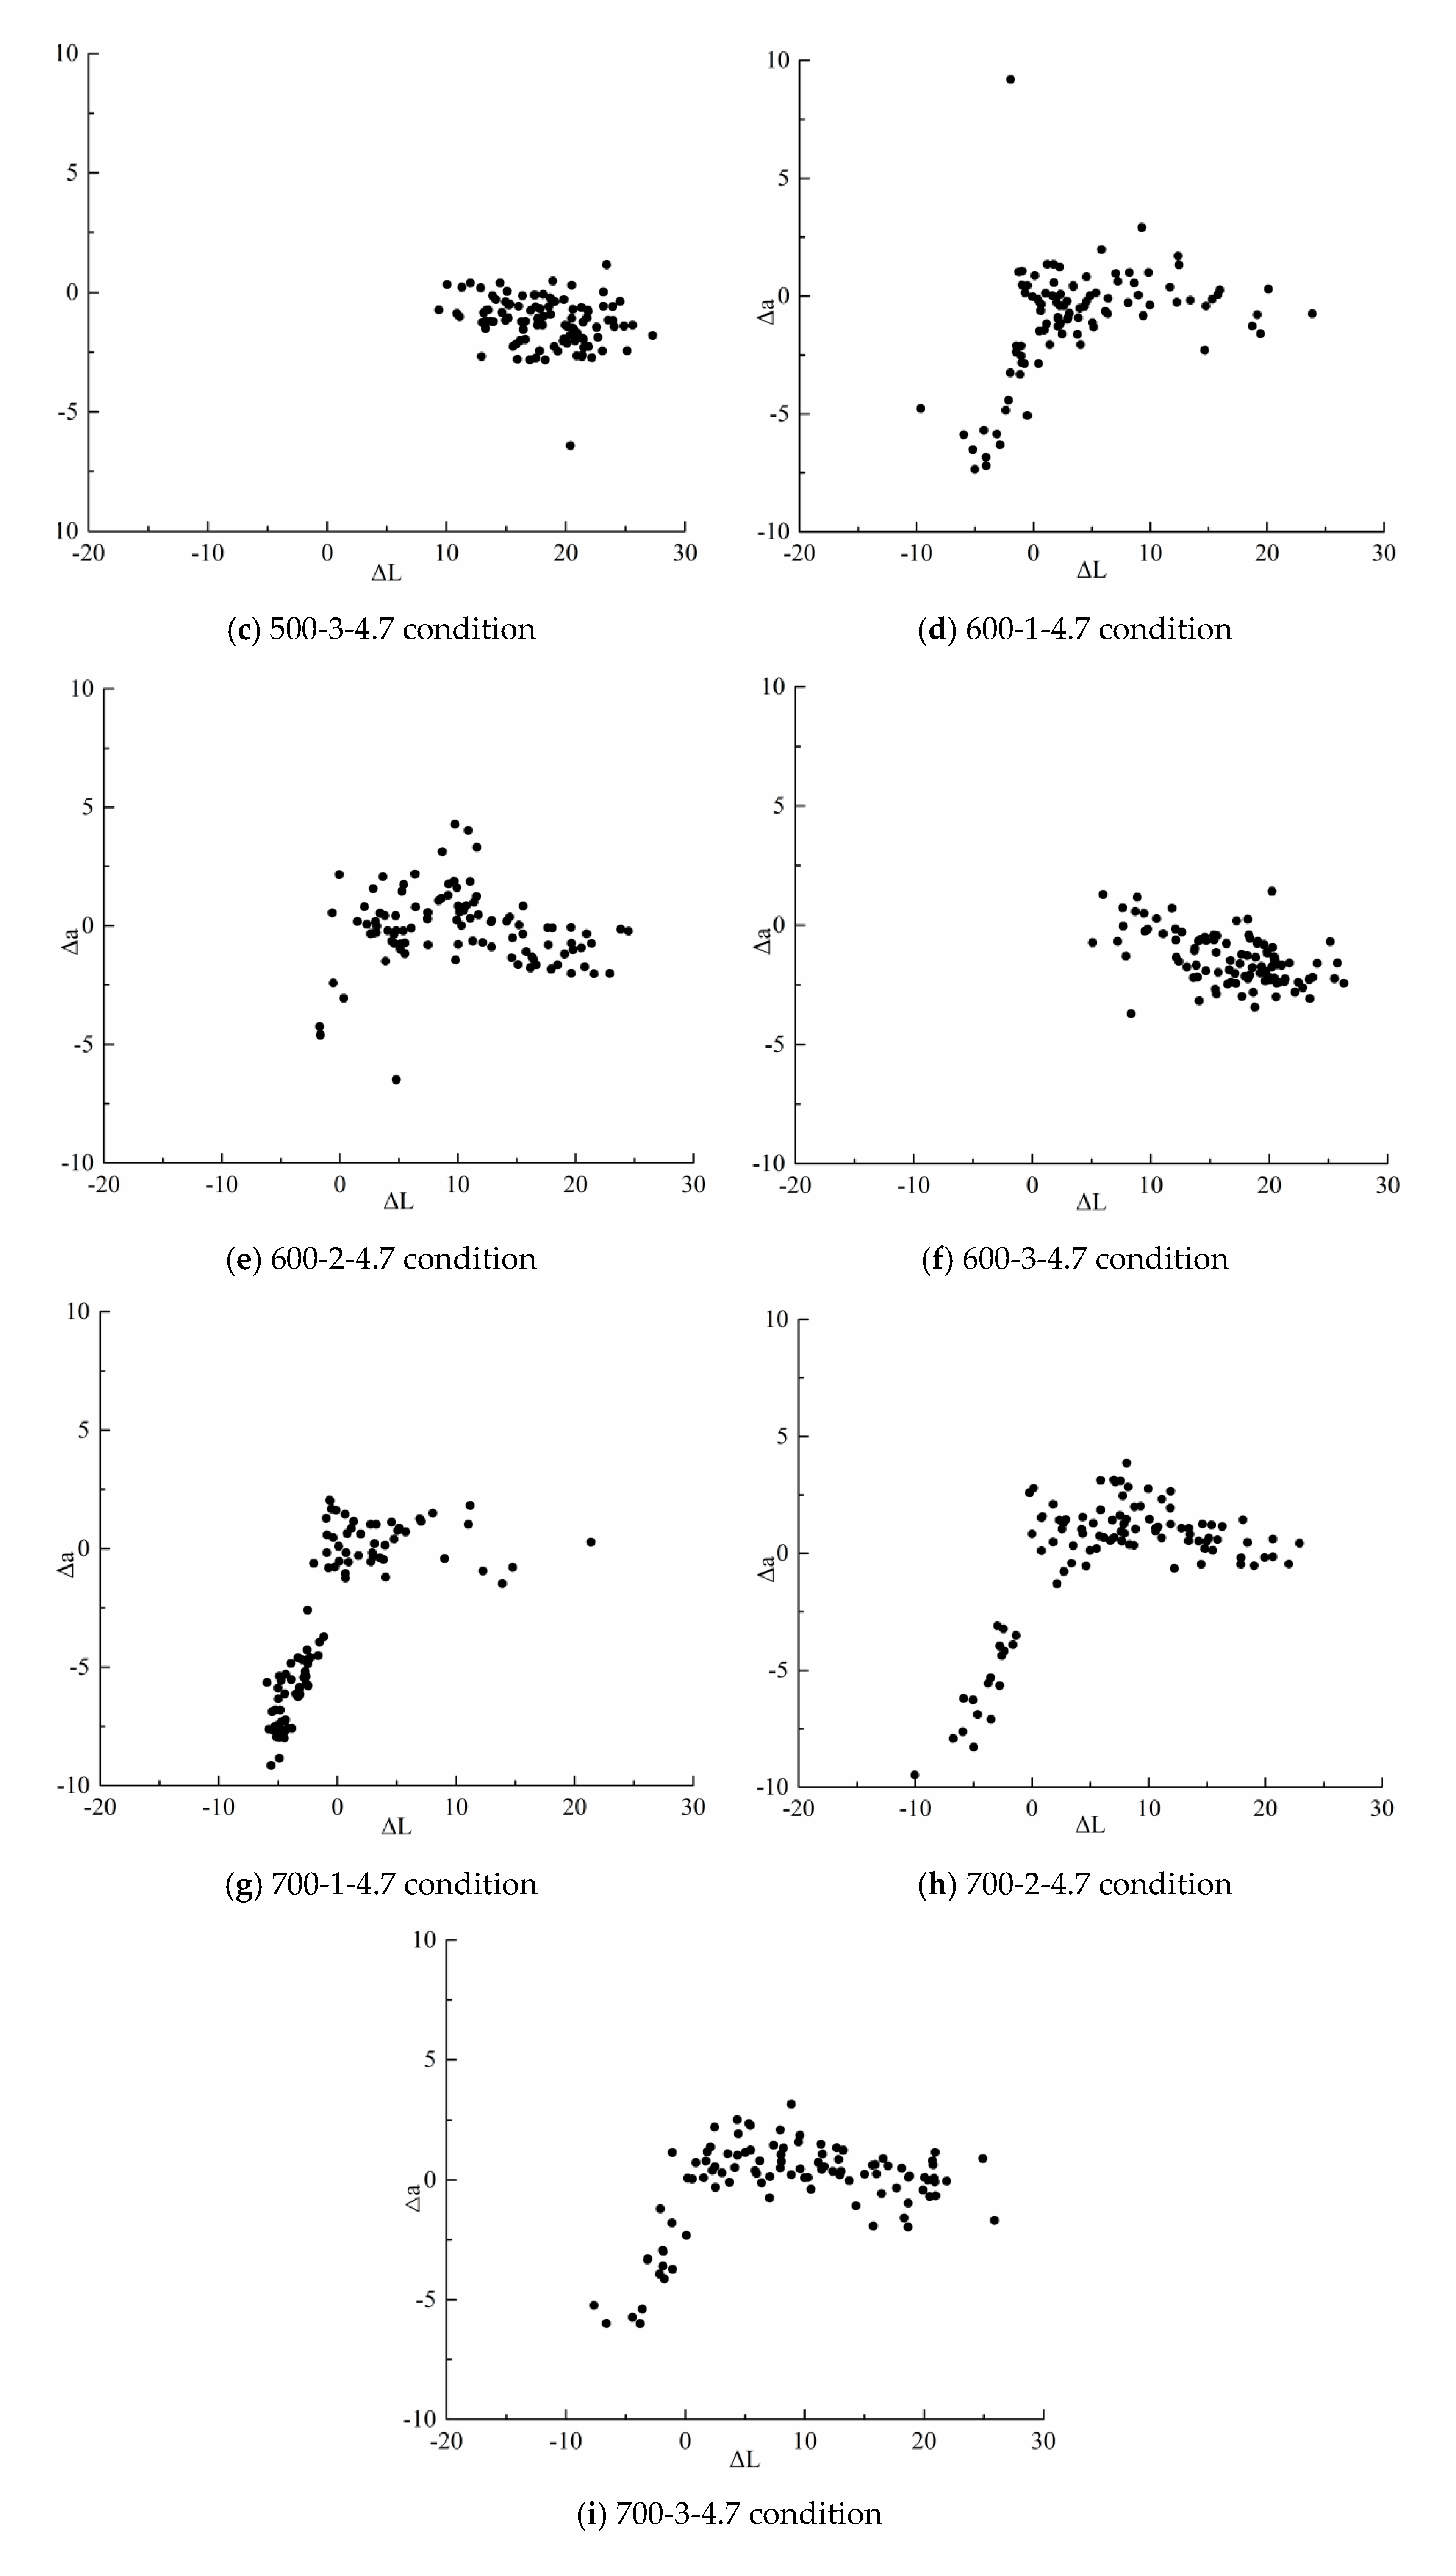
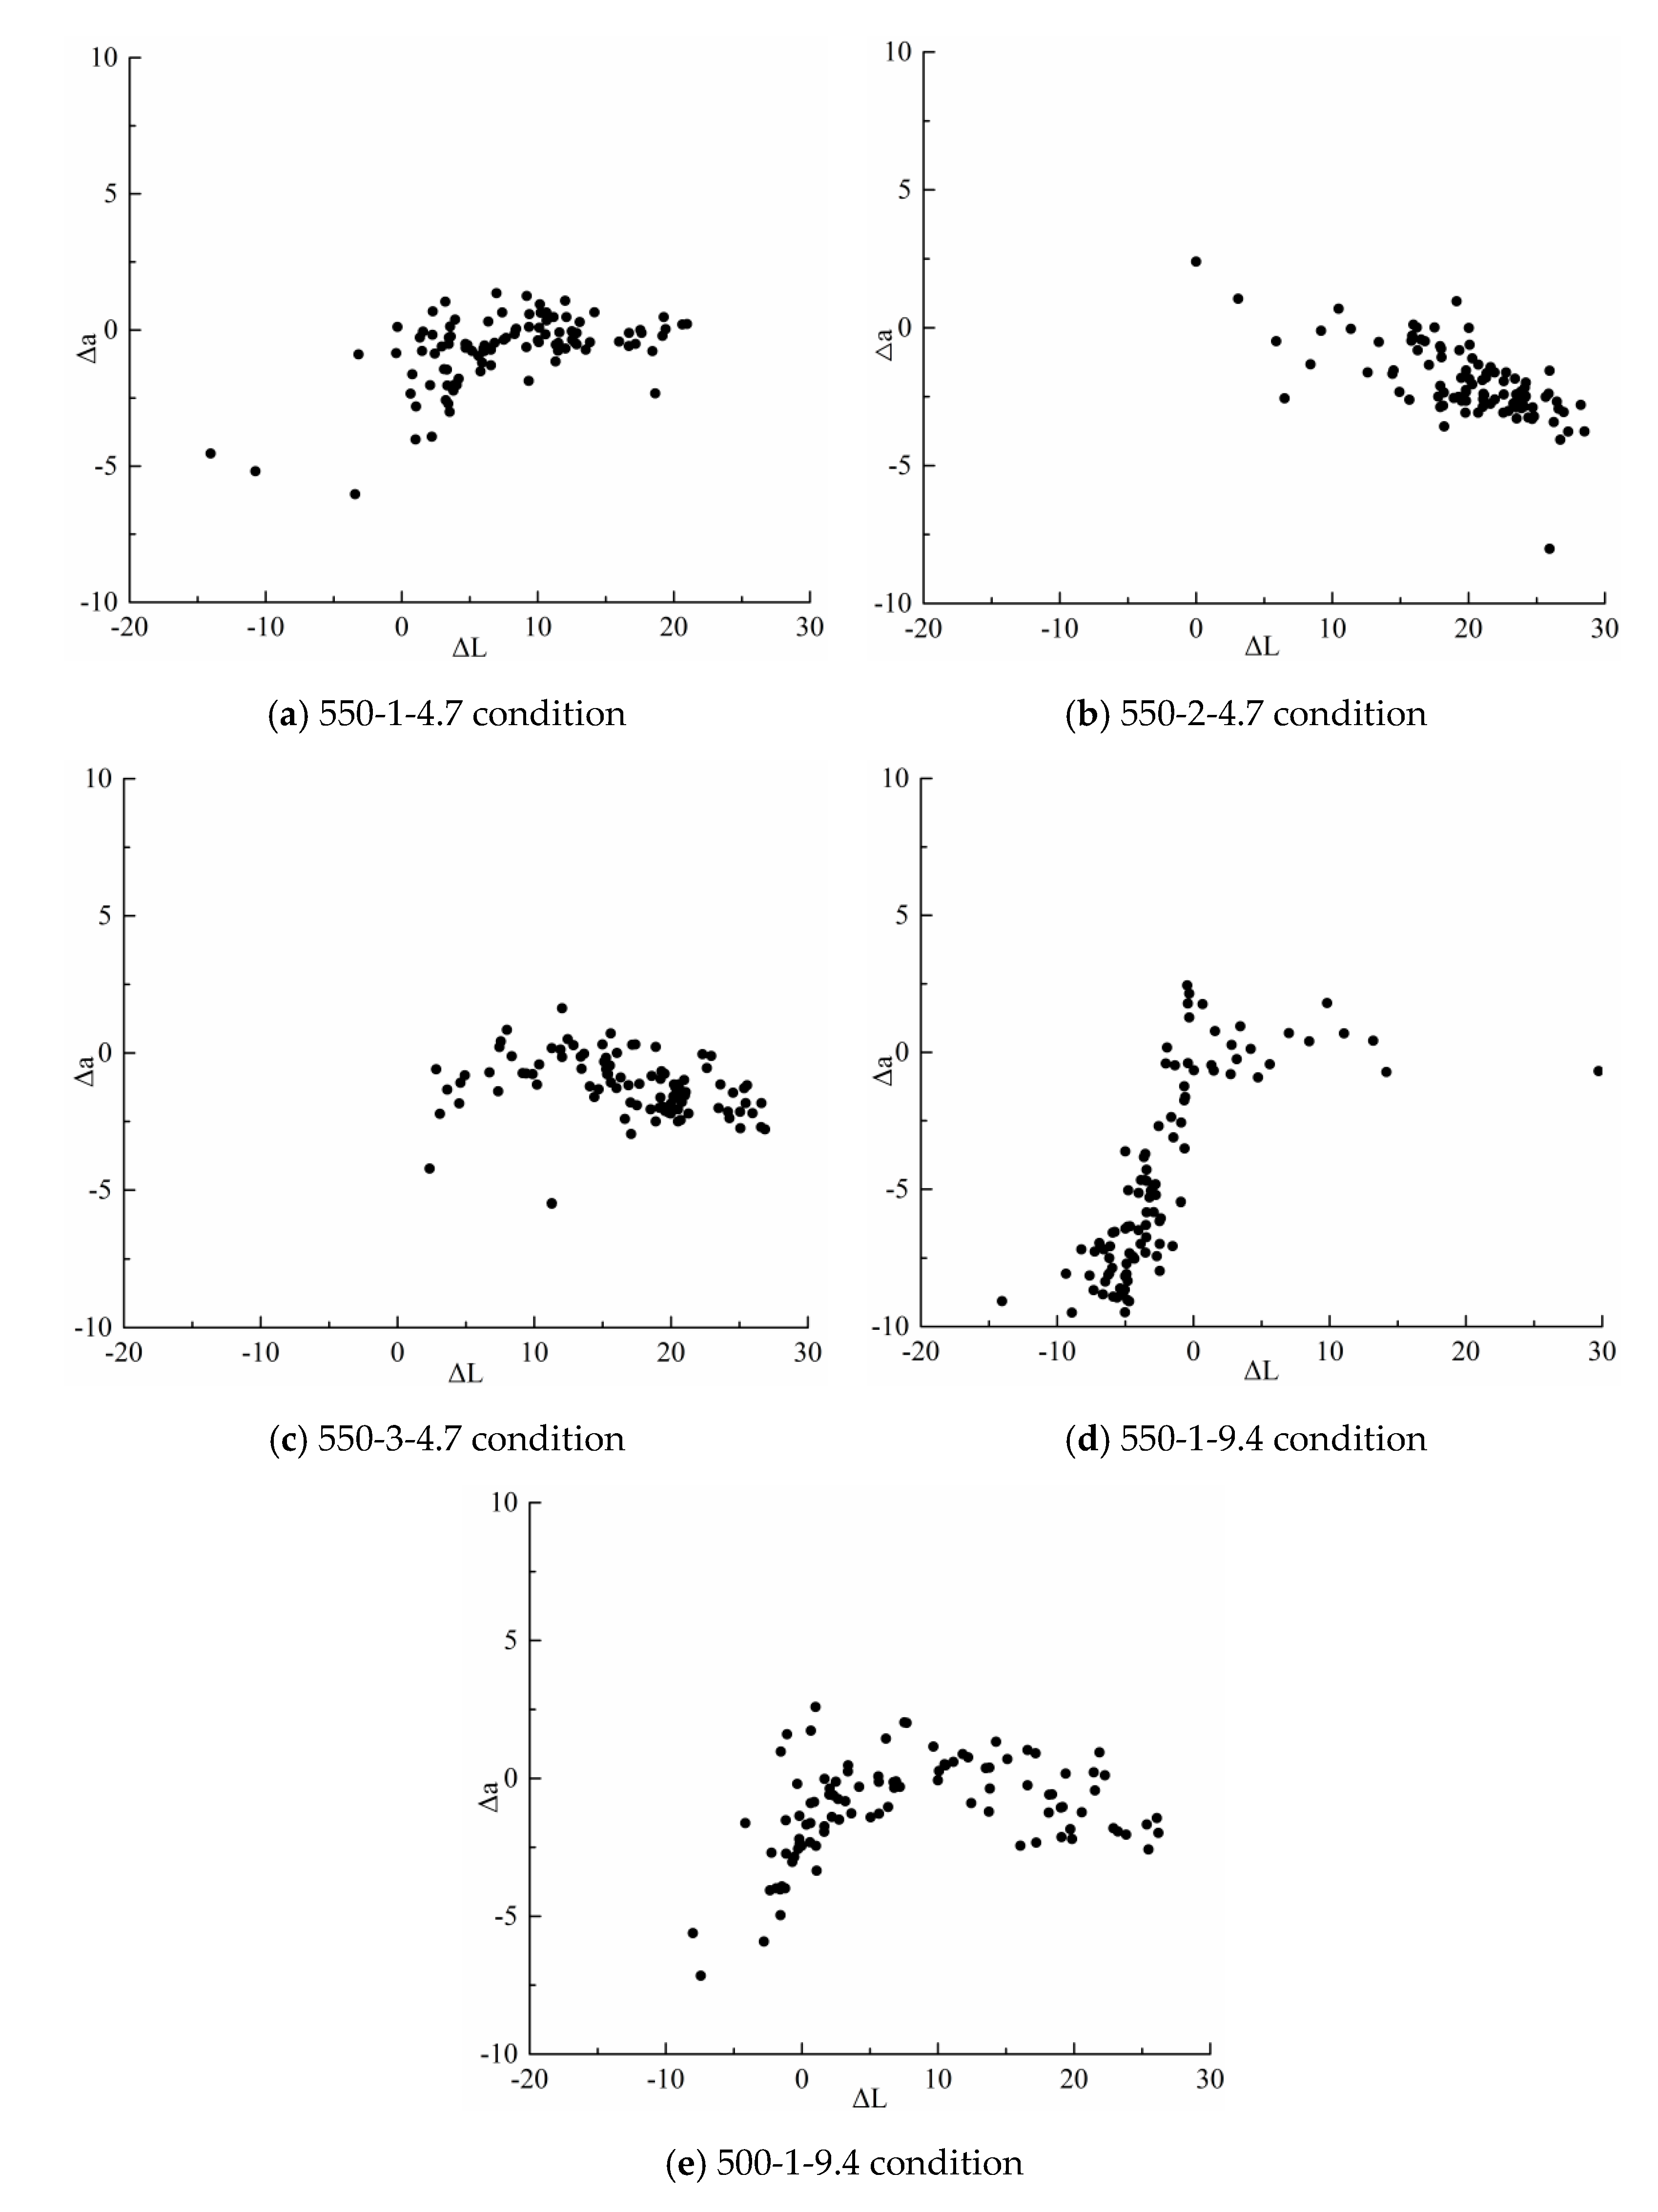
2.1.4. The Testing Method for Assessing the Compliance Rate of Torrefaction Products

The change in the color of the thermal decomposition of the lignocell is an effective method for evaluating the glucosic biomass. With the increase in temperature and the extension of pyrolysis time, the color of the material deepens [17]. The color space used to evaluate changes in color is based on the theory that the same color cannot simultaneously be yellow and blue. This theory establishes a three-dimensional model using numerical variations in the L, a, and b color coordinates to represent changes in human visual perception. In this model, L represents brightness from black (0) to white (100), a represents a shift from green (−) to red (+), and b represents a shift from blue (−) to yellow (+) [18].
Before measuring color differences, it is necessary to establish a reference value, typically by selecting untreated material as the basis for color coordinates in the color space, denoted as L0, a0, b0. Subsequently, the color of samples subjected to different processing conditions is measured and recorded as L, a, and b. These values are then compared to the reference values to calculate the color differences ΔL, Δa, and Δb in the three chromaticity coordinates. The total color difference ΔE is also derived from this process. The specific formula is as follows [19]:
L = L L 0
a = a a 0
b = b b 0
E = ( L 2 + a 2 + b 2 ) 1 / 2
Perform torrefaction experiments on corn straw within a helical reactor, varying temperature and feed rate conditions. Based on these different operating conditions, categorize the torrefied charcoal as “A-B-C.” Measure the color of the torrefied products in various conditions and calculate the color differences. The experimental conditions summary table is shown in Table 1.

3. Results and Discussion

3.1. Experimental Study on the Torrefaction of Corn Straw

3.1.1. Results of Torrefaction Product Conformity Rate Testing

The results of compliance rate testing for torrefaction products, based on the color difference method, under various torrefaction temperatures and processing capacities, are presented in Figure 4.
From Figure 4a–c, it can be observed that when the nitrogen hot carrier gas temperature is 500 °C, at any processing quantity, all biochar ΔL values are greater than 0, resulting in a conformity rate of 0 for establishing the torrefaction energy balance. Additionally, from the 2D plots of different processing quantities at this temperature, it can be seen that when the processing quantity is 1 kg, the projections of various biochars on the Δa coordinate are relatively scattered. Luz et al. [13], in their simulation of helical pyrolysis, discovered that the material exhibits a triangular distribution overall within the helix. In other words, when material is fed into the helix, the closer it gets to the end of the helix, the fewer the amount of material is present. This perspective explains the uneven torrefaction effect observed in corn straw when the processing quantity is 1 kg. Specifically, when the processing quantity is 1 kg, the corn straw located at the top of the triangular distribution is consistently in contact with the helical blades, the tube wall, and the nitrogen hot carrier gas inside the helical reactor. corn straw in this section of the helical reactor experiences both conductive heat transfer from contact with the helical blades and tube wall and convective heat transfer from the nitrogen hot carrier gas during the torrefaction process. As one approaches the inlet valve, the number of corn straws within the helix increases, leading to accumulation at the tail end. This phenomenon results in weaker convective heat transfer for corn straw entering the reactor later. Furthermore, corn straw located at the tail end, which is in direct contact with the wall, receives conductive heat from the wall surface. Corn straw not in direct contact with the wall can only receive heat transfer from the corn straw in contact with it. This situation results in some of the raw material achieving a better torrefaction effect, while the majority of the remaining raw material experiences inferior torrefaction results.
Figure 4d–f depicts the distribution at a carrier gas temperature of 600 °C. It can be observed that the distribution of points on the ΔL coordinate is less compact compared to when the carrier gas temperature is 500 °C. Additionally, as the processing quantity decreases, indicating a reduction in overall torrefaction effectiveness, most of the torrefaction samples gradually shift towards negative values on the ΔL coordinate. When the processing quantity is 1 kg, negative ΔL values already start to appear, with the majority of the biochar concentrated in the ΔL range of 0–10. When the processing quantity increases to 2 kg and is compared to the situation with a nitrogen hot carrier gas temperature of 500 °C and a processing quantity of 2 kg, it is observed that the distribution of biochar is more scattered. This is due to the increase in torrefaction temperature, which leads to an increase in the amount of heat absorbed at various positions in unit time due to increased convective and conductive heat transfer [20]. However, due to the varying spatial positions of multiple corn straws within the helical reactor, resulting in differences in heat absorption at each location, the color difference of the biochar under this condition exhibits a balanced distribution on ΔL as it changes with its spatial position. There are also some points distributed in the ΔL < 0 interval. However, when the processing quantity is 3 kg, the majority of the biochar exhibits a color difference greater than 10 in the brightness direction. The overall distribution is not significantly different from the situation with a nitrogen hot carrier gas temperature of 500 °C; however, there is no point distribution in the ΔL < 0 interval.
From Figure 4g–i, it can be observed that when the nitrogen hot carrier gas temperature is increased to 700 °C, corn straw enters the stage of intense torrefaction. It can also be seen from the figures that at this temperature, the color difference coordinate distribution patterns are very similar for the three processing quantities. When the processing quantity is 1 kg, the majority of brightness color differences are concentrated in the ΔL range from −10 to 0, with a few distributed in the 0–5 range, and only 6 points distributed in the ΔL > 10 range. This suggests that under this condition, it is possible to establish a complete energy balance for torrefaction, meaning that the heat generated by the combustion of volatile components during the torrefaction process is sufficient to provide the heat required for the torrefaction reaction. However, when the processing quantity increases to 2 kg, the overall coordinate distribution is scattered; however, a trend can be observed towards deviation in the direction of ΔL < 0. Furthermore, by comparing the results of the two conditions, one with a nitrogen hot carrier gas temperature of 700 °C and a processing quantity of 3 kg, and the other with a nitrogen hot carrier gas temperature of 600 °C and a processing quantity of 2 kg, it can be seen from the result plots that in the ΔL > 0 interval, they have a similar distribution. However, in the condition with a nitrogen hot carrier gas temperature of 700 °C and a processing quantity of 3 kg, there is a situation where ΔL < 0 points account for approximately 20% of the total quantity.
The conformity rates of the biochar for the nine mentioned conditions are shown in Table 2. It is observed that only one condition, 700-1-4.7, has a conformity rate exceeding 60%. Therefore, subsequent sections focus on condition optimization to improve the overall conformity rate.

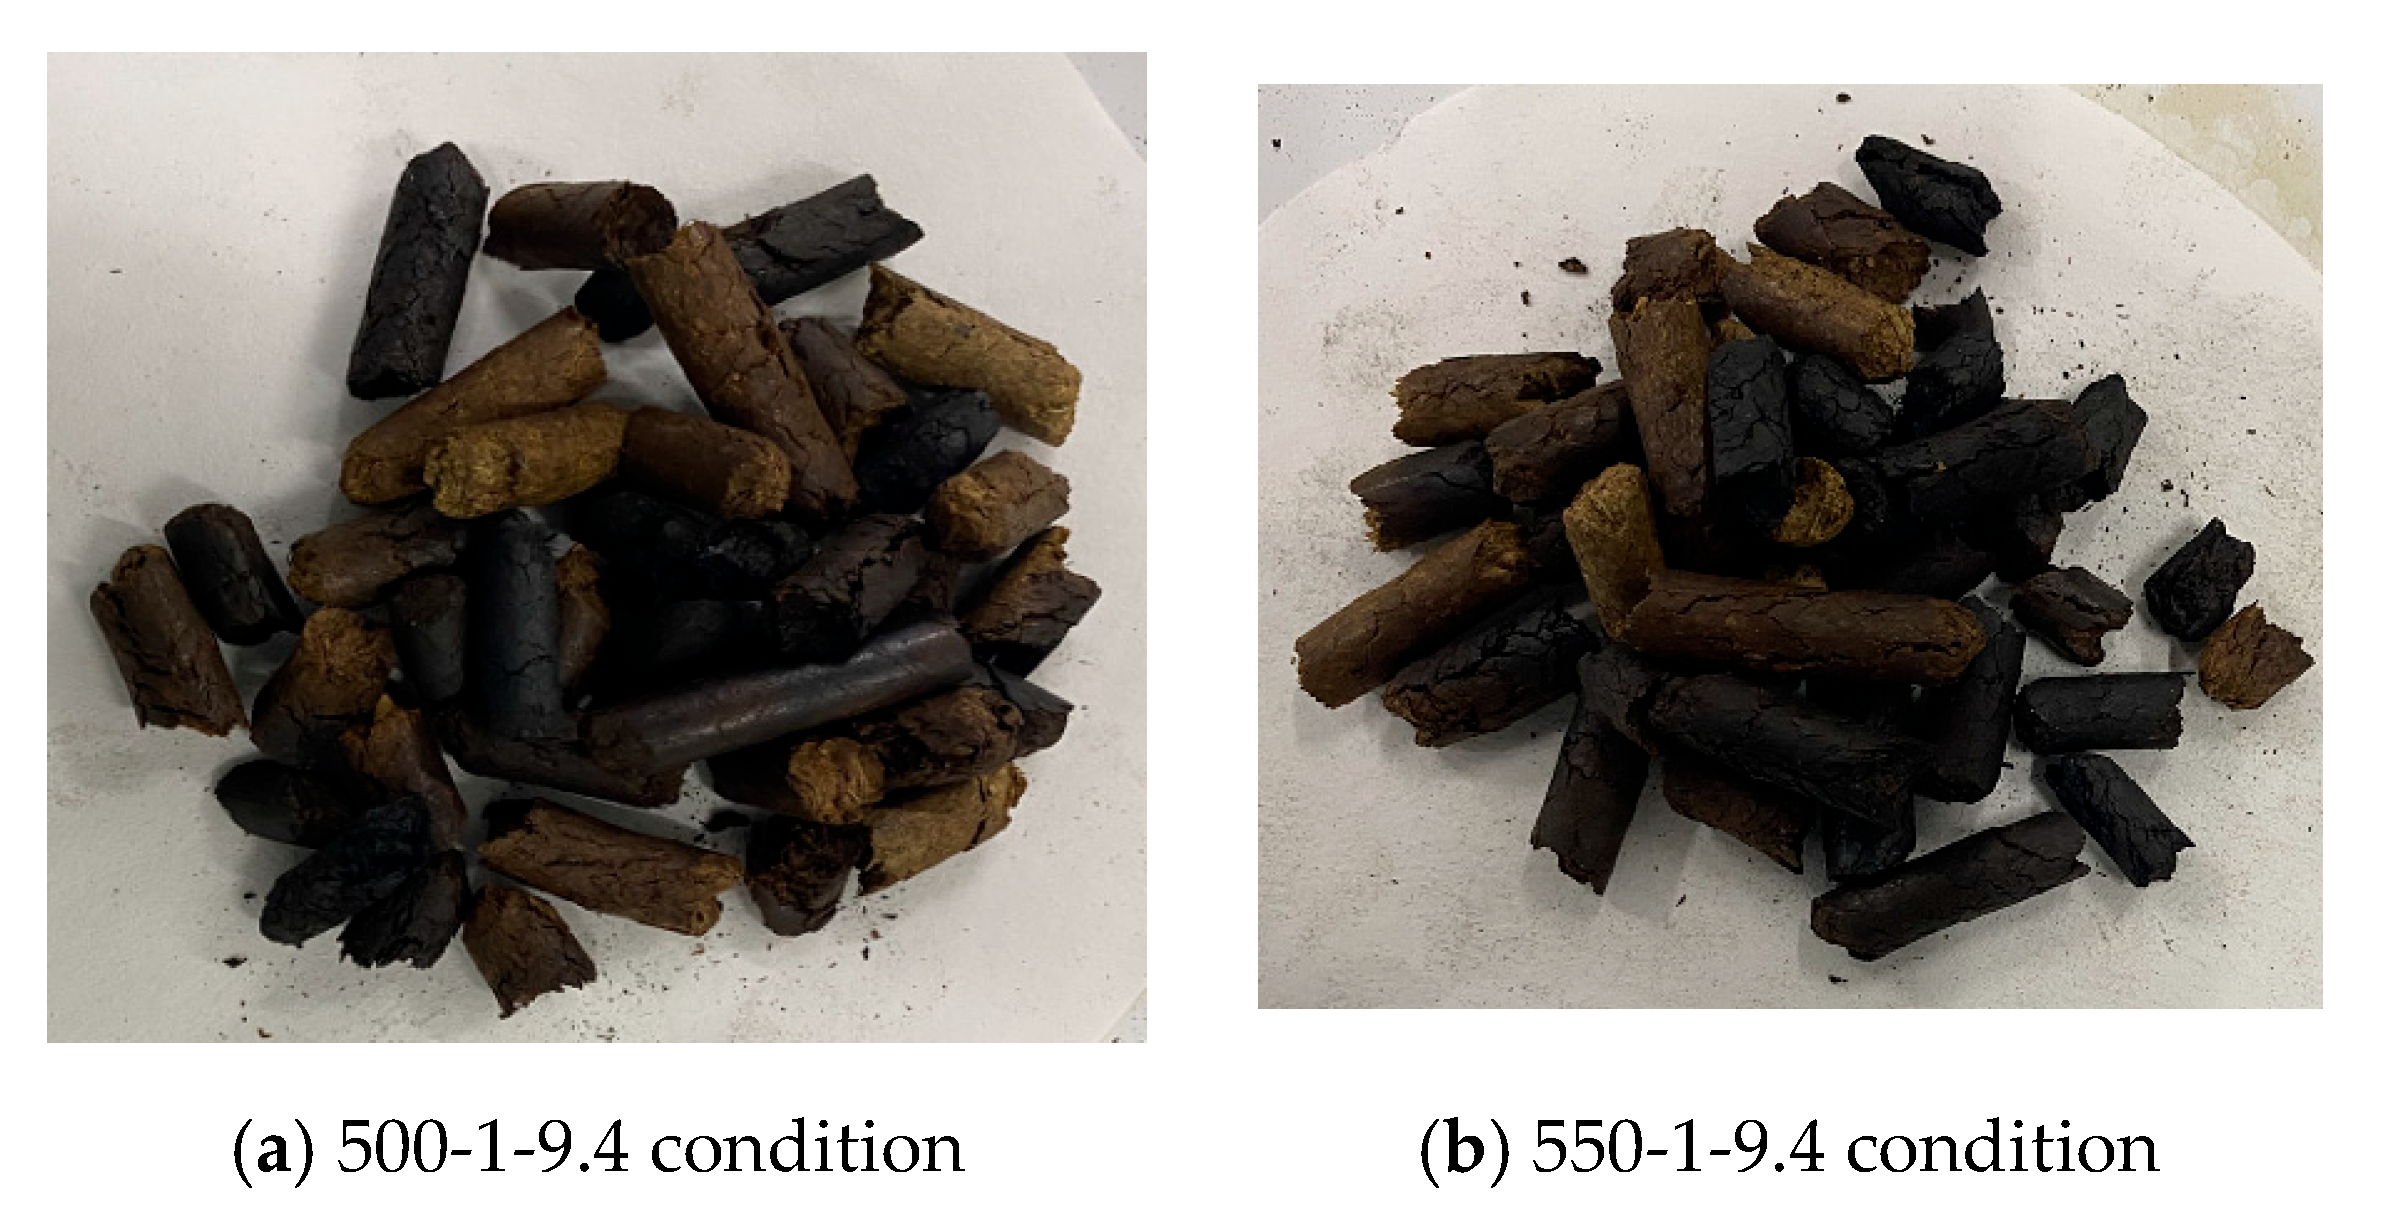
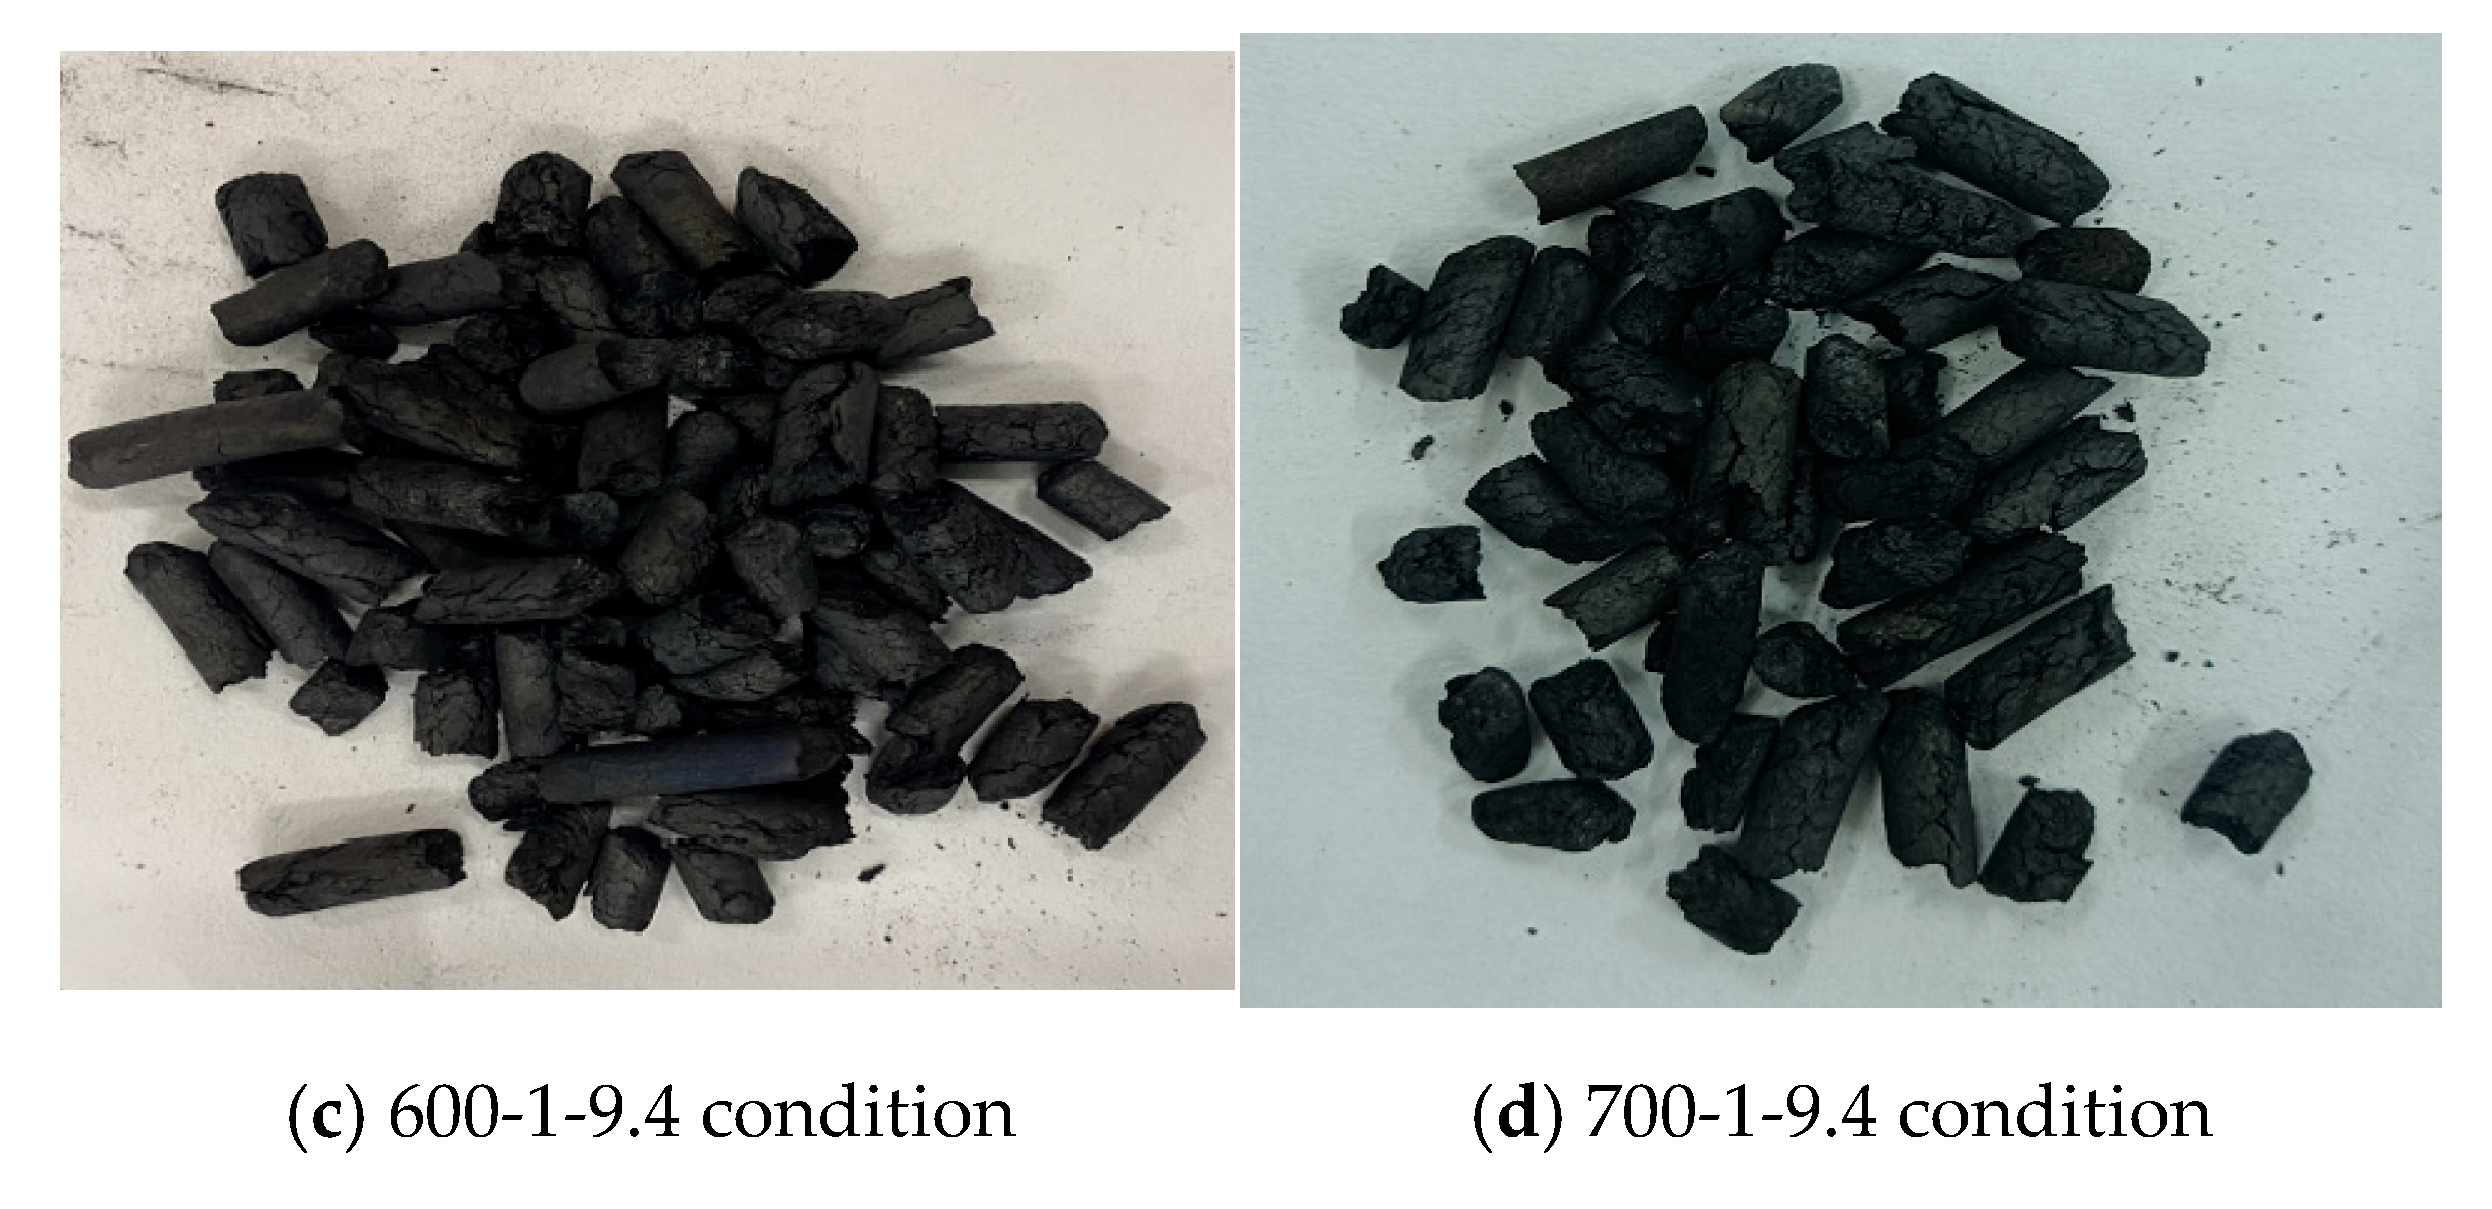
3.1.2. Results of Compliance Rate Determination After Optimization

When the nitrogen hot carrier gas temperature is relatively low, the heat carried by the hot carrier gas is insufficient to provide the heat required for torrefaction when the processing quantity is 3 kg. Increasing the gas flow rate of the nitrogen hot carrier to enhance convective heat transfer may help alleviate this issue. As mentioned above, when the processing quantity is 1 kg, the torrefaction effect is better. In this part of the study, a processing quantity of 1 kg was selected, and experiments were conducted by doubling the gas flow rate to a volumetric flow rate of 7.2 m3/h (mass flow rate of 9.4 kg/h). Additionally, nitrogen hot carrier gas at a temperature of 550 °C was used as a control group. Furthermore, torrefaction experiments were conducted with a mass flow rate of 4.7 kg/h, nitrogen hot carrier gas at a temperature of 550 °C, and processing quantities ranging from 1 to 3 kg. Color difference analyses were performed on the torrefied products, and specific results are presented in Figure 5 and Figure 6.
From Figure 5, it can be observed that when the temperature reaches 600 °C and 700 °C, all of the biochar has turned black, and upon weighing, it is found that this portion has experienced significant mass loss and has already undergone carbonization [21]. This indicates excessive torrefaction, and, therefore, the results from this portion are not suitable for analysis. By comparing Figure 4 with Figure 6, it can be observed that when the temperature is 550 °C and the processing quantity is 1 kg, the overall torrefaction effect is not significantly different from when the temperature is 600 °C and the processing quantity is 2 kg. However, when the processing quantity is 2 kg and 3 kg, the overall distribution is similar to that under 500 °C for 2 kg and 3 kg processing quantities, with the only difference being a relatively more scattered distribution at 550 °C. Furthermore, the conformity rate of the biochar under a gas flow rate of 4.7 kg/h at 550 °C also falls between the rates of 500 °C and 600 °C under the same gas flow rate, confirming the reliability of the obtained results.
The compliance rates under various conditions are summarized and compared with the results before condition optimization, as shown in Table 3.
Through a comparison of the color difference diagrams and conformity rates under different temperatures and an air intake flow rate of 9.4 kg/h, it can be observed that the increase in air flow rate significantly affects the color difference in the ΔL direction. Only at a nitrogen hot carrier gas temperature of 500 °C, the conformity rate reaches 23%, and, at this temperature, the color difference distribution on the 2D plane is similar to that when the air flow rate is 4.7 kg/h, the nitrogen hot carrier gas temperature is 700 °C, and the feed rate is 3 kg. Furthermore, through the optimization of increasing the air flow rate, the conformity rate at 500 °C after optimization is similar to the conditions before optimization at a nitrogen hot carrier gas temperature of 700 °C with processing quantities of 2 kg and 3 kg. When the temperature rises to 550 °C, it can be observed that the conformity rate at a processing quantity of 9.4 kg/h and a nitrogen hot carrier gas temperature of 550 °C is 81%, surpassing the conformity rate at an air flow rate of 4.7 kg/h and a nitrogen hot carrier gas temperature of 700 °C under the same feed rate (63%). This indicates that the former has a better torrefaction effect. Therefore, it can be concluded that when the corn straw feed rate is constant, increasing the hot carrier gas flow rate can indeed significantly enhance the torrefaction effect.

3.2. Energy Balance Study of Corn Straw Torrefaction Process

3.2.1. Measurement of Physicochemical Properties and Yield of Torrefaction Products

The torrefaction energy balance of corn straw involves using the combustion heat generated during the torrefaction process of gaseous and liquid by-products to provide energy for torrefaction, achieving self-sufficiency in the torrefaction process. To study energy balance, it is necessary to perform proximate and ultimate analyses as well as heat generation testing on the biochar under various conditions. Additionally, the lower heating value (LHV) is calculated based on Mad and Had. The specific results are presented in Table 4.
To calculate the energy balance, mass and energy yields under different conditions were computed using the formulas shown in (12) and (13). The calculation results are presented in Table 5.
Mass   Yield = W e i g h t   o f   t o r r i f i e d   b i o m a s s W e i g h t   o f   r a w   b i o m a s s × 100 %
Energy   Yield = Mass   Yield × HHV   of   torrified   biomass HHV   of   torrified   biomass × 100 %
While the mass yield (MY) shows a clear linear relationship with torrefaction effectiveness, the non-uniformity of torrefaction within the actual operating helical reactor makes it impractical to use MY as an indicator for evaluating torrefaction effectiveness and as the basis for establishing an energy balance. Therefore, in this section, the energy yield (EY) is adopted as the criterion for assessing whether an energy balance can be established. Wang et al. [22] found in their study that EY does not exhibit a trend with other factors when the temperature is the same but other influencing factors vary. However, looking at it overall, EY gradually decreases with increasing temperature, indicating that EY can indeed serve as a standard for assessing torrefaction effectiveness.
From Table 5, it can be seen that when the nitrogen hot carrier gas flow rate is 4.7 kg/h and the carrier gas temperature is 500 °C, even though there is some difference in the MY values, the EY values do not differ significantly and remain above 95%. This indicates that at lower torrefaction temperatures, the overall energy change in the biochar is not significant [23,24]. This may be because at a torrefaction temperature of 200 °C, corn straw primarily undergoes dehydration reactions with relatively minor changes in energy density. When the temperature rises to 550 °C, at a processing quantity of 1 kg, it is evident that there is a difference in EY values compared to a processing quantity of 2 kg and 3 kg, while the EY values for 2 kg and 3 kg processing quantities are quite similar. This phenomenon is also reflected at carrier gas temperatures of 600 °C and 700 °C. Furthermore, as the carrier gas temperature increases, EY shows a gradual decreasing trend overall.
When the nitrogen hot carrier gas flow rate is increased to 9.4 kg/h, it is evident that the EY values at various temperatures are significantly different from those when the nitrogen hot carrier gas flow rate is 4.7 kg/h. After optimizing the conditions by increasing the hot carrier gas flow rate, the torrefaction effectiveness at 500 °C is better than that at 550 °C and is close to the torrefaction effectiveness at 600 °C. Furthermore, when the temperature rises to 550 °C, the torrefaction effectiveness is better than that of the condition before optimization at a hot carrier gas flow rate of 700 °C and a processing quantity of 1 kg.

3.2.2. Discussion on the Energy Balance of the Corn Straw Torrefaction Process

Prior to this study, the authors investigated the torrefaction energy balance of corn straw at low processing quantities in a circulating fluidized bed [25]. Through torrefaction studies at different temperatures, residence times, and heating rates, it was found that at a temperature of 242 °C, the required heat for torrefaction was 1273 kJ/kg, and the HHV of the by-products remained around 1280 kJ/kg even when the heat loss reached 50%. This value was higher than the heat required for torrefaction at temperatures above 242 °C. Therefore, at a temperature of 242 °C, a heating rate of 6.28 °C/min, and a residence time of 60 min, corn straw achieved torrefaction energy balance in the circulating fluidized bed. Furthermore, under these conditions, the MY was 73.85%, and the HHV was 17042.6 kJ/kg. Combining the results from this study with those in Table 5, it can be observed that when the torrefaction temperature is 250 °C, the minimum values for MY and EY are 67.79% and 75.29%, respectively, while the maximum values are 78.63% and 83.79%, respectively. Based on these conclusions, theoretically, MY and EY need to be less than the minimum values at 250 °C in the fluidized bed experiment to achieve energy balance. However, in actual torrefaction processes, it is necessary to meet the requirements of torrefied product conformity, and this is only achieved when the nitrogen hot carrier gas temperature is 550 °C. In summary, based on the findings of this study, corn straw under high processing quantities in a helical torrefaction system can establish an energy balance when the nitrogen hot carrier gas temperature is 550 °C, the hot carrier gas flow rate is 9.4 kg/h, and the corn straw processing quantity is 1 kg.
This study is a continuation and expansion of the author’s previous research [25]. It has upgraded the torrefaction process from low processing quantities in fluidized bed technology to high processing quantities in a helical torrefaction system. The study has also clarified the torrefaction process parameters under energy balance conditions, providing a theoretical foundation for the industrial application of continuous and self-sustaining torrefaction processes for corn straw.
The findings of this study hold significant practical implications for the industrial application of torrefaction processes. The demonstration of a self-sustaining torrefaction process in the spiral reactor through the achievement of energy balance suggests that this technology has the potential to be scaled up for large-scale industrial applications. The optimization of torrefaction conditions, such as increasing the hot carrier gas flow rate, provides a clear pathway for improving product conformity and energy efficiency.
When compared to alternative torrefaction methods, such as fluidized bed reactors, the spiral reactor design may offer advantages in terms of better heat and mass transfer, more uniform torrefaction of biomass particles, and greater flexibility in process control. However, it is important to consider the economic feasibility of the spiral reactor technology. A cost-benefit analysis would be needed to assess the investment costs associated with the reactor construction and operation, as well as the potential revenue generated from the sale of torrefied biochar. The results of such an analysis would be crucial in determining the economic viability of the technology for industrial applications.

4. Conclusions

This study explored the self-sustaining torrefaction of corn straw using a custom-designed, small-scale helical torrefaction reactor. The results demonstrated that at low carrier gas flow rates, the heat absorption of corn straw is insufficient, resulting in poor conformity rates that fail to meet operational requirements. As the torrefaction temperature increased and the processing quantity decreased, sample color differences became more dispersed along the ΔL coordinate, tending toward negative values at higher temperatures, indicating a deeper degree of thermal conversion. To enhance product uniformity, a series of optimization experiments were conducted. It was found that when the nitrogen hot carrier gas flow rate was increased to 9.4 kg/h, the conformity rate of torrefied samples improved significantly across different temperature settings. For example, at a gas temperature of 550 °C and a processing quantity of 1 kg, the conformity rate reached 81%, notably higher than the rate observed under pre-optimization conditions, specifically at a gas flow rate of 4.7 kg/h and temperature of 700 °C for the same processing quantity.
In addition, our study provides a detailed analysis of the reaction characteristics and energy balance of the pyrolysis process of corn straw in a continuous screw reactor. By optimizing pyrolysis parameters such as the flow rate and temperature of the heat carrier gas, we significantly improved the compliance rate of pyrolysis products, which is critical for ensuring industrial product quality. Notably, under specific operating conditions—a gas temperature of 550 °C, a flow rate of 9.4 kg/h, and a feed rate of 1 kg—the pyrolysis process achieved self-sustained operation, with both energy yield (EY) and mass yield (MY) reaching high levels. This represents a practical and feasible approach to the self-sustained pyrolysis of corn straw, in contrast to previous studies that often relied on external energy input or failed to achieve optimal compliance under similar conditions. Furthermore, our study highlights the impact of feed rate on the quality of pyrolysis products, providing important guidance for industrial-scale production in terms of controlling processing speed while ensuring product quality. Overall, these findings not only lay a solid theoretical and experimental foundation for the development and large-scale application of efficient biomass pyrolysis systems but also contribute to the efficient utilization and sustainable development of biomass energy.
While the large-scale production of torrefied corn straw residue presents promising environmental benefits such as waste reduction, resource recovery, and renewable energy production, it also poses challenges in terms of energy consumption, air pollution risks, and water usage/wastewater management. Nevertheless, the current study has some limitations, including the lack of a comprehensive characterization of torrefied products and the need to explore the system’s performance under continuous operation and its adaptability to diverse biomass types. Future research should focus on integrating advanced analytical techniques to deepen our understanding of torrefaction mechanisms and evaluating the reactor’s performance across various feedstocks and scaling conditions, with the ultimate goal of advancing the practical application of self-sustaining torrefaction technologies in biomass energy conversion.

Author Contributions

Conceptualization, Y.W. and X.Z.; methodology, J.M.; software, X.D.; validation, M.Z.; formal analysis, T.G.; investigation, M.Z.; resources, X.D.; data curation, X.Z.; writing—original draft preparation, Y.W.; writing—review and editing, J.M.; visualization, X.D.; supervision, J.M.; project administration, T.G.; funding acquisition, Y.W. All authors have read and agreed to the published version of the manuscript.

Funding

This research was funded by the Research Funds of Xianyang Polytechnic Institute (Fund No.2022BK01).

Data Availability Statement

The original contributions presented in this study are included in the article. Further inquiries can be directed to the corresponding authors.

Conflicts of Interest

Author Jiyou Mu was employed by CHN Energy (Fuzhou) Thermal Power Co, Ltd., and Author Tiankuo Guo was employed by Beijing Chaoyang Environment Group Company Limited. All authors declare that the research was conducted in the absence of any commercial or financial relationships that could be construed as a potential conflict of interest.

Nomenclature

DOuter diameter of the spiralνKinematic viscosity
dDiameter of the spiral shaftRadiant heat flux
SPitch of the spiralTwWall temperature
nMaximum operational rotational speed of the spiral shaftLBrightness coordinate in color space
KComprehensive coefficientΔLColor difference in the brightness coordinate
ΨFill factoraRed–green coordinate in color space
γUnit volume mass of the materialΔaColor difference in the red-green coordinate
CTilt angle coefficientbYellow–blue coordinate in color space
QFlow rateΔbColor difference in the yellow-blue coordinate
TTemperaturehHeight
βHeating rateMYMass yield
EaActivation energyEYEnergy yield
APre-exponential factorTGAThermogravimetric Analyzer
lLength over which the fluid passes the wallDTGDifferential Thermogravimetry
ρDensity of air HHVHigher Heating Value
cpSpecific heat at constant pressure LHVLower Heating Value
λThermal conductivity MadMoisture content
εEmissivity (painted surface)AadAsh content
PrPrandtl number VadVolatile matter content
gGravitational accelerationFCadFixed carbon content
αvCoefficient of volume expansionCadCarbon content
ΔETotal color differenceHadHydrogen content
ΔtTemperature difference between the wall and the fluidOadOxygen content
σStefan–Boltzmann constantNadNitrogen content
NuNusselt numberSadSulfur content
Gr Grashof NumberMFCMass flow computer

References

  1. Liu, X.; Tu, S.; Liu, J.; Liu, Z. Emission Forecasting from Open Burning of Crop Straw and Policy Analysis: The Case for China. Energy Rep. 2023, 9, 2568. [Google Scholar] [CrossRef]
  2. Wang, Z.; Xie, K.; Zhu, W.; Zhang, L.; Zhao, Z.; Xu, L.; Yang, J.; Shen, B. Effects of Oxygen Deficient and Flue Gas Torrefaction on the Surface Property and Structural Feature of Typical Agriculture Waste: Rice Husk. Fuel 2022, 327, 125211. [Google Scholar] [CrossRef]
  3. Guo, S.; Liu, L.; Zhao, D.; Zhao, C.; Li, X.; Li, G. Optimization of Briquette Fuels by Co-Torrefaction of Residual Biomass and Plastic Waste Using Response Surface Methodology. Molecules 2023, 28, 2568. [Google Scholar] [CrossRef]
  4. Zhao, Z.; Feng, S.; Zhao, Y.; Wang, Z.; Ma, J.; Xu, L.; Yang, J.; Shen, B. Investigation on the fuel quality and hydrophobicity of upgraded rice husk derived from various inert and oxidative torrefaction conditions. Renew. Energ. 2022, 189, 1234–1248. [Google Scholar] [CrossRef]
  5. Nunes, L.J.R.; Matias, J.C.O.; Catalão, J.P.S. A Review on Torrefied Biomass Pellets as a Sustainable Alternative to Coal in Power Generation. Renew. Sustain. Energy Rev. 2014, 40, 394–402. [Google Scholar] [CrossRef]
  6. Hu, Z.; Wang, M.; Jiang, E. A Novel Continuous Reactor with Shaftless Spiral for Chemical Looping Gasification and the Control of Operating Parameters. J. Energy Inst. 2020, 93, 2084–2095. [Google Scholar] [CrossRef]
  7. Porat, A.; Careaga, F.; Briens, L.; Briens, C. Design and development of a rotating heater pyrolysis reactor. Can. J. Chem. Eng. 2020, 100, 25–37. [Google Scholar] [CrossRef]
  8. Zhao, L.; Jia, J.; Yao, Z.; Cong, H.; Wang, J.; Zhang, X. Equipment for Biomass Continuous Grading Pyrolysis. Trans. Chin. Soc. Agric. Mach. 2016, 47, 220–226. [Google Scholar] [CrossRef]
  9. Qin, L.; Shao, Y.; Hou, Z.; Jiang, E. Effect of Temperature on the Physicochemical Characteristics of Pine Nut Shell Pyrolysis Products in a Screw Reactor. Energy Sources Part A Recovery Util. Environ. Eff. 2020, 42, 2831–2843. [Google Scholar] [CrossRef]
  10. Aladin, A.; Alwi, R.S.; Syarif, T. Design of Pyrolysis Reactor for Production of Bio-Oil and Bio-Char Simultaneously. AIP Conf. Proc. 2017, 1840, 110010. [Google Scholar] [CrossRef]
  11. Isemin, R.L.; Kuzmin, S.N.; Konyakhin, V.V.; Milovanov, O.Y.; Mikhalev, A.V.; Muratova, N.S.; Nebyvayev, A.V.; Kokh-Tatarenko, V.S. Development of a Fluidized-Bed Reactor for Oxidative Torrefaction of Biowastes. Therm. Eng. 2020, 67, 626–633. [Google Scholar] [CrossRef]
  12. Liu, X.; Yao, Z.; Zhao, L.; Song, J.; Jia, J. Torrefaction of Sorghum Straw Pellets in a Stationary Reactor with a Feeding Screw. Energy Fuels 2020, 34, 5997–6007. [Google Scholar] [CrossRef]
  13. Codignole Luz, F.; Cordiner, S.; Manni, A.; Mulone, V.; Rocco, V. Biomass Fast Pyrolysis in a Shaftless Screw Reactor: A 1-D Numerical Model. Energy 2018, 157, 792–805. [Google Scholar] [CrossRef]
  14. Bruun, E.W.; Hauggaard-Nielsen, H.; Ibrahim, N.; Egsgaard, H.; Ambus, P.; Jensen, P.A.; Dam-Johansen, K. Influence of Fast Pyrolysis Temperature on Biochar Labile Fraction and Short-Term Carbon Loss in a Loamy Soil. Biomass Bioenergy 2011, 35, 1182–1189. [Google Scholar] [CrossRef]
  15. Zhao, R.; Guo, L.; Gao, W.; Xiao, X.; Liu, Y. Structure Optimization Design of Screw Conveyor Based on EDEM. J. Phys. Conf. Ser. 2022, 2200, 012014. [Google Scholar] [CrossRef]
  16. Xu, Q. Design and Simulation of Screw Drum Biomass Continuous Pyrolysis Device Feeder. Cumt 2017. [Google Scholar]
  17. Chen, W.H.; Lin, B.J.; Lin, Y.Y.; Chu, Y.S.; Ubando, A.T.; Show, P.L.; Ong, H.C.; Chang, J.S.; Ho, S.H.; Culaba, A.B.; et al. Progress in Biomass Torrefaction: Principles, Applications and Challenges. Prog. Energy Combust. Sci. 2021, 82, 100885. [Google Scholar] [CrossRef]
  18. Asadipour, H.; Alizadeh, M.; Ashrafizadeh, F. Evaluation of Graphene Transparent Coating on Copper for Color and Oxidation Control at Low Temperatures. Diam. Relat. Mater. 2022, 130, 109502. [Google Scholar] [CrossRef]
  19. Kačíková, D.; Kačík, F.; Čabalová, I.; Ďurkovič, J. Effects of Thermal Treatment on Chemical, Mechanical and Colour Traits in Norway Spruce Wood. Bioresour. Technol. 2013, 144, 669–674. [Google Scholar] [CrossRef]
  20. Ren, X.; Sun, R.; Meng, X.; Vorobiev, N.; Schiemann, M.; Levendis, Y.A. Carbon, Sulfur and Nitrogen Oxide Emissions from Combustion of Pulverized Raw and Torrefied Biomass. Fuel 2017, 188, 310–323. [Google Scholar] [CrossRef]
  21. Zhang, L.; Wang, Z.; Ma, J.; Kong, W.; Yuan, P.; Sun, R.; Shen, B. Analysis of Functionality Distribution and Microstructural Characteristics of Upgraded Rice Husk after Undergoing Non-Oxidative and Oxidative Torrefaction. Fuel 2022, 310, 122477. [Google Scholar] [CrossRef]
  22. Wang, Z.; Li, H.; Lim, C.J.; Grace, J.R. Oxidative Torrefaction of Spruce-Pine-Fir Sawdust in a Slot-Rectangular Spouted Bed Reactor. Energy Convers. Manag. 2018, 174, 276–287. [Google Scholar] [CrossRef]
  23. Liu, Y.; Rokni, E.; Yang, R.; Ren, X.; Sun, R.; Levendis, Y.A. Torrefaction of Corn Straw in Oxygen and Carbon Dioxide Containing Gases: Mass/Energy Yields and Evolution of Gaseous Species. Fuel 2021, 285, 119044. [Google Scholar] [CrossRef]
  24. Wang, L.; Sha, L.; Zhang, S.; Cao, F.; Ren, X.; Levendis, Y.A. Preparation of Activated Coke by Carbonization, Activation, Ammonization and Thermal Treatment of Sewage Sludge and Waste Biomass for SO2 Absorption Applications. Fuel Process. Technol. 2022, 231, 107233. [Google Scholar] [CrossRef]
  25. Guo, S.; Guo, T.; Che, D.; Liu, H.; Sun, B. Response Surface Analysis of Energy Balance and Optimum Condition for Torrefaction of Corn Straw. Korean J. Chem. Eng. 2022, 39, 1287–1298. [Google Scholar] [CrossRef]
Figure 1. Scheme diagram of spiral torrefaction facility.
Processes 13 01302 g001
Figure 2. Scheme diagram of valve and bearing support.
Processes 13 01302 g002
Figure 3. Temperature changes of measurement points at different inlet temperatures.
Processes 13 01302 g003
Figure 4. Two-dimensional color mapping of torrefied biochar obtained under various conditions before optimization. Note: ΔL and Δa are standard parameters in the CIELAB color space, and their values represent dimensionless units of color difference.
Processes 13 01302 g004aProcesses 13 01302 g004b
Figure 5. Color diagram of torrefaction biochar obtained under different conditions.
Processes 13 01302 g005aProcesses 13 01302 g005b
Figure 6. Two-dimensional color mapping of torrefied biochar obtained under various conditions after optimization. Note: ΔL and Δa are standard parameters in the CIELAB color space, and their values represent dimensionless units of color difference.
Processes 13 01302 g006
Table 1. Experimental conditions summary table: settings of temperature, feed rates, and gas flow rates.
ConditionsTemperatures (°C)Feed Rates (kg/h)Gas Flow Rates (kg/h)
150014.7
250024.7
350034.7
460014.7
560024.7
660034.7
770014.7
870024.7
970034.7
1050019.4
1155019.4
1260019.4
1370019.4
Table 2. Compliance rate under different conditions before optimization.
Operating condition500-1-4.7500-2-4.7500-3-4.7
Compliance rate(%)000
Operating condition600-1-4.7600-2-4.7600-3-4.7
Compliance rate(%)2750
Operating condition700-1-4.7700-2-4.7700-3-4.7
Compliance rate(%)631916
Table 3. Comparison of compliance rate before and after optimization.
Operating condition (Before optimization)550-1-4.7550-2-4.7550-3-4.7
Compliance rate (%)600
Operating condition (After optimization)500-1-9.4550-1-9.4600-1-9.4700-1-9.4
Compliance rate (%)2381100100
Table 4. Results of proximate, ultimate analysis, and heating values at different conditions.
Operating ConditionProximate AnalysesUltimate AnalysesHHV (kJ/kg)LHV (kJ/kg)
MadAadVadFCadCadHadOadNadSad
Raw material3.047.6271.9317.4143.385.120.5540.180.1115.5614.33
500-1-4.72.228.1972.1017.4943.645.160.4840.230.0817.2716.05
500-2-4.71.789.6171.5217.0943.045.110.5039.880.0817.0515.86
500-3-4.71.669.5471.4817.3243.225.110.4839.900.0917.0915.90
550-1-4.71.378.2971.9418.444.855.180.5239.660.1317.6416.44
550-2-4.72.807.9472.0817.1843.265.160.5040.240.1016.9915.76
550-3-4.71.489.1972.2317.1043.605.180.5039.950.1017.1915.99
600-1-4.72.129.3969.4419.0544.855.030.5437.990.0817.7816.60
600-2-4.71.628.8671.4218.1044.155.140.5039.630.1017.4516.25
600-3-4.71.949.6771.3617.0343.125.110.5039.560.1016.9515.75
700-1-4.71.7210.5967.6620.0345.184.930.5736.930.0817.4616.31
700-2-4.71.168.7670.4419.6445.185.130.5339.160.0817.8416.66
700-3-4.71.548.6271.5818.2644.515.140.4839.600.1117.6116.42
500-1-9.42.009.5570.0018.4544.325.060.5238.470.0817.4916.30
550-1-9.41.889.8666.7821.4846.344.880.5736.390.0817.5816.44
600-1-9.42.2623.0620.4654.2263.122.760.977.760.0722.5023.82
700-1-9.42.0623.1320.5454.2762.182.870.988.710.0724.4223.72
Table 5. Results of mass and energy yields under different conditions.
Operating condition500-1-4.7500-2-4.7500-3-4.7500-1-9.4550-1-4.7550-2-4.7550-3-4.7550-1-9.4
MY (%)86.5588.4890.1272.1473.3685.8487.5858.84
EY (%)96.0696.9598.9881.0983.1793.7396.7566.48
Operating condition600-1-4.7600-2-4.7600-3-4.7600-1-9.4700-1-4.7700-2-4.7700-3-4.7700-1-9.4
MY (%)67.5074.8778.4943.7359.4770.4972.0634.08
EY (%)77.1383.9685.5068.8666.7380.8281.5553.49
Disclaimer/Publisher’s Note: The statements, opinions and data contained in all publications are solely those of the individual author(s) and contributor(s) and not of MDPI and/or the editor(s). MDPI and/or the editor(s) disclaim responsibility for any injury to people or property resulting from any ideas, methods, instructions or products referred to in the content.

