Article

Fracture Competitive Propagation and Fluid Dynamic Diversion During Horizontal Well Staged Hydraulic Fracturing

1
School of Petroleum Engineering, China University of Petroleum (East China), Qingdao 266580, China
2
Research Institute of Petroleum Engineering Technology, Sinopec Northwest Oilfield Company, Urumqi 830011, China
3
Exploration Business Department of PetroChina Changqing Oilfield Branch, PetroChina, Xi’an 710018, China
4
Karamay Campus Petroleum Institute, China University of Petroleum-Beijing, Karamay 834000, China
*
Author to whom correspondence should be addressed.
Processes 2025, 13(7), 2252; https://doi.org/10.3390/pr13072252
Submission received: 19 May 2025 / Revised: 1 July 2025 / Accepted: 9 July 2025 / Published: 15 July 2025
(This article belongs to the Special Issue Complex Fluid Dynamics Modeling and Simulation, 2nd Edition)

Abstract

This study addresses the challenge of non-uniform fracture propagation in multi-cluster staged fracturing of horizontal wells by proposing a three-dimensional dynamic simulation method for temporary plugging fracturing, grounded in a fully coupled fluid–solid damage theory framework. A Tubing-CZM (cohesive zone model) coupling model was developed to enable real-time interaction computation of flow distribution and fracture propagation. Focusing on the Xinjiang X Block reservoir, this research systematically investigates the influence mechanisms of reservoir properties, engineering parameters (fracture spacing, number of perforation clusters, perforation friction), and temporary plugging parameters on fracture propagation morphology and fluid allocation. Our key findings include the following. (1) Increasing fracture spacing from 10 m to 20 m enhances intermediate fracture length by 38.2% and improves fracture width uniformity by 21.5%; (2) temporary plugging reduces the fluid intake heterogeneity coefficient by 76% and increases stimulated reservoir volume (SRV) by 32%; (3) high perforation friction (7.5 MPa) significantly optimizes fracture uniformity compared to low-friction (2.5 MPa) scenarios, balancing flow allocation ratios between edge and central fractures. The proposed dynamic flow diversion control criteria and quantified temporary plugging design standards provide critical theoretical foundations and operational guidelines for optimizing unconventional reservoir fracturing.

1. Introduction

Hydraulic fracturing technology is not only widely applied in conventional oil and gas development but is also critical for enhancing CO2 injectivity in tight formations during carbon capture, utilization, and storage (CCUS) operations; meanwhile, horizontal well staged multi-cluster fracturing, as a cornerstone technology for unconventional resource development, significantly enhances reservoir stimulation efficiency through simultaneous propagation of multiple fractures within individual well segments [1,2,3,4,5,6]. However, field monitoring data reveal a critical operational bottleneck: 30–40% of perforation clusters contribute less than 5% to total production due to imbalanced fracture growth, severely constraining fracturing effectiveness [5]. Mechanistic investigations attribute this phenomenon to two coupled geomechanical mechanisms: (1) dynamic flow diversion imbalance induced by reservoir heterogeneity, which amplifies disparities in fracture propagation energy efficiency, and (2) stress shadowing effects among multiple fractures, generating inter-fracture compressive stresses that suppress secondary fracture initiation and propagation [6,7,8,9]. Achieving balanced multi-fracture propagation and precise dynamic fluid diversion control within limited well segments has thus emerged as a pivotal scientific challenge in advancing fracturing optimization.
In recent years, experts and researchers have extensively studied the competitive propagation mechanisms of multi-cluster fractures and the dynamic fluid diversion characteristics during hydraulic fracturing in horizontal well sections. Current studies encompass theoretical analyses, field monitoring data interpretation, laboratory physical simulations, and numerical modeling. Through theoretical and field data analysis, Fisher, Dancshy, and Wheaton [10,11,12] investigated variations in fracture height, breakdown pressure, and propagation pressure by using theoretical and field data analysis, revealing that simultaneous initiation of multiple fractures induces stress interference, elevated fracture breakdown pressure, and increased propagation pressure. Roberts and Slocombe [13,14] analyzed the variation patterns of perforation friction and the quantity of ineffective perforation clusters using downhole imaging systems and field data, demonstrating that severe erosion in lower wellbore perforations reduces friction resistance, thereby compromising fracturing fluid efficiency, while optimized fracture placement strategies effectively decrease ineffective clusters. El-Rabaa and Micha [15,16] conducted triaxial fracturing experiments to evaluate the influence of cluster spacing and perforation cluster positioning on fracture uniformity, finding that equidistant perforation clusters with larger spacing (>20 m) promote more balanced fracture propagation. Germanovich, Fu Haifeng, and Yang Fan [2,17,18,19,20,21,22,23,24,25,26,27,28,29,30] explored the propagation patterns of multiple fractures in horizontal wells using PKN models, finite element methods (FEMs), extended finite element methods (XFEMs), boundary element methods (BEMs), and discrete element methods (DEMs), identifying matrix heterogeneity, low permeability, high stress contrast, and fracturing fluid viscosity fluctuations as critical factors driving asymmetric fracture growth. Wu [21] established a two-dimensional multi-fracture propagation model based on the displacement discontinuity method (DDM), demonstrating that differentiated perforation parameters across clusters enhance fluid flow equilibrium and generate uniformly propagated hydraulic fractures. Although significant progress has been made in understanding competitive fracture initiation and dynamic fluid diversion, current research exhibits two primary limitations: (1) simplified two-dimensional assumptions in numerical simulations neglect the controlling effects of vertical stress gradients and interlayer interfaces on three-dimensional fracture morphology; and (2) the multi-physical field coupling mechanisms under temporary plugging conditions remain unclear, lacking quantitative parameter control methodologies.
Therefore, this study incorporates multiple physical processes—including fluid leak-off, fracture flow, porous media seepage, solid deformation, fracture initiation, and propagation—into a fully coupled finite element framework, based on a three-dimensional dynamic simulation method for temporary plugging fracturing under a fluid–solid–damage fully coupled theoretical framework. A tubing element–cohesive zone coupling model (Tubing-CZM) is developed to achieve dynamic calculation of fracturing fluid flow distribution and fracture propagation, while enabling investigation into the effectiveness of temporary plugging techniques. By integrating actual reservoir parameters from Block X in Xinjiang, the influence patterns of geological conditions and operational parameters on fracture morphology and fracturing fluid diversion characteristics are systematically investigated. These findings will provide theoretical guidance for hydraulic fracturing design in unconventional reservoir horizontal wells, optimize reservoir stimulation efficiency, and advance the cost-effective development of unconventional oil and gas resources.

2. Governing Equations for Hydraulic Fracture Propagation

2.1. Constitutive Equations for Porous Media

(1)
Fluid–solid coupling equations
The model assumes that the porous rock medium consists primarily of a rock matrix and interconnected pore spaces within the matrix, where the mechanical equilibrium equation governing the rock matrix [31] is formulated as
V ( σ p w I ) δ ε d V = S t δ v d S + ϵ f δ v d V
The symbols in the formula are defined as follows: V denotes volume; σ represents total stress; pw corresponds to wetting phase pressure; I is the identity matrix; δ stands for the Kronecker delta; S signifies area; ε refers to the virtual strain rate; t indicates the surface vector; v represents the virtual velocity vector; and f denotes the body force matrix (with numerals I and above denoting matrices, and t, v, f representing vectors).
The continuity equation for fluid flow [31] is
V 1 J t J ρ w n w d V + V X ρ w n w v w d V = 0
The meanings represented by the letters in the formula are as follows: J denotes the volumetric change ratio; ρ w represents the fluid density; nw corresponds to porosity; X signifies the spatial vector; Vw indicates the fluid seepage velocity. Assuming fluid flow within the rock satisfies Darcy’s law [32], we have
v w = 1 n w g ρ w k p w X ρ w g
In the formula, parameter g corresponds to gravitational acceleration with units of meters per second squared, and parameter K represents the rock seepage velocity vector, a directional quantity explicitly designated as a vector, with units of meters per second.

2.2. Cohesion Model Control Equation

The Initiation and Extension of Cracks

(1)
Criteria for hydraulic fracture initiation and propagation
The cohesive zone model (CZM) characterizes the initial damage and damage evolution of fracture-prone elements based on the traction–separation law, which is employed to simulate the initiation and propagation of hydraulic fractures at perforation cluster locations [33]. The bilinear traction–separation (T-S) criterion is adopted to characterize the relationship between interfacial traction and separation distance at crack tip cohesive elements, as illustrated in Figure 1. Here, T denotes the stress, T0 represents the stress at the initial damage threshold of the cohesive element, u0 corresponds to the displacement at initial damage, um signifies the maximum displacement during cohesive element propagation, and d indicates the interfacial separation distance. When the interfacial traction reaches its maximum value, the traction between fracture surfaces exhibits a linear increase with the separation distance prior to this peak; after exceeding the peak traction, the interfacial traction decreases linearly as the separation distance further increases. When the interfacial traction diminishes to zero, new fracture elements are generated. This process is represented by the cohesive zone model (CZM), as illustrated in Figure 2 [34].
The maximum principal stress criterion is employed to evaluate initial damage initiation in cohesive elements, where damage is postulated to occur when the stress ratio (actual stress to critical threshold) in any principal direction exceeds 1.0, thereby triggering hydraulic fracture initiation, as expressed by
max   σ n σ max , n τ s τ max , s τ t τ max , t = 1
In the equation, the symbols are defined as follows. Parameters σ max , n , τ max , s , and τ max , t correspond to the critical normal stress at cohesive element failure and the critical shear stresses in two orthogonal directions, respectively.
The propagation of hydraulic fractures is characterized by the stiffness degradation of cohesive elements, and the corresponding formula [35] is expressed as
t s = 1 D t s ¯ t t = 1 D t t ¯ t n = 1 D t n ¯ ( t n ¯ 0 ) t n = t n ¯ ( t n ¯ < 0 )
In the equation, the symbols are defined as follows: t n denotes the normal stress (σₙ) of the cohesive element, t s the first shear stress, and t t the second shear stress. Parameters t n ¯   , t s ¯ , and t t ¯ correspond to the normal stress, first shear stress, and second shear stress calculated using the linear elastic constitutive relationship. The damage variable D characterizes the global failure extent of the cohesive element, increasing linearly from 0 to 1 after damage initiation. Its expression [35] is
D = u f u m u 0 u m u f u 0
where u f represents the displacement at complete damage of the cohesive element.
(2)
Fluid flow equation within hydraulic fractures
During hydraulic fracturing operations, the injection of fracturing fluid constitutes a critical phase. The flow process within fractures encompasses both tangential flow along the fracture propagation direction and normal flow perpendicular to the fracture plane. This study assumes that the tangential flow of fracturing fluid within artificial fractures follows the behavior of an incompressible Newtonian fluid [36], expressed as
q = w 3 12 μ Δ p
In the equation, the symbols are defined as follows: q represents the fluid flow rate, w the hydraulic fracture width, μ the fluid viscosity, and Δ p the fluid pressure gradient. The leak-off behavior of fracturing fluid [37] can be described as
q t = C t p i p t q b = C b p i p b
In the equation, the symbols are defined as follows. C t , p t , and q t , respectively, denote the leak-off coefficient, pore pressure, and flow rate per unit area on the upper surface of the hydraulic fracture, while C b , p b , and q b represent the leak-off coefficient, pore pressure, and flow rate per unit area on the lower surface. p i corresponds to the internal fluid pressure within the hydraulic fracture.

2.3. Horizontal Wellbore Flow

(1)
Pipe Element Model and Perforation Friction
This study employs a wellbore pipe element model to simulate and calculate the dynamic flow distribution ratios of pumped fluid at different perforation cluster locations. The empirical formula describing the relationship between perforation friction and flow rate [38] is expressed as
Δ p fp i = α p , i Q i 2 α p , i = 0.87249 ρ N p , i 2 D p , i 4 C 2
In the equation, the symbols are defined as follows: i represents the number of perforation clusters; Δ p fp i denotes the perforation friction design value; Q i corresponds to fluid flow velocity within the fracture; α p , i signifies the magnitude of the friction coefficient; ρ indicates fluid density; N p , i 2 defines the number of perforations in the pre-steering fracture; D p , i represents the perforation diameter; and C refers to the dimensionless flow coefficient, which ranges from 0.56 to 0.90.
Multiple pipe elements are preconfigured at the fracture openings of individual perforation clusters. The flow rate and pressure within these elements are governed by the following equation [39]:
Q total = i n Q i , i = 1 , 2 , 3 , n p wellbore = p out , i + p pf , i , i = 1 , 2 , 3 , n
In the equation, the symbols are defined as follows. Q total represents the total injection flow rate; p out , i denotes the outflow pressure at the perforation cluster fracture entrance node; p wellbore corresponds to the inflow pressure at the perforation cluster node location; and p pf , i signifies the perforation friction.
(2)
Pipe Element Model—Wellbore Flow
The flow of fracturing fluid within the wellbore is calculated using the Darcy–Weisbach pipe flow friction equation [40] expressed as follows:
Δ p + ρ g Δ Z = f L D h ρ v t 2 2
In the equation, the symbols are defined as follows. Δ p represents the pressure loss between nodes; ρ denotes the fluid density; g corresponds to the gravitational acceleration; Δ Z signifies the elevation difference between nodes; f indicates the casing friction factor; L defines the casing length; D h represents the casing inner diameter; v t refers to the fluid flow velocity within the casing; and f is defined by the method proposed by Churchill [41] for calculation.
f = 8 8 R e 12 + 1 A + B 1.5 1 12
where A is calculated using the following formula:
A = 2.457 ln 7 R e 0.9 + 0.27 ε D h 16
In the equation, parameter Re represents the Reynolds number of the fracturing fluid flow within the casing, and parameter ε denotes the absolute roughness of the casing, with units expressed in meters.

3. Simulation Model and Verification

3.1. Geometric Model

This study investigates the competitive propagation mechanisms of multiple hy-draulic fractures through a three-dimensional geomechanical model, where the C3D8P element (a three-dimensional eight-node pore pressure element) is utilized to characterize the coupled seepage–deformation behavior of the reservoir matrix. In contrast, the COH3D8P (a three-dimensional eight-node cohesive element) predefines fracture propagation paths and incorporates a bilinear cohesive zone model. A dual-cluster spacing comparative system (10 m/20 m) is established: the 10 m cluster spacing model features dimensions of 100 m × 50 m × 40 m (with dynamically refined mesh elements numbering 41,658–51,274), and the 20 m cluster spacing model extends to 140 m × 50 m × 40 m (mesh elements ranging from 64,086 to 83,314). The perforation zones employ 1.0–3.0 m refined grids (grid gradation ratio 1:15), transitioning to 3.0–5.0 m coarsened grids in peripheral regions to optimize computational accuracy and efficiency. Numerical simulations are conducted in three sequential stages: in situ stress equilibrium, fracturing fluid injection, and shut-in closure. Figure 3 demonstrates the geometric configuration and multi-scale mesh characteristics of a representative four-perforation cluster model with equal 90° phasing angles and 10 m cluster spacing.

3.2. Model Parameters

The input parameters of the numerical model (Table 1) were established based on measured data from the X block reservoir in Xinjiang, with a reservoir temperature of 138 °C. The reservoir demonstrates typical low-permeability characteristics, and the rock mechanical parameters were calibrated through combined interpretation of well logging data and core experiments.

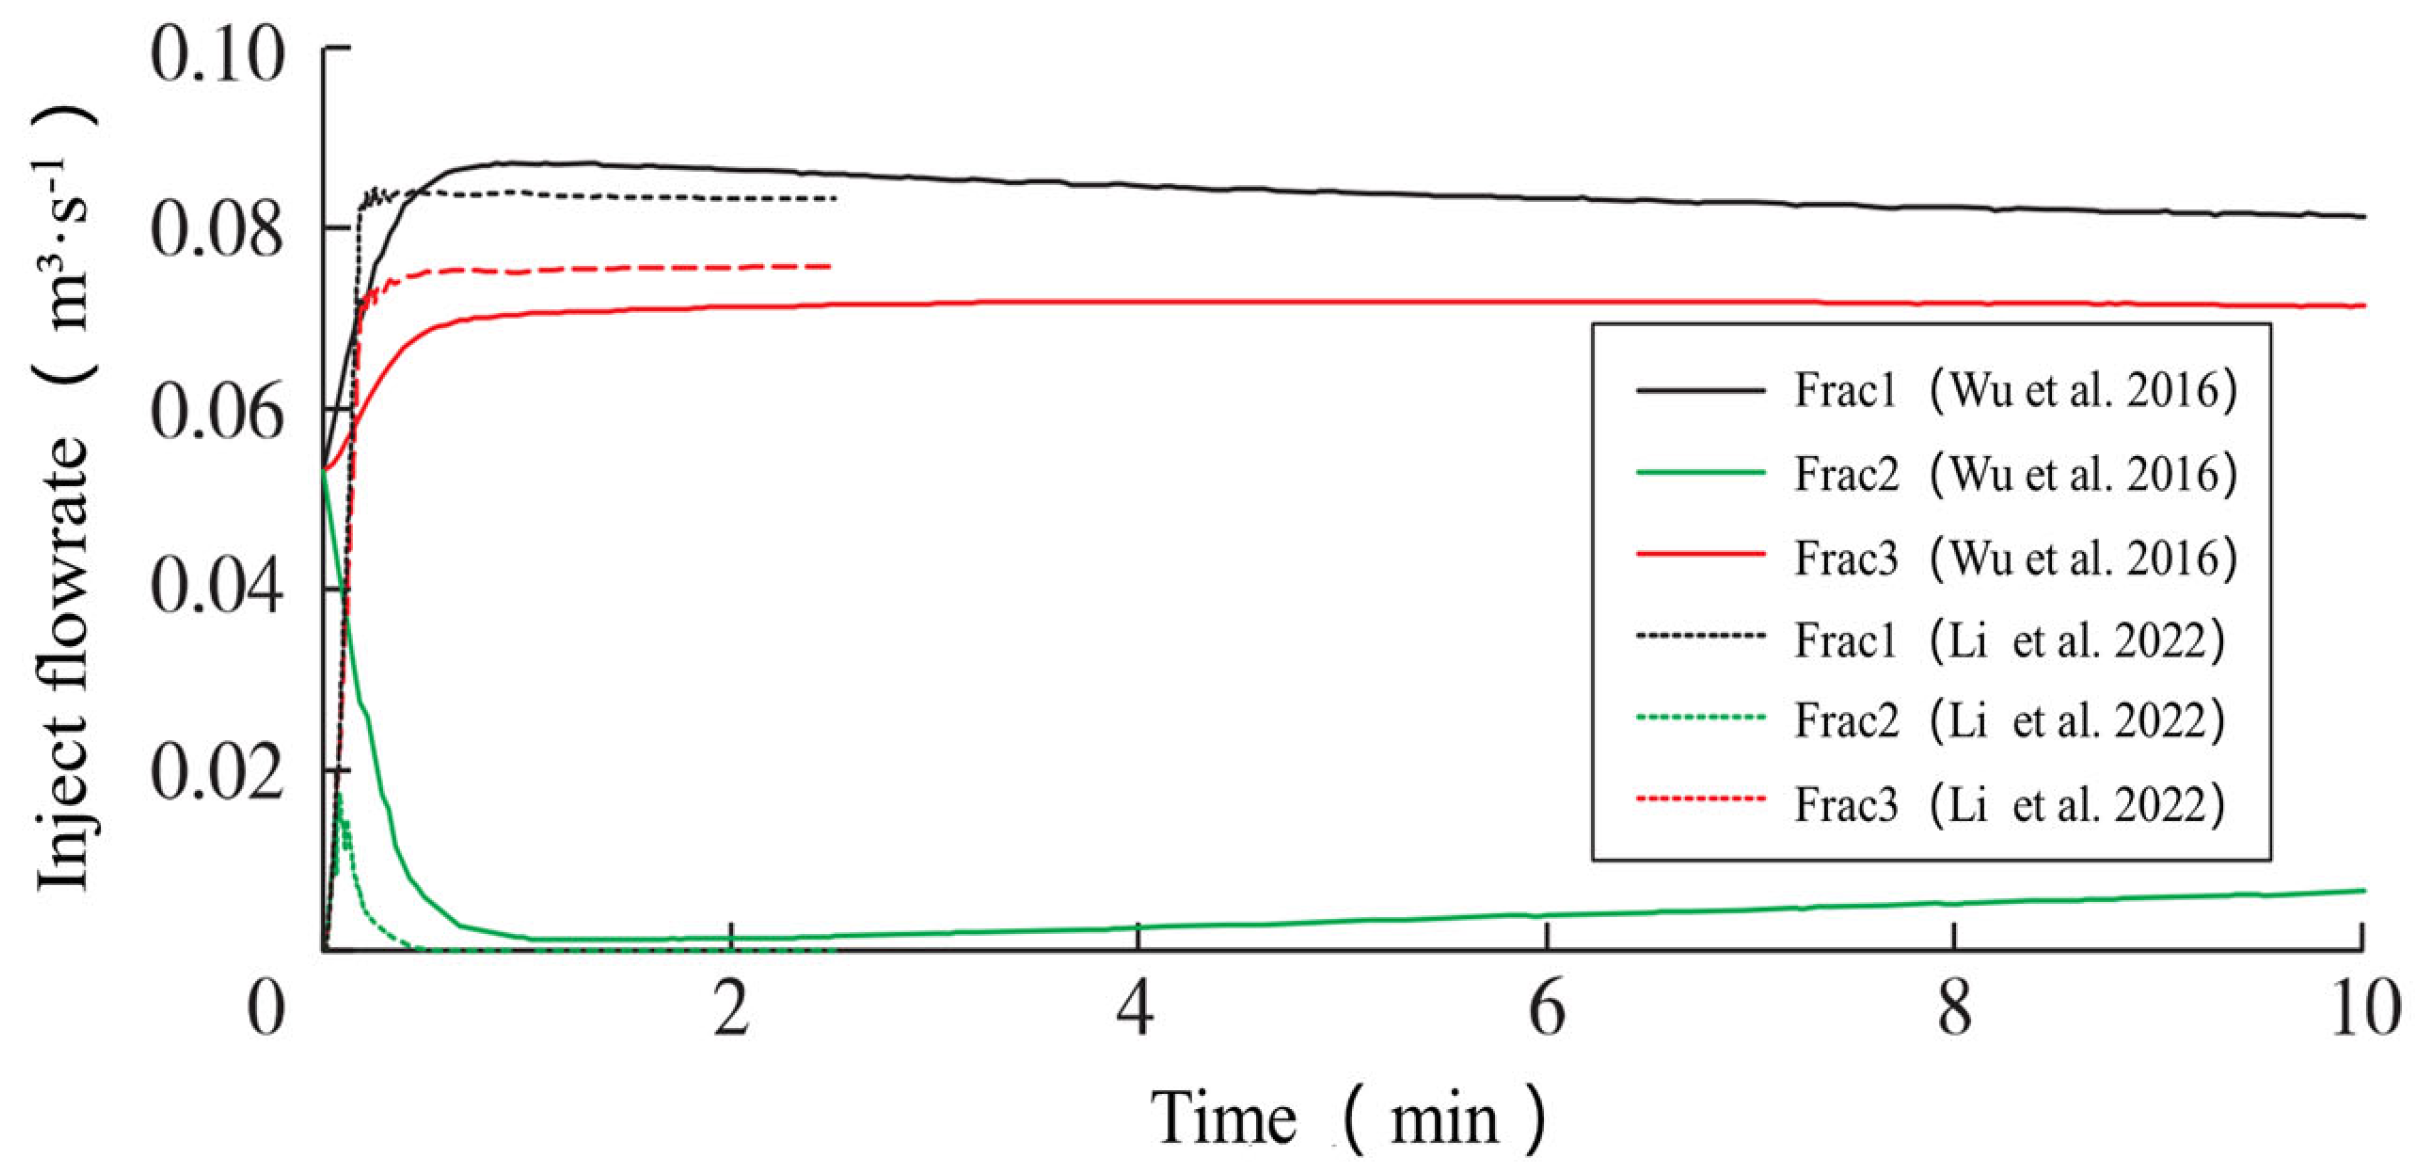
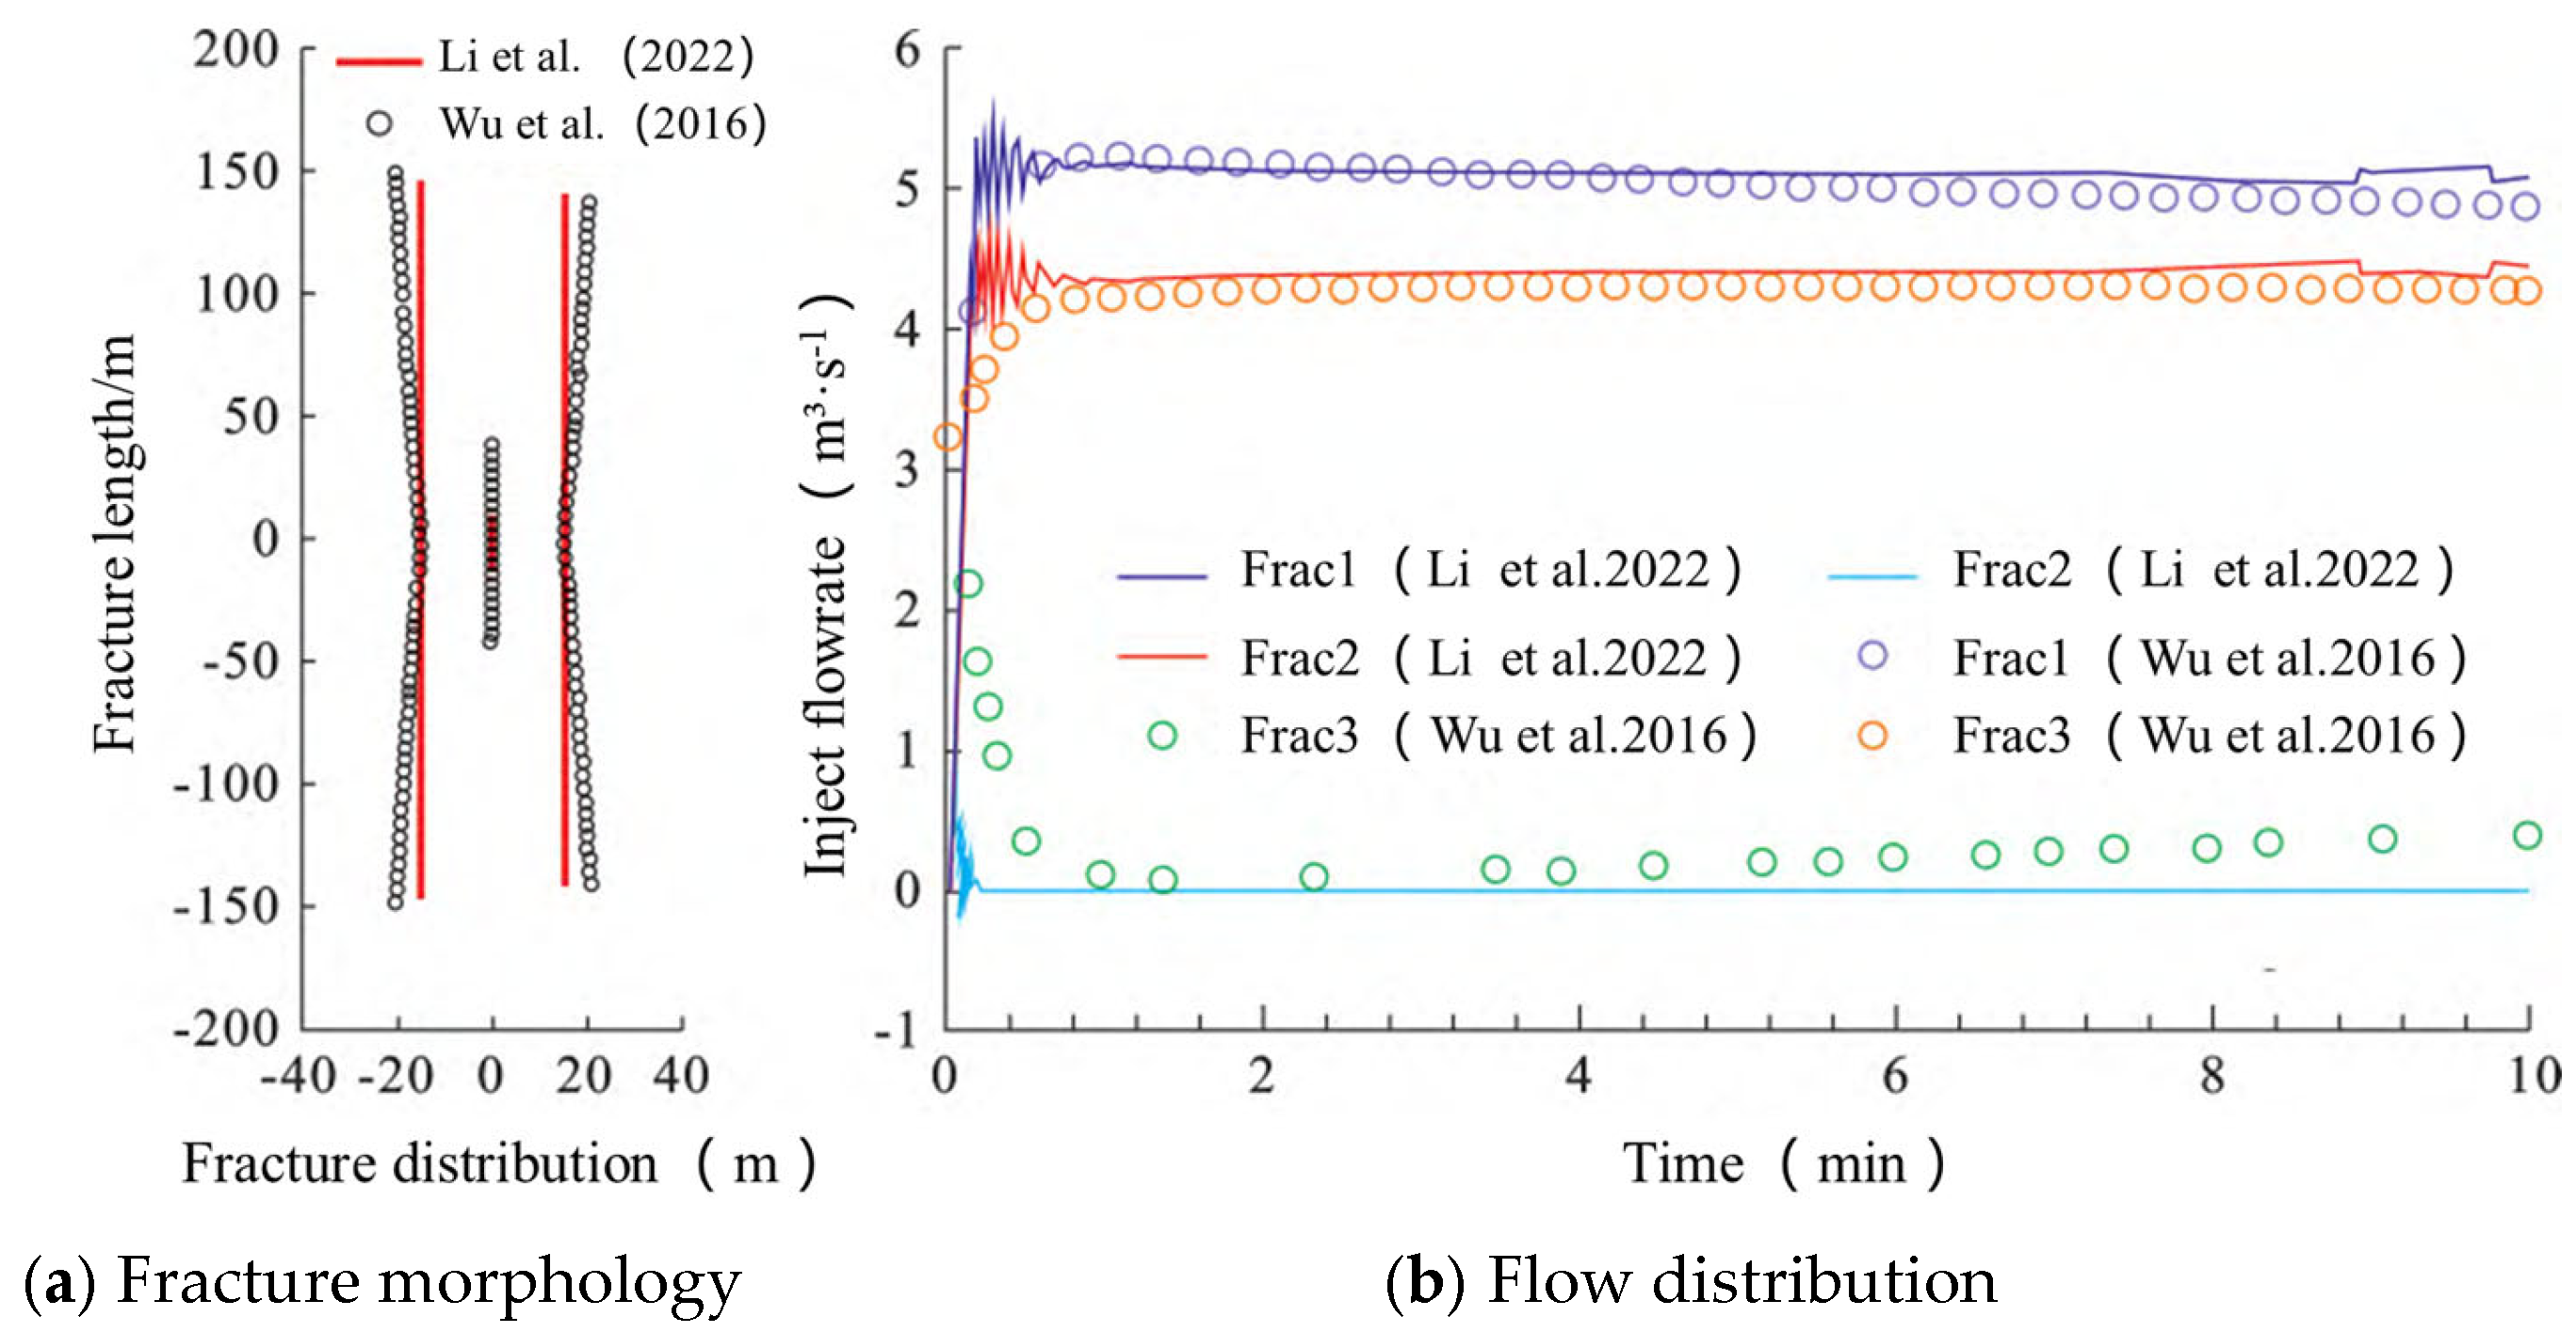
3.3. Model Validation

The pipe–element coupling model employed in this study has undergone systematic validation. Li Haozhe et al. [21] demonstrated through comparative analysis that the finite element model based on pipe elements exhibits high consistency with the Wu analytical model in fluid distribution characteristics. As shown in Figure 4, the relative error in three-cluster flow allocation remains below 8.2% (RMSE = 0.15), aligning with the dynamic fluid partitioning behavior observed in multi-cluster fracturing. Li Minghui et al. [22] further developed a three-dimensional fracture propagation model, revealing correlation coefficients of 0.91–0.96 (Figure 5) between simulated fracture morphology parameters (half-length, width) and Wu model predictions, confirming the reliability of numerical solutions under three-dimensional stress fields [42,43]. The study verifies that the fully coupled algorithm integrating cohesive zone elements and pipe elements accurately characterizes the interaction mechanisms between fracture propagation and fluid distribution. Through dual validation (numerical–analytical solution comparison and multi-physics coupling verification), the proposed model achieves technical specifications, including fracture geometry prediction errors < 5% and fluid allocation prediction accuracy of 92%, establishing a robust methodology for simulating intra-stage multi-cluster fracturing under complex engineering conditions.

4. Simulation Results

This study systematically investigates the synergistic influence mechanisms of reservoir characteristics (homogeneous/heterogeneous), engineering parameters (cluster spacing of 10–30 m), and completion parameters (3–5 perforation clusters, frictional resistance of 5–15 MPa, and 8–12 mm perforation diameter) on fracture propagation morphology and fluid allocation patterns, based on the three-dimensional hydraulic fracturing numerical model illustrated in Figure 3. The spatial positioning of perforation clusters follows a specific nomenclature: in three-cluster configurations, Fractures 1/3 are designated end fractures (closest to the wellbore extremities), with Fracture 2 as the central fracture; in four-cluster scenarios, Fractures 1/4 serve as end fractures and Fractures 2/3 as intermediate fractures; and in five-cluster arrangements, Fractures 1/5 are end fractures, while Fractures 2/4 are intermediate, as detailed in Figure 6. Along the horizontal wellbore axis (X+ direction), perforation clusters are sequentially numbered as Fractures 1 to 5. This indexing system strictly corresponds to the model’s geometric positioning, enabling adequate characterization of asymmetric fracture propagation characteristics induced by stress shadow effects.

4.1. Construction Factors

The number of perforation clusters, cluster spacing, perforation friction, and perforation count are critical determinants of the stimulated reservoir volume (SRV). Stress interference arising from asynchronously propagating fractures alters hydraulic fracture morphology and induces stochastic fluid allocation patterns. To address these coupled effects, this section systematically investigates the interplay between geometric constraints and dynamic fluid–rock interactions under multiscale heterogeneity conditions.

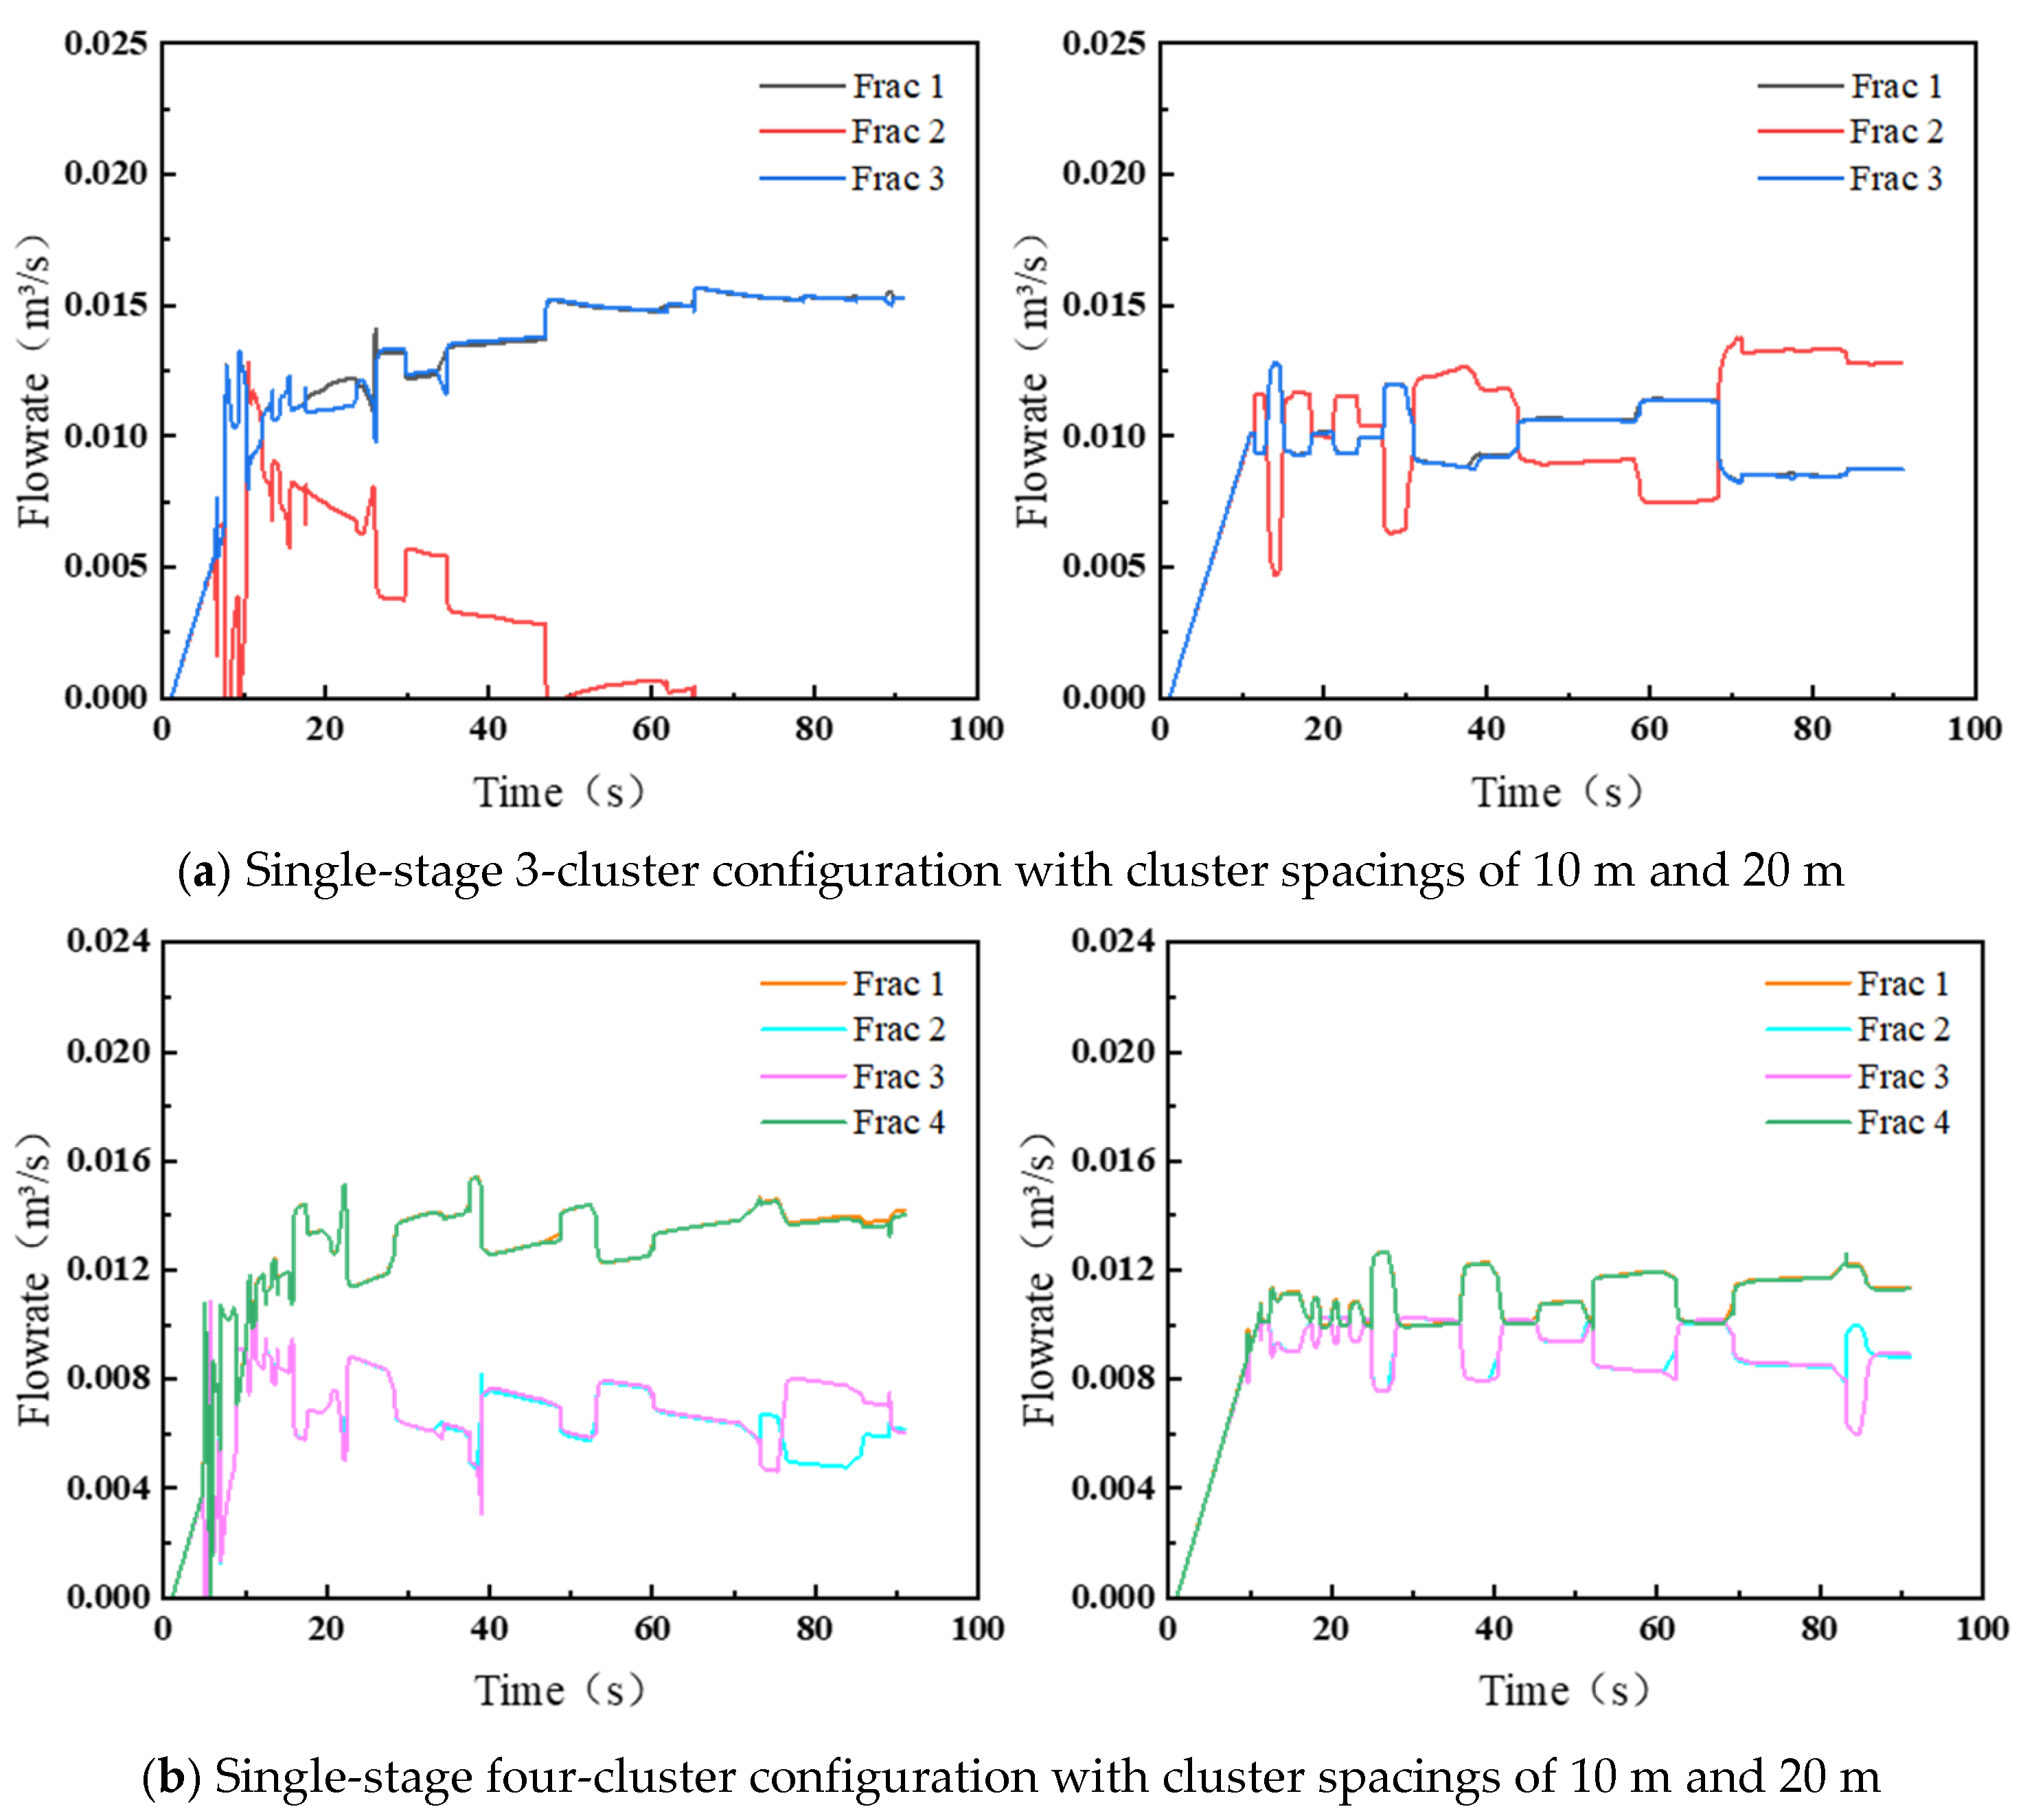
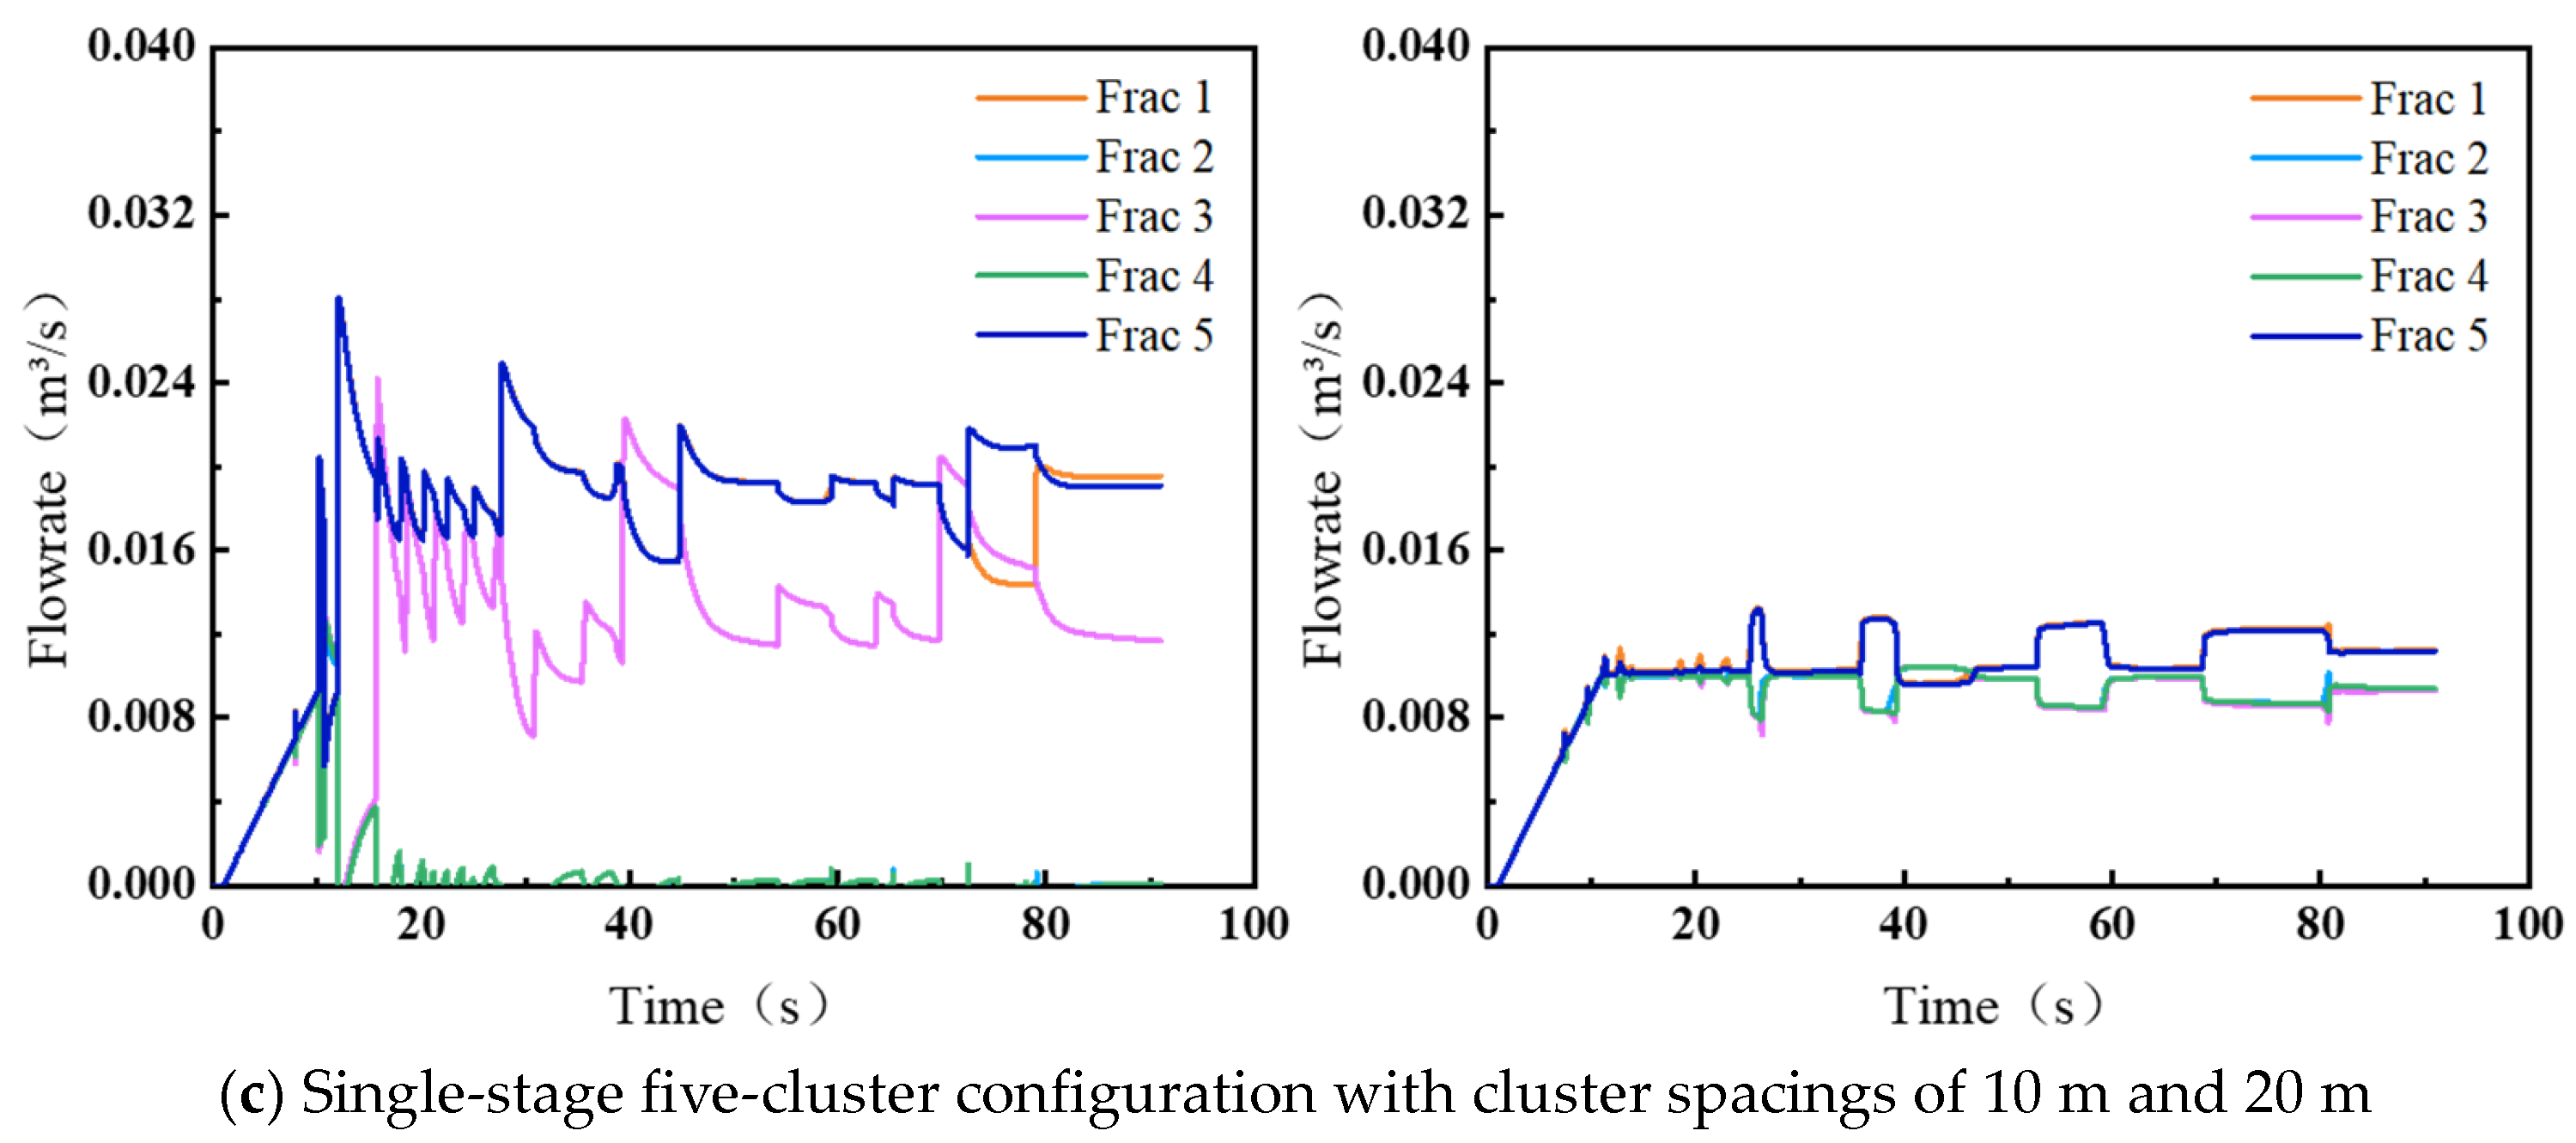
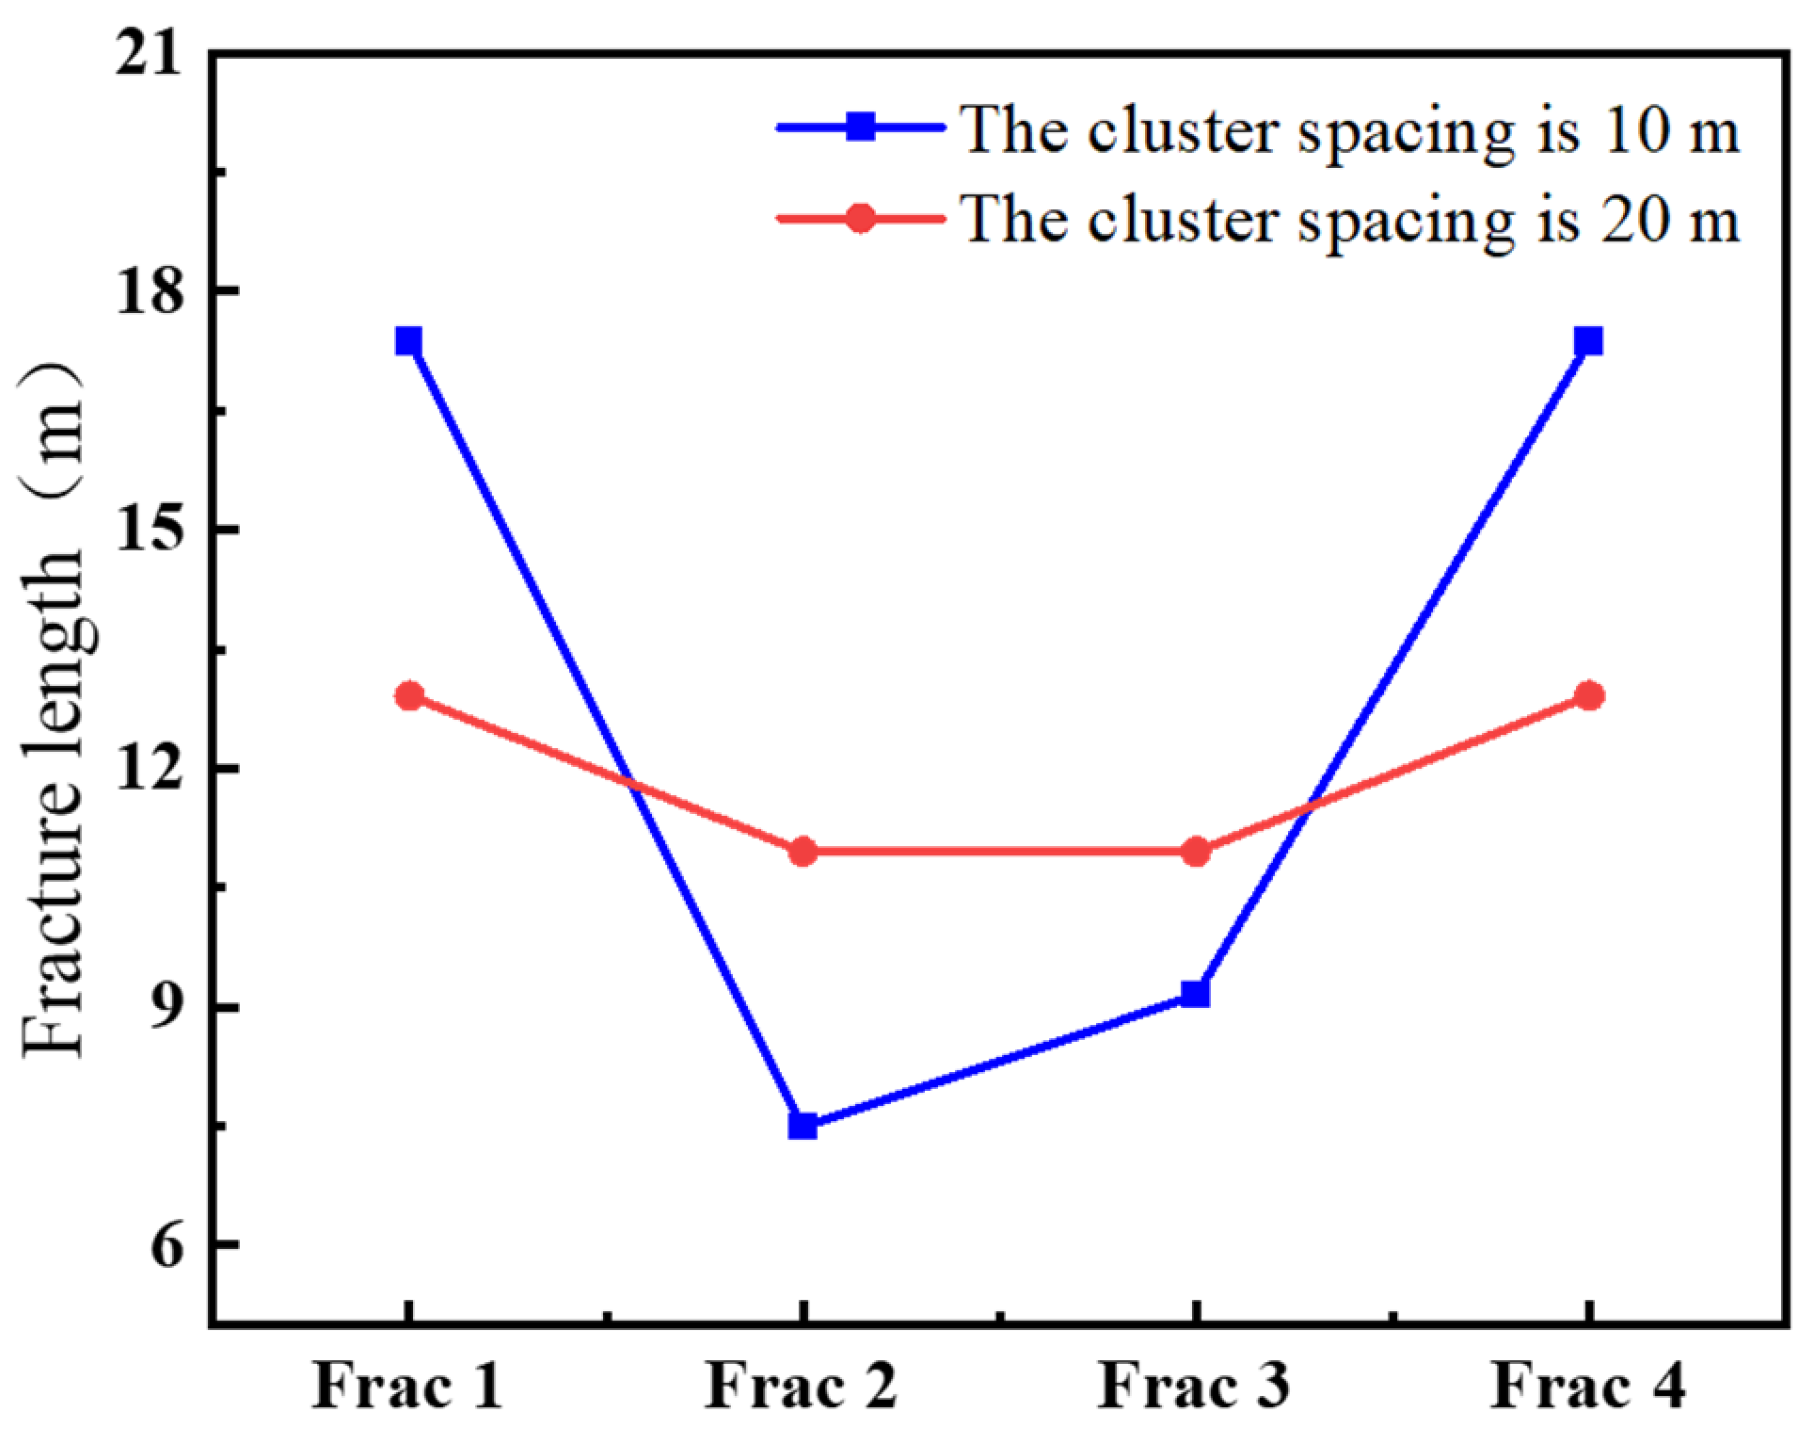
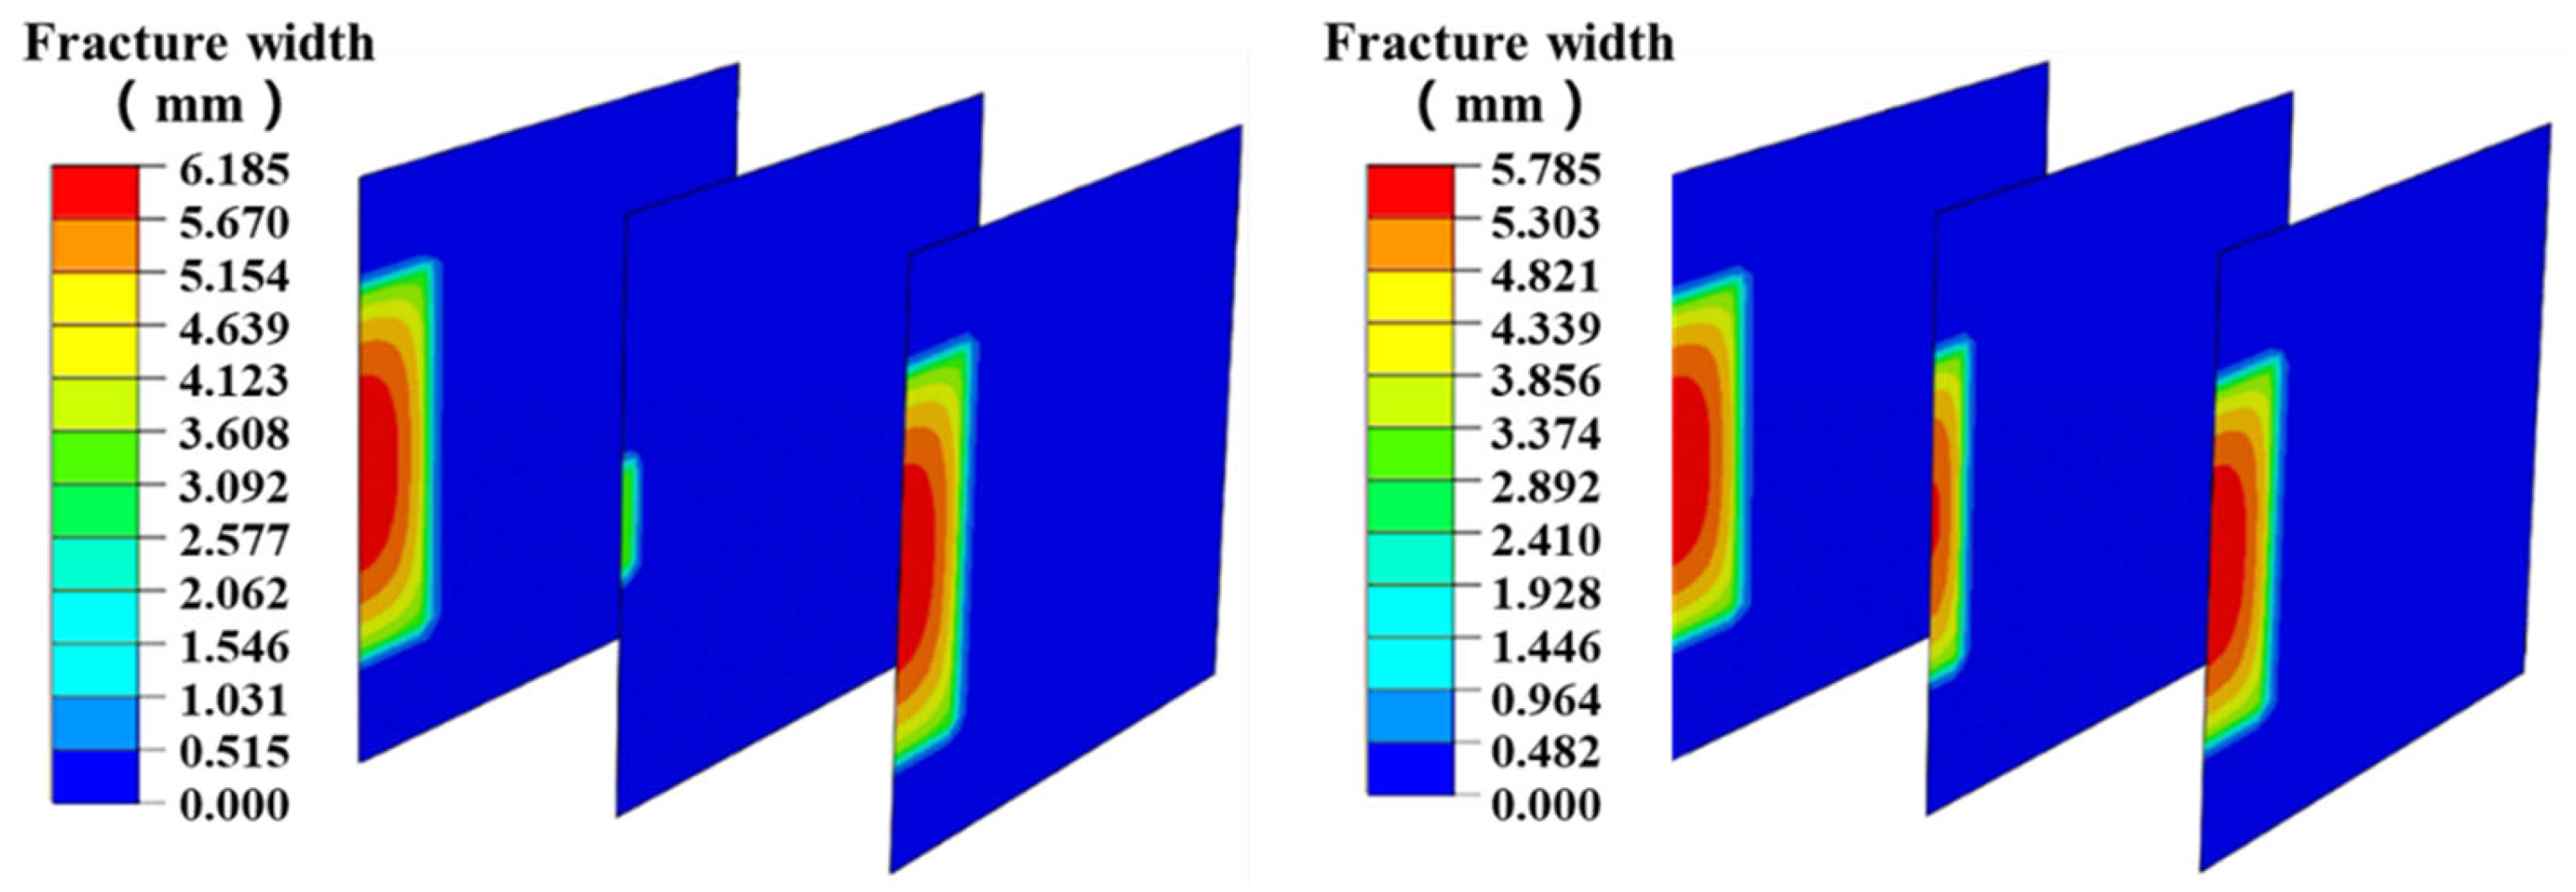
4.1.1. Number and Spacing of Clusters in a Single Segment

Based on the reservoir parameters and completion conditions provided in Table 1, three-dimensional hydraulic fracture propagation models were established with 10 m and 20 m cluster spacings for configurations of three, four, and five perforation clusters. Numerical simulations were performed to investigate fracture development under varying operational scenarios. As shown in Figure 7, the fracture propagation morphology exhibits significant asymmetry due to geomechanical stress interference effects. The central perforation cluster (Fracture 2) demonstrates markedly suppressed propagation, while the edge clusters (Fractures 1 and 3) achieve more extensive growth. This asymmetric behavior highlights the dominant role of stress shadow interactions in governing fracture geometry under multi-cluster stimulation conditions.
A comparative analysis was performed using the three-cluster perforation model. Figure 7 displays the hydraulic fracture propagation morphologies with 10 m and 20 m cluster spacings. Numerical results indicate that increasing the cluster spacing to 20 m increases the propagation length of Fracture 2 by approximately 38.2% compared to the 10 m configuration, with a 21.5% improvement in fracture aperture uniformity. This suggests that smaller cluster spacings (10 m) induce strong stress shadow effects between adjacent fractures, particularly imposing dual stress interference on the central cluster (Fracture 2), significantly reducing its propagation efficiency. Quantitative analysis of fracture volume reveals that the stimulated reservoir volume (SRV) of the central fracture with the 20 m spacing configuration increases by 45.7% compared to the 10 m case, confirming that optimized cluster spacing enhances the balanced propagation of multi-cluster fractures.
Dynamic fluid allocation analysis of multi-cluster fractures was conducted based on numerical simulation results (Figure 8). With the 10 m cluster spacing configuration, significant non-uniform fluid allocation was observed across three, four, and five-cluster perforation stages; edge fractures (Fractures 1 and terminal fractures) dominated fluid injection with 68–82% allocation. In contrast, central fractures exhibited varying degrees of suppression. Specifically, (1) in the three-cluster configuration, Fracture 2 initially achieved 34.5% fluid allocation, but its injection share abruptly declined to 2.1% after 45 s as stress shadow zones developed from edge fracture propagation. (2) For the four-cluster configuration, stable fluid allocation in central Fractures 2/3 remained at 12.7–15.3%, 58.4–63.9% lower than edge fractures. (3) In the five-cluster case, dual stress interference caused fluid injection stagnation in Fractures 2/4, while the central Fracture 3 retained competitive fluid allocation at 19.8%. When cluster spacing increased to 20 m, central fractures achieved 37.2–45.6% fluid allocation across all configurations, accompanied by periodic fluctuations, demonstrating that larger cluster spacing effectively enhances fluid allocation uniformity in multi-cluster systems.
Figure 9 compares the influence of different cluster spacings on Fracture 2 propagation parameters under the three-cluster configuration. Numerical simulations demonstrate that at the 20 m cluster spacing, the maximum fracture aperture at the fracture mouth of Fracture 2 reaches 6.8 mm, representing a 42.3% increase compared to the 10 m configuration, with its average fluid injection rate rising by 116.7%. This improvement primarily stems from (1) increased cluster spacing, reducing the superimposed intensity of adjacent fracture-induced stress fields by 38.9%, effectively alleviating near-wellbore compression effects, and (2) enhanced fracture conductivity due to aperture enlargement, decreasing the frictional pressure loss coefficient along the fracture from 0.018 to 0.012. Figure 10 further quantifies cluster spacing optimization effects through four-cluster fracture length comparisons. Under the 20 m configuration, the fracture length disparity coefficient decreases to 0.15, marking a 65.1% reduction relative to the 10 m case, which confirms that larger cluster spacing significantly improves system-wide fracture propagation uniformity.

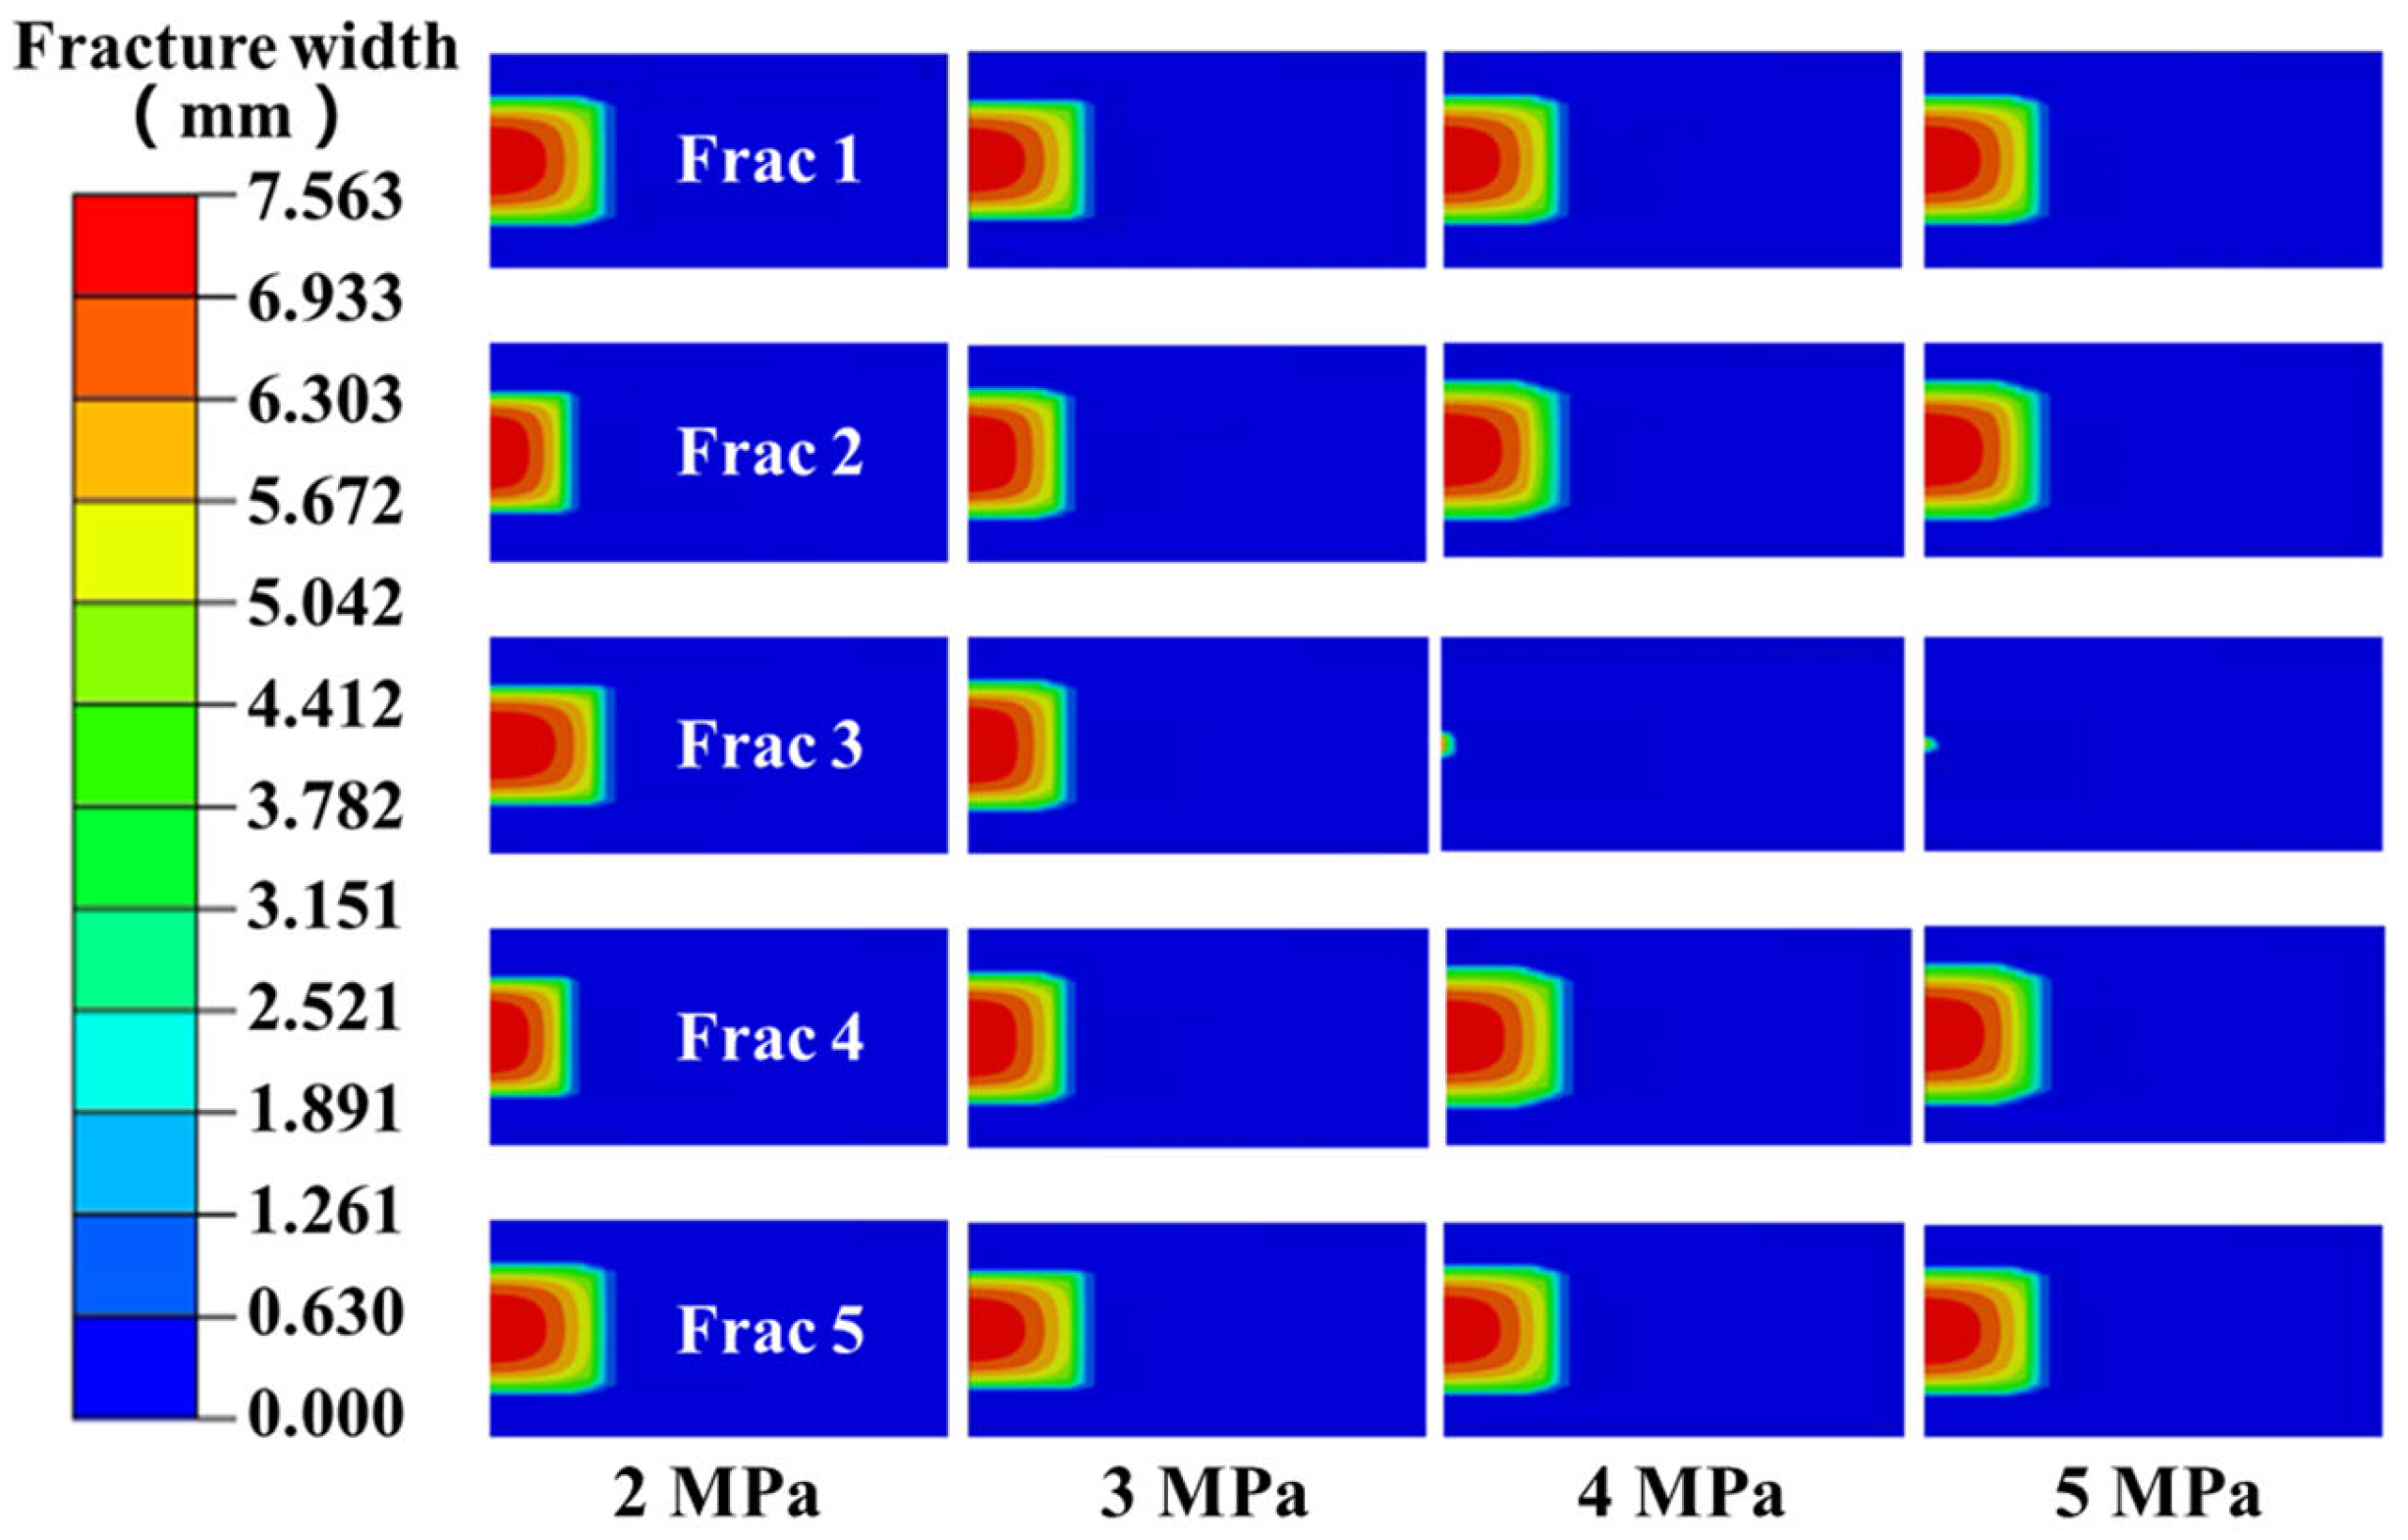
4.1.2. Perforation Friction

This study investigates the influence of perforation friction (under 2.5 MPa and 7.5 MPa configurations) on competitive fracture propagation and fluid allocation in multi-cluster fracturing systems by employing a homogeneous reservoir model with a single-stage five-cluster configuration (10 m cluster spacing). Figure 11 compares fracture propagation morphologies under varying perforation friction conditions. Experimental results reveal that elevating perforation friction to 7.5 MPa significantly enhances fracture propagation uniformity across the five clusters compared to the low-friction (2.5 MPa) case, with the central fracture (Fracture 3) exhibiting reduced propagation disparity. In contrast, the low-friction configuration demonstrates pronounced unbalanced propagation between edge and central fractures. Dynamic fluid allocation curves in Figure 12 indicate stabilized flow rates across perforation clusters under high-friction (7.5 MPa) conditions, accompanied by significantly reduced fluctuations. Mechanistic analysis demonstrates that increased perforation friction improves system equilibrium through two pathways: (1) enhancing near-wellbore flow resistance to optimize fluid allocation ratios between edge and central fractures, and (2) elevating net pressure within fractures to suppress fluid channeling induced by formation heterogeneity. Although a slight reduction in fracture mouth aperture occurs under high-friction conditions, the overall stimulated reservoir volume remains advantageous. This research confirms that with 10 m cluster spacing, appropriately increasing perforation friction effectively enhances balanced fracture network development in heterogeneous reservoirs during multi-cluster fracturing.

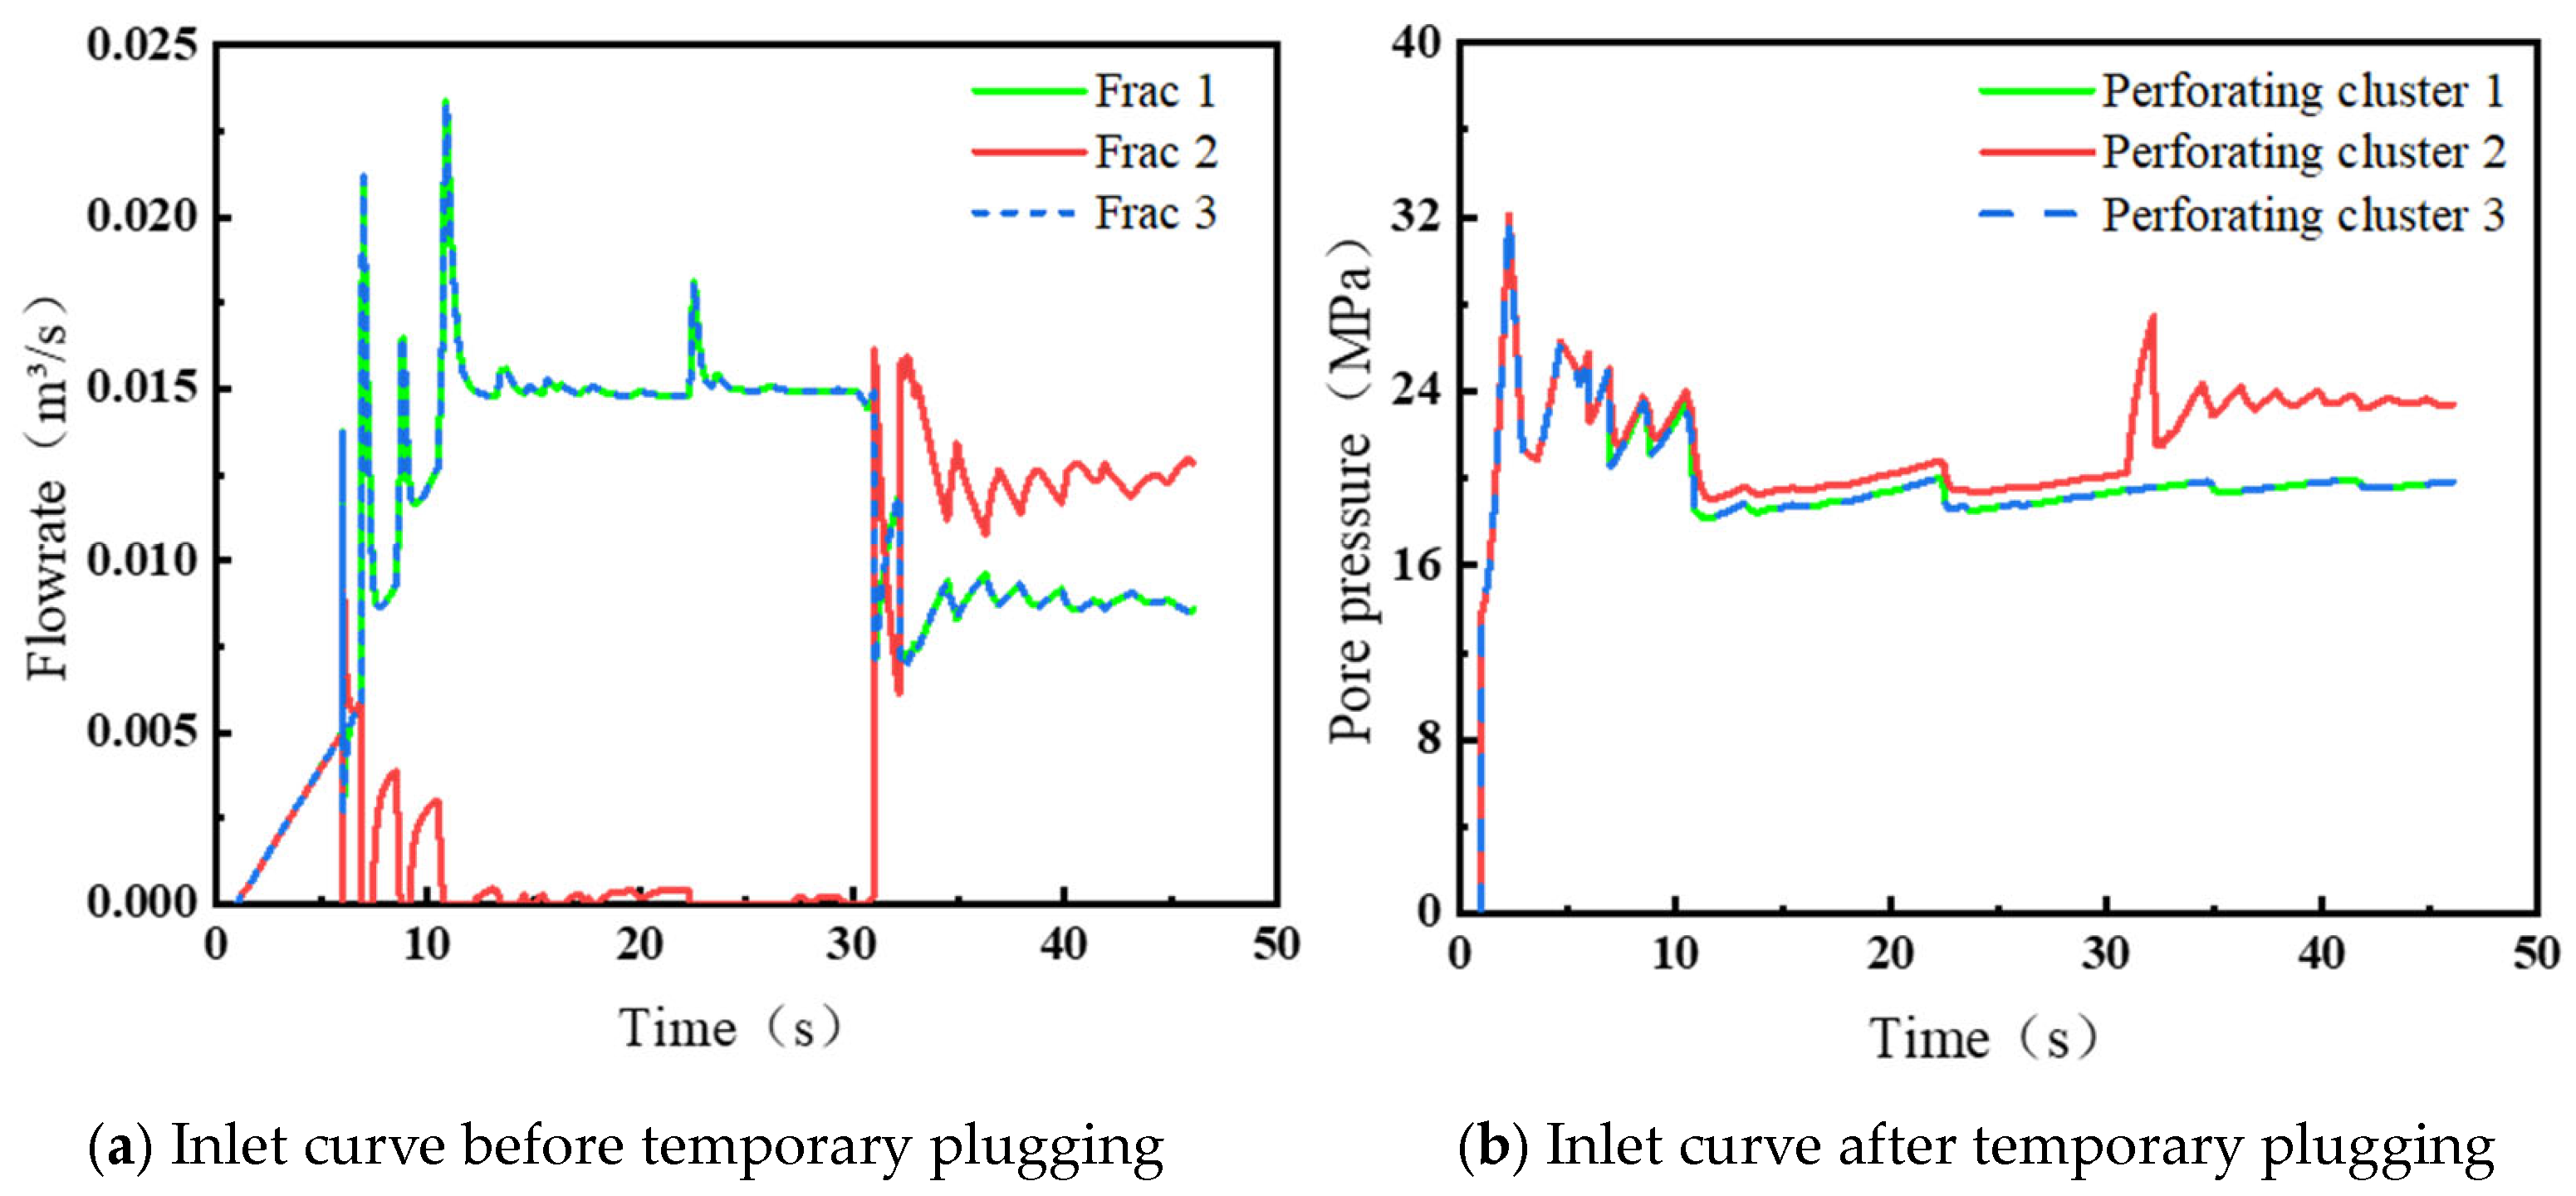
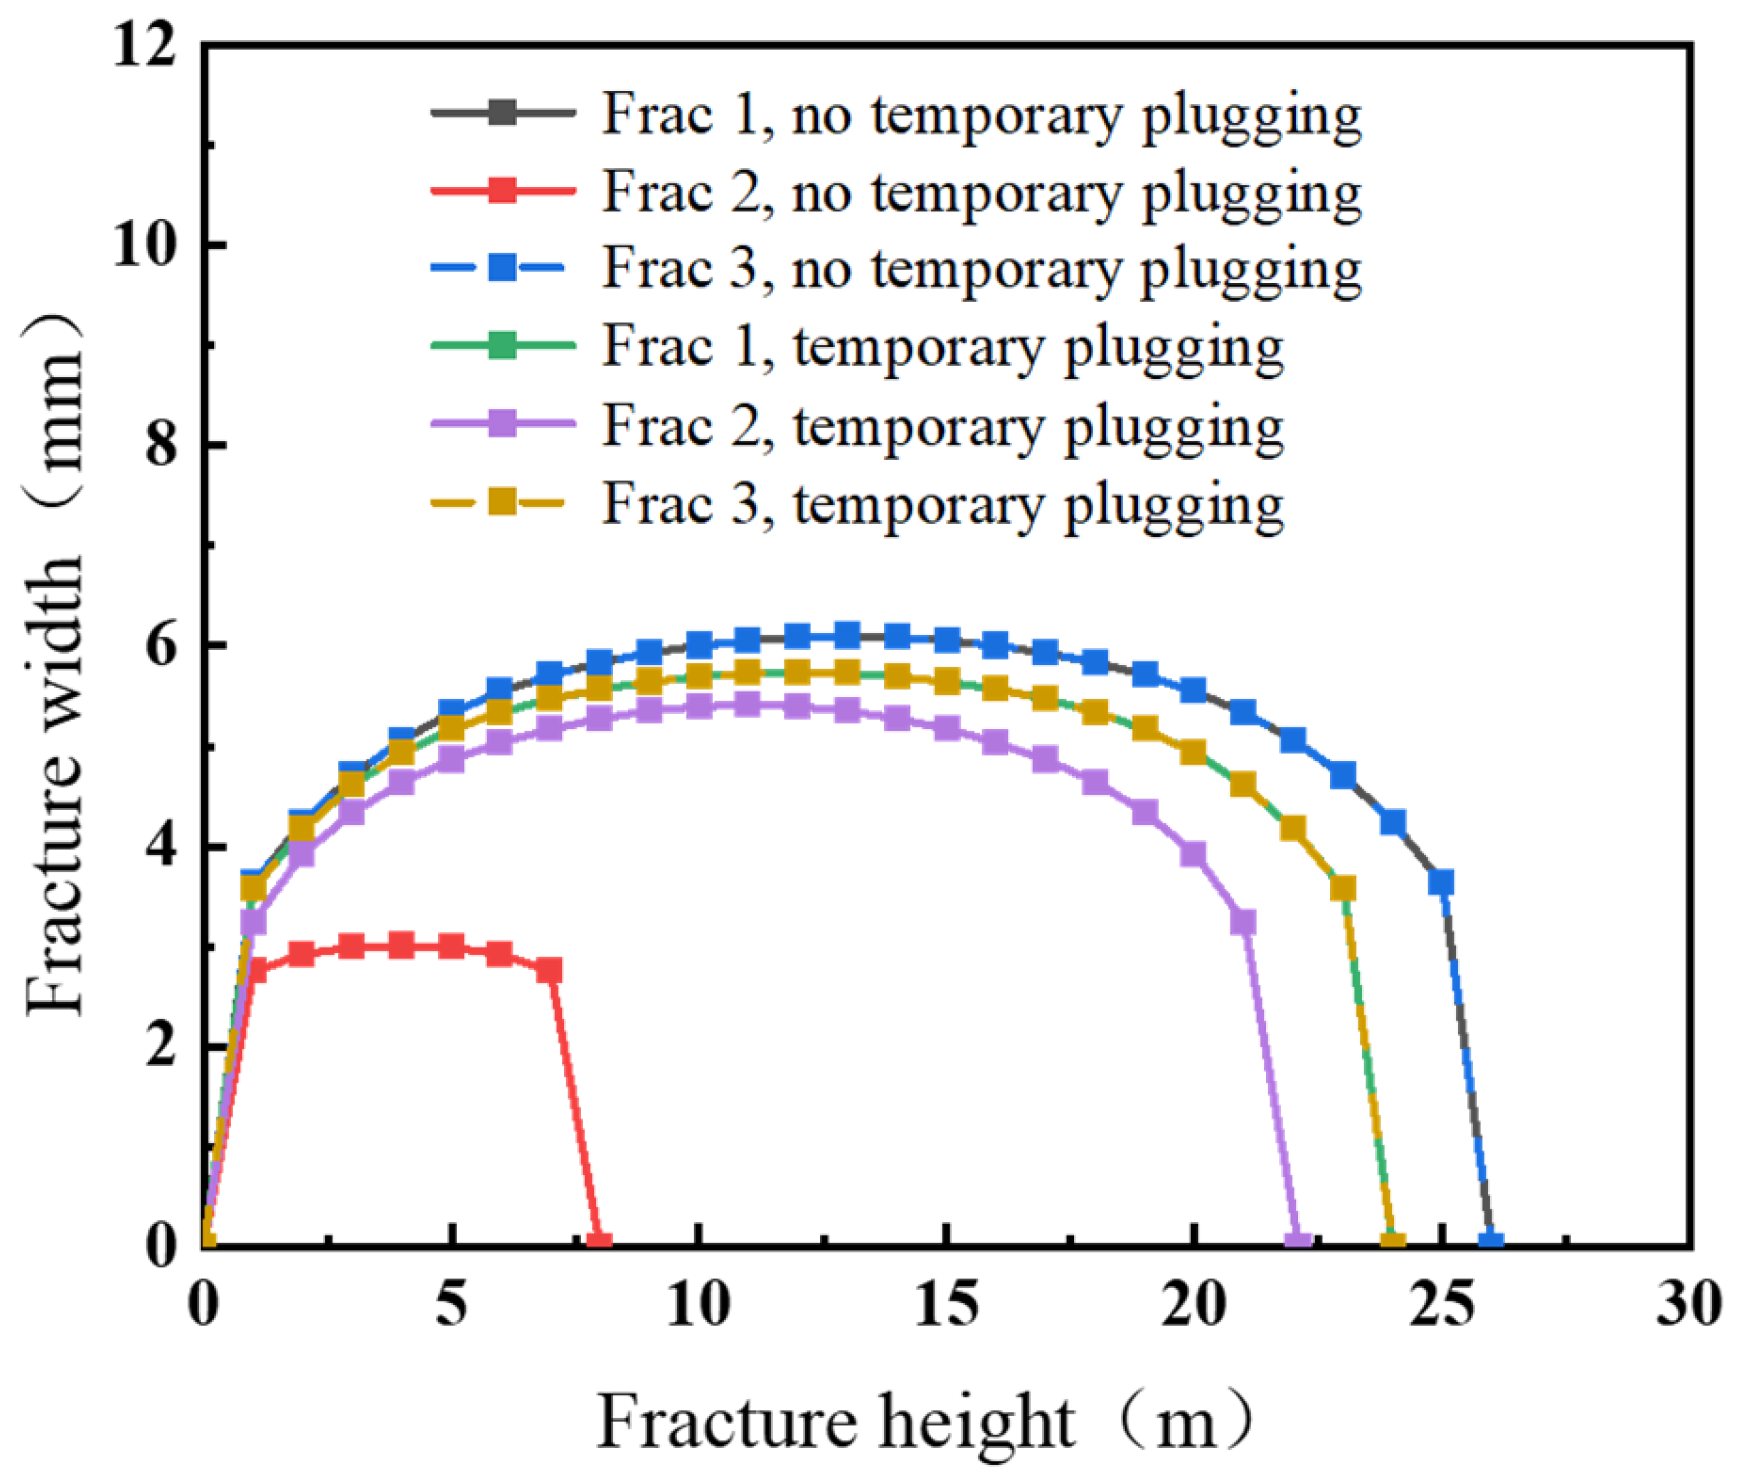
4.1.3. Temporary Blockage Parameters

This study investigates the improvement mechanisms of temporary plugging technology on fracture propagation uniformity based on diverting fracturing principles. A numerical model of a single-stage three-cluster fracturing system (20 m cluster spacing) in a homogeneous reservoir was established, incorporating a high-density perforation design with 16 holes per cluster. Dynamic perforation sealing was achieved by deploying 50% temporary plugging agents, with comparative analysis conducted between the initial fracturing phase (pre-plugging) and the diverting phase (post-plugging). Fracture morphology evolution in Figure 13 demonstrates that edge fractures (Fractures 1 and 3) preferentially propagated during the pre-plugging stage. In contrast, the central fracture (Fracture 2) remained largely unactivated due to stress shadow effects. Post-plugging implementation effectively suppressed edge fracture propagation and activated the central fracture, forming effective fracture length and achieving balanced fracture system development.
Figure 14a illustrates fluid allocation characteristics under temporary plugging control through intake dynamic curves. During the initial stage, edge fractures dominated fluid intake (with Fracture 2 exhibiting near-zero intake). In contrast, post-plugging intervention reversed this pattern, resulting in central fracture intake exceeding edge fractures by a factor of 1.5. Figure 14b elucidates the operational mechanism via pressure evolution: the mechanical barrier formed by temporary plugging agents significantly elevated Fracture 2’s intake pressure (a 7.5 MPa increase), driving fracturing fluid redistribution to under-stimulated zones. This study validates that temporary plugging fracturing technology dynamically adjusts fluid allocation, effectively overcoming stress shadow effects. The intra-stage fluid intake disparity coefficient decreased by 76%. The total stimulated reservoir volume (SRV) increased by 32%, demonstrating its efficacy as a technical solution for enhancing multi-cluster fracturing uniformity in tight reservoirs.

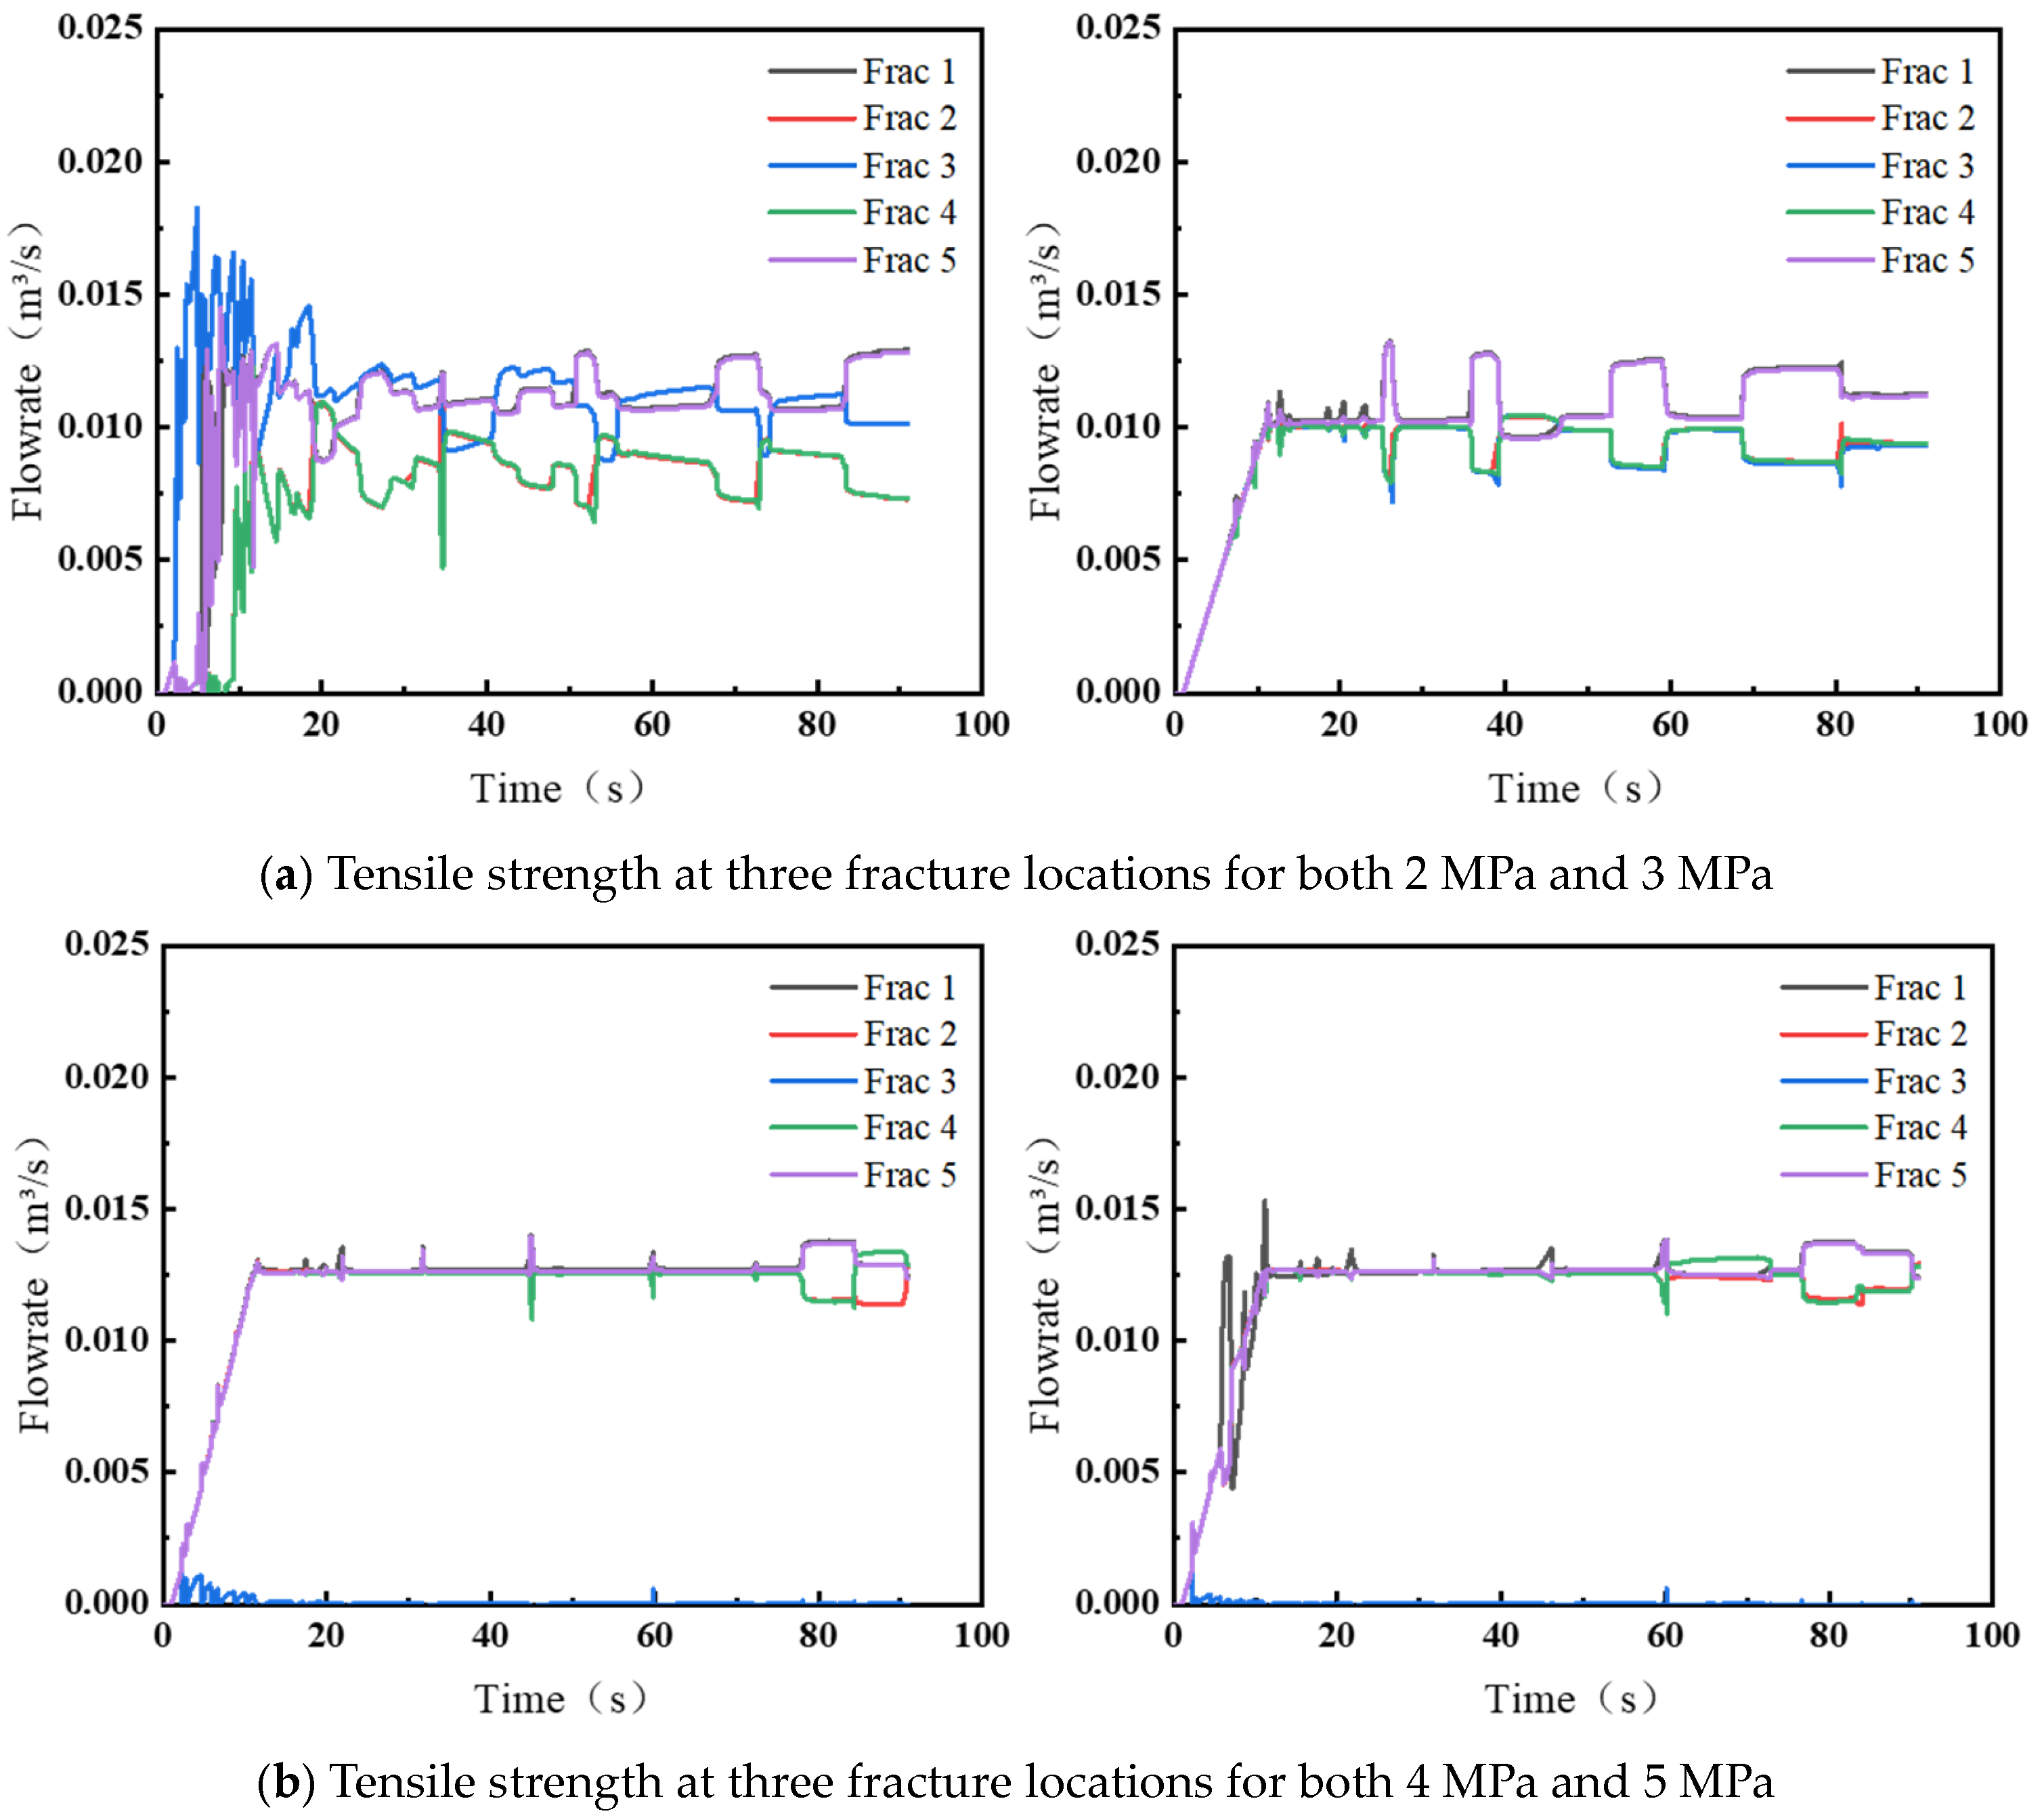
4.2. Differences in Mechanical Properties Between Clusters Within a Segment

Reservoir heterogeneity induces significant variations in rock mechanical properties among perforation clusters within a single stage, directly influencing fracture initiation pressure and propagation uniformity. Studies demonstrate that optimizing cluster placement, flow-limiting parameters, and temporary plugging strategies can effectively regulate competitive fracture propagation in heterogeneous reservoirs. This work investigates the impact of tensile strength variations among clusters on fracture dynamics, establishing a five-cluster fracturing numerical model (single-stage configuration with 20 m cluster spacing). In this model, Fractures 1/2/4/5 maintain constant tensile strength at 3 MPa for their corresponding clusters, while Fracture 3’s cluster tensile strength is systematically varied to 2, 3, 4, and 5 MPa (other parameters are detailed in Table 1). Figure 15 delineates fracture propagation patterns under different tensile strength gradients. When Fracture 3’s tensile strength is 2 MPa, its propagation length approximates that of edge fractures (Fractures 1/5). At 3 MPa tensile strength, Fractures 2/3/4 exhibit relatively balanced propagation, though slightly shorter than edge fractures. When tensile strength increases to 4–5 MPa, Fracture 3 essentially loses propagation capability. These findings indicate that under an eight-holes-per-cluster perforation scheme, the pressure compensation effect generated by perforation friction can only offset limited tensile strength disparities.
Further analysis of fluid intake distribution characteristics (Figure 16) reveals that tensile strength disparities significantly govern fluid allocation behavior. When Fracture 3 exhibits a tensile strength of 2 MPa, its fluid intake surpasses other clusters. At 3 MPa tensile strength, Fractures 2/3/4 demonstrate comparable fluid intake, albeit lower than edge fractures. When tensile strength exceeds 4 MPa, the fluid intake of Fracture 3 approaches zero, with fluid primarily allocated to other clusters. These observations demonstrate that variations in rock tensile strength dominate the evolution of fracture propagation patterns by altering fluid allocation mechanisms. Based on these findings, a geoengineering-integrated design methodology is recommended to optimize cluster placement. By analyzing spatial correlations between well-logging curves and rock mechanical parameters, intervals with minimal tensile strength variations should be prioritized for cluster grouping, thereby constraining inter-cluster mechanical heterogeneity within engineer-adjustable limits. Additionally, core experiments can establish a quantitative relationship model between tensile strength and well-logging parameters, providing theoretical guidance for optimal perforation interval selection.

5. Discussion and Analysis

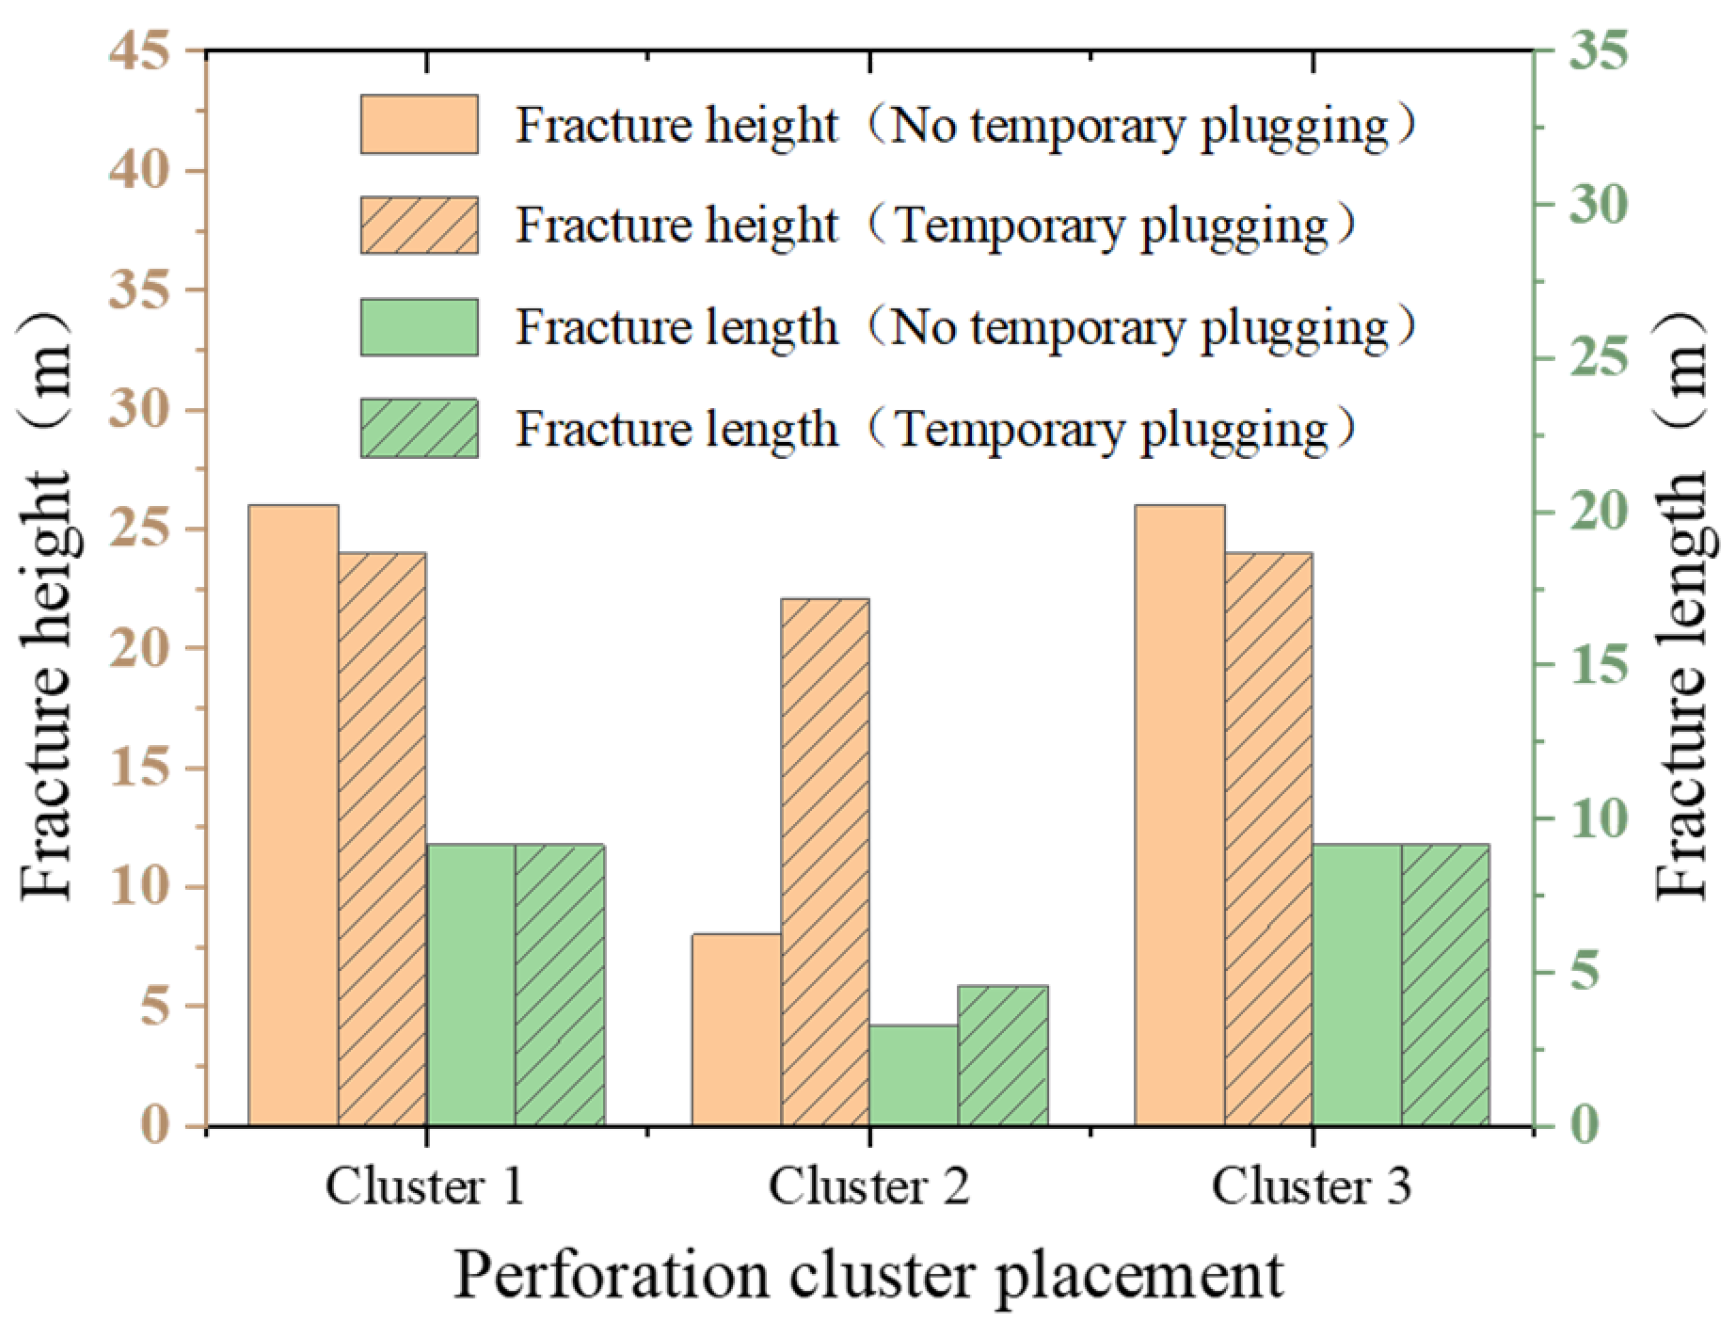
5.1. Quantitative Analysis of the Effectiveness of Temporary Block Fracturing Technology

Temporary plugging fracturing technology represents a critical stimulation method for unconventional hydrocarbon resource development, effectively addressing challenges such as asynchronous fracture initiation and uneven propagation caused by formation heterogeneity, suboptimal flow-limiting designs, and severe perforation erosion. Building on preceding analyses, the significant influence of operational parameters on hydraulic fracture trajectories necessitates a systematic evaluation of fracturing efficacy. Fracture dimensions (height/width/length) serve as key indicators for assessing conductivity, and elucidating their variation patterns helps reveal the holistic impact of temporary plugging on artificial fracture networks. This study examines dimensional alterations in artificial fractures before and after temporary plugging. As Figure 17 and Figure 18 illustrate, comparative histograms demonstrate post-plugging changes in fracture height/width, while accompanying curves delineate width evolution along fracture length. The findings underscore that operational parameters—including plugging agent concentration, injection timing, and flow rate modulation—constitute critical parameters requiring meticulous optimization to achieve desired fracture morphological adjustments.
Figure 17 demonstrates a significant increase in stimulated reservoir volume (SRV) following temporary plugging. Regarding fracture height evolution, Fractures 1 and 3 exhibit an 8% reduction in height due to fluid redistribution-induced net pressure decline, while their length remains unchanged. In contrast, Fracture 2 shows substantial dimensional enhancement, with height and length increasing by 176% and 39%, respectively. These observations indicate that the practical application of temporary plugging fracturing technology improves overall fracture height and length. Comprehensive analysis of dimensional variations reveals that although temporary plugging does not markedly enhance individual fracture width or height, the collective fracture dimensions expand significantly, confirming this technique as an effective method for optimizing hydraulic fracture morphology. While this study primarily investigates the global impact of temporary plugging on fracture networks, further research is required to explore flow allocation characteristics at heel/toe positions. Future work may involve constructing fracturing models with varied cluster spacings to analyze positional variations in fracture dimensions. Figure 18 illustrates the width evolution along fracture height and length before and after temporary plugging. Pre-plugging, Fracture 2 exhibited limited propagation along the length axis (the red curve in Figure 18). Post-plugging, both width and length of Fracture 2 were substantially enhanced, with an 80% increase in width at the injection point (the purple curve in Figure 18).

5.2. Quantitative Analysis of the Degree of Difference in Fluid Inflow Through Cracks

Fracturing design must comprehensively consider the influence of cluster spacing and the number of perforation clusters. As shown in Figure 7, a comparative analysis of fracture propagation nephograms for configurations with three, four, and five perforation clusters under a cluster spacing of 10 m reveals that fractures at different positions are subjected to varying degrees of stress shadow effects, resulting in non-uniform fracture propagation during the fracturing process. This study employs the uniformity index (UI) as an assessment parameter through which to evaluate the uniformity of multi-cluster fracture development. The UI index is primarily used for real-time monitoring of fluid distribution within fractures. It reflects the equilibrium of fracturing fluid allocation through its proximity to the value of 1, where a UI equal to 1 indicates equal fluid distribution among all perforation clusters.
Figure 19 illustrates the uniformity index (UI) variation curves under different perforation cluster numbers and cluster spacing conditions. The UI index effectively evaluates the average fluid distribution uniformity among perforation clusters. When the number of perforation clusters is three, four, or five, the fracturing fluid allocation equilibrium under a cluster spacing of 20 m significantly outperforms that under 10 m spacing, indicating that increasing cluster spacing effectively mitigates stress shadow effects. For a fixed cluster spacing of 10 m, the UI index does not exhibit a linear correlation with increasing perforation cluster numbers. Specifically, the UI value for four perforation clusters most closely approaches unity (1), demonstrating superior performance compared to configurations with three or five clusters. This suggests an optimal perforation cluster count exists, as indiscriminate increases in cluster numbers may induce adverse effects and compromise production enhancement objectives. When cluster spacing is extended to 20 m, the benefits of spacing optimization on fracture uniformity become more pronounced with higher perforation cluster numbers. As Figure 7 and Figure 8 demonstrate, increasing cluster spacing for three-cluster configurations yields weaker improvements in fluid distribution equilibrium compared to five-cluster configurations. Consequently, fracturing design necessitates holistic integration of geological constraints rather than unilateral reliance on either cluster spacing amplification or perforation cluster quantity escalation.
Figure 20 presents the uniformity index (UI) variation curves before and after applying temporary plugging fracturing technology. Figure 13 and Figure 15 show that fracture propagation during stimulation is prone to non-uniform development due to operational and geological constraints. Before plugging, the UI index remains stable at a value deviating from 1. In contrast, the UI index significantly increases post plugging and converges toward unity (1), demonstrating that temporary plugging technology effectively promotes balanced reservoir stimulation. While this study primarily investigates the influence of simultaneous fracturing methods on artificial fracture propagation patterns, it does not address the impact of fracturing sequence on hydraulic fracture development. Subsequent investigations could focus on this aspect to deepen the understanding. No additional data or content has been introduced in this analysis.

6. Conclusions

Horizontal well staged multi-cluster fracturing technology is critical for enhancing unconventional oil and gas resource development efficiency. Yet, the issue of non-uniform fracture propagation severely constrains fracturing effectiveness. Through numerical simulations and theoretical analyses, this study elucidates the mechanical mechanisms governing multi-fracture competitive propagation and proposes effective engineering optimization strategies. Key conclusions are summarized as follows:
(1)
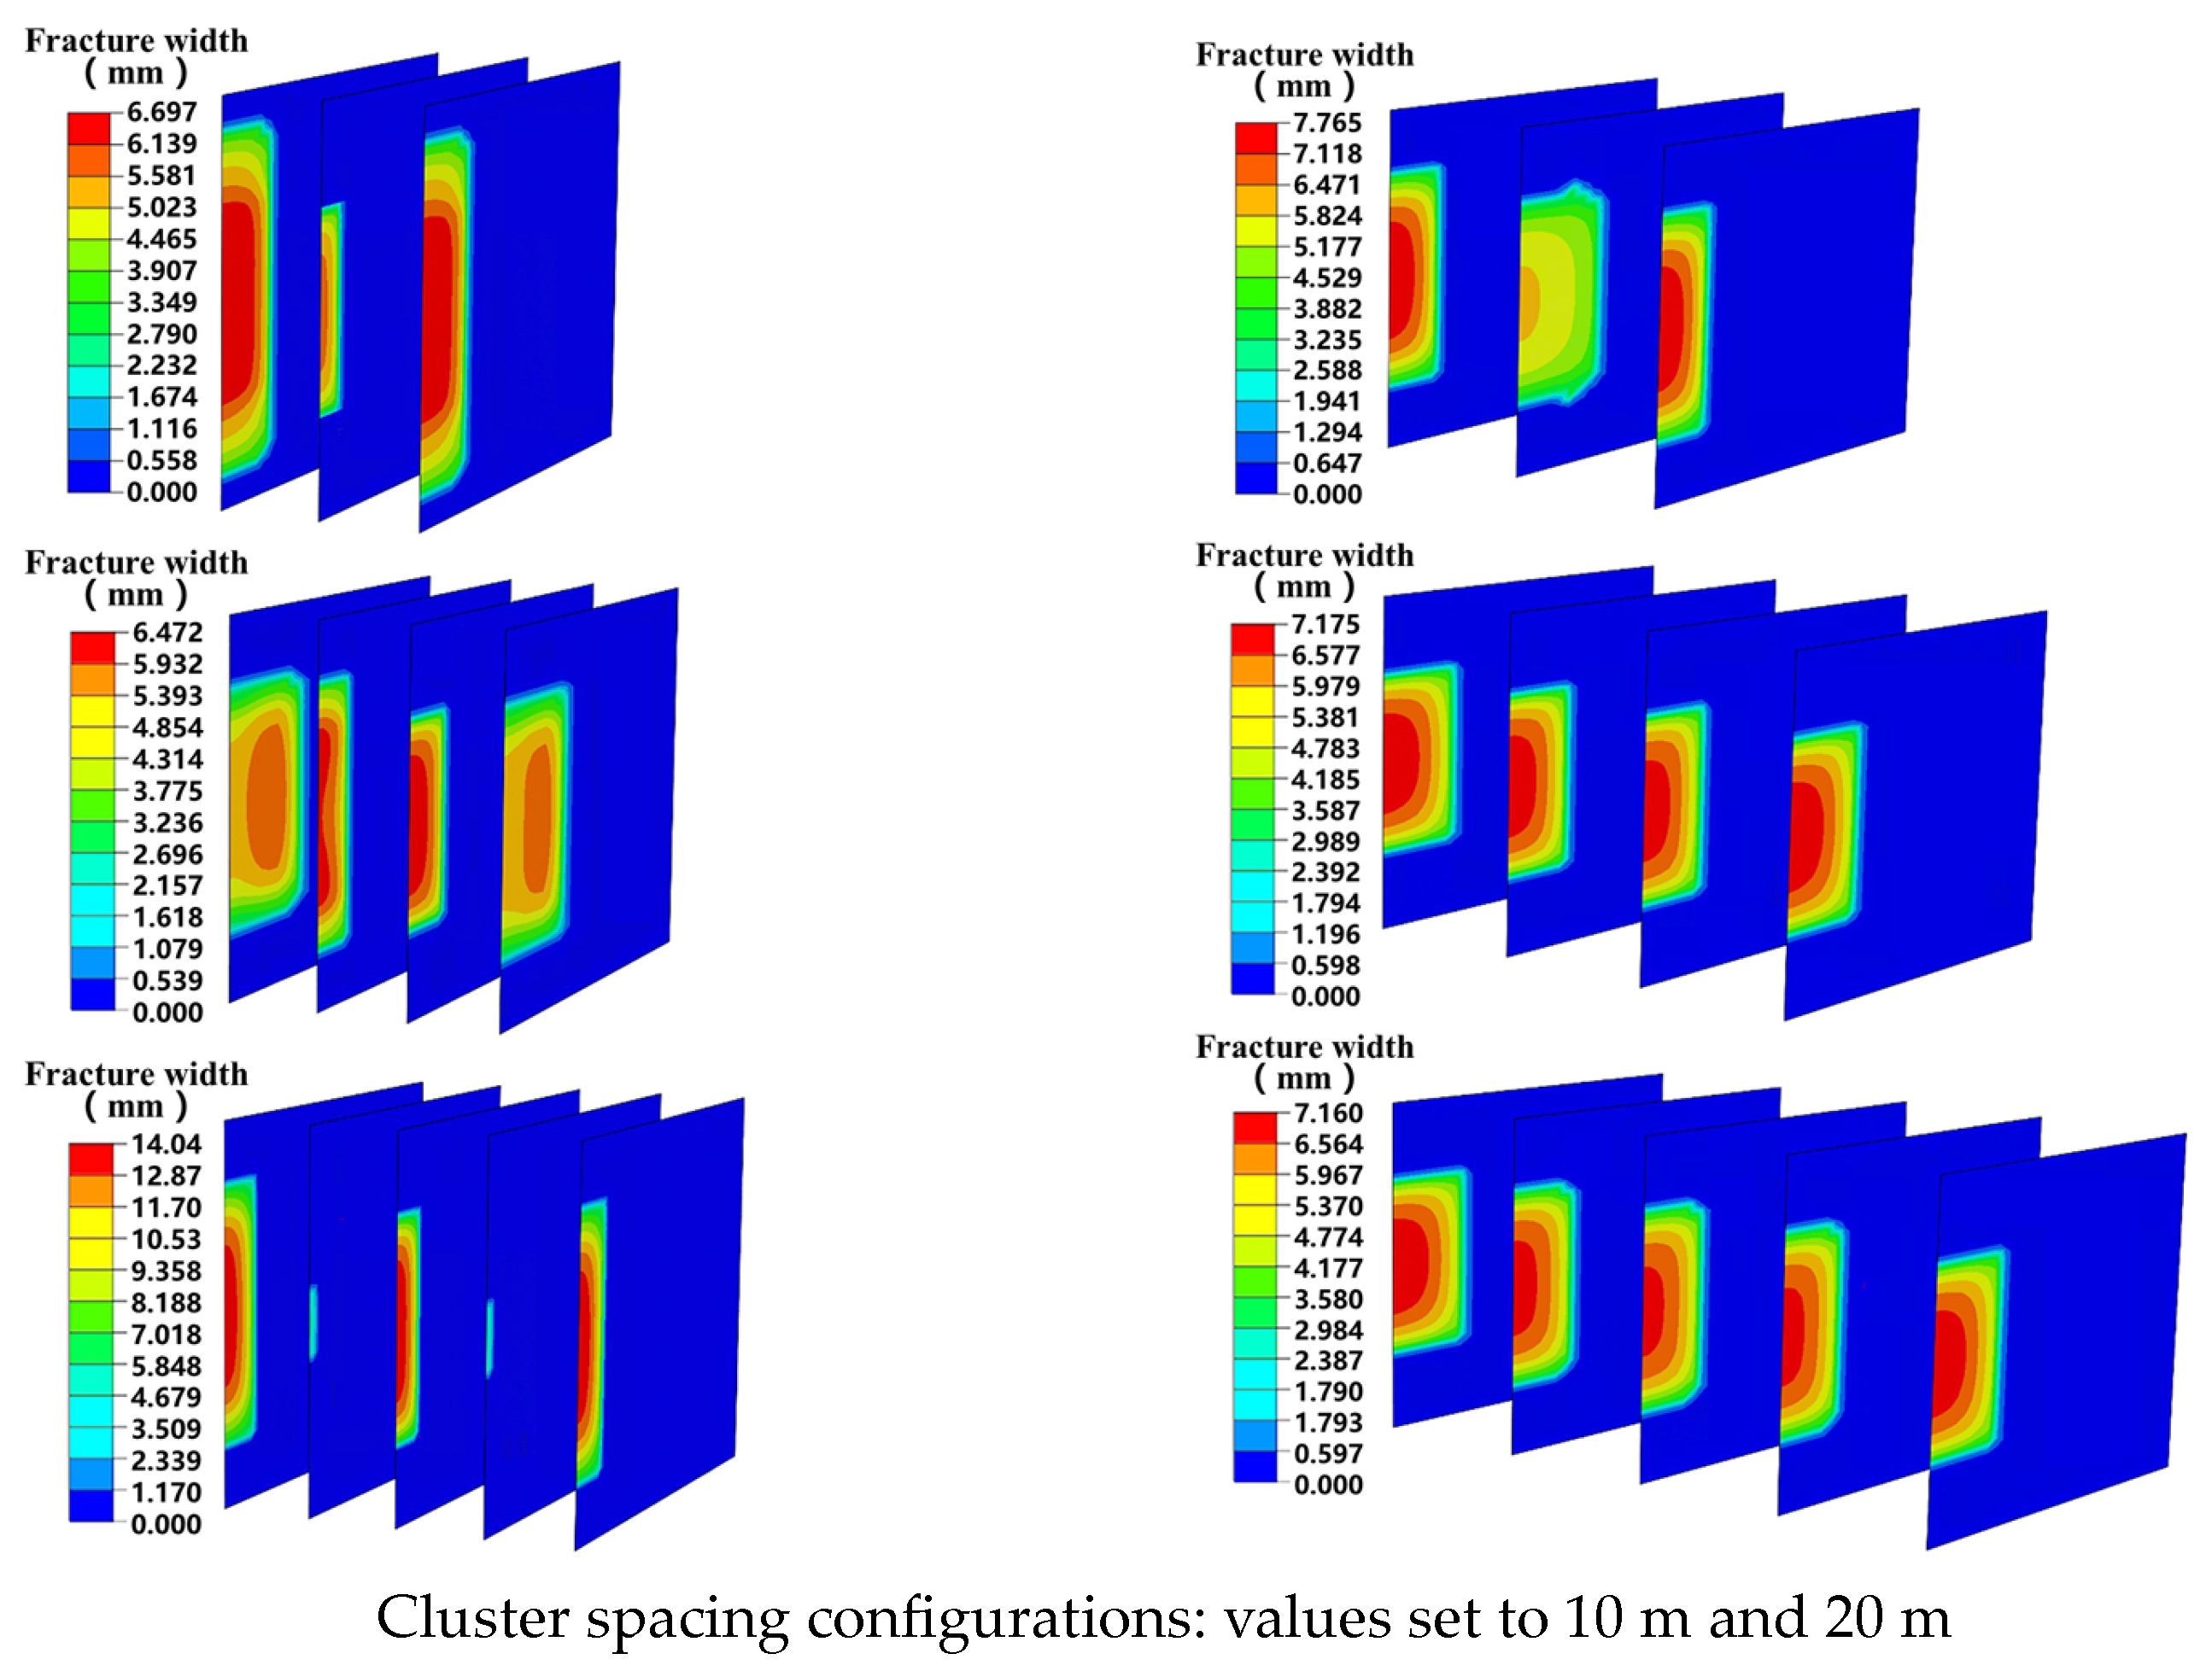
Increased fracture spacing mitigates stress shadow effects and improves fracture propagation uniformity. Expanding fracture spacing from 10 to 20 m enhances the propagation length of central fractures by 38.2% and elevates fracture width uniformity by 21.5%. Notably, the number of perforation clusters exhibits an optimal threshold, as excessive cluster proliferation may induce adverse operational effects.
(2)
Increasing perforation friction pressure (7.5 MPa) optimizes fluid allocation between edge and central fractures, suppressing fluid distribution imbalance. Under high-friction conditions, fracture propagation uniformity and stimulated reservoir volume (SRV) outperform those under low-friction scenarios, with fluid allocation progressively approaching equilibrium.
(3)
Temporary plugging fracturing technology enhances central fracture propagation capacity by dynamically adjusting fluid allocation and overcoming stress shadow effects. Post-plugging interventions reduce the fluid influx differentiation coefficient within the fracture system by 76% and increase the stimulated reservoir volume (SRV) by 32%.
(4)
The tensile strength heterogeneity between perforation clusters significantly governs fracture propagation and fluid allocation. When the tensile strength difference exceeds 1 MPa, perforation friction proves insufficient to equilibrate pressure allocation. By optimizing perforation cluster placement guided by well logging data, the effects of mechanical heterogeneity can be effectively controlled.
Current technical approaches predominantly rely on static rock mechanical parameters, failing to adequately integrate dynamic data from exploration and development processes. Subsequent research will focus on synergistically integrating artificial intelligence technologies—particularly machine learning and deep learning—with fracturing monitoring data, propelling the transition of fracturing methodologies from static design paradigms toward dynamic control architectures.

Author Contributions

Formal analysis, Y.Y., Y.W., Q.W. and B.W.; Writing—original draft, Y.Y.; Writing—review & editing, Y.Y.; Supervision, Y.W. and B.W.; Funding acquisition, H.L. All authors have read and agreed to the published version of the manuscript.

Funding

The authors would like to acknowledge the financial support from the National Natural Science Foundation of China (No. 52374057 and U23B2084), the “Tianshan Talent” Training Program (2023TSYCCX0004), and the Autonomous Region Key Research and Development Project (No. 2024B01013-1), Xinjiang Tianshan Innovation Team program (2024D14004).

Data Availability Statement

The original contributions presented in this study are included in the article. Further inquiries can be directed to the corresponding author.

Conflicts of Interest

Author Yujie Yan was employed by the Research Institute of Petroleum Engineering Technology, Sinopec Northwest Oilfield Company. Author Hui Li was employed by the Exploration Business Department of PetroChina Changqing Oilfield Branch, PetroChina. The remaining authors declare that the research was conducted in the absence of any commercial or financial relationships that could be construed as a potential conflict of interest.

References

  1. Dai, C.; Wang, Z.; Li, L. Research on chemical temporary plugging agent for deep reservoir fracturing: Progress and prospect. Nat. Gas Ind. 2025, 45, 19–32. [Google Scholar]
  2. Xu, J.; Wang, M.; Wang, J.; Sun, H.; Wang, L. Practice and understanding of volume fracturing technology for horizontal wells in Jimsar shale oil reservoir. Xinjiang Oil Gas 2024, 20, 23–29. [Google Scholar]
  3. Wei, C.; Li, H.; Zhu, X.; Luo, H.; Tu, K. Fracture parameter diagnostic method during staged multi-cluster fracturing based on distributed temperature sensing. Pet. Explor. Dev. 2025, 52, 441–450. [Google Scholar] [CrossRef]
  4. Wang, B.; Wang, Q.; Zhou, H.; Zhang, L.; Xie, Z. Numerical simulation of three-dimensional vertical fracture propagation model under the influence of bedding. Xinjiang Oil Gas 2024, 20, 77–87. [Google Scholar]
  5. Song, X.; Guo, Y.; Zhang, J.; Sun, N.; Shen, G.; Chang, X.; Yu, W.; Tang, Z.; Chen, W.; Wei, W.; et al. Fracturing with Carbon Dioxide: From Microscopic Mechanism to Reservoir Application. Joule 2019, 3, 1913–1926. [Google Scholar] [CrossRef]
  6. Di, C.; Wei, Y.; Wang, K.; Deng, P.; Chen, B.; Shen, L.; Chen, Z. The impact of pressurization-induced decrease of capillary pressure and residual saturation on geological carbon dioxide storage. J. Clean. Prod. 2025, 486, 144573. [Google Scholar] [CrossRef]
  7. Miller, C.K.; Waters, G.A.; Rylander, E.I. Evaluation of Production Log Data from Horizontal Wells Drilled in Organic Shales. In Proceedings of the SPE Hydraulic Fracturing Technology Conference and Exhibition, The Woodlands, TX, USA, 14 June 2018. [Google Scholar]
  8. Wang, T.; Cheng, L.; Xiang, Y.; Cheng, N.; Wang, B.; Zhou, H. Numerical simulation of fracture propagation pattern in the presence of gravel. Xinjiang Oil Gas 2023, 19, 42–48. [Google Scholar]
  9. Wang, B.; Yan, T.; Li, H.; Zhou, L.; Sheng, S.; Zhou, F. The integrated simulation of fracture propagation and seepage studied by using a coupled phase field and fracture flow method. Pet. Sci. Bull. 2025, 10, 192–205. [Google Scholar]
  10. Zhao, H.; Wang, C.; Xi, Y.; Wang, C. Study on dynamic stress field of fracturing in horizontal wells of deep coal seams: A case study of Daning-Jixian block in Ordos Basin. Pet. Reserv. Eval. Dev. 2025, 15, 310–323. [Google Scholar]
  11. Chen, J. Research on the Fracture Propagation Law at the Deep Shale under Differentiated Perforation. Drill. Prod. Technol. 2025, 48, 102–108. [Google Scholar]
  12. Fisher, M.K.; Heinze, J.R.; Harris, C.D.; Davidson, B.M.; Wright, C.A.; Dunn, K.P. Optimizing Horizontal Completion Techniques in the Barnett Shale Using Microseismic Fracture Mapping. In Proceedings of the SPE Annual Technical Conference and Exhibition, Houston, TX, USA, 26 September 2004. [Google Scholar]
  13. Daneshy, A. Dynamic Interaction within Multiple Limited Entry Fractures in Horizontal Wells: Theory, Implications and Field Verification. In Proceedings of the SPE Hydraulic Fracturing Technology Conference, The Woodlands, TX, USA, 3 February 2015. [Google Scholar]
  14. Wheaton, B.; Miskimins, J.; Wood, D.; Lowe, T.; Barree, R. Integration of distributed temperature and distributed acoustic survey results with hydraulic fracture modeling; a case study in the Woodford Shale. Seg Tech. Program Expand. Abstr. 2015, 34, 4926–4927. [Google Scholar]
  15. Roberts, G.; Lilly, T.B.; Tymons, T.R. Improved Well Stimulation Through the Application of Downhole Video Analytics. In Proceedings of the SPE Hydraulic Fracturing Technology Conference and Exhibition, The Woodlands, TX, USA, 23 January 2018. [Google Scholar]
  16. Slocombe, R.; Acock, A.; Fisher, K.; Viswanathan, A.; Chadwick, C.; Reischman, R.; Wigger, E. Eagle Ford Completion Optimization Using Horizontal Log Data. In Proceedings of the SPE Annual Technical Conference and Exhibition, New Orleans, LA, USA, 30 September 2013. [Google Scholar]
  17. El Rabaa, W. Experimental Study of Hydraulic Fracture Geometry Initiated From Horizontal Wells. In Proceedings of the SPE Annual Technical Conference and Exhibition, San Antonio, TX, USA, 8 October 1989. [Google Scholar]
  18. Michael, A. Hydraulic Fracturing Optimization; Experimental Investigation of Multiple Fracture Growth Homogeneity via Perforation Cluster Distribution. Doctoral Dissertation, The University of Texas at Austin, Austin, TX, USA, 2016. [Google Scholar]
  19. Germanovich, L.N.; Ring, L.M.; Astakhov, D.K.; Shlyapobersky, J.; Mayerhofer, M.J. Hydraulic fracture with multiple segments II. Modeling. Int. J. Rock Mech. Min. Sci. 1997, 34, 98. [Google Scholar] [CrossRef]
  20. Fu, H.; Cai, B.; Geng, M.; Jia, A.; Weng, D.; Liang, T.; Zhang, F.; Wen, X.; Xiu, N. Three dimensional simulation of hydraulic fracture propagation based on vertical reservoir heterogeneity. Nat. Gas Ind. 2022, 42, 56–68. [Google Scholar]
  21. Yang, F.; Mei, W.; Li, L.; Sun, Z.; An, Q.; Yang, Q.; Lu, M.; Yang, R. Propagation of hydraulic fractures in thin interbedded tight sandstones. Coal Geol. Explor. 2023, 51, 61–71. [Google Scholar]
  22. Lecampion, B.; Desroches, J. Simultaneous initiation and growth of multiple radial hydraulic fractures from a horizontal wellbore. J. Mech. Phys. Solids 2015, 82, 235–258. [Google Scholar] [CrossRef]
  23. Wu, K.; Olson, J.E. Simultaneous Multifracture Treatments: Fully Coupled Fluid Flow and Fracture Mechanics for Horizontal Wells. SPE J. 2014, 20, 337–346. [Google Scholar] [CrossRef]
  24. Long, G.; Xu, G. The Effects of Perforation Erosion on Practical Hydraulic-Fracturing Applications. SPE J. 2017, 22, 645–659. [Google Scholar] [CrossRef]
  25. Wang, B.; Zhou, F.J.; Zou, Y.S.; Gao, L.Y.; Hu, J.; Gu, X.L. Numerical simulation method of fracture interaction during temporary plugging staged fracturing. Fault-Block Oil Gas Field 2018, 25, 506–509. [Google Scholar]
  26. Chen, J.; Zhu, H.; Zhao, P.; Chen, S.; She, C.; Zheng, M.; Wang, D.; Lu, C.; Tang, X. Simulation of segmented multi-cluster fracturing fracture competitive propagation in horizontal wells considering flow allocation. Fault-Block Oil Gas Field 2025, 32, 315–321. [Google Scholar]
  27. Sheng, M.; Deng, C.; Li, J.; Gu, M.Z.; Wang, T.Y.; Tian, S.C. Non-uniform perforation to balance multi-cluster fractures propagation and parameter optimization. Xinjiang Oil Gas 2024, 20, 54–63. [Google Scholar]
  28. Wang, F.; Dong, Z.; Xu, T.; Chen, L.; Wang, Z.; Li, Z. Quantitative evaluation of frac hits based on shut-in pressure drop curve: Taking shale oil platform wells in Jimsar as an example. Xinjiang Oil Gas 2024, 20, 91–98. [Google Scholar]
  29. Izadi, G.; Settgast, R.; Moos, D.; Baba, C.; Jo, H. Fully 3D Hydraulic Fracture Growth within Multi-Stage Horizontal Wells. In Proceedings of the 13th ISRM International Congress of Rock Mechanics, Montreal, QC, Canada, 10 May 2015. [Google Scholar]
  30. Wu, K.; Olson, J.E. Mechanisms of Simultaneous Hydraulic-Fracture Propagation From Multiple Perforation Clusters in Horizontal Wells. SPE J. 2016, 21, 1000–1008. [Google Scholar] [CrossRef]
  31. Wu, K.; Olson, J.; Balhoff, M.T.; Yu, W. Numerical Analysis for Promoting Uniform Development of Simultaneous Multiple-Fracture Propagation in Horizontal Wells. Spe Prod. Oper. Prod. Oper. 2016, 32, 41–50. [Google Scholar]
  32. Peirce, A.; Detournay, E. An implicit level set method for modeling hydraulically driven fractures. Comput. Methods Appl. Mech. Eng. 2008, 197, 2858–2885. [Google Scholar] [CrossRef]
  33. Davies, A.J. The Finite Element Method: An Introduction with Partial Differential Equations; Oxford University Press: Oxford, UK, 2011. [Google Scholar]
  34. Zhang, Y.K.; Chen, S.B.; Li, X.Y.; Wang, H.J. Hydraulic fracturing simulation technology of shale gas reservoir and application of extended finite element method. Nat. Gas Geosci. 2021, 32, 109–118. [Google Scholar]
  35. Zou, J.; Chen, W.; Yuan, J.; Yang, D.; Yang, J. 3-D numerical simulation of hydraulic fracturing in a CBM reservoir. J. Nat. Gas Sci. Eng. 2017, 37, 386–396. [Google Scholar] [CrossRef]
  36. Chen, Z.; Jeffrey, R.G.; Zhang, X.; Kear, J. Finite-Element Simulation of a Hydraulic Fracture Interacting With a Natural Fracture. SPE J. 2017, 22, 219–234. [Google Scholar] [CrossRef]
  37. Fu, S.; Chen, M.; Xia, Y.; Tan, P.; Zhang, Y.; Li, Y. Hydraulic fracture height growth law for deep coal measures shale reservoir. Fault-Block Oil Gas Field 2021, 28, 555–560. [Google Scholar]
  38. Boone, T.J.; Ingraffea, A.R. A numerical procedure for simulation of hydraulically-driven fracture propagation in poroelastic media. Int. J. Numer. Anal. Methods Geomech. 1990, 14, 27–47. [Google Scholar] [CrossRef]
  39. Wang, H. Hydraulic fracture propagation in naturally fractured reservoirs: Complex fracture or fracture networks. J. Nat. Gas Sci. Eng. 2019, 68, 102911. [Google Scholar] [CrossRef]
  40. Crump, J.B.; Conway, M.W. Effects of Perforation-Entry Friction on Bottomhole Treating Analysis. J. Pet. Technol. Pet. Technol. 1988, 40, 1041–1048. [Google Scholar] [CrossRef]
  41. Lv, W.; Sun, Z.; Llu, B.; Zhou, H.; Zhou, F.; Wang, B. Optimization of perforation friction during limited entry fracturing of Jimsar shale oil reservoir. J. Xi’an Shiyou Univ. (Nat. Sci. Ed.) 2022, 37, 49–57. [Google Scholar]
  42. Li, M.; Zhou, F.; Yuan, L.; Chen, L.; Hu, X.; Huang, G.; Han, S. Numerical modeling of multiple fractures competition propagation in the heterogeneous layered formation. Energy Rep. 2021, 7, 3737–3749. [Google Scholar] [CrossRef]
  43. Churchill, S.W. Friction-Factor Equation Spans All Fluid-Flow Regimes. 1977. Available online: https://pascal-francis.inist.fr/vibad/index.php?action=getRecordDetail&idt=PASCAL7860099142 (accessed on 8 July 2025).
  44. Li, H.; Zhang, Q.; Jiang, Z. Numerical simulation on staged multi-cluster and cross-layer fracturing of horizontal well in coal seam roof. Fault-Block Oil Gas Field 2022, 29, 714–720. [Google Scholar]
  45. Li, M.H.; Zhou, F.J.; Huang, G.P. A finite element simulation method for multi-fracture propagation in horizontal wells based on fluid pipe element. J. China Univ. Pet. (Ed. Nat. Sci.) 2022, 46, 105–112. [Google Scholar]
Figure 1. Cohesive element fracture initiation and propagation criteria [33].
Processes 13 02252 g001
Figure 2. Cohesive zone model [34].
Processes 13 02252 g002
Figure 3. Multi-cluster fracturing geometric model in a horizontal wellbore.
Processes 13 02252 g003
Figure 4. Comparative analysis of Li and Wu’s models in displacement distribution [44].
Processes 13 02252 g004
Figure 5. Comparative analysis of fracture propagation morphology and flow distribution between the Li−Minghui model and the Wu model [45].
Processes 13 02252 g005
Figure 6. Explanation of multi-cluster fracture placement transformation within a stage.
Processes 13 02252 g006
Figure 7. Cluster density–spacing coupling effects on hydraulic fracture network morphology.
Processes 13 02252 g007
Figure 8. Fluid intake curves of individual fractures with cluster number per stage and spacing constraints.
Processes 13 02252 g008aProcesses 13 02252 g008b
Figure 9. Mouth aperture evolution and fluid intake dynamics of fracture #2 in the three-cluster stage configuration.
Processes 13 02252 g009
Figure 10. Quantification of fracture propagation length in the four-cluster stage configuration.
Processes 13 02252 g010
Figure 11. Perforation friction-dependent fracture network geometries.
Processes 13 02252 g011
Figure 12. Perforation friction-dependent fluid intake characteristics in multi-fracture systems.
Processes 13 02252 g012
Figure 13. Fracture network reconfiguration contour mapping under temporary plugging intervention.
Processes 13 02252 g013
Figure 14. Fluid intake behavioral shift and hydraulic redistribution dynamics pre-/post-diverting.
Processes 13 02252 g014
Figure 15. Inter-cluster compressive strength contrast-driven fracture propagation patterns.
Processes 13 02252 g015
Figure 16. Tensile strength gradient’s effects on per-fracture fluid allocation dynamics.
Processes 13 02252 g016
Figure 17. Diverter-induced fracture dimensional optimization: height–length coupling effects.
Processes 13 02252 g017
Figure 18. Diverting-enhanced aperture spatial distribution along the fracture propagation path.
Processes 13 02252 g018
Figure 19. Cluster density–spacing coupling effects on temporal evolution.
Processes 13 02252 g019
Figure 20. Diversion-triggered UI phase space trajectory remodeling.
Processes 13 02252 g020
Table 1. Summary of model input parameters.
The InterlayerReservoir
Young’s modulus/GPa2825
Poisson’s ratio0.220.22
Tensile strength /MPa53
Effective stress (X, Y, Z)/MPa18/21/2016/21/20
Permeability1 × 10−71 × 10−7
Porosity ratio0.09830.0983
Viscosity/Pa·s0.10.1
Disclaimer/Publisher’s Note: The statements, opinions and data contained in all publications are solely those of the individual author(s) and contributor(s) and not of MDPI and/or the editor(s). MDPI and/or the editor(s) disclaim responsibility for any injury to people or property resulting from any ideas, methods, instructions or products referred to in the content.

