Abstract
This study investigated the influence of process parameters on the recovery of phenolic compounds and antioxidant activity from pineapple peel using green extraction technologies: ultrasound-assisted extraction (UAE) and microwave-assisted extraction (MAE). A two-level factorial design was used to evaluate the effects of the solvent-to-solid ratio, time, temperature, ethanol concentration, and power on the yield of hydrolyzable and condensed polyphenols. The extracts were characterized using HPLC-MS, and their antioxidant activity was assessed using DPPH, ABTS, and FRAP assays. UAE yielded the highest condensed polyphenol content (323.82 mg/g), while MAE extracts demonstrated superior antioxidant activity (FRAP: 90.40 mgEqTrolox/g). The predominant compound identified using both methods was 1-caffeoylquinic acid. The most influential variable in UAE was the solvent-to-solid ratio, whereas extraction time was the most significant variable in MAE. These findings highlight the potential of pineapple peel valorization through sustainable extraction methods, with UAE favoring phenolic yield and MAE enhancing bioactivity, thereby supporting their application in the food and nutraceutical industries.
1. Introduction
Pineapple is one of the most widely consumed fruits, with approximately 29 million tons produced worldwide in 2023, and its production is expected to increase by 2.3% annually [1,2]. The principal pineapple-producing countries are Costa Rica, Brazil, the Philippines, China, India, Thailand, Mexico, Indonesia, Nigeria, and Colombia [3]. In Mexico, the production of this fruit is approximately 1,209,000 tons per year, and the producing states are Veracruz, Campeche, Chiapas, Guerrero, Oaxaca, Puebla, Quintana Roo, Tabasco, and Yucatán [4,5]. Pineapple production has three main uses: the consumption of fresh fruit (70%); the industrialization of the fruit (25%), dedicated to the production of juices, jams, nectars, and candies; and finally, the export market (5 to 7%) [6,7].
The accumulation of agricultural residues, such as pineapple peel, poses environmental challenges and represents an underexploited resource for the recovery of bioactive compounds. Pineapple peel accounts for approximately 50% of the fruit’s mass and contains considerable amounts of phenolic acids (e.g., ferulic, cinnamic, p-coumaric acids), flavonoids and tannins with antioxidant properties, yet remains largely discarded [8].
Currently, these waste materials have industrial applications, including the production of wine, vinegar, fiber, cellulose, and cookies [9,10]. The residues are a rich source of carbohydrates, proteins, cellulose, vitamins (A, B, and C), minerals (calcium, magnesium, potassium, manganese, sodium, and copper), and bioactive compounds (condensed and hydrolyzable polyphenols) [10,11,12].
In recent years, green extraction techniques—including UAE and MAE—have emerged as sustainable and efficient alternatives to conventional solvent-based methods, reducing solvent consumption and energy use while increasing phenolic yields [13,14,15].
Although UAE and MAE have been successfully applied to various fruit by-products (e.g., grape pomace, citrus, and tropical fruit residues) [16,17,18], comparative studies focusing specifically on pineapple peel are scarce. For instance, the UAE of pineapple peel reported total phenolic and flavonoid contents of 1078.68 mg GAE/g DW and 1276.64 mg QE/g DW, respectively [19], but the comparison with MAE or simultaneous profiling of extract composition remains limited. In contrast, MAE applied to pineapple peel reached total polyphenolic and flavonoid contents of 14.19 mg GAE/g and 12.93 mg QE/g, respectively, with 75% DPPH inhibition under 600 W for 40 min with a 20:1 mL/g solvent-substrate ratio [20]. Although studies on the extraction of phenolic compounds from other matrices have been reported, the comparative application of green technologies, such as ultrasound and microwaves, to pineapple peel under controlled conditions and with specific phenolic profile analysis remains limited in the literature. This study addresses the application of a two-level factorial design to investigate how operational parameters (e.g., solvent-to-solid ratio, time, temperature, and power) affect the recovery of both condensed and hydrolyzable phenolics and antioxidant activity. Additionally, the extract profiles were characterized using HPLC-MS to identify the compounds.
Finally, this study contributes to the valorization of pineapple peel by combining green extraction technologies with robust analytical profiling, providing a foundational knowledge for future optimization. These insights support the development of sustainable processes for converting fruit waste into high-value nutraceuticals.
2. Materials and Methods
2.1. Reagents and Materials
All chemicals and reagents used in this study were of analytical or HPLC grade. Methanol (≥99.8%) was obtained from Jalmek® (Escobedo, Nuevo León, Mexico). Ethanol (96%), hydrochloric acid (37%), and potassium persulfate (K2S2O8) were obtained from Analytyka® (Escobedo, Nuevo León, Mexico). Standards for antioxidant assays—2,2-diphenyl-1-picrylhydrazyl (DPPH), 2,2′-azinobis (3-ethylbenzothiazoline-6-sulfonic acid) (ABTS), (2,4,6-tripyridyl-s-triazine (TPTZ), and Trolox were obtained from Sigma-Aldrich (St. Louis, MO, USA). Folin–Ciocalteu reagent was obtained from Golden BellMR (Mexico City, Mexico). Terbutanol (99%), butanol (99%) and sodium carbonate (Na2CO3) were obtained from Jalmek®. Ferrous sulfate (FeSO4∙7H2O) and ferric chloride (FeCl3∙6H2O) were obtained from Fagalab® (Mocorito, Sinaloa, Mexico). The water used for all extractions and analytical procedures was obtained from a water purification system consisting of a softener with an ion-exchange resin, an activated carbon filter, and six-stage reverse osmosis membranes. The resulting purified water had a conductivity of approximately 40–60 µS/cm, ensuring sufficient purity for chemical and bioanalytical studies. For HPLC-MS analysis, HPLC-grade acetonitrile and formic acid were obtained from J.T. BakerTM (Temixco, Morelos, Mexico). The standard gallic acid and catechin were obtained from Sigma-Aldrich.
2.2. Conditioning of Raw Material
A local market in the city of Saltillo, Coahuila, provided the pineapple peel. Then, waste was cut into small pieces, washed (sodium hypochlorite), and placed in containers and dried in an oven (Luzeren®, model WGL-65B, Shanghai, China) at 60 °C for 72 h. Once dried, the sample was ground in a blender to obtain a powder (>1 mm).
2.3. UAE for the Recovery of Phenolic Compounds Using BBH Experimental Design
The UAE process was performed in a BRANSON® 5510 DTH ultrasonic bath (Brookfield, CT, USA) with a fixed frequency of 40 kHz and a nominal power of 135 W, with temperature control and a capacity of 5.7 L. Volumes of 10 and 5 mL were used per test, resulting in an approximate power density of 13.5 and 27 W/mL respectively. No ultrasonic probe was used in this study. The selection of parameter ranges for UAE was based on preliminary trials and instrumental limitations. The extraction conditions were according to the two-level (low −1 and high +1) BHH experimental design with a total of eight treatments, as shown in Table 1. All treatments were performed in random order and in triplicate. The defined independent variables were the ratio (m/v), time (min), temperature (°C), and solvent concentration (ethanol %). The response variable was the amount of hydrolyzable and condensed polyphenols.

Table 1.
Condensed matrix of treatments for the recovery of phenolic compounds using a BHH design by UAE.
2.4. MAE for the Recovery of Phenolic Compounds Using BHH Experimental Design
The MAE was performed using a CEM® Discover-SP microwave reactor (Model 909150, Stallings, NC, USA) with a 10 mL borosilicate glass vessel in a closed configuration, equipped with an infrared sensor temperature control (20 or 40 °C depending on the treatment), and passive cooling at room temperature for 5 min between runs to avoid overheating. The selection of parameter ranges for MAE was based on preliminary trials and instrumental limitations. The extraction conditions were defined according to a two-level (low −1 and high +1) BHH experimental design with eight treatments, as shown in Table 2. All treatments were performed in random order and in triplicate. The independent variables were defined as follows: ratio (m/v), time (min), temperature (°C), solvent concentration (ethanol %), and power (W). As response variables, the amounts of hydrolyzable and condensed polyphenols were considered.
Table 2.
Condensed matrix of treatments for the recovery of phenolic compounds using a BHH design by MAE.
2.5. Quantification of Polyphenolic Compounds
Hydrolyzable polyphenols were determined according to the methodology described by Wang et al. [21], with some modifications. Briefly, 20 µL of the extract was placed in a microplate well, followed by the addition of 20 µL of Folin-Ciocalteu reagent, and the mixture was allowed to stand for 5 min. Then, 20 µL of sodium carbonate (0.01 M) was added and allowed to stand for 5 min. Finally, the mixture was diluted in 125 µL of distilled water and read at 750 nm using a microplate (Multiskan SkyHigh, Thermo Scientific, Waltham, MA, USA). The calculated values were obtained using a gallic acid calibration curve (0–500 ppm). The hydrolyzable polyphenols content is expressed in mg of gallic acid per g of dry pineapple peel.
Condensed polyphenols were determined according to the methodology described by Espitia-Hernández et al. [22], with some modifications. A solution of HCl-terbutanol was prepared in a ratio of 1:9 (10 mL of 37% HCl in 100 mL of terbutanol), and 70 mg of FeSO4·7H2O was added. Extract (200 µL) was added to 1.2 mL of HCl-butanol, covered from light, placed on a rack, and heated for one hour at 100 °C. After cooling at room temperature, 180 µL was taken from each tube and placed in a microplate well, and the absorbance was measured at 450 nm using a microplate (Multiskan SkyHigh, Thermo Scientific, Waltham, MA, USA). The values were calculated using a catechin calibration curve (0–4000 ppm). The condensed polyphenol content was expressed in mg of catechin per g of dry pineapple peel.
2.6. Identification of Polyphenolic Compounds by HPLC-MS
To determine the polyphenolic content of the extracts, they were filtered through a 0.45 µm nylon membrane, and 1.5 mL was transferred to a vial for chromatography. Identification was performed according to the methodology reported by De León-Medina et al. [23]. Analyses by reverse-phase high-performance liquid chromatography were performed on a Varian HPLC system, including an autosampler (Varian ProStar 410, Walnut Creek, CA, USA), a ternary pump (Varian ProStar 230I, Walnut Creek, CA, USA), and a PDA detector (Varian ProStar 330, Walnut Creek, CA, USA). Also, a liquid chromatograph ion trap mass spectrometer (Varian 500-MS IT Mass Spectrometer, Walnut Creek, CA, USA) equipped with an electrospray ion source was used. Samples (5 µL) were injected onto a previously equilibrated Denali C18 column (150 mm × 2.1 mm, 3 µm; Grace, Columbia, MD, USA) at 30 °C. The mobile phase consisted of water (with 0.1% formic acid, solvent A) and acetonitrile (solvent B) at a flow rate of 0.2 mL/min. The following gradient was applied for elution: initial, 3% B; 0–5 min, 9 % B linear; 5–15 min, 16% B linear; 15–45 min, 50% B linear. Data were collected and processed using the MS Workstation software (V 6.9).
2.7. Determination of Antioxidant Activity
The DPPH radical scavenging assay was conducted as described by Lasunon et al. [24], with slight modifications. Trolox was used as the standard, and calibration solutions were prepared at concentrations ranging from 0 to 200 ppm. The DPPH radical (Sigma Aldrich) has a working concentration of 60 µM in a methanolic solution. Sample preparation used 193 µL of DPPH-methanol solution and 7 µL of the sample; the reading blank used was methanol, and the control absorbance was of DPPH-methanol solution. The absorbance determination was at 540 nm using a microplate reader (Multiskan SkyHigh, Thermo Scientific, Waltham, MA, USA). The radical scavenging capacity (RSC) calculation was according to Equation (1):
where Ac is the control absorbance and Am is the sample absorbance.
The decolorization of the ABTS radical was performed by the methodology described by Valdés-García et al. [25], with some modifications. A standard solution was prepared at concentrations ranging from 0 to 200 ppm. Subsequently, a 7 mM ABTS (Sigma-Aldrich) solution was prepared by mixing it with a K2S2O8 solution until the latter had a concentration of 2.45 mM. The samples were allowed to stand in the dark at room temperature for 12 h. In a microplate well, ABTS solution (193 µL) plus the sample (7 µL) were placed. The reading blank was ethanol, and the control absorbance was ABTS-ethanol. The absorbance determination was at 734 nm using a microplate reader (Multiskan SkyHigh, Thermo Scientific, Waltham, MA, USA). The results were calculated according to Equation (1).
The ferric reducing antioxidant power (FRAP) method was performed according to Sanahuja et al. [26], with some modifications. The FRAP reagent was prepared daily and maintained at 37 °C by mixing acetate buffer (0.3 M, pH 3.6) with a 10 mM solution of TPTZ (Sigma-Aldrich) in 40 mM HCl and a 20 mM solution of FeCl3·6H2O in a 10:1:1 ratio. Assay solutions were prepared by mixing 180 μL of FRAP reagent with 24 μL of a 3:1 water/sample mixture. The absorbance wavelength was determined at 593 nm using a microplate reader (Multiskan SkyHigh, Thermo Scientific, Waltham, MA, USA).
2.8. Statistical Analysis
All treatments were performed in triplicate. A one-way ANOVA test was performed to determine the statistical significance of differences in mean values; p < 0.05 was considered statistically significant using InfoStat software version 2020. The interpretation of the results and the construction of the contour plot were determined using the statistical package STATISTIC version 7.0.
3. Results and Discussion
3.1. Analysis of Polyphenol Extraction Using UAE
The concentration of condensed and hydrolyzable polyphenols for each treatment, as determined by the BHH experimental design, is shown in Figure 1. The results for the concentration of hydrolyzable polyphenols are in orange. Treatment 5 reached a concentration of 2.42 (mg/g), with no statistical differences with the other treatments. In contrast, the results for the concentration of condensed polyphenols are in blue. Treatment 3 reached a concentration of 323.82 (mg/g). Treatment 1 only reached a concentration of 61.48 (mg/g).
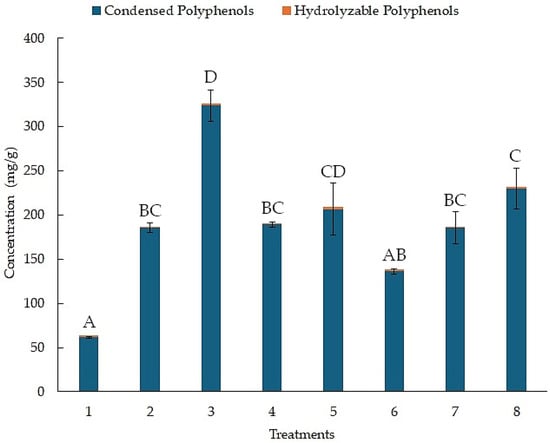
Figure 1.
Concentration of hydrolyzable and condensed polyphenols from the BHH experimental design using UAE. Different letters above bar plots indicate significant differences among treatments based on Tukey’s HSD test.
Compared to other research works, Zampar et al. [27] evaluated the UAE of phenolic compounds from pineapple peels using various solvents and operating conditions. Total polyphenol contents ranged from 2.75 to 4.06 mg/g, with the highest value obtained in the mixture of ethanol and acid solution. The authors concluded that using UAE is a promising strategy for extracting polyphenols (and other compounds) from pineapple by-products. Research work with pineapple peels is limited. In another study, the extraction of antioxidants (total phenols and flavonoids) from pineapple peels using UAE was investigated. The extraction time, ethanol concentration, and solution-peel ratio were evaluated. The results achieved yields of 1.254 mg/g of phenols and 0.55 mg/g of flavonoids, respectively. The authors concluded that pineapple peel is a valuable source of natural antioxidants with potential applications in the food and nutraceutical industries [28]. On the other hand, an evaluation was performed of seven types of deep eutectic solvents, in combination with UAE, for the polyphenol extraction from apple pomace. Among the seven deep eutectic solvents tested, DES-1 extracted the highest amount of polyphenols (9.97 mg/g) [29]. In another study, the yield optimization of polyphenols and the improvement of the antioxidant potential of extracts derived from the stem waste of Flammulina velutipes were demonstrated by the authors. They demonstrated that the yield of polyphenols obtained using nonionic surfactant-integrated ultrasound extraction was higher (≈approximately 12 mg/g) [30]. Additionally, the evaluation of the impact of pre-treatment methods (pulsed electric field and ultrasound) on the hot water extraction of polyphenols from willow bark was conducted. Some results demonstrated that ultrasound-pre-treated samples resulted in the highest total polyphenol content (46.20 mg/g). The authors concluded that combined methods (pulsed electric field and ultrasound) had effects on the extraction efficiency of polyphenols, which could be an interesting prospect for food, cosmetic, and pharmaceutical industries [31].
3.2. Effect of Independent Variables on Condensed Polyphenols by UAE
The contour plots of the independent variables on the extraction of condensed polyphenols are shown in Figure 2. Low concentrations of condensed polyphenols are present in a yellow-green color. In contrast, high concentrations of condensed polyphenols are colored orange-red. The interaction between time (min) and ratio (m/v) is shown in Figure 2A, indicating that high values of time (min) and low values of ratio (m/v) achieve the highest extraction of condensed polyphenols. The interaction between temperature (°C) and ratio (m/v) is shown in Figure 2B. We observed that temperature (°C) has no significant effect on the extraction of condensed polyphenols. However, at low levels of ratio (m/v), the greatest extraction of condensed polyphenols is achieved. Figure 2C illustrates the interaction between solvent concentration (%) and ratio (m/v), indicating that low solvent concentrations (%) and low ratios (m/v) achieve the highest extraction of condensed polyphenols. Table S1 shows the analysis of variance (ANOVA), which indicates that the (m/v) ratio in the ultrasound process significantly influenced (p < 0.05) the yield of condensed polyphenols, although the coefficient of determination was low, indicating that other variables or interactions not considered may affect the process.
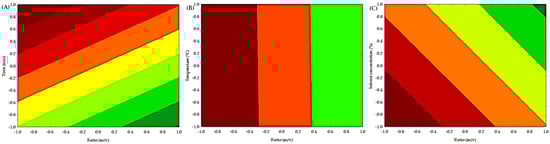
Figure 2.
Contour plot of the independent factors for obtaining condensed polyphenols by UAE. (A) Effect of time (min) and ratio (m/v) on the extraction of condensed polyphenols. (B) Effect of temperature (°C) and ratio (m/v) on the extraction of condensed polyphenols. (C) Effect of solvent concentration (%) and ratio (m/v) on the extraction of condensed polyphenols.
Some authors explain that the high temperature increases the kinetic energy of the deep eutectic solvent’s molecules, which decreases the viscosity and enhances the interaction of the solvent with the solid particles, thus improving the extraction efficiency [32]. Furthermore, the elevated temperature reduces physical adsorption and chemical interaction, thereby accelerating the movement of polyphenols and solvent molecules, and ultimately improving extraction proficiency [33]. On the other hand, some authors explain that the addition of ethanol increases the polarity of the solution, which makes it easier to extract polyphenols with similar polarity [34]. Some authors suggest that the presence of ethanol creates a concentration gradient, depending on the amount of ethanol, which promotes the solvent’s diffusion into the solute and thus enhances mass transfer. Water helps to swell the solute, while ethanol disrupts the bonding between the solute and the substrate matrix [35].
3.3. Analysis of Polyphenol Extraction Using MAE
Figure 3 shows the concentration of condensed and hydrolyzable polyphenols for each treatment, as determined by the BHH experimental design. The results for the concentration of hydrolyzable polyphenols are in orange. Treatment 8 reached a concentration of 2.09 (mg/g). In contrast, the results for the concentration of condensed polyphenols are in blue. Treatment 6 reached a concentration of 183.01 (mg/g). Treatment 1 only reached a concentration of 19.32 (mg/g).
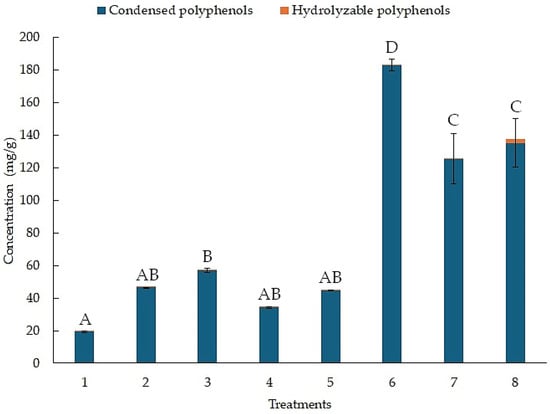
Figure 3.
Concentration of hydrolyzable and condensed polyphenols from the BHH experimental design using MAE. Different letters above bar plots indicate significant differences among treatments based on Tukey’s HSD test.
In similar studies, operating parameters in the microwave process, such as extraction solid: solvent, type of solvent, and microwave power level towards extraction yield (polyphenols) in the pineapple peels were investigated. The results of flavonoids were 362 mg/g for ethanol and 158.28 mg/g for distilled water in the extraction (1:2). The authors concluded that the MAE could reduce the time required for conventional extraction, producing a higher yield (polyphenols), and lowering production costs [36]. Bansod et al. [20] reported a microwave process condition that yields the highest amount of bioactive compounds (polyphenols) from pineapple peel waste. The maximum polyphenol content was 365.00 mg/g, and the minimum observed was 154.00 mg/g. The authors concluded that MAE can be considered a favorable technology for extracting bioactive compounds, yielding better results. In another study, the recovery of polyphenols by MAE was mentioned. The optimal conditions for achieving the highest polyphenol yield (207.72 mg/g) involved operating at 60 °C with 750 W of microwave power for 20 min, using a 50% ethanol solution in deionized water as the solvent [8]. Furthermore, the total phenolic and flavonoid contents, as well as the antioxidant properties, of pineapple peel extracted using various polar and nonpolar solvents were quantified using MAE. The main results showed that the highest value of total polyphenols was found in the methanolic extract at 15.25 mg GAE/g. The highest flavonoid content was found in water at 11.18 mg QE/g [37].
3.4. Effect of Independent Variables on the Condensed Polyphenols by MAE
Figure 4 shows the contour plots of the independent variables on the extraction of condensed polyphenols. Low concentrations of condensed polyphenols are present in a yellow-green color. In contrast, high concentrations of condensed polyphenols are in orange-red. Figure 4A illustrates the interaction between power (W) and time (min), indicating that high power values (W) and longtime durations (min) result in the highest extraction of condensed polyphenols. Figure 4B illustrates the interaction between the ratio (m/v) and time (min), indicating that high values of ratio (m/v) and time (min) result in the highest extraction of condensed polyphenols. Figure 4C illustrates the interaction between temperature (°C) and time (min), indicating that low temperatures (°C) and long times (min) yield the highest extraction of condensed polyphenols. Finally, Figure 4D shows the interaction between solvent (%) and time (min), indicating that high values of solvent (%) and high values of time (min) achieve the highest extraction of condensed polyphenols. Table S2 shows the analysis of variance (ANOVA), which indicates that time (min) in the microwave process significantly influenced (p < 0.05) the yield of condensed polyphenols, although the coefficient of determination was low, indicating that other variables or interactions not considered may affect the process.
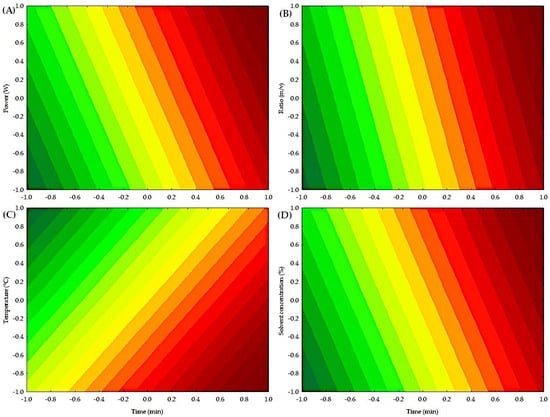
Figure 4.
Contour plot of the independent factors for obtaining condensed polyphenols by MAE. (A) Effect of power (W) and time (min) on the extraction of condensed polyphenols. (B) Effect of ratio (m/v) and time (min) on the extraction of condensed polyphenols. (C) Effect of temperature (°C) and time (min) on the extraction of condensed polyphenols. (D) Effect of solvent concentration (%) and time (min) on the extraction of condensed polyphenols.
Time and temperature were the variables that most significantly influenced the microwave process for extracting condensed polyphenols. Vargas-Serna et al. [38] explained that irradiation time increases cell membrane breakdown and decreases the viscosity of deep eutectic solvents, thereby enhancing the interaction between the solvent and phenolic compounds and improving the extraction process. The literature on the use of microwaves with pineapple peels is limited. However, some reported research is that Shijarath et al. [39] mentioned that time plays a vital role in the extraction process, as extended treatment times result in increased rupture of peel cell walls, thereby releasing more phenolic components into the surrounding solvent. On the other hand, some authors mentioned that higher extraction temperatures, when using water as the solvent, can enhance the dielectric properties of the plant material, resulting in improved extraction performance [40].
3.5. Identification of the Main Polyphenols Using HPLC-MS
The best ultrasound and microwave extracts (treatments 3 and 6, respectively) were subjected to identification of the main phenolic compounds by HPLC-MS, as shown in Table 3. The major compound using UAE and MAE was 1-caffeoylquinic acid and caffeic acid 4-O-glucoside, respectively. The chromatograms of UAE treatment 3 and MAE treatment 6 are presented in Figure S1. Similar compounds have been reported in pineapple peels. For example, Campos et al. [41] successfully identified several phenolic compounds, including chlorogenic acid, caffeic acid, and ferulic acid, which belong to the family of hydroxycinnamic acids. Maia and Fasolin [42] reported that the main phenolic compounds identified in pineapple waste obtained through extraction techniques were caffeic acid and ferulic acid. These molecules have already been reported in the literature as one of the main compounds present in pineapple waste.
Table 3.
Identification of the main phenolic compounds by HPLC-MS of the best treatments obtained using UAE and MAE.
It is worth noting that 1-Caffeoylquinic acid is an acid with biological properties. The chemical structure, rich in hydroxyl groups, in the molecule exhibits anti-inflammatory, antimicrobial, and antioxidant activity [44].
3.6. Antioxidant Activity of the Best Treatments Using UAE and MAE
The antioxidant activity of pineapple peel subjected to UAE and MAE is shown in Table 4. These results are similar to those obtained by Azizan et al. [45], who reported that the percentage of inhibition of MD2 pineapple peel, crown, and core extracts varied from 30.13% to 75.57%. Mentioned that the chemical structure and spatial conformation of the phenolic compounds, which determine the availability of the hydroxyl group to react with the free radical, are important in evaluating their antioxidant potential.
Table 4.
Antioxidant activity of the treatments 3 and 6 using UAE and MAE.
On the other hand, Lourenço et al. [46] evaluated the recovery of antioxidant compounds from pineapple peel using environmentally friendly and low-cost techniques. The results demonstrated that the extraction temperature had a significant effect on the phenolic content, as measured by the antioxidant activity evaluated by the DPPH method. Fernandes et al. [47] demonstrated the extraction of phenolic compounds from several agro-food industry by-products, and the determination of their antioxidant activity. The authors concluded that the extracts may have potential applications in the cosmetic, pharmaceutical, and food industries. Depending on the application, different extraction types and conditions may be required, which warrants further investigation. Finally, although UAE resulted in higher yields of phenolic compounds, MAE exhibited greater antioxidant activity, possibly due to the nature of the extracted compounds. The microwave process favors the extraction of low-molecular-weight phenolic acids and flavonoids with high radical-scavenging capacity [48], whereas the ultrasound process primarily extracts high-molecular-weight condensed tannins with lower radical efficiency per mole of compound [49]. Furthermore, microwave processing conditions can induce the partial depolymerization of phenolic compounds, generating smaller fractions with higher antioxidant activity [50]. These factors explain the observed differences between the phenolic compound yield and antioxidant activity in both methods.
4. Conclusions
The study validated UAE and MAE as eco-friendly and effective approaches for extracting phenolic compounds from pineapple peel. UAE yielded higher amounts of condensed polyphenols, while MAE samples demonstrated superior antioxidant activity. The identification of key phenolics, particularly 1-caffeoylquinic acid, supports the biofunctional potential of these extracts. The influence of operational parameters such as extraction time, solid-to-solvent ratio, and ethanol concentration was evident, emphasizing the importance of process optimization. These results confirm that pineapple peel, a widely available agro-industrial by-product, can be valorized as a sustainable source of antioxidant compounds. This approach not only contributes to waste reduction but also offers potential for application in the food, pharmaceutical, and cosmetic industries. Further studies on scale-up, compound stability, and bioactivity in complex systems are necessary to advance the practical implementation of these extraction methods.
Supplementary Materials
The following supporting information can be downloaded at: https://www.mdpi.com/article/10.3390/pr13082500/s1, Figure S1: HPLC chromatograms. (A) Treatment 3 with UAE: 1. 1-Caffeoylquinic acid, 2. p-Coumaric acid 4-O-glucoside, 3. Gardenin B. (B) Treatment 6 with MAE: 1. Caffeic acid 4-O-glucoside, 2. 1-Caffeoylquinic acid, 3. Caffeoyl tartaric acid, 4. Quercetin 3-O-rutinoside; Table S1: Analysis of variance (ANOVA) of the factors affecting the ultrasound process; Table S2: Analysis of variance (ANOVA) of the factors affecting the microwave process.
Author Contributions
Conceptualization, A.D.C.-R. and L.S.-T.; methodology, A.D.C.-R. and J.A.A.-V.; formal analysis, L.S.-T.; investigation, A.D.C.-R., L.S.-T. and J.A.A.-V.; resources, A.S.-G. and T.K.M.-M.; writing—original draft preparation, A.D.C.-R. and L.S.-T.; writing—review and editing, L.S.-T., J.A.A.-V. and N.P.M.-R.; supervision, S.A.C.C. and D.W.G.-M. All authors have read and agreed to the published version of the manuscript.
Funding
This research received no external funding.
Data Availability Statement
The original contributions presented in this study are in the article. Further inquiries can be made to the corresponding author.
Acknowledgments
A.D.C.-R. thanks the SECIHTI for the scholarship granted to develop a doctoral program. The authors thank the Autonomous University of Coahuila for the facilities provided.
Conflicts of Interest
The authors declare that they have no conflicts of interest.
References
- FAO. Available online: https://www.fao.org/faostat/en/#home (accessed on 14 June 2025).
- Polanía, A.M.; Londoño, L.; Ramírez, C.; Bolivar, G.; Aguilar, C.N. Valorization of Pineapple Waste as Novel Source of Nutraceuticals and Biofunctional Compounds. Biomass Convers. Biorefin. 2023, 13, 3593–3618. [Google Scholar] [CrossRef]
- Aili Hamzah, A.F.; Hamzah, M.H.; Che Man, H.; Jamali, N.S.; Siajam, S.I.; Ismail, M.H. Recent Updates on the Conversion of Pineapple Waste (Ananas comosus) to Value-Added Products, Future Perspectives and Challenges. Agronomy 2021, 11, 2221. [Google Scholar] [CrossRef]
- García-De la Cruz, R.; García-López, E. Combined Effects of Cover Crops and Herbicide Rotation as Proactive Weed Management in Pineapple (Ananas comosus L. Merr) in Huimanguillo, Tabasco, Mexico. Agro Product. 2021, 14, 97–108. [Google Scholar] [CrossRef]
- Uresti Gil, J.; Vélez-Izquierdo, A.; Espinosa-García, J.A.; Jolalpa-Barrera, J.L.; Rangel-Quintos, J.; Uresti-Duran, D. Technical-Economic Study to Identify Areas with Potential to Produce Pineapple in the Humid Tropics of Mexico. Rev. Mex. Cienc. Agric 2020, 11, 1619–1632. [Google Scholar] [CrossRef]
- Sánchez-Hernández, M.A.; Huja-Mendoza, S.; Acevedo-Gómez, R. Ciencias de la Biología y Agronomía. Handbook T-I, 1st ed.; Universidad del Papaloapan: Loma Bonita, Oaxaca, Mexico, 2015; pp. 100–110. [Google Scholar]
- Torres-Avila, A.; Aguilar-Ávila, J.; Santoyo-Cortés, V.H.; Martínez-González, E.G.; Aguilar-Gallegos, N. Innovation in the Pineapple Value Chain in Mexico: Explaining the Global Adoption Process of the MD-2 Hybrid. Agric. Syst. 2022, 198, 103386. [Google Scholar] [CrossRef]
- Roselli, V.; Pugliese, G.; Leuci, R.; Brunetti, L.; Gambacorta, L.; Tufarelli, V.; Piemontese, L. Green Methods to Recover Bioactive Compounds from Food Industry Waste: A Sustainable Practice from the Perspective of the Circular Economy. Molecules 2024, 29, 2682. [Google Scholar] [CrossRef]
- Chaudhary, V.; Kumar, V.; Sunil, V.; Singh, K.; Kumar, R.; Kumar, V. Pineapple (Ananas cosmosus) Product Processing: A Review. J. Pharmacogn. Phytochem. 2019, 8, 4642–4652. [Google Scholar]
- Kumar, A. Utilization of bioactive components present in pineapple waste: A review. J. Pharm. Innov. 2021, 10, 954–961. [Google Scholar]
- Abraham, R.A.; Joshi, T.J.; Abdullah, S. A Comprehensive Review of Pineapple Processing and its By-Product Valorization in India. Food Chem. Adv. 2023, 3, 100416. [Google Scholar] [CrossRef]
- Mohd, A.M.; Hashim, N.; Aziz, S.A.; Lasekan, O. Pineapple (Ananas comosus): A Comprehensive Review of Nutritional Values, Volatile Compounds, Health Benefits, and Potential Food Products. Food Res. Int. 2020, 137, 109675. [Google Scholar] [CrossRef] [PubMed]
- Palos-Hernández, A.; González-Paramás, A.M.; Santos-Buelga, C. Latest Advances in Green Extraction of Polyphenols from Plants, Foods and Food By-Products. Molecules 2025, 30, 55. [Google Scholar] [CrossRef]
- Garcia-Vaquero, M.; Ravindran, R.; Walsh, O.; O’Doherty, J.; Jaiswal, A.K.; Tiwari, B.K.; Rajauria, G. Evaluation of Ultrasound, Microwave, Ultrasound–Microwave, Hydrothermal and High Pressure Assisted Extraction Technologies for the Recovery of Phytochemicals and Antioxidants from Brown Macroalgae. Mar. Drugs 2021, 19, 309. [Google Scholar] [CrossRef]
- Santos, T.R.J.; Santana, L.C.L.d.A. Conventional and Emerging Techniques for Extraction of Bioactive Compounds from Fruit Waste. Braz. J. Food Technol. 2022, 25, 1–18. [Google Scholar] [CrossRef]
- da Rocha, C.; Noreña, C. Microwave-Assisted Extraction and Ultrasound-Assisted Extraction of Bioactive Compounds from Grape Pomace. Int. J. Food Eng. 2020, 16, 20190191. [Google Scholar] [CrossRef]
- Caputo, L.; Quintieri, L.; Cavalluzzi, M.M.; Lentini, G.; Habtemariam, S. Antimicrobial and Antibiofilm Activities of Citrus Water-Extracts Obtained by Microwave-Assisted and Conventional Methods. Biomedicines 2018, 6, 70. [Google Scholar] [CrossRef] [PubMed]
- García-Villegas, A.; Rojas-García, A.; Villegas-Aguilar, M.d.C.; Fernández-Moreno, P.; Fernández-Ochoa, Á.; Cádiz-Gurrea, M.d.l.L.; Arráez-Román, D.; Segura-Carretero, A. Cosmeceutical Potential of Major Tropical and Subtropical Fruit By-Products for a Sustainable Revalorization. Antioxidants 2022, 11, 203. [Google Scholar] [CrossRef] [PubMed]
- Yahya, N.A.; Wahab, R.A.; Xine, T.L.S.; Hamid, M.A. Ultrasound-Assisted Extraction of Polyphenols from Pineapple Skin. AIP Conf. Proc. 2019, 2155, 020002. [Google Scholar] [CrossRef]
- Bansod, S.P.; Parikh, J.K.; Sarangi, P.K. Pineapple Peel Waste Valorization for Extraction of Bio-Active Compounds and Protein: Microwave Assisted Method and Box Behnken Design Optimization. Environ. Res. 2023, 221, 115237. [Google Scholar] [CrossRef]
- Wang, J.; Ren, B.; Bak, K.H.; Soladoye, O.P.; Gagaoua, M.; Ruiz-Carrascal, J.; Huang, Y.; Zhao, Z.; Zhao, Y.; Fu, Y.; et al. Preservative effects of composite biopreservatives on goat meat during chilled storage: Insights into meat quality, high-throughput sequencing and molecular docking. LWT 2023, 184, 115033. [Google Scholar] [CrossRef]
- Espitia-Hernández, P.; Ruelas-Chacón, X.; Chávez-González, M.L.; Ascacio-Valdés, J.A.; Flores-Naveda, A.; Sepúlveda-Torre, L. Solid-State Fermentation of Sorghum by Aspergillus oryzae and Aspergillus niger: Effects on Tannin Content, Phenolic Profile, and Antioxidant Activity. Foods 2022, 11, 3121. [Google Scholar] [CrossRef]
- De León-Medina, J.C.; Sepúlveda, L.; Buenrostro-Figueroa, J.J.; Mata-Gómez, M.A.; Flores-Gallegos, A.C.; Rodríguez-Herrera, R.; Aguilar, C.N.; Ascacio-Valdes, J.A. Production and Evaluation of Ellagitannase Activity Using a Pure Geraniin Substrate. Food Bioprod. Process. 2025, 149, 112–117. [Google Scholar] [CrossRef]
- Lasunon, P.; Phonkerd, N.; Tettawong, P.; Sengkhamparn, N. Total Phenolic Compound and its Antioxidant Activity of By-Product from Pineapple. Food Res. 2022, 6, 107–112. [Google Scholar] [CrossRef]
- Valdés García, A.; Domingo Martínez, M.I.; Ponce Landete, M.; Prats Moya, M.S.; Beltrán Sanahuja, A. Potential of Industrial Pineapple (Ananas comosus (L.) Merrill) By-Products as Aromatic and Antioxidant Sources. Antioxidants 2021, 10, 1767. [Google Scholar] [CrossRef]
- Sanahuja, A.B.; García, A.V.; Baenas, N.; Ferrando, B.O.; Periago, M.J.; Alonso, N.C.; Sánchez, R.; Todolí, J.L. Valorization of Pineapple Core Waste for Sequential Extraction of Phenolic Compounds and Carotenoids: Optimization Through Ultrasound-Assisted Method and Box–Behnken Design. Food Bioprocess Technol. 2025, 18, 2618–2631. [Google Scholar] [CrossRef]
- Zampar, G.G.; Zampar, I.C.; de Souza, S.B.S.; da Silva, C.; Barros, B.C.B. Effect of Solvent Mixtures on the Ultrasound-Assisted Extraction of Compounds from Pineapple By-Product. Food Biosci. 2022, 50, 102098. [Google Scholar] [CrossRef]
- Liu, S.-H.; Liu, Y.-G.; Zhang, X.-M. Extraction conditions and antioxidant activities of the extract of pineapple peel by ultrasonic. IOP Conf. Ser. Earth Environ. Sci. 2018, 186, 1–6. Available online: https://iopscience.iop.org/article/10.1088/1755-1315/186/4/012038/pdf (accessed on 3 August 2025). [CrossRef]
- Wang, H.; Deng, M.; Zhang, Z.; Zhang, J.; Wu, K.; Feng, J.; Li, S.; Tong, Y.W. Ultrasound-Assisted Extraction of Polyphenols from Apple Pomace Using Choline Chloride-Oxalic Acid Deep Eutectic Solvent: Characterization, Reusability, and Molecular Dynamics Simulation. Microchem. J. 2025, 214, 114149. [Google Scholar] [CrossRef]
- Huo, H.; Bao, H.; Yin, H. Optimization of Bioactive Polyphenols Recovery from Flammulina velutipes Stem Waste Using Nonionic Surfactant-Integrated Ultrasound-Assisted Extraction. Ultrason. Sonochem. 2025, 119, 107408. [Google Scholar] [CrossRef]
- Zheng, L.; Pedrós-Garrido, S.; Lyng, J.G.; Jacquier, J.C.; Harbourne, N. A Comparative Study of Pulsed Electric Field, Ultrasound, Milling, and Soaking as Pre-Treatments for Assistance in the Extraction of Polyphenols from Willow Bark (Salix alba). J. Appl. Res. Med. Aromat. Plants 2024, 43, 100591. [Google Scholar] [CrossRef]
- Zhang, S.; Tan, T.; Wang, J.; Ma, T.; Li, T. Green Extraction of Polyphenols from Pomegranate Seeds by Ultrasound-Assisted Deep Eutectic Solvent Extraction: Optimization and Bioactivity. Sustain. Chem. Pharm. 2024, 41, 101710. [Google Scholar] [CrossRef]
- Che, H.; Zhang, R.; Wang, X.; Yu, H.; Shi, X.; Yi, J.; Li, J.; Qi, Q.; Dong, R.; Li, Q. Ultrasound-Assisted Extraction of Polyphenols from Phyllanthi fructus: Comprehensive Insights from Extraction Optimization and Antioxidant Activity. Ultrason. Sonochem. 2024, 111, 107083. [Google Scholar] [CrossRef]
- Tan, M.-J.; Li, Y.; Zhao, S.-Q.; Yue, F.-H.; Cai, D.-J.; Wu, J.-T.; Zeng, X.-A.; Li, J.; Han, Z. Synergistic Ultrasound Pulsed Electric Field Extraction of Litchi Peel Polyphenols and Determination of Their Properties. Int. J. Biol. Macromol. 2024, 260, 129613. [Google Scholar] [CrossRef]
- Zhang, S.; Xie, H.; Huang, J.; Chen, Q.; Li, X.; Chen, X.; Liang, J.; Wang, L. Ultrasound-Assisted Extraction of Polyphenols from Pine Needles (Pinus elliottii): Comprehensive Insights from RSM Optimization, Antioxidant Activity, UHPLC-Q-Exactive Orbitrap MS/MS Analysis and Kinetic Model. Ultrason. Sonochem. 2024, 102, 106742. [Google Scholar] [CrossRef]
- Harith, N.S.; Rahman, N.A.; Zamanhuri, N.A.; Hashib, S.A. Microwave-Based Antioxidant Extraction from Pineapple Peel Waste. Mater. Today Proc. 2023, 87, 126–131. [Google Scholar] [CrossRef]
- Deo, S.K.; Sakhale, B.K. Studies of Different Solvents on Total Phenolic, Flavonoid Content, and Antioxidant Activities of Peel Extracts of Pineapple Peel Var. Jaldhup. Annals. Food Sci. Technol. 2023, 24, 14. [Google Scholar]
- Vargas-Serna, C.L.; Ochoa-Martínez, C.I.; Vélez-Pasos, C. Microwave-Assisted Extraction of Phenolic Compounds from Pineapple Peel Using Deep Eutectic Solvents. Horticulturae 2022, 8, 791. [Google Scholar] [CrossRef]
- Shijarath, T.R.; Madhu, G.; Sahoo, D.K.; Abdullah, S. Microwave Assisted Aqueous Extraction of Phenolic Compounds From Pomegranate and Banana Peels: Process Modelling and Optimization. Food Humanit. 2024, 3, 100456. [Google Scholar] [CrossRef]
- Gamarra-Castillo, O.; Hernández-Carrión, M.; Sánchez-Camargo, A.d.P. Revalorization of Purple Passion Fruit Peel: Compositional Analysis, Anthocyanin Microwave-Assisted Extraction, and Beverage Application. Future Foods 2025, 11, 100536. [Google Scholar] [CrossRef]
- Campos, D.A.; Ribeiro, T.B.; Teixeira, J.A.; Pastrana, L.; Pintado, M.M. Integral Valorization of Pineapple (Ananas comosus L.) By-Products through a Green Chemistry Approach towards Added Value Ingredients. Foods 2020, 9, 60. [Google Scholar] [CrossRef] [PubMed]
- Maia, F.d.A.; Fasolin, L.H. Recovery of Bioactive Compounds from Pineapple Waste Through High-Pressure Technologies. J. Supercrit. Fluids 2025, 218, 106455. [Google Scholar] [CrossRef]
- PubChem. Available online: https://pubchem.ncbi.nlm.nih.gov (accessed on 22 June 2025).
- Chen, X.; Li, L.; Zhu, W.; Teng, Y.; Qiu, Z.; Ji, W.; Zheng, Z.; Gong, J. Fabrication of Caffeoylquinic Acid-Loaded Burdock Polysaccharide Nanoparticles and Their Antioxidant Activity in Hydrogen Peroxide-Damaged Heparg Cells. Food Chem. X 2024, 22, 101293. [Google Scholar] [CrossRef]
- Azizan, A.; Lee, A.X.; Abdul Hamid, N.A.; Maulidiani, M.; Mediani, A.; Abdul Ghafar, S.Z.; Zolkeflee, N.K.Z.; Abas, F. Potentially Bioactive Metabolites from Pineapple Waste Extracts and Their Antioxidant and α-Glucosidase Inhibitory Activities by 1H NMR. Foods 2020, 9, 173. [Google Scholar] [CrossRef]
- Lourenço, S.C.; Campos, D.A.; Gómez-García, R.; Pintado, M.; Oliveira, M.C.; Santos, D.I.; Corrêa-Filho, L.C.; Moldão-Martins, M.; Alves, V.D. Optimization of Natural Antioxidants Extraction from Pineapple Peel and Their Stabilization by Spray Drying. Foods 2021, 10, 1255. [Google Scholar] [CrossRef] [PubMed]
- Fernandes, F.; Gorissen, K.; Delerue-Matos, C.; Grosso, C. Valorisation of Agro-Food By-Products for the Extraction of Phenolic Compounds. Biol. Life Sci. Forum 2022, 18, 61. [Google Scholar] [CrossRef]
- Tapia-Quirós, P.; Granados, M.; Sentellas, S.; Saurina, J. Microwave-Assisted Extraction with Natural Deep Eutectic Solvents for Polyphenol Recovery From Agrifood Waste: Mature for Scaling-Up? Sci. Total Environ. 2023, 912, 168716. [Google Scholar] [CrossRef] [PubMed]
- Shen, L.; Pang, S.; Zhong, M.; Sun, Y.; Qayum, A.; Liu, Y.; Rashid, A.; Xu, B.; Liang, Q.; Ma, H.; et al. A Comprehensive Review of Ultrasonic Assisted Extraction (UAE) for Bioactive Components: Principles, Advantages, Equipment, and Combined Technologies. Ultrason. Sonochem. 2023, 101, 106646. [Google Scholar] [CrossRef]
- Chy, M.W.R.; Ahmed, T.; Iftekhar, J.; Islam, M.Z.; Rana, M.R. Optimization of Microwave-Assisted Polyphenol Extraction and Antioxidant Activity from Papaya Peel Using Response Surface Methodology and Artificial Neural Network. Appl. Food Res. 2024, 4, 100591. [Google Scholar] [CrossRef]


Disclaimer/Publisher’s Note: The statements, opinions and data contained in all publications are solely those of the individual author(s) and contributor(s) and not of MDPI and/or the editor(s). MDPI and/or the editor(s) disclaim responsibility for any injury to people or property resulting from any ideas, methods, instructions or products referred to in the content. |
© 2025 by the authors. Licensee MDPI, Basel, Switzerland. This article is an open access article distributed under the terms and conditions of the Creative Commons Attribution (CC BY) license (https://creativecommons.org/licenses/by/4.0/).