1. Introduction
Fluidization is a technique whereby static solid-like materials are converted into fluid-like flowing materials by passing a fluid through the static bed of the material [
1]. The fluid can be either air, gas, or liquid [
1,
2,
3,
4]. The majority of industrial fluidized bed operations are performed using air as a fluidizing medium [
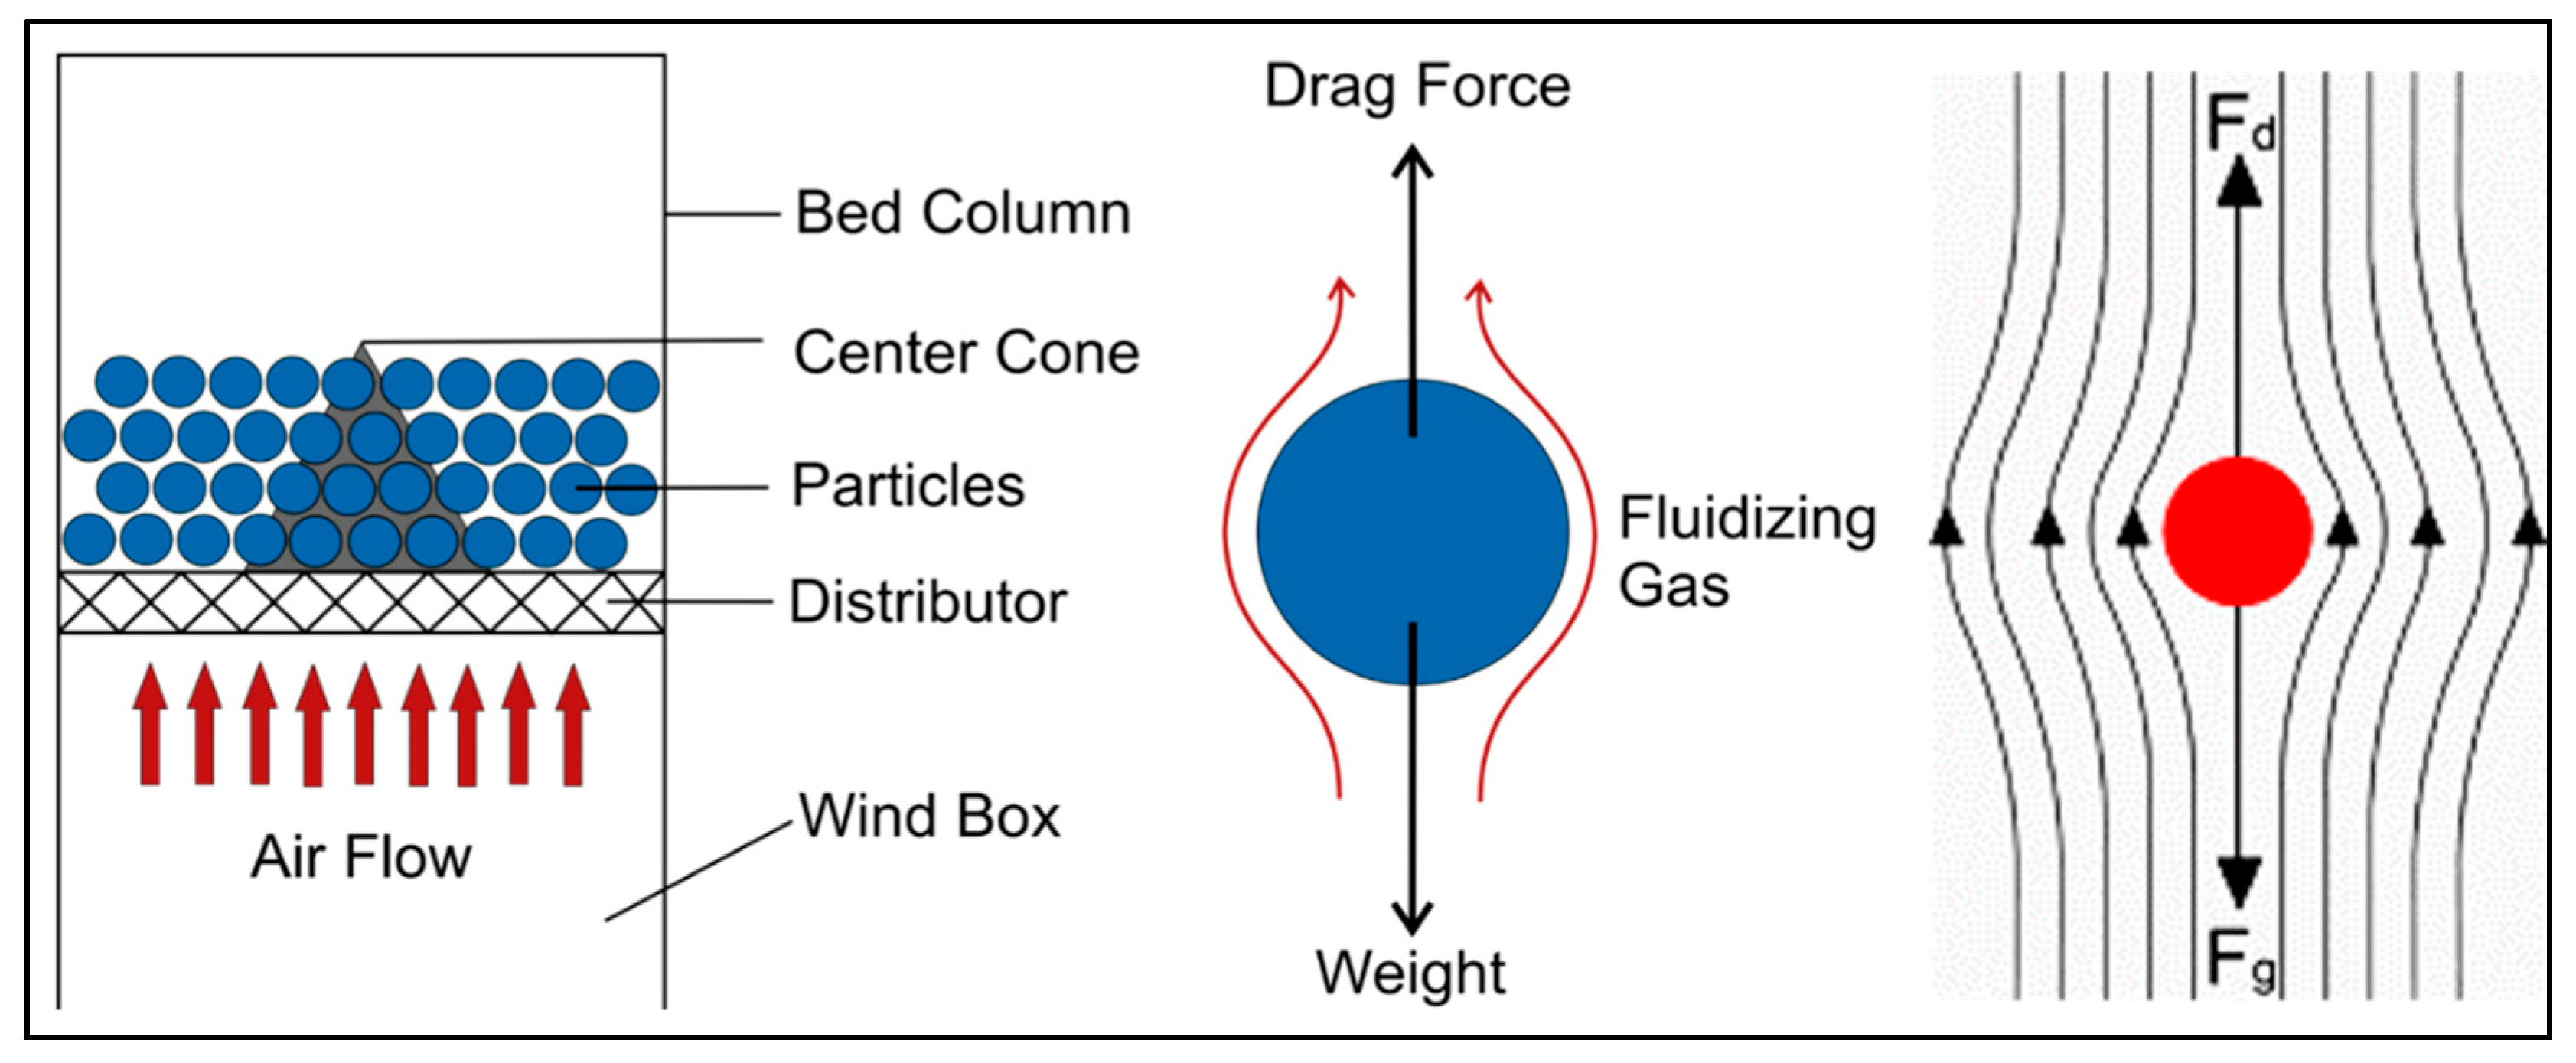
2]. As illustrated in
Figure 1, the upward flow of air from the plenum chamber into the distributor plate exerts a drag force on the settled bed material. With the gradual rise of upward air flow, the drag force on the material also grows and the settled bed begins to transform into the incipient regime of fluidization. The net force on the bed material is the sum of the upward force on the material and the net weight of the bed material. The net downward force needs to be zero to fluidize the bed material [
2]. When the magnitude of the drag force balances the weight of the bed material, the bed material reaches a state of weightlessness. The bed material in this state obeys all the degrees of freedom and acts as a fluid. The characteristics of such air-solid interactions are very useful in many industrial processes, such as the fast mixing of solids, the uniform distribution of temperature, continuous batch operations, and so forth [
3]. Once fluidization takes place, many chemical and mechanical processes become easy to carry out with enhanced efficiency [
4]. Fluidized beds have many uses in various industries. They are used to perform different chemical and mechanical processes. These processes, performed through a fluidized bed, have numerous advantages over conventional methods, including high process efficiency, flexible reaction assembly, uniform heat distribution, the ability to add or remove material continuously, better mixing of materials, easy transport of materials, the ability to work under higher temperatures and pressures, and so forth [
5].
Efforts to improve the working efficiency of fluidized beds have resulted in many designs, known as conventional fluidized bed designs. Conventional fluidized bed designs include centrifugal fluidized beds, circulating fluidized beds, spouted fluidized beds, tapered fluidized beds, and vibrofluidized beds [
6]. Conventional bed setups are used to carry out combustion, gasification of fuels, drying, heating and catalytic cracking, surface treatment, surface coating, and mass transfer [
2,
3,
7,
8,
9]. However, the major drawbacks of conventional fluidized beds include the presence of moving parts, higher pressure drops across the air distributor, inefficient gas-solid mixing, inability to fluidize multisized particles, and complex hydrodynamics. Many new designs have evolved from conventional bed designs, one of which is the swirling fluidized bed (SFB). In an SFB, air enters the bed column from the plenum chamber through an air distributor. The distributor is designed in a way to provide a swirling motion to the bottom-up air flow. This characteristic difference of SFBs from conventional fluidized beds [
10] makes them superior to the available fluidized bed designs. Having no moving parts, SFBs can provide better heat and mass transfer efficiencies. Since the swirling motion is imparted to the fluidizing medium through an inclined air entry, lower pressure drops are needed to fluidize the settled beds as compared with conventional fluidized beds. With reduced energy inputs, SFB-based industrial processes can be more cost effective and efficient.
The most important part of any bed design is the air distributor that distributes the air in the bed and supports the bed material [
10]. Various air distributor designs have been developed by researchers [
10,
11,
12,
13,
14,
15]. The most popular variant is the annular blade distributor, first reported by Ouyang and Levenspiel [
14]. This design was further improved by Shu et al. [
16]. Paulose [
17] introduced three types of annular blade distributors, namely, a distributor with inclined holes, a single-row vane-type distributor, and a three-row vane-type distributor. The idea of a helical nozzle arrangement for introducing a swirling motion into the bed was presented by Aworinde [
18]. The effect of different parameters of the annular blade distributor on the fluidization quality of an SFB was investigated by Sulaiman et al. [
2]. Despite the above-discussed research reports, irregularities in pressure drops across the distributor and the limitations on particle sizes remain unaddressed issues of SFBs. Higher pressure drops require greater pumping power and increase the cost of the process. Similarly, the use of selective particle sizes may reduce the efficiency and applicability of the fluidized bed.
An SFB with an annular arrangement of blades is not preferred for processing materials of smaller dimensions. The high pressure drop and lower size limitations have motivated researchers to develop new air distributor designs. The mesh-coupled annular blade distributor is a design that has received little attention. In this design, a wire mesh is placed on top of the blade distributor. The wire mesh stops smaller particles from falling through the gaps between the blades without affecting the pressure drop. The particles that fall through can stick in the distributor and increase the pressure drop. Fine-sized particles can be fluidized using such a hybrid distributor design. This study aimed to investigate the effect of blade inclination angle, bed weight, and superficial air velocity on bed hydrodynamics by testing a hybrid design of an annular distributor.
2. Experimental Setup
The experimental setup of the present study consisted of a lab-scale SFB, a mesh-coupled annular air distributor, and an imaging apparatus.
Figure 2 shows the setup configuration schematically. The cylindrical bed column was 30 cm in diameter and 50 cm in height. The bed column was placed over a 35 cm long plenum. The air distributor, which is the main part of any bed configuration, was fabricated by putting a mesh of wire on top of an annular blade distributor. The pore size in the mesh was measured as 2.8 × 2.8 mm
2. A detailed distributor design is illustrated in
Figure 3. The blade inclination angles were chosen as 30°, 45°, 60°, 75°, and 90°. A solid cylinder of 15 cm in diameter was placed in the center of the annular distributor. The solid cylinder was used to minimize the particles’ clogging and formation of dead zones during fluidization. For pumping the air tangentially into the plenum chamber, a 6 kW air blower was used. A manometer and orifice plate were used to monitor the pressure across the bed. The minimum superficial air velocity was calculated using the pressure drop across the bed. For tangential air entry into the plenum, a tapered Polyvinyl chloride (PVC) pipe was used to connect the blower with the plenum. The tangential air entry eased the swirling operation.
The fluidization of the bed material was initiated by an upward flow of air through the settled bed. The swirling motion of the bed was ensured through tangential entry of air into the plenum chamber and the adjustment of the blade inclination angle. When fluidization initiates, the bed enters an incipient fluidization regime and the corresponding air velocity is called the minimum fluidization velocity. The calculation of fluidization velocity is based on the measurement of the pressure drop across the bed. In this study, spherical particles of plastic were used as the bed material. The particle size and density were measured as 6 mm and 1.77 g/cm3, respectively. The particles used were either black or white. The ratio of white to black particles was kept as 1:4. The minority white particles worked as tracer particles for particle image velocimetry (PIV) analysis in the dark background of black particles. Since white tracer particles provide good light reflection in a dark background, these particles were tracked to produce velocity vector fields.
Once the bed started fluidizing, a high-speed imaging device was used to visualize and record the movement of the bed material for each inclination angle. For high-quality imaging, the bed was illuminated from the top with a halogen bulb. The imaging was performed at a framerate of 1000 fps. PIV software was used to find the particles’ field of flow, trajectories, and average velocities. PIV was selected due to its easy-to-follow algorithm and ability to tolerate noise. Before PIV analysis, the bed images were converted into grayscale images through a binary image cross-correlation code. A set of successive images was analyzed by masking the unwanted sectors with a built-in masking option in the PIV software. The movement of tracer particles in a completely fluidized bed was realized by finding the highest similarity of velocity patterns in the interrogation windows. The interrogation areas were set to 64 × 64, 32 × 32, and 16 × 16 pixels in passes 1–3, respectively. A comparison between the interrogation windows of consecutive images gave the distance traveled by the particles during 1 ms. The traveled distance was divided by the time interval to obtain the particle velocity.
The experimental results were compared with a polynomial regression statistical model. The Response Surface Analysis (RSA) program was used to predict the bed velocity (BV) statistically. This program consists of a set of guidelines for estimating the relationship between different variables. It usually provides conditional expectation values of variables, for example, the average value of dependent variables when independent variables are fixed. In this program, the dependent and independent variables are selected manually. The descriptive statistical section of the program provided us maximum, minimum, and mean values of each variable. It also determined if the data fell within the limits or not. The optimum solution section provided the results of function optimization, which is the bed velocity in the present study.
3. Results and Discussions
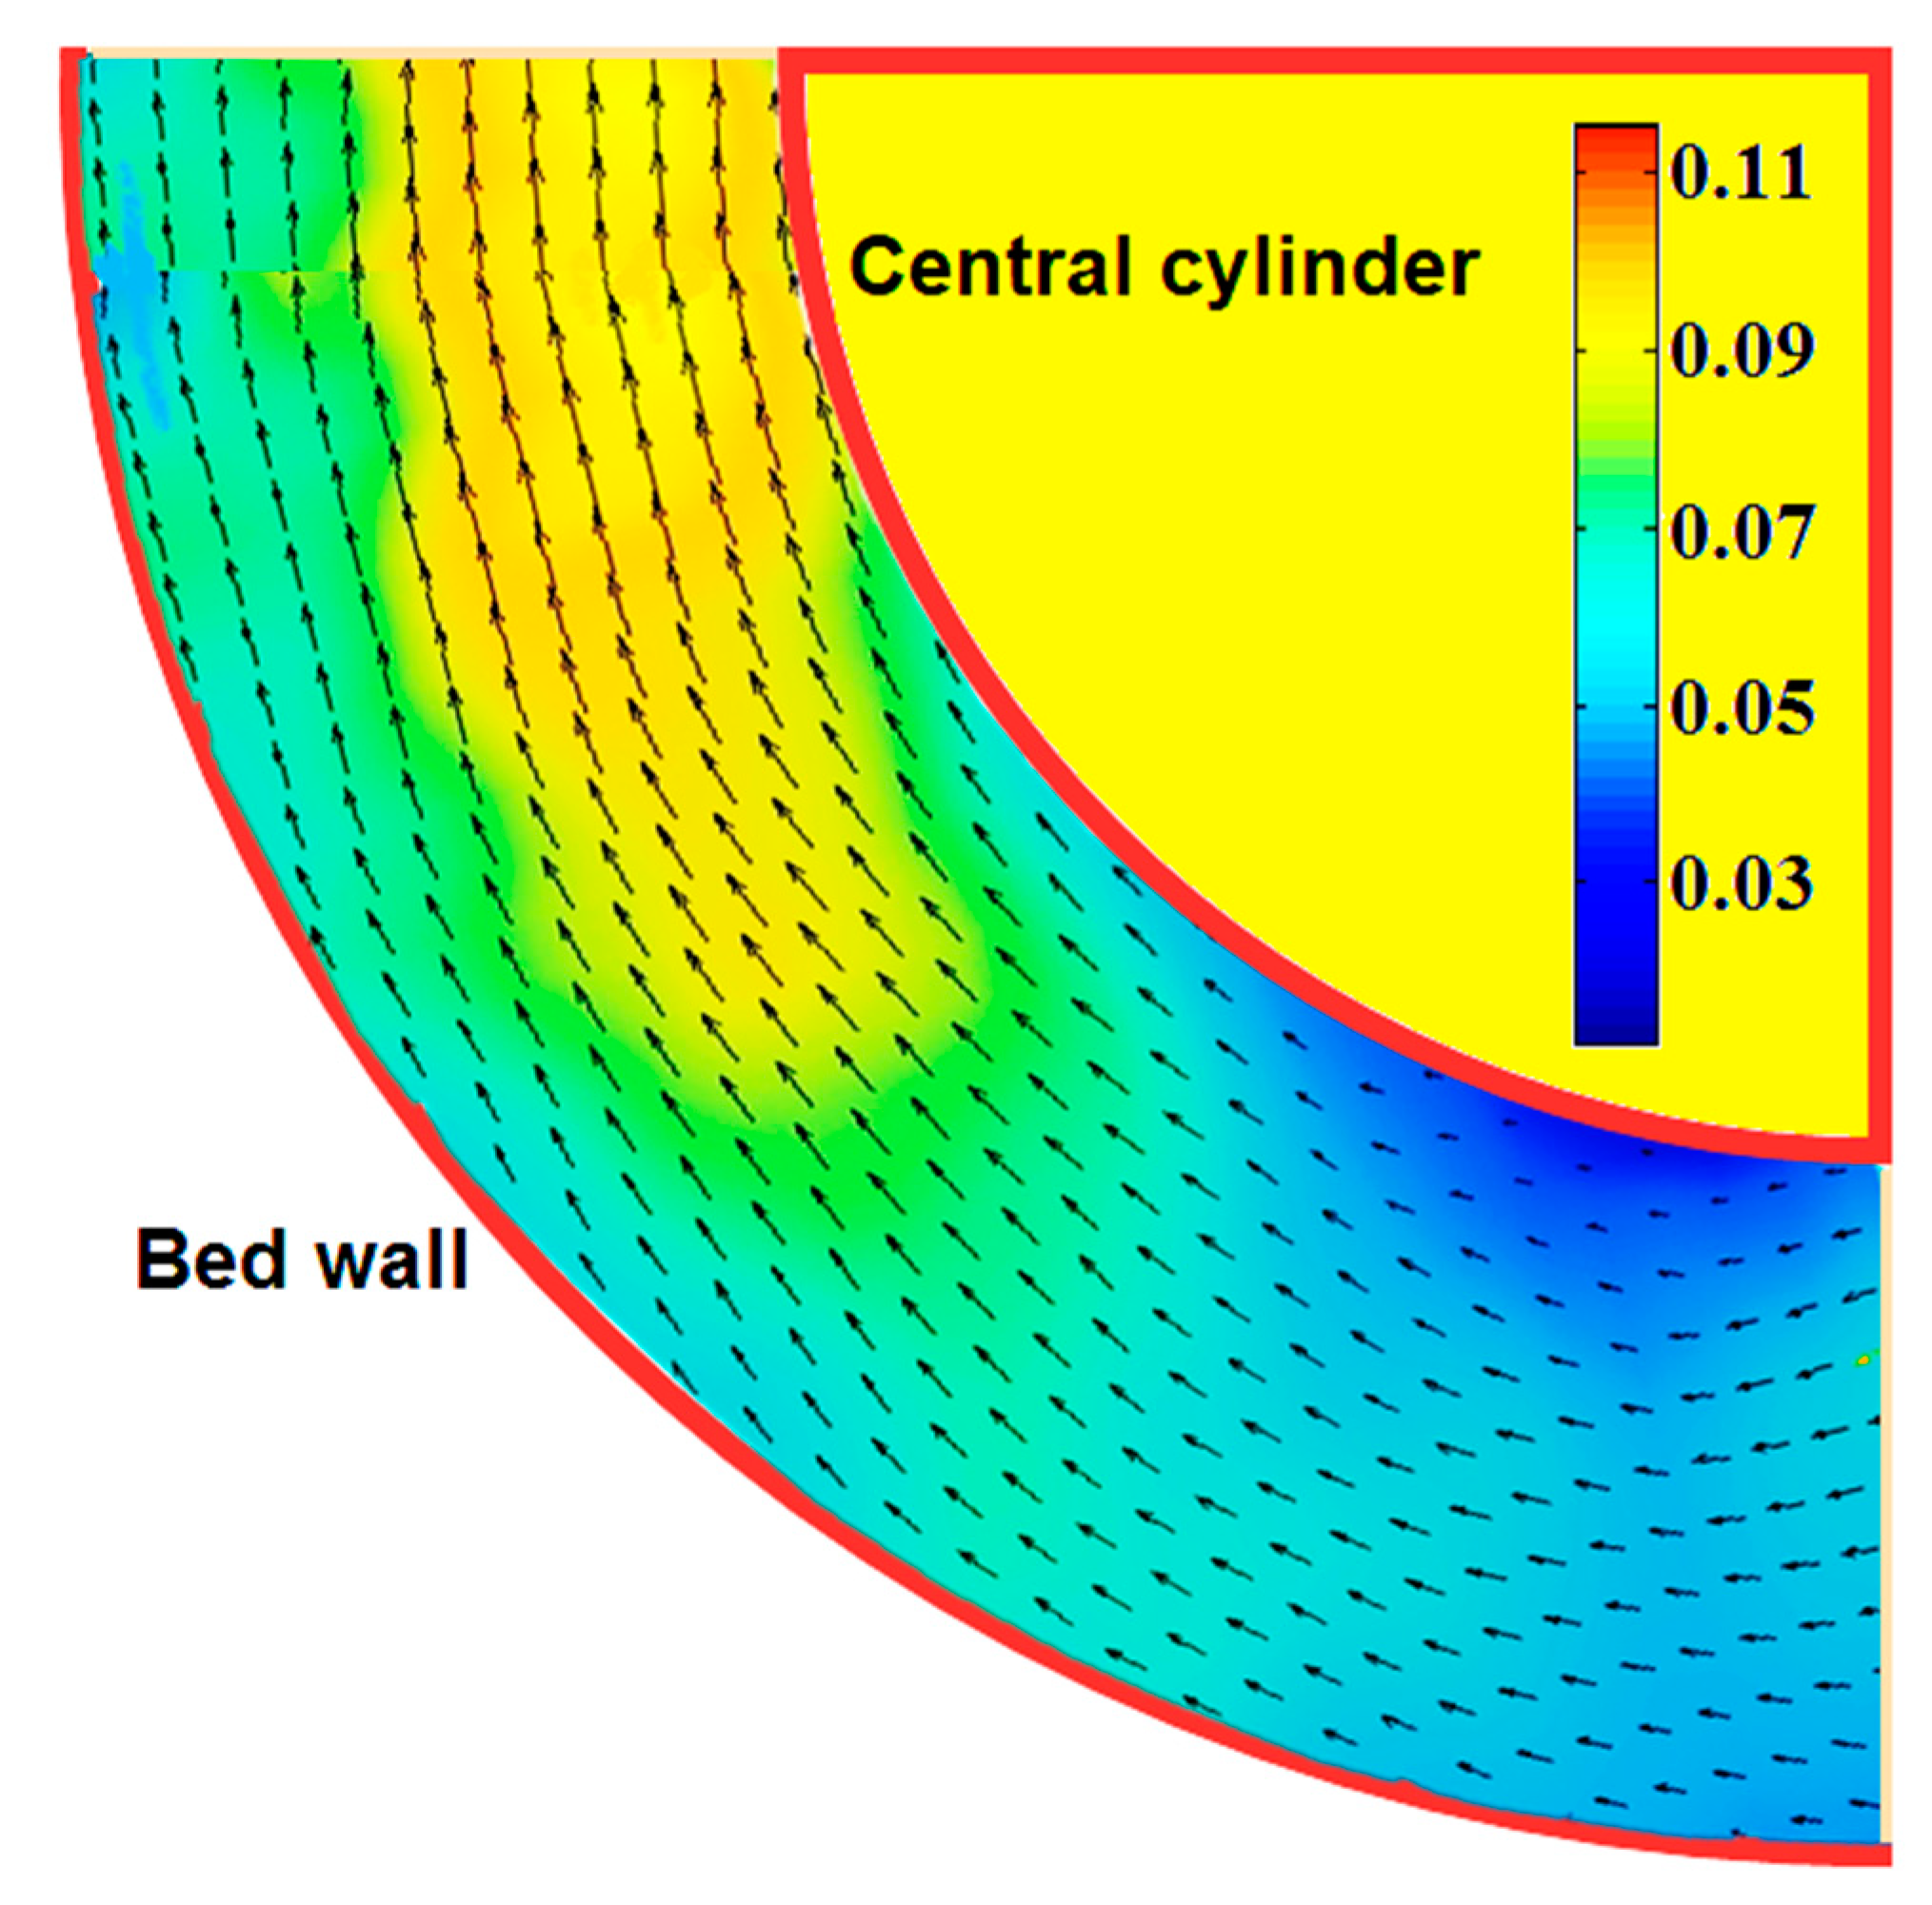
Figure 4 depicts the velocity vector field of particles for a 500 g bed weight, a 60° blade inclination angle, and a 2.3 m/s superficial air velocity. The size and density of the particles were kept constant at 6 mm and 971.43 kg/m
3, respectively. The bed velocity was found to be nonuniform; the yellow color in
Figure 4 shows the highest velocity, while the blue color shows the lowest velocity. The bed velocity was smallest near the boundary of the bed, that is, near the outer wall and near the central cylinder. The possible reason for such a decrease in velocity was the friction between the bed material and the boundaries [
4].
The velocity of the particles in the bed was estimated with PIV analysis. The velocity increased with the rising superficial velocity because of the higher momentum transfer. The maximum velocity was in the middle of the bed and started decreasing at points farther away from the middle (i.e., towards the outer bed wall and solid cylinder). As the superficial air velocity increased, no significant increase in bed velocity was observed near the outer wall, possibly due to growing centrifugal force.
Figure 5 shows the plot of the bed velocity as a function of distance on line from the central cylinder to the wall of the bed column when the bed weight was 500 g and the blade inclination angle was 30°. The superficial air velocity varied from 1.5 to 2.5 m/s, with an increment step of 0.1 m/s. For all values of superficial air velocity ranging from 1.5 to 2.5 m/s, the bed velocity initially increased with distance and then decreased linearly. The bed velocity attained peak point values after a 0.015 m distance and thereafter started to decrease beyond that distance. The bed velocity was noticed to be large in the middle of the straight line but gradually decreased while moving towards the ends of the line at a low superficial air velocity. This decrease in velocity was due to the frictional forces at both ends of the lines (i.e., near the central cylinder and near the boundary of bed column) [
4,
12]. These frictional effects become adverse for particle motion when the density of particles is notably large and the superficial air velocity is below the optimum value. When the optimized value of superficial air velocity was compared for all the inclination angles, the largest bed velocity was obtained at a 60° angle of inclination. Thus, the bed performance was optimized at a 60° inclination angle. However, at large values of superficial air velocity, the frictional effects were more prominent at the boundary of the bed column in comparison with the vicinity of the central cylinder. The reason was an increase in centrifugal force on the particles moving closer to the walls of the bed column and away from the central cylinder [
17,
18].
The centrifugal force made the particles move tangentially towards the outer wall, thereby increasing the interparticle and particle-to-surface friction. The average bed velocity was measured to be about 0.538 m/s. Stable and uniform fluidization took place for all blade inclination angles when the superficial air velocity was 2.3 m/s, so it was determined to be the optimized value of superficial air velocity. These measurements are in good agreement with past reports [
1,
4,
19] compiled using annular blade distributors in SFB operation. It reveals that the results, obtained with a mesh-coupled annular blade distributor, are valid and helpful in developing hybrid distributor designs. Hybrid designs may also minimize the pressure drop across the distributor. Conventional annular distributors are not preferred to process materials of smaller dimensions. The high pressure drop and lower size limitations restrict their use in the mainstream processing industry. The particles, raining down from the distributor, became stuck in the distributor and raised the pressure drop. The presented hybrid model stopped the smaller particles from falling through the gaps between the blades without increasing the pressure drop.
The comparison of air distributors having different blade inclination angles was made using a fixed bed weight of 500 g and a superficial velocity of 2.3 m/s. The largest bed velocity with stable and uniform fluidization was achieved for a blade inclination angle of 60°, as shown in
Figure 6. The possible reason for 60° being the optimized blade inclination angle is that this angle did not produce the same magnitude of horizontal and vertical components of superficial velocity. The vertical component was slightly larger than the horizontal component, and this combination was suitable for producing enough drag force to push the bed material into a uniform swirling fluidization regime and to produce larger bed velocities. The fluidization was somewhat turbulent in the beginning, which shifted to a smooth flow with a further increase in the air flowrate. Similar findings were reported by Naz and Sulaiman [
19] and Kumar and Murthy [
20]. They used simple annular blade distributor designs to fluidize plastic beads of different shapes in an SFB.
Figure 7 shows the plots of pressure drop versus superficial velocity for different inclination angles. The pressure drop across the hybrid distributor was found to increase with the superficial air velocity. There was also an increase in the pressure drop at angles of inclination above and below 60°. The 60° angle of inclination was discovered to be the optimized angle for stable operation of the SFB. Moderate pressure drops were noted across the distributor for this inclination angle. A high pressure drop is unwanted, as it requires higher flowrates of air, which implies elevated power consumption. Similarly, a drop in pressure below the designated value for stable fluidization is also unwanted, as it causes maldistribution of air and, therefore, nonuniform fluidization of the bed material [
21,
22,
23].
Figure 8 shows the plot of pressure drop versus the superficial air velocity. Many correlations can be used to forecast the minimum fluidization velocity (
Umf) of conventional beds for fluidization of different materials, but no such correlations have been developed so far for SFBs. In this study,
Umf was determined experimentally from the plot between the pressure drop and the superficial velocity [
19,
22]. Two tangent lines were drawn on the plane curve at a specific point, such that both lines touched the curve at that point. The value of the superficial velocity at this point is called the minimum fluidization velocity (
Umf).
As shown in
Figure 8,
Umf was measured to be about 1.68 m/s.
Umf provided information about the air velocity required to initiate fluidization of the bed material. At this velocity, the bed particles start to detach from each other and enter the incipient regime of fluidization. All practical bed operations are carried out at velocities above
Umf. The ratio of superficial and minimum fluidization velocities is important to deduce new bed designs.
Figure 9 shows the plot of minimum fluidization velocity versus the blade inclination angle of the hybrid distributor. Different inclination angles from 30° to 90° were used to fluidize the particles by increasing the superficial velocities. It is obvious from plot that as the inclination angle increased, the minimum fluidization velocity exhibited a gradually decreasing trend. The inclination angle defines the path of air flow through the distributor into the bed. The path of flow of air changes with a change in the inclination angle. The vertical component of air flow dominates the horizontal component at larger inclination angles. The vertical component contributes to fluidization and decreases the
Umf value for incipient fluidization. For low-cost fluidization operations, lower
Umf values are favorable [
23,
24]. Although
Umf decreased as the inclination angle increased, the bed material started exhibiting a bubbling rather than swirling motion at angles above 60°. This inclination angle imparted a uniform swirling motion to the bed material at moderate air velocities.
The slightly decreasing trend of
Umf with the inclination angle contradicts the findings of Venkiteswaran et al. [
23]. They studied the effect of the distributor angle on SFB operation. No change in
Umf was observed for inclination angles of 10°, 15°, and 20°. Since they did not vary the angle too much, the change in the opening area between the blades was not so pronounced. The very small difference of the opening areas for the tested angles resulted in an almost constant
Umf. This reveals that a change in
Umf is only possible when the inclination angles greatly differ, as in the presented work.
In a packed bed, the height of the material column is called the static bed height, which depends on the bed weight, particle size, particle shape, and packing fraction. The postfluidization height of the material in the column is called the dynamic or fluidized bed height, which depends on the superficial air velocity and the density of the material [
19,
25,
26].
Figure 10 reveals the effect of superficial velocity on fluidized bed height. For all inclination angles, the bed height started increasing after a superficial velocity of 1.5 m/s. The settled bed initially entered the bubbling regime and then the uniform swirling regime. After some bubbling, the bed height concomitantly increased with the superficial velocity. Below 1.5 m/s, the superficial velocity was not sufficient to intervene decisively in the settled bed. The fluidized bed height showed an increasing trend with the inclination angle as well. This increase in bed height is attributed to the dominating bubbling response of the bed at larger inclination angles. Because of the bubbling, the bed expanded in an upward direction rather undergoing a swirling motion.
The variation of fluidized bed height with superficial air velocity for different bed weights is shown in
Figure 11. The bed height before reaching the superficial velocity of 1 m/s is the settled bed height. As anticipated, the settled bed height would increase with an increase in the weight of the bed material without changing the other parameters. An increase in bed weight means an increase in the number of particles, which require more space to accommodate. After 1 m/s, the bed started to expand by raising the bed height. Upon expansion with the superficial velocity, the settled bed changed to a fluidized bed. The fluidized bed height increased proportionally with the superficial velocity, which was not unexpected. Singh and Roy [
26] revealed that during the early stages of fluidization in conventional beds, larger bed weights act more strongly downwards and keep the expansion lower compared with SFBs. The correct elucidation is based on the dependence on the diameter of the particles.
4. Statistical Analysis
The collected data contained a plethora of information. The large number of data points made it difficult to decide on the more and less important factors affecting the quality of fluidization. Also, it was difficult to optimize these factors for maximum output. Therefore, regression analysis of the data was conducted using the RSA program. The experimental results were compared with a polynomial regression statistical model. The bed velocity was predicted statistically through regression analysis. A set of guidelines was used establish a relationship between different dependent and independent variables. The optimum solution section provided the optimized value of the dependent variable, which was the bed velocity. The conditional expectation values of the variables of interest were predicted and are presented in
Table 1. Only the optimized values of the dependent and independent variables are shown in
Table 1. The minimum and maximum values are shown in statistical plots in
Figure 12. The data plots depict the combined effect of blade angle and bed weight on the bed velocity.
The confidence interval in
Table 2 is a range of possible values that the BV can have. The highest associated confidence level was set to 95%, which quantified the chances of finding the BV within the confidence interval. The confidence interval approach, which was used to estimate the BV statistically, differs from the point estimation approach. Point estimation gives a single value of the response parameter by averaging a number of measurements. This approach was adopted during the experimental measurement of BV. Statistically, the confidence interval was predicted in the range of 0.49485–0.49998. The statistical fit value of BV was 0.49741, which lay within the confidence interval. In the statistical analysis, the bed weight, blade inclination angle, and superficial velocity were optimized as 500 g, 53.6364°, and 2.3485 m/s, respectively. On the experimental side, the average or point value of BV was 0.538 m/s. The corresponding bed weight, blade inclination angle, and superficial velocity were 500 g, 60°, and 2.3 m/s, respectively. The same bed weights and superficial velocities were inferred through experimental and statistical analyses. However, a small difference of 6.4° was noticed in the experimental and statistically predicted blade inclination angles.
Experimentally, the bed velocity was expected to be maximum when bed weight was minimum and the blade angle was 60°. Similarly, the maximum bed velocity was predicted when the superficial velocity was 2.3 m/s. As shown in
Table 2, the fitted value of the response variable (BV) was 0.497 m/s. The experimental value of the bed velocity was about 0.538 m/s, which is in good agreement with the statistically fitted bed velocity. Only a 3.8% difference was seen in these results. This small difference in bed velocities is attributed to slightly differing blade angles. The experimentally optimized and statistically predicted values of the blade angle were 60° and 53.65°, respectively. These values differ only by 6.4%, meaning there is no significant difference to the acceptability of the experimental results. Similarly, almost identical superficial air velocities were predicted both experimentally (2.3 m/s) and statistically (2.35 m/s). The statistical predictions validated the experimental results with a confidence interval of 95%. Reasonably good agreement between the experimental and statistically predicted results reveals the high reliability of the experimental data and the effectiveness of the hybrid distributor design.


