Abstract
The SO2 adsorption efficiency of activated carbons (ACs) is clearly dependent on its physicochemical structure. Related to this, the effect of physical and mechanical activation on the physicochemical structure of coal-based ACs has been investigated in this work. In the stage of CO2 activation, the rapid decrease of the defective structure and the growth of aromatic layers accompanied by the dehydrogenation of aromatic rings result in the ordered conversion of the microstructure and severe carbon losses on the surfaces of Char-PA, while the oxygen content of Char-PA, including C=O (39.6%), C–O (27.3%), O–C=O (18.4%) and chemisorbed O (or H2O) (14.7%), is increased to 4.03%. Char-PA presents a relatively low SBET value (414.78 m2/g) owing to the high value of Non-Vmic (58.33%). In the subsequent mechanical activation from 12 to 48 h under N2 and dry ice, the strong mechanical collision caused by ball-milling can destroy the closely arranged crystalline layers and the collapse of mesopores and macropores, resulting in the disordered conversion of the microstructure and the formation of a defective structure, and a sustained increase in the SBET value from 715.89 to 1259.74 m2/g can be found with the prolonging of the ball-milling time. There is a gradual increase in the oxygen content from 6.79 to 9.48% for Char-PA-CO2-12/48 obtained by ball-milling under CO2. Remarkably, the varieties of physicochemical parameters of Char-PA-CO2-12/48 are more obvious than those of Char-PA-N2-12/48 under the same ball-milling time, which is related to the stronger solid-gas reactions caused by the mechanical collision under dry ice. Finally, the results of the SO2 adsorption test of typical samples indicate that Char-PA-CO2-48 with a desirable physicochemical structure can maintain 100% efficiency within 30 min and that its SO2 adsorption capacity can reach 138.5 mg/g at the end of the experiment. After the 10th cycle of thermal regeneration, Char-PA-CO2-48 still has a strong adsorptive capacity (81.2 mg/g).
1. Introduction
For a long time, SO2 emission from large coal-fired power plants has seriously polluted the environment and threatened human health [1]. The traditional wet desulfurization technology using calcium-based absorbent is unable to satisfy sustainable development, owing to its ecological destruction and the production of massive low-value by-products [2]. Dry desulfurization technology using porous carbon materials (such as activated carbons, ACs) as adsorbents has a better application prospect owing to its low price and ability to produce valuable by-products (such as sulfuric acid) [3]. ACs are usually prepared via a physical activation method and chemical activation method. In the process of chemical activation, the substantial water/acid is consumed to remove a large number of residual reagents (such as KOH [4,5], K2CO3 [6,7], ZnCl2 [8], and H3PO4 [9]), which not only increases the preparation costs but also causes environmental pollution. Thus, it is highly desirable to apply physical activation as a green and low-cost method for the preparation of ACs. In the process of physical activation, activation agents including steam, CO2 and their mixtures can partially etch the carbon network to produce some porosity and functional groups, and some researchers [10,11,12,13,14] have found that CO2 activation can make it easier to generate pores inside the particles than steam activation can. In addition, the preparation of ACs using coal as raw material can also meet desulfurization requirements in coal-fired power plants. Furthermore, the desulfurization performance of ACs is closely related to its physicochemical structure, such as a lot of active sites and a high specific surface area (SBET) in the presence of the hierarchical pore [15,16]. In the process of physical activation, the pore development follows a branched model. First, the micropore is formed on the surface of particles at the initial stage, after which the successive diffusion of activated agents from surface to core helps the formation of a new micropore; meanwhile, the formation of mesopores and macropores originates from the enlargement of the original micropores [17,18]; this branched model inevitably leads to a low specific surface area (SBET) and a high carbon loss on the surface of the particles, even under various activation conditions (such as the activation temperature, activation time and activated gas species, etc.) [13,14,19,20]. In addition, the active sites of porous carbon materials usually include oxygen/nitrogen-containing functional groups and defects at the edge of the aromatic layers. Zhu et al. [13,14] have found that the surface chemical properties of ACs are also significantly changed to form some oxygen-containing functional groups with the carbon loss at the stage of CO2 activation. Some researchers and our previous work [21,22,23] have found that the dehydrogenation of aromatic rings accompanied by the rapid decrease of the defect structure helps the vertical condensation and the transverse growth of aromatic layers during the physical activation, thus resulting in the removal of a large number of active sites. In summary, it is difficult to obtain the ideal ACs with a desirable porosity and more active sites in the stage of physical activation.
A ball-milling technique is a novel method to synthesize materials by mechanical activation without producing hazardous products (which can destroy the chemical bonds of the macromolecular structure), finally resulting in the molecular rearrangement, amorphization and recrystallization of the crystal structure [24,25]. Ong et al. [26] have found that the specific surface area (SBET) and the oxygen content of the sample increase rapidly from 6 m2/g to 450 m2/g and from 3.6% to 5.0% within 12 h of milling in the oxidizing atmosphere. Zhang et al. [27] also found that the size distribution of the sample ends up being narrower and its average particle size decreases with the increase of the milling time from 0.25 to 8 h because of the high collision strength between the agate balls during the ball-milling process. Salver-Disma et al. [28] have demonstrated that the mechanical milling of natural graphite is one possibility for producing disordered carbons with large intercalation capacities. The milled graphite contains large amounts of defects and present anisotropies [29]. Nevertheless, information regarding the changes in the physicochemical structure of coal-based ACs during physical and mechanical activation is still limited.
In this work, a precursor with a stable carbon-based framework obtained by pyrolysis could be treated first by CO2 activation, which ensures the formation of the original pores (such as some micropores and the hierarchical pores) and some oxygen-containing functional groups. In order to further increase the specific surface area and quantities of the active sites, the samples mentioned above continued to be activated via the ball-milling method under different times (12 h and 48 h, respectively) and different atmospheres (dry ice or N2) to further increase the specific surface area and quantities of the active sites. In addition, the physicochemical structure of all the samples were measured by a D/max-rb X-ray diffractometer (XRD), Raman spectroscopy, Nitrogen adsorption, X-ray photoelectron spectroscopy (XPS), transmission electron microscope (TEM) and high-resolution scanning electron microscope (SEM). Finally, to verify the application potentials of the ACs with the ideal physicochemical structure, an SO2 removal test was performed to further explore the relationship between the physicochemical structure and SO2 adsorption of ACs.
2. Materials and Methods
2.1. Materials
In this work, Jixi bituminous coal with particle sizes of 200–350 µm was obtained from the northeast of China. In order to eliminate the interference of minerals in the raw material, Jixi bituminous coal was treated sequentially using 30 wt % hydrofluoric acid (HF) and 5 mol·L−1 hydrochloric acid (HCl) following the steps in the literature [30]. Then, the acid-treated samples were washed using deionized water and dried in an oven at 90 °C for 12 h. The proximate analysis and elemental analysis of the acid-treated samples (JX) were given in Table 1.

Table 1.
The proximate analyses and elemental analyses of JX (wt %).
2.2. Experimental Process
2.2.1. CO2 activation
10 g of JX were heated to 900 °C at a constant rate of 5 °C/min in an argon atmosphere flow of 600 mL/min and held for 60 min, and this sample was marked as Char. Then, argon atmosphere was converted to CO2 (99.999%) at 600 mL/min and held for 60 min, before being finally cooled down to room temperature under an argon atmosphere and being marked as Char-PA.
2.2.2. Mechanical activation
Char-PA was prepared by a planetary ball mill (Pulverisette 6, FRITSCH, Idar-Oberstein, Germany,) by applying a rotation speed of 400 rpm in dry ice or N2 atmosphere for 12 h and 48 h, respectively. Additionally, a ball-to-powder weight ratio of 15:1 and 12 stainless steel balls with a diameter of 10 mm were used in the process of ball-milling, and these treated samples were marked as Char-PA-N2/CO2-different activation times. In addition, thermal annealing of a typical sample was processed at 800 °C for 60 min in 5% H2/Ar atmosphere; this treated sample was marked as Char-PA-N2/CO2-different activation times-H2.
2.3. Measurement Analysis
The surface topography of the samples was obtained via a scanning electron microscope (SEM, Quanta 200, FEI, Oregon, OR, USA) at 200 kV. The microstructure of the samples was tested by high-resolution transmission electron microscope (HRTEM, Tecnai G2 F30, FEI, Oregon, OR, USA) at 300 kV. The crystal information of the samples was received by a D/max-rb X-ray diffractometer (XRD, D8 ADVANCE, Brooke, Karlsruhe, Germany) at a fixed scanning speed of 3°/min from 5° to 85°. The hybrid carbon information of the samples was received by Raman spectroscopy at a stable scanning scope from 1000–1800 cm−1 using a 532 nm wavelength laser. The elemental composition, chemical state and relative concentration on the surface of the samples were obtained by X-ray photoelectron spectroscopy (XPS, K-Alpha, Thermo Fisher Scientific, Waltham, MA, USA) with an Al Kα X-ray at 14 kV and 6 mA [31]. The pore parameters of the samples were received by a micromeritics adsorption apparatus (ASAP2020, Micromeritics, Norcross, GA, USA) at 77 K and a relative pressure (P/P0) range from 10−7 to 1 [32]. The vacuum degassing pretreatment of the tested samples was carried out at 473 K for 12 h. Moreover, the specific surface area (SBET) of the samples was calculated using a BET model in a relative pressure range of 0.05–0.2 [33]; the total pore volume (Vtot) caused by the adsorption value of liquid nitrogen at a relative pressure of 0.98 was obtained using the t-plot method [34]; the micropore volume (Vmic) of the samples was calculated using the Horvath–Kawazoe (HK) method [35]; the nonlocal density functional theory (NLDFT) was used to obtain the pore size distribution of the micropore and mesopore, and the relative pressure range was 10−7~0.9 [13].
2.4. SO2 Adsorption Test
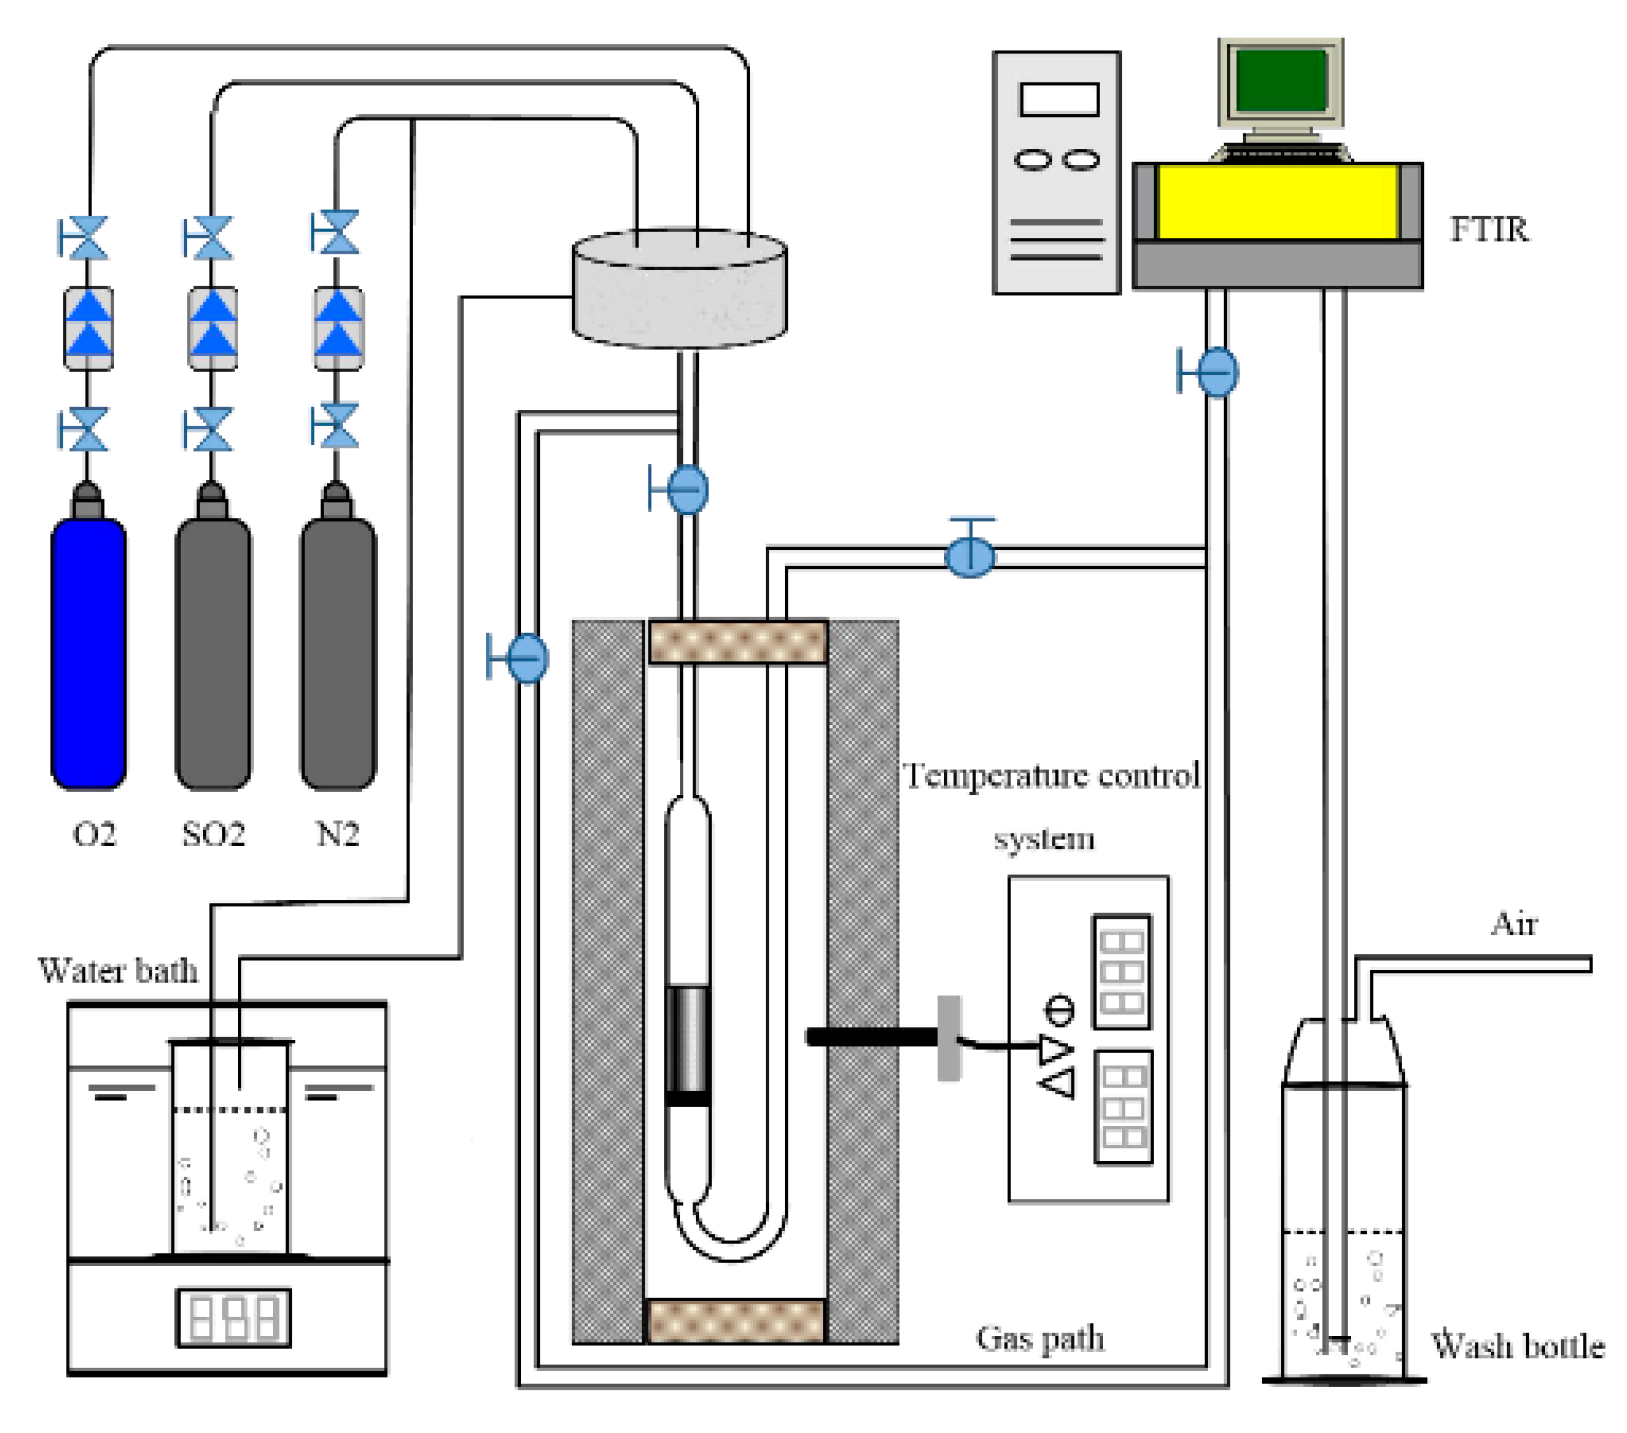
A fixed-bed experimental system was used to investigate the SO2 adsorption performance of ACs. This system included four parts: the gas distribution system, the fixed-bed reactor, the heating and insulation system, and the gas analysis system, as shown in Figure 1. First, 250 mL of deionized water were added to the humidifying tank, which was placed in a constant temperature water bath to maintain it at 90 °C. Simulated flue gas was prepared by mixing a certain amount of N2 with SO2, O2 and other gases. The water vapor content in the simulated flue gas was controlled by adjusting the N2 flow rate.
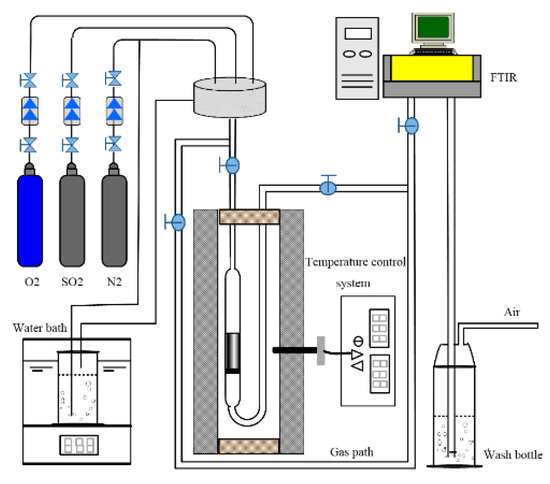
Figure 1.
Schematic figure of the fixed-bed reactor system for SO2 adsorption.
The experimental process is as follows: 5 g of tested sample were placed in a glass tube reactor that consisted of a glass tube and sand core. Furthermore, this sand core not only supported AC particles, but also played the role of current sharing. The filling height and diameter of the adsorbent in the glass tube reactor were 25 mm and 20 mm, respectively. The SO2 adsorption test was performed at 80 °C for 210 min. The gas volumetric composition used in the experiments was: SO2, 1500 ppm; O2, 5%; water vapor, 10%; and N2, balance, total flow rate 250 mL∙min−1. The SO2 concentrations at the entrance and exit were measured by an on-line Fourier transform infrared gas analyzer (FTIR, Dx4000, Gasmet, Vantaa, Finland) for calculating the SO2 removal efficiency and the change of the removal rate with time. According to the integral area and reaction time on the removal curve, the SO2 removal capacity of the coal-based ACs was obtained [36]. In addition, the SO2 removal efficiency, SO2 removal rate and cumulative sulphur capacity were calculated with the following formula:
SO2 removal efficiency (DeSO2):
In the formula, SO2 (in) and SO2 (out) are the SO2 concentrations at the reactor inlet and outlet measured by FTIR, respectively.
SO2 removal rate (RSO2):
In the formula, DeSO2 is the SO2 removal efficiency and SO2 (in) is the SO2 concentration at the reactor inlet measured by FTIR,
The accumulated sulfur capacity (ASO2) refers to the cumulative removal capacity of SO2 from samples varying with time and is obtained by integrating the removal rate of SO2 with the time.
2.5. Thermal Regeneration
For the thermal regeneration, desulfurized ACs were placed in a glass tube, and afterwards were settled in a vertical furnace (Figure 1). The ACs were heated in a flow of nitrogen (200 mL/min), at a heating rate of 10 °C min−1 and maintained at 400 °C for 30 min, before being cooled for 30 min while the nitrogen purge was continued.
3. Results and Discussion
3.1. Microstructure and Surface Morphology Analysis by HRTEM and SEM
Figure 2 shows several HRTEM and SEM images of samples produced under pyrolysis and different activation conditions, including (a) HRTEM and (h) SEM of Char; (b) HRTEM and (i) SEM of Char-PA; (c) HRTEM and (j) SEM of Char-PA-N2-12; (d) HRTEM and (k) SEM of Char-PA-N2-48; (e) HRTEM and (l) SEM of Char-PA-CO2-12; (f) HRTEM and (m) SEM of Char-PA-CO2-48; (g) HRTEM and (n) SEM of Char-PA-CO2-48H2.There are some crystalline layers with different orientations near small quantities of amorphous carbon for Char in Figure 2a. In addition, a smooth surface and compact texture of Char can be found in Figure 2h. He et al. [37] found that metaplast material that was formed via the combination of transferable hydrogen and aliphatic hydrocarbons during pyrolysis can not only promote the ordered arrangement of aromatic layers but also reshape the particle surface. After CO2 activation, a large amount of long and multi-layer crystallite with a consistent orientation can be found in Char-PA, as shown in Figure 2b; the highly ordered crystalline layers of Char-PA can hinder the further diffusion of activated gas into the interior of particles, leading to severe carbon losses on the particle surfaces, as shown in Figure 2i. After 12 h of high-energy ball milling, some short and thin crystallite layers of Char-PA-N2/CO2-12 with a granular structure and rough surface can be found in Figure 2c,e,j,l. Furthermore, as the time of ball milling increases from 12 h to 48 h, blurred boundaries and a disordered arrangement of crystalline layers of Char-PA-N2/CO2-48 with a rougher surface and some smaller particles are also found in Figure 2d,f,k,m. The above results show that the mechanical collision caused by ball milling can significantly promote the disordered conversion of the microstructure and improve the surface morphology of particles with the increase of the ball-milling times from 12 to 48 h. In the process of mechanical activation, the high-energy ball milling can reduce the reaction temperature of the solid state and cause the increase of the local temperature on the material [24,25]. Based on this fact, a strong mechanical collision under dry ice can rapidly promote the solid-gas reactions between CO2 and the carbon matrix, as a result of which Char-PA-CO2-12/48 shows more obvious changes in its microcrystalline structure and surface morphology than Char-PA-N2-12/48 under the same ball-milling time.

Figure 2.
The HRTEM and SEM images of the samples produced at different treatment conditions. (a) HRTEM and (h) SEM of Char; (b) HRTEM and (i) SEM of Char-PA; (c) HRTEM and (j) SEM of Char-PA-N2-12; (d) HRTEM and (k) SEM of Char-PA-N2-48; (e) HRTEM and (l) SEM of Char-PA-CO2-12; (f) HRTEM and (m) SEM of Char-PA-CO2-48; (g) HRTEM and (n) SEM of Char-PA-CO2-48H2.
3.2. Crystal Structure Analysis by XRD
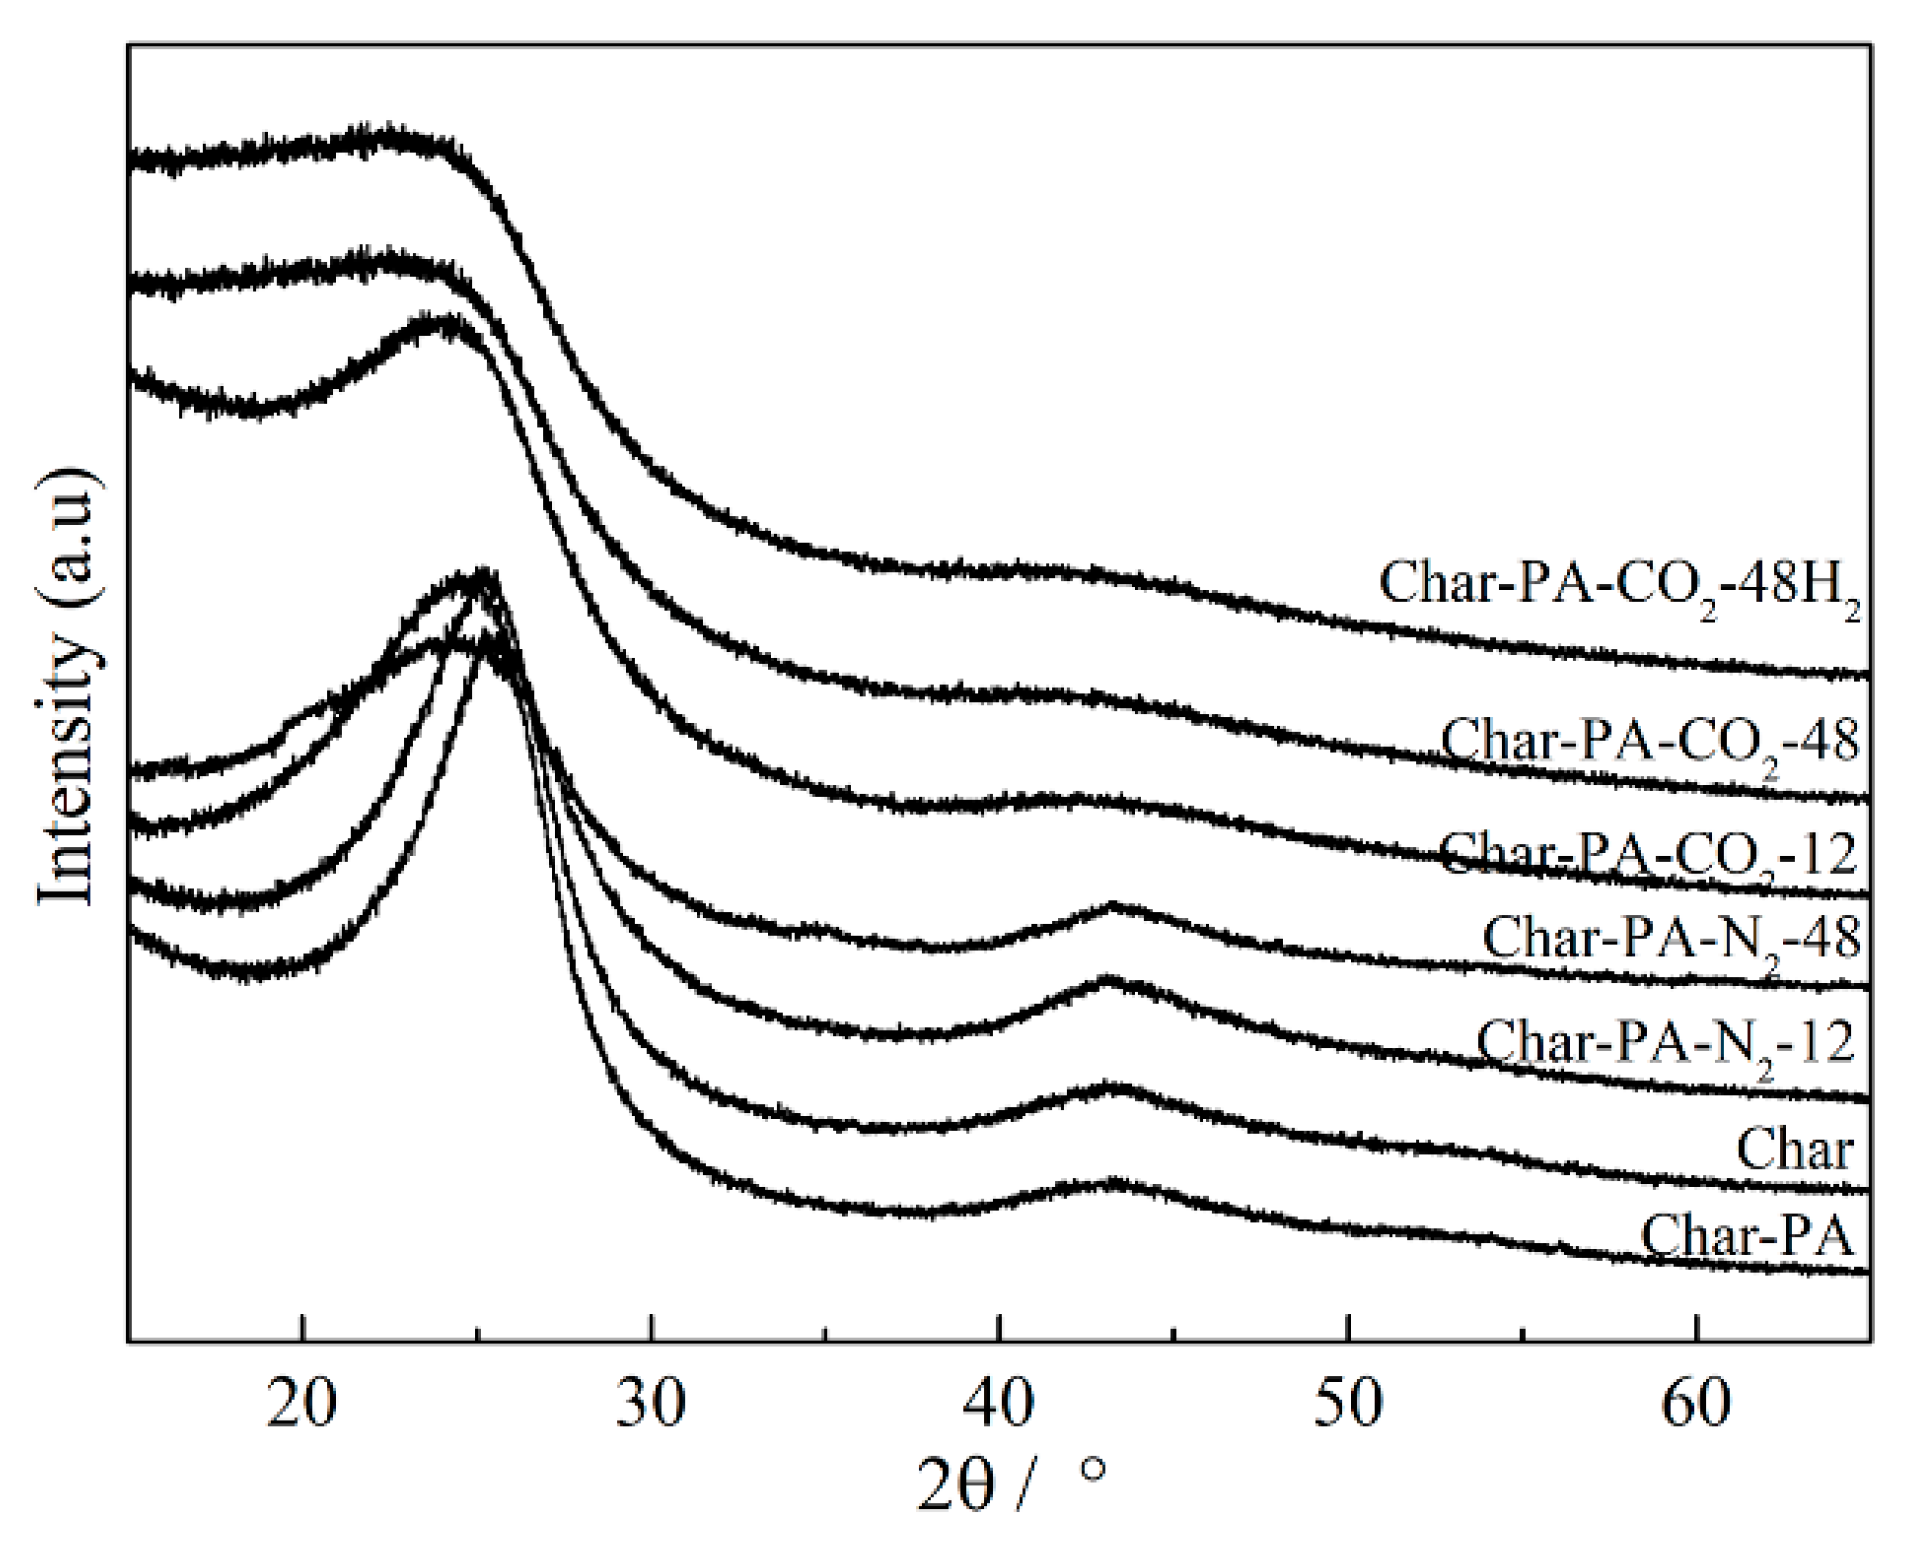
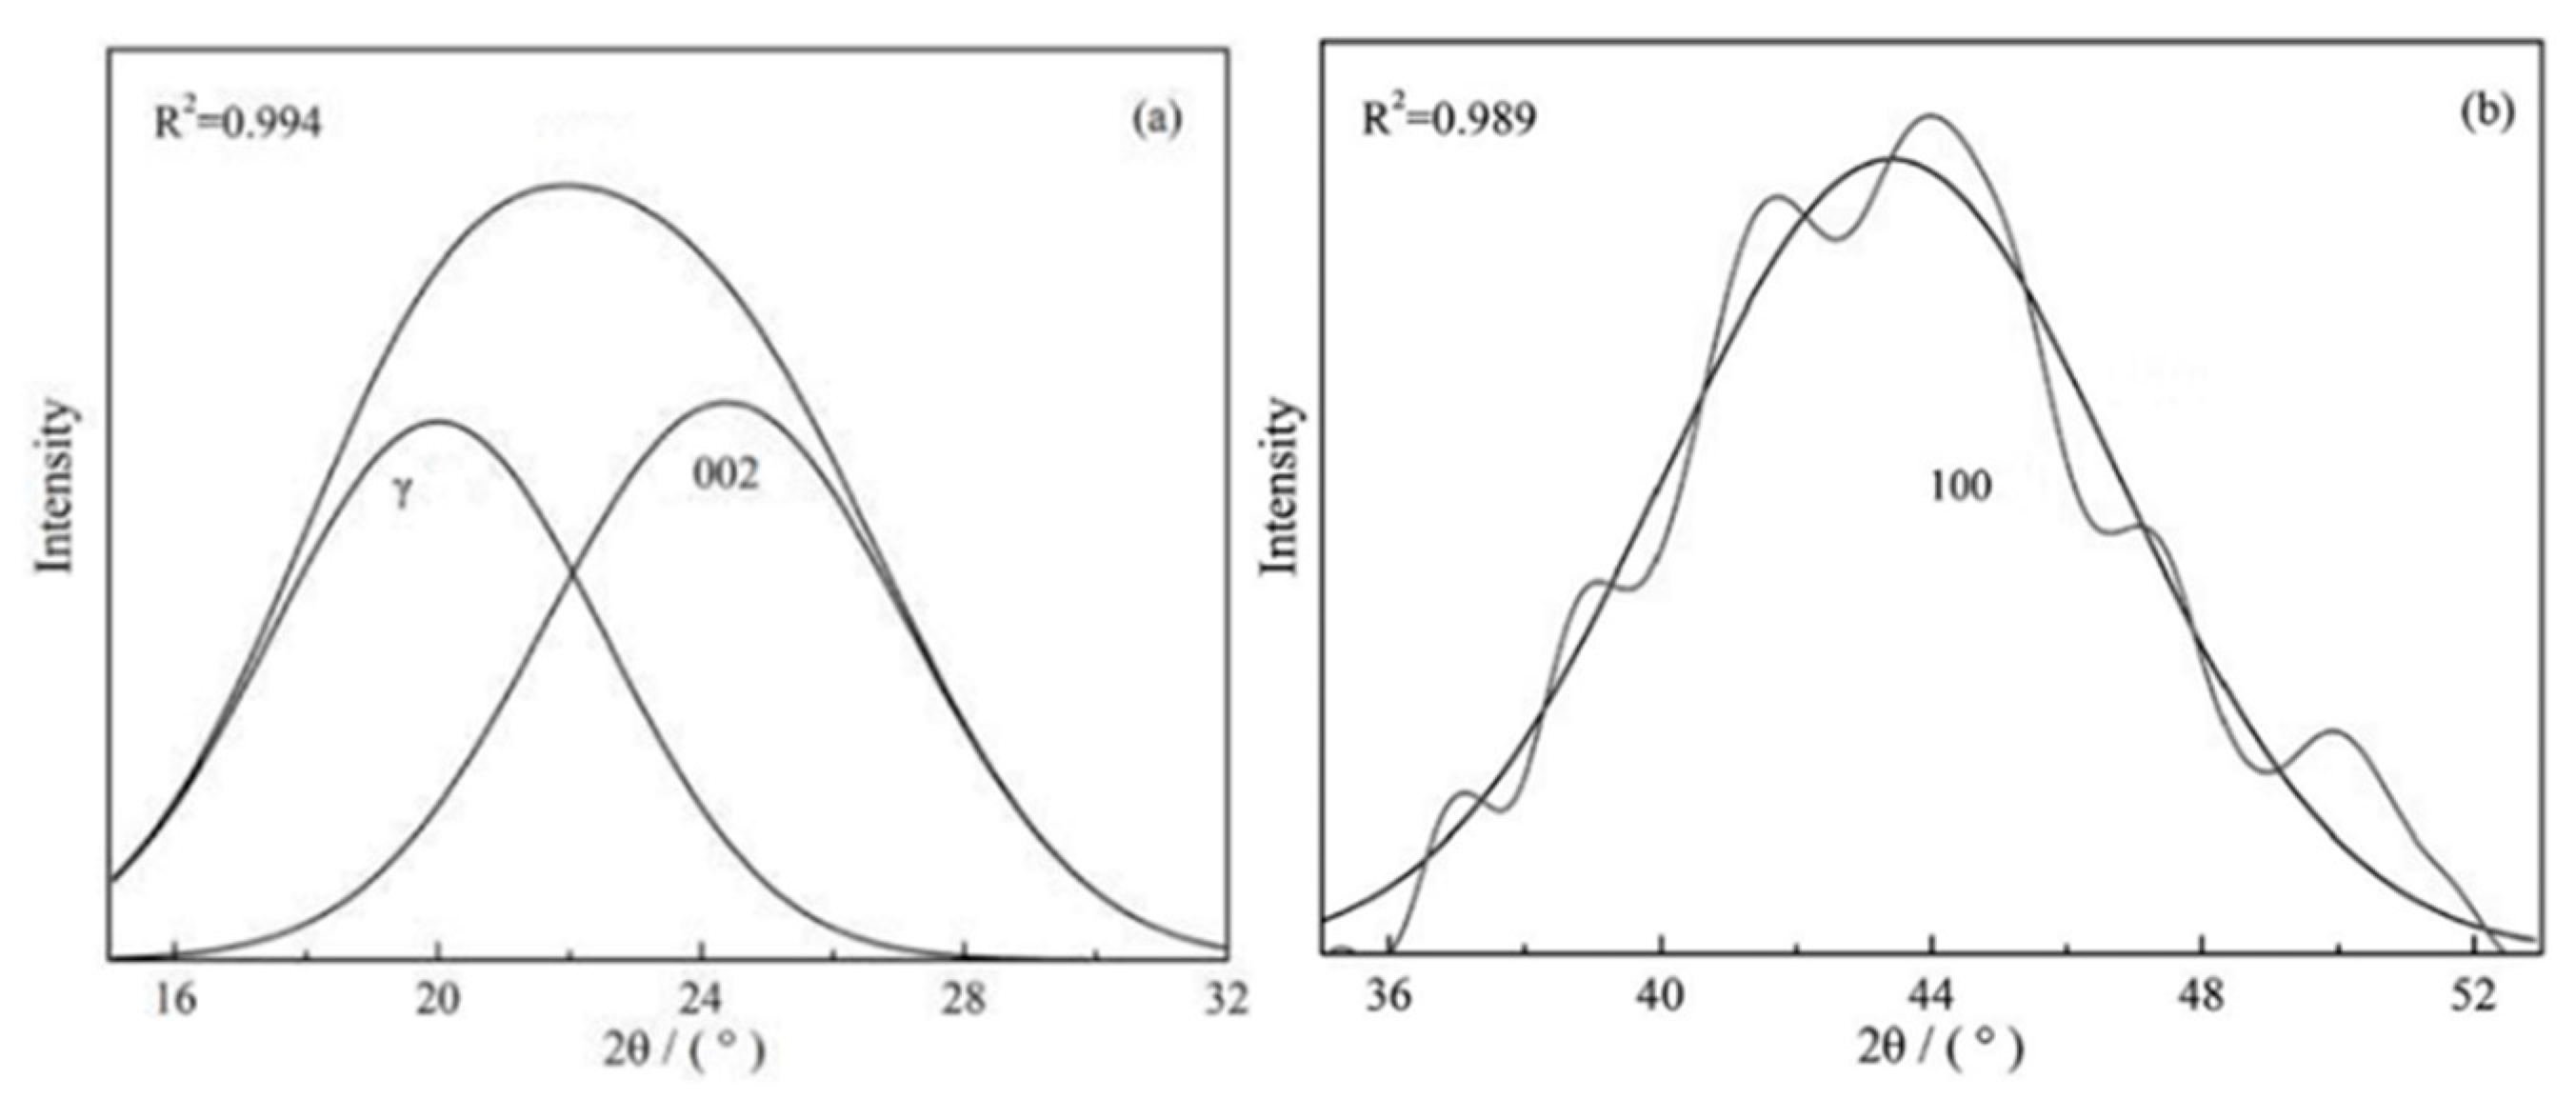
The XRD profiles of the samples produced under pyrolysis and different activation conditions are given in Figure 3. There are two obvious broad diffraction peaks at 2θ = 16–32° and 36–52° in all of the samples; the information on two diffraction peaks (such as positions and half-peak width) can be obtained using the peak fitting treatment, as shown in Figure 4. Some crystal parameters, including the interlayer distance (d002), stacking height (Lc), and the size (La) and numbers (N) of the aromatic layers, are calculated via the following formulas [38]:
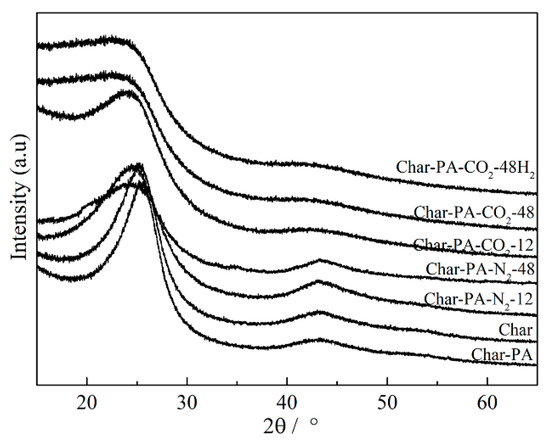
Figure 3.
The XRD profiles from the samples produced at different treatment conditions.
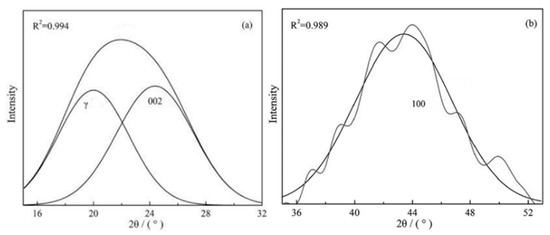
Figure 4.
The fitting curve of the peaks for Char-PA in the 2θ range (a) 15–32° and (b) 35–53°.
In the above formulas, λ: the wavelength of the X-ray, λ = 1.54 Å; θ: peaks’ positions (°); and β: half peak width. The results of the crystal parameters of all the samples are given in Table 2.

Table 2.
The crystal parameters of the samples produced at different treatment conditions.
First, the rapid increase in the numbers (N), stacking height (Lc) and size (La) of the aromatic layers and the obvious reduction in the layer spacing (d002) can be found in the Char-PA during CO2 activation. The longitudinal condensation and transversal growth of the aromatic layers are related to the rapid consumption of the side chains and bridge bonds within the aromatic layers and defective structure on the edge of the aromatic layers [14,39]. Then, with the ball-milling time increases from 12 to 48 h, there is a sustained decrease in the La, Lc and N values and a persistent increase in the d002 value for Char-PA-CO2/N2-12/48, indicating the disordered conversion of the microcrystalline structure. These changes are closely related to the breakdown and distortion of the aromatic layers caused by a strong mechanical collision, which can further destroy the parallelism of the layer and the constancy of the interlayer spacing. Finally, the changes of the crystal parameters of Char-PA-CO2-12/48 are more obvious than those of Char-PA-N2-12/48 under the same ball-milling time, which may be related to the fact that the local high temperature caused by ball milling promotes CO2 etching on the aromatic layers. In this process, the more defective structures on the edge of the aromatic layers can also be formed as active sites.
3.3. Carbon Structure Analysis by Raman
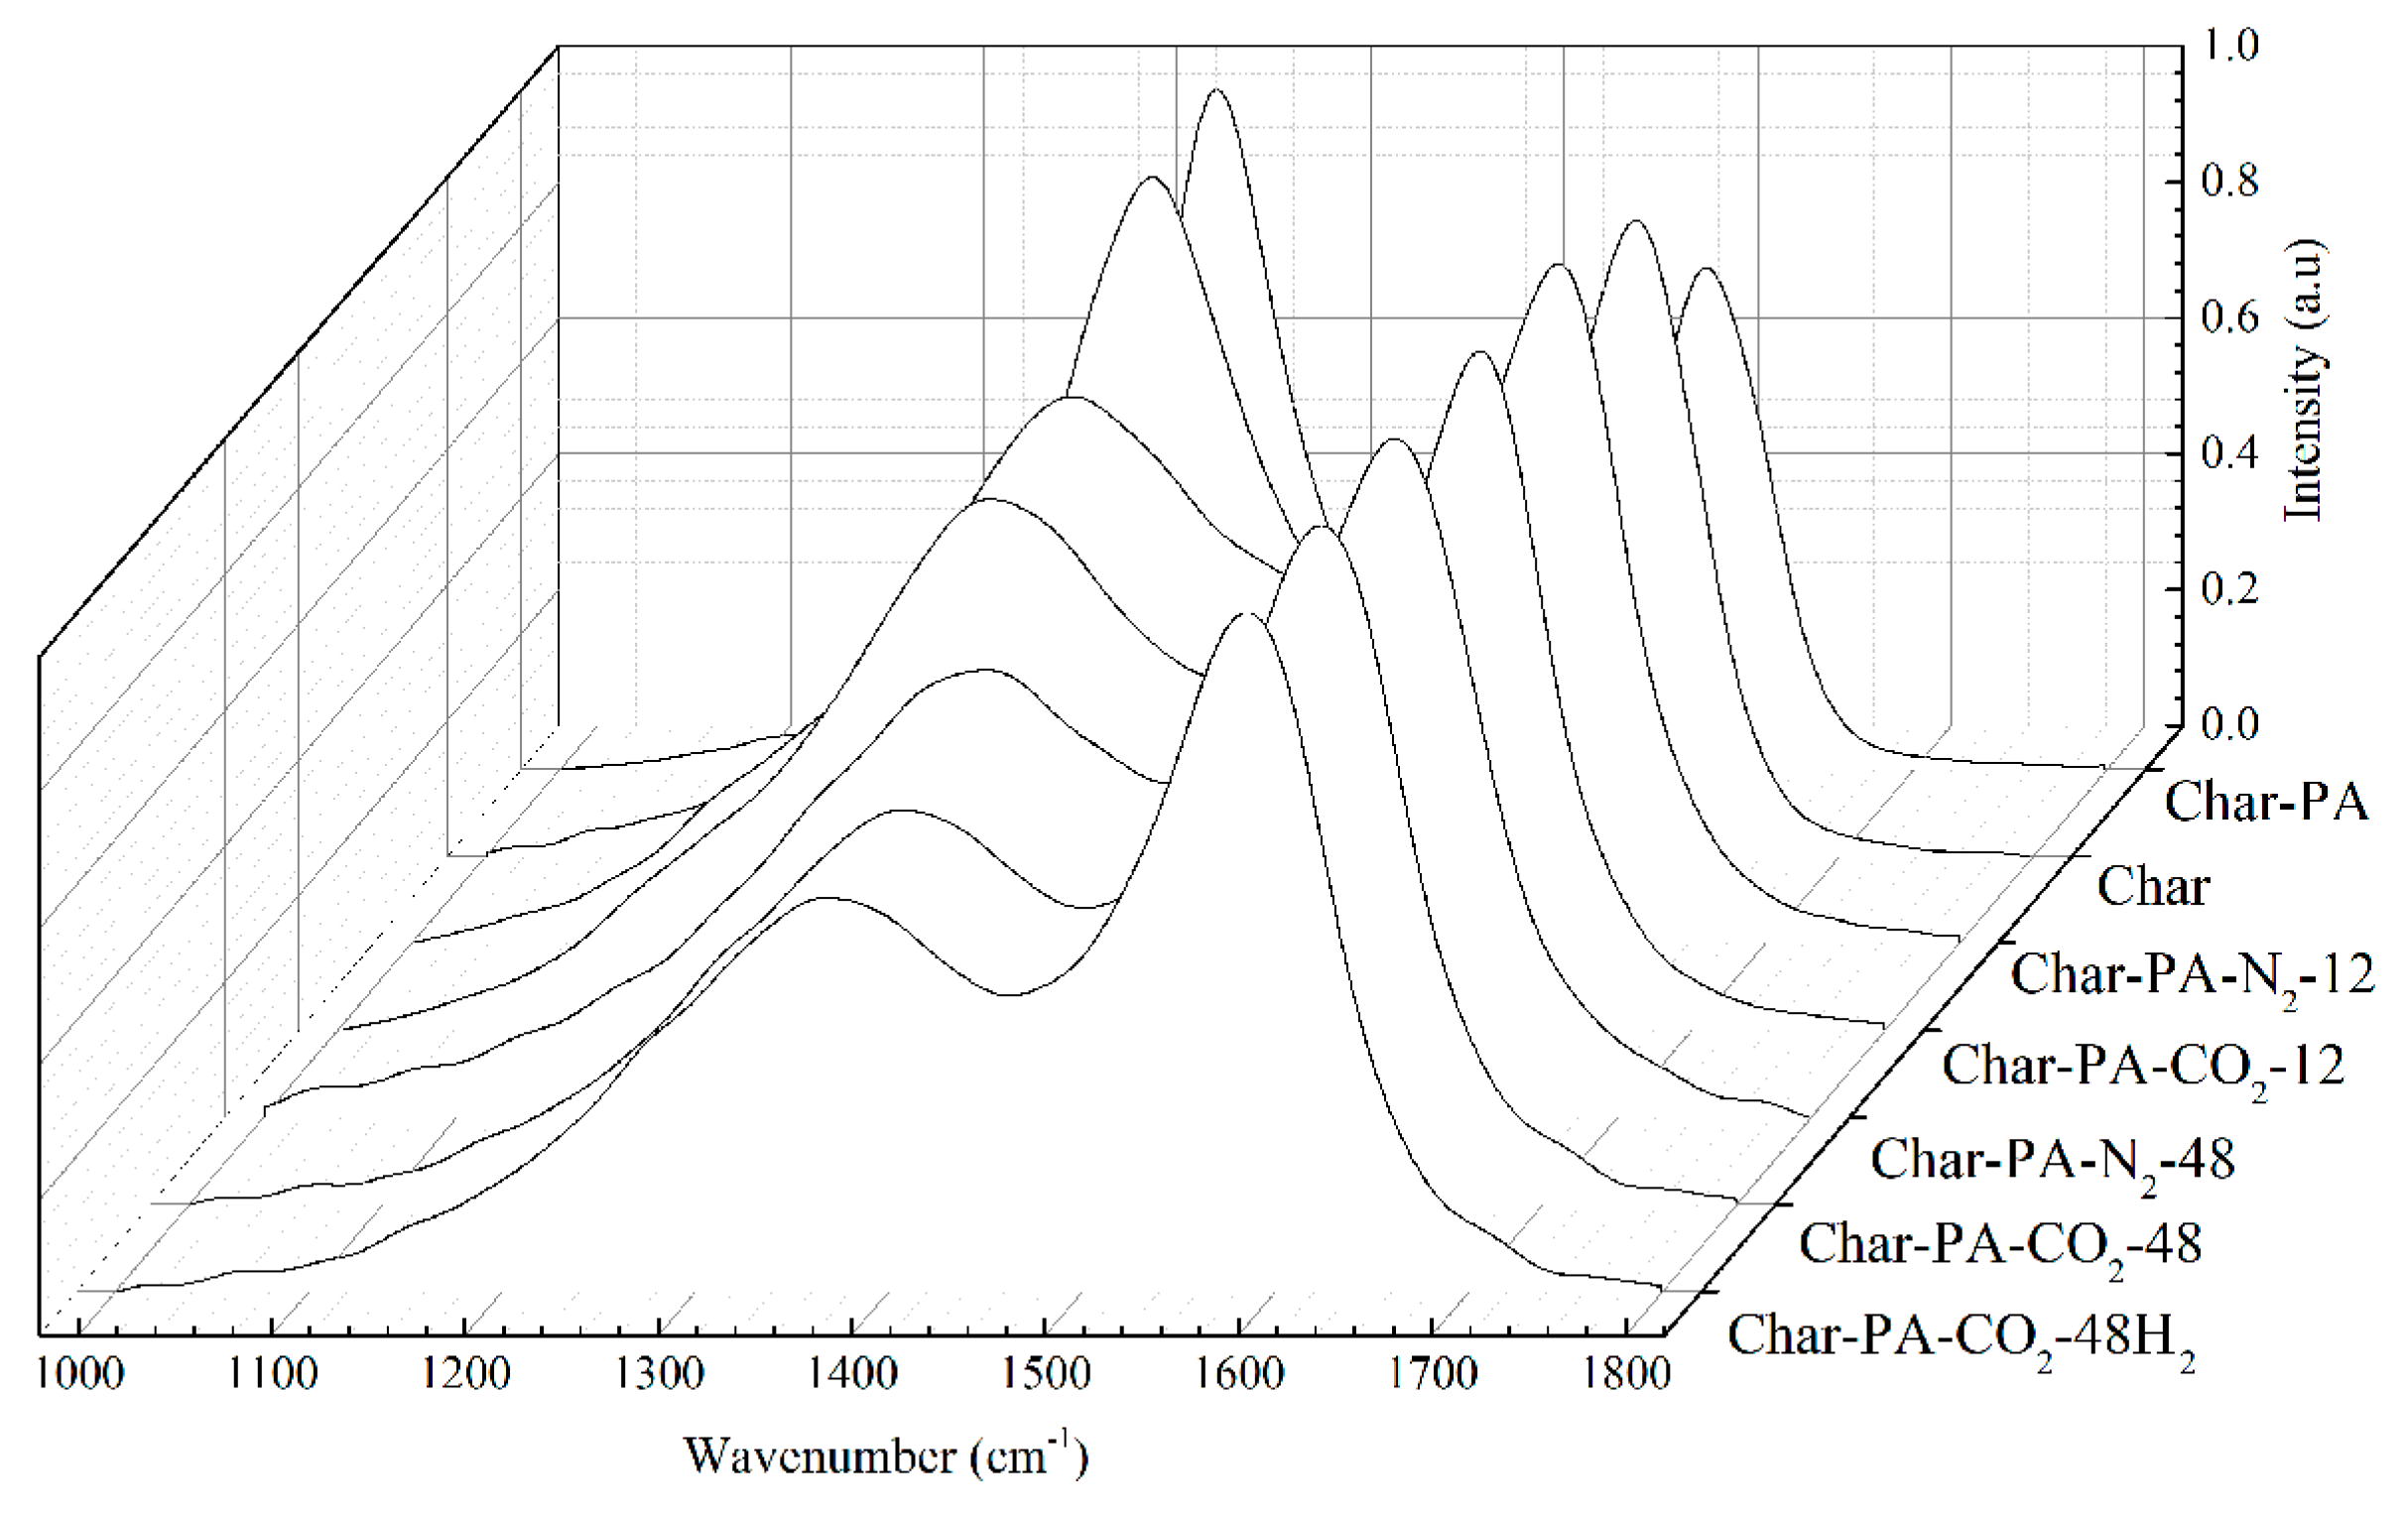
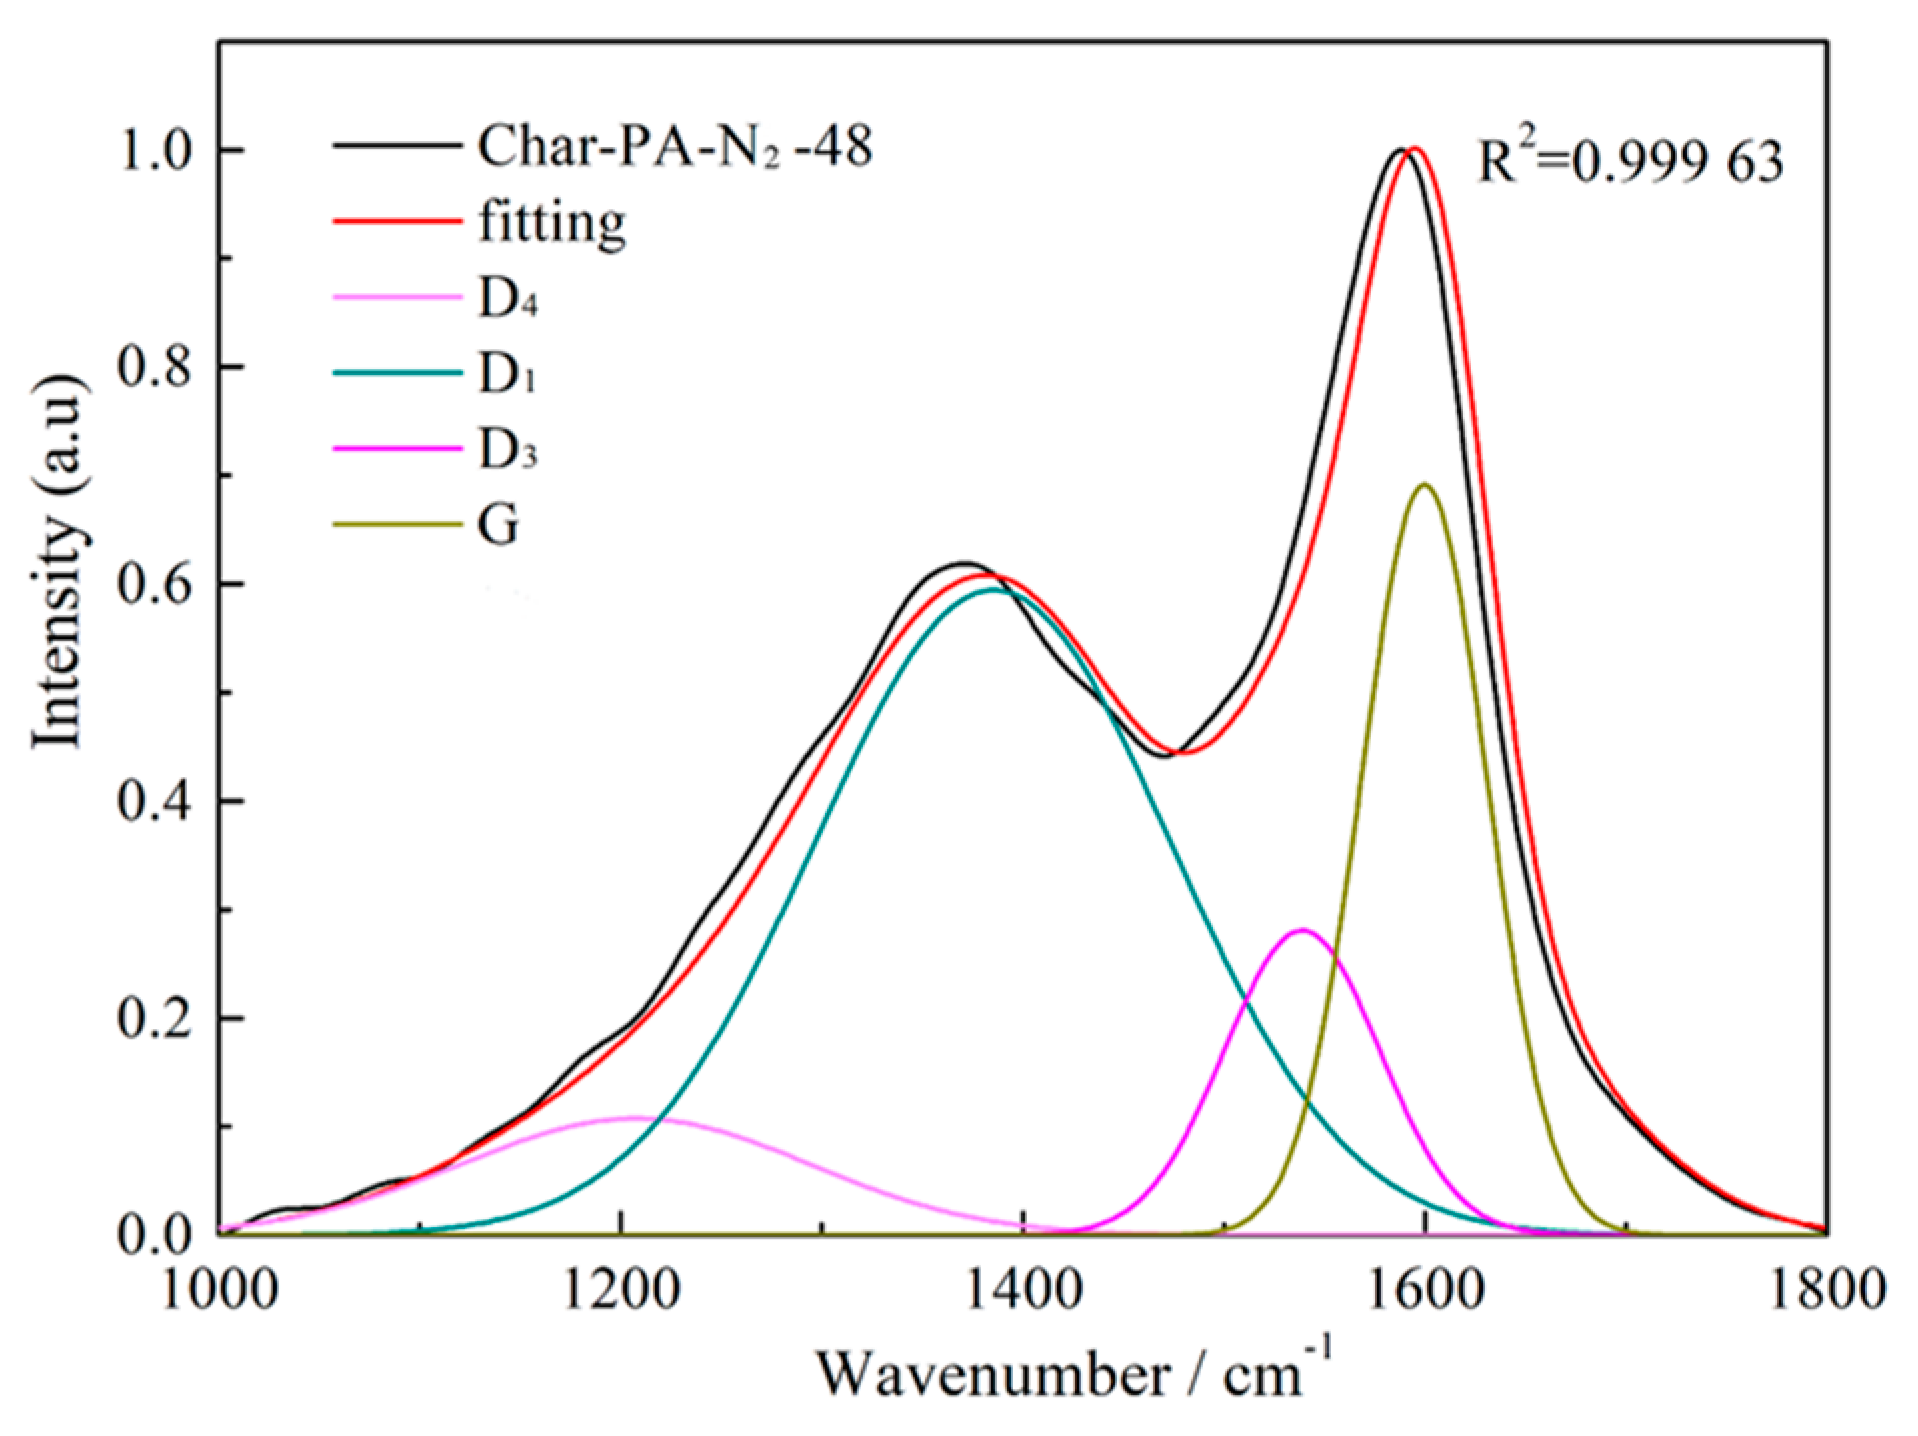
The Raman spectra of the samples produced under pyrolysis and different activation conditions are shown in Figure 5. There are two obvious broad diffraction peaks at 1230–1450 cm−1 (D peak) and 1450–1580 cm−1 (G peak) in all of the samples. Some researchers [40,41] have found that the widening of the D and G peaks is serious for incomplete graphitized materials in Raman spectra, indicating the existence of many sp2-hybridized structures and sp2–sp3 hybridized structures. Thus, it is necessary to resolve overlapped peaks using a fitting treatment, including for the D1 peak (1300 cm−1), D3 peak (1520 cm−1), D4 peak (1200 cm−1) and G peak (1550 cm−1). Figure 6 shows the fitting curve of the Raman spectrum for Char-PA-N2-48. Furthermore, the D1 peak is represented as the defective sp2 bonding carbon atoms; the D3 peak is represented as the amorphous sp2 bonding carbon atoms; the D4 peak is represented as the sp2–sp3 bonding carbon atoms; the G peak is represented as the crystalline sp2 bonding carbon atoms; furthermore, the relative quantities of different hybridized structures is as follows: (1) AD1/AG represents the relative quantity of the big aromatic rings, including C–C between aromatic rings and aromatics with no fewer than 6 rings with a defective structure; (2) AD3/AG represents the relative quantity of the small aromatic rings including aromatics with 3–5 rings and the semi-circle breathing of aromatic rings; and (3) AD4/AG represents the relative quantity of the cross-linking structure, including Caromatic–Calkyl, aromatic (aliphatic) ethers and C–C on hydroaromatic rings [42]. The results of the different hybrid carbons in the form of area ratios of the samples are shown in Table 3.
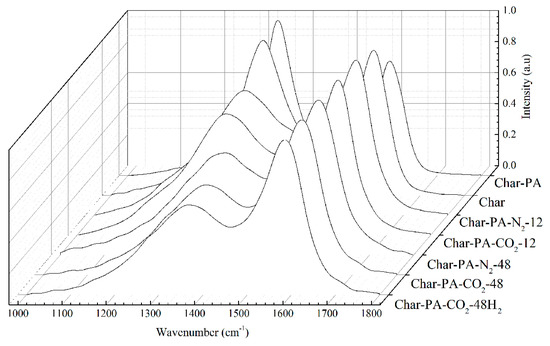
Figure 5.
The Raman spectra from the samples produced at different treatment conditions.
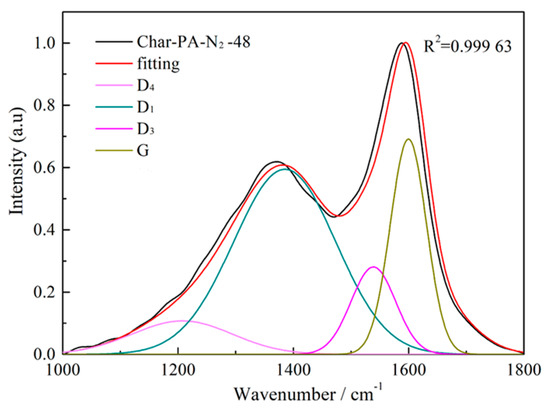
Figure 6.
The fitting curve of the Raman spectrum for Char-PA-N2-48.

Table 3.
Hybrid carbon in the form of the area ratio of the samples produced at different treatment conditions.
First, the values of AD1/AG, AD3/AG and AD4/AG of Char-PA obviously decrease when compared to those of Char. In the process of CO2 activation, the defective structure at the edge of the aromatic layers and some small aromatic rings are consumed preferentially [43].The consumption of the defective structure can promote the dehydrogenation of the big aromatic rings; and the removal of the small aromatic rings can help the inner reactivation of the big aromatic rings accompanied by the breakdown of the cross-linking structure [44]; these changes finally lead to a substantial increase in the quantities of crystalline sp2 bonding carbon atoms, which further promotes the stability of the carbon structure. Then, with the increase of the ball-milling time from 12 to 48 h, the values of AD1/AG and AD4/AG of Char-PA-N2/CO2-12/48 increase gradually; but there is a slight increase in the value of AD3/AG. It can be inferred that a strong mechanical collision caused by the ball milling has partly destroyed the crystalline sp2 bonding carbon structure, decomposing it into the big aromatic rings, which is accompanied by the formation of new crosslinking structures. In particular, the variety of the hybrid carbon parameters of Char-PA-CO2-12/48 is more obvious than that of Char-PA-N2-12/48 under the same ball-milling time. Some oxygen atoms from dry ice are easily bonded and fixed to the carbon matrix in the form of cross-linking bonds (such as -COO- and -O-), and some oxygen-containing heterocycles under a local high temperature are caused by a strong mechanical collision; furthermore, the presence of O-containing structures can also promote the reorganization of aromatic fragments to form more big aromatic rings.
3.4. Pore Structure Analysis by N2 Adsorption
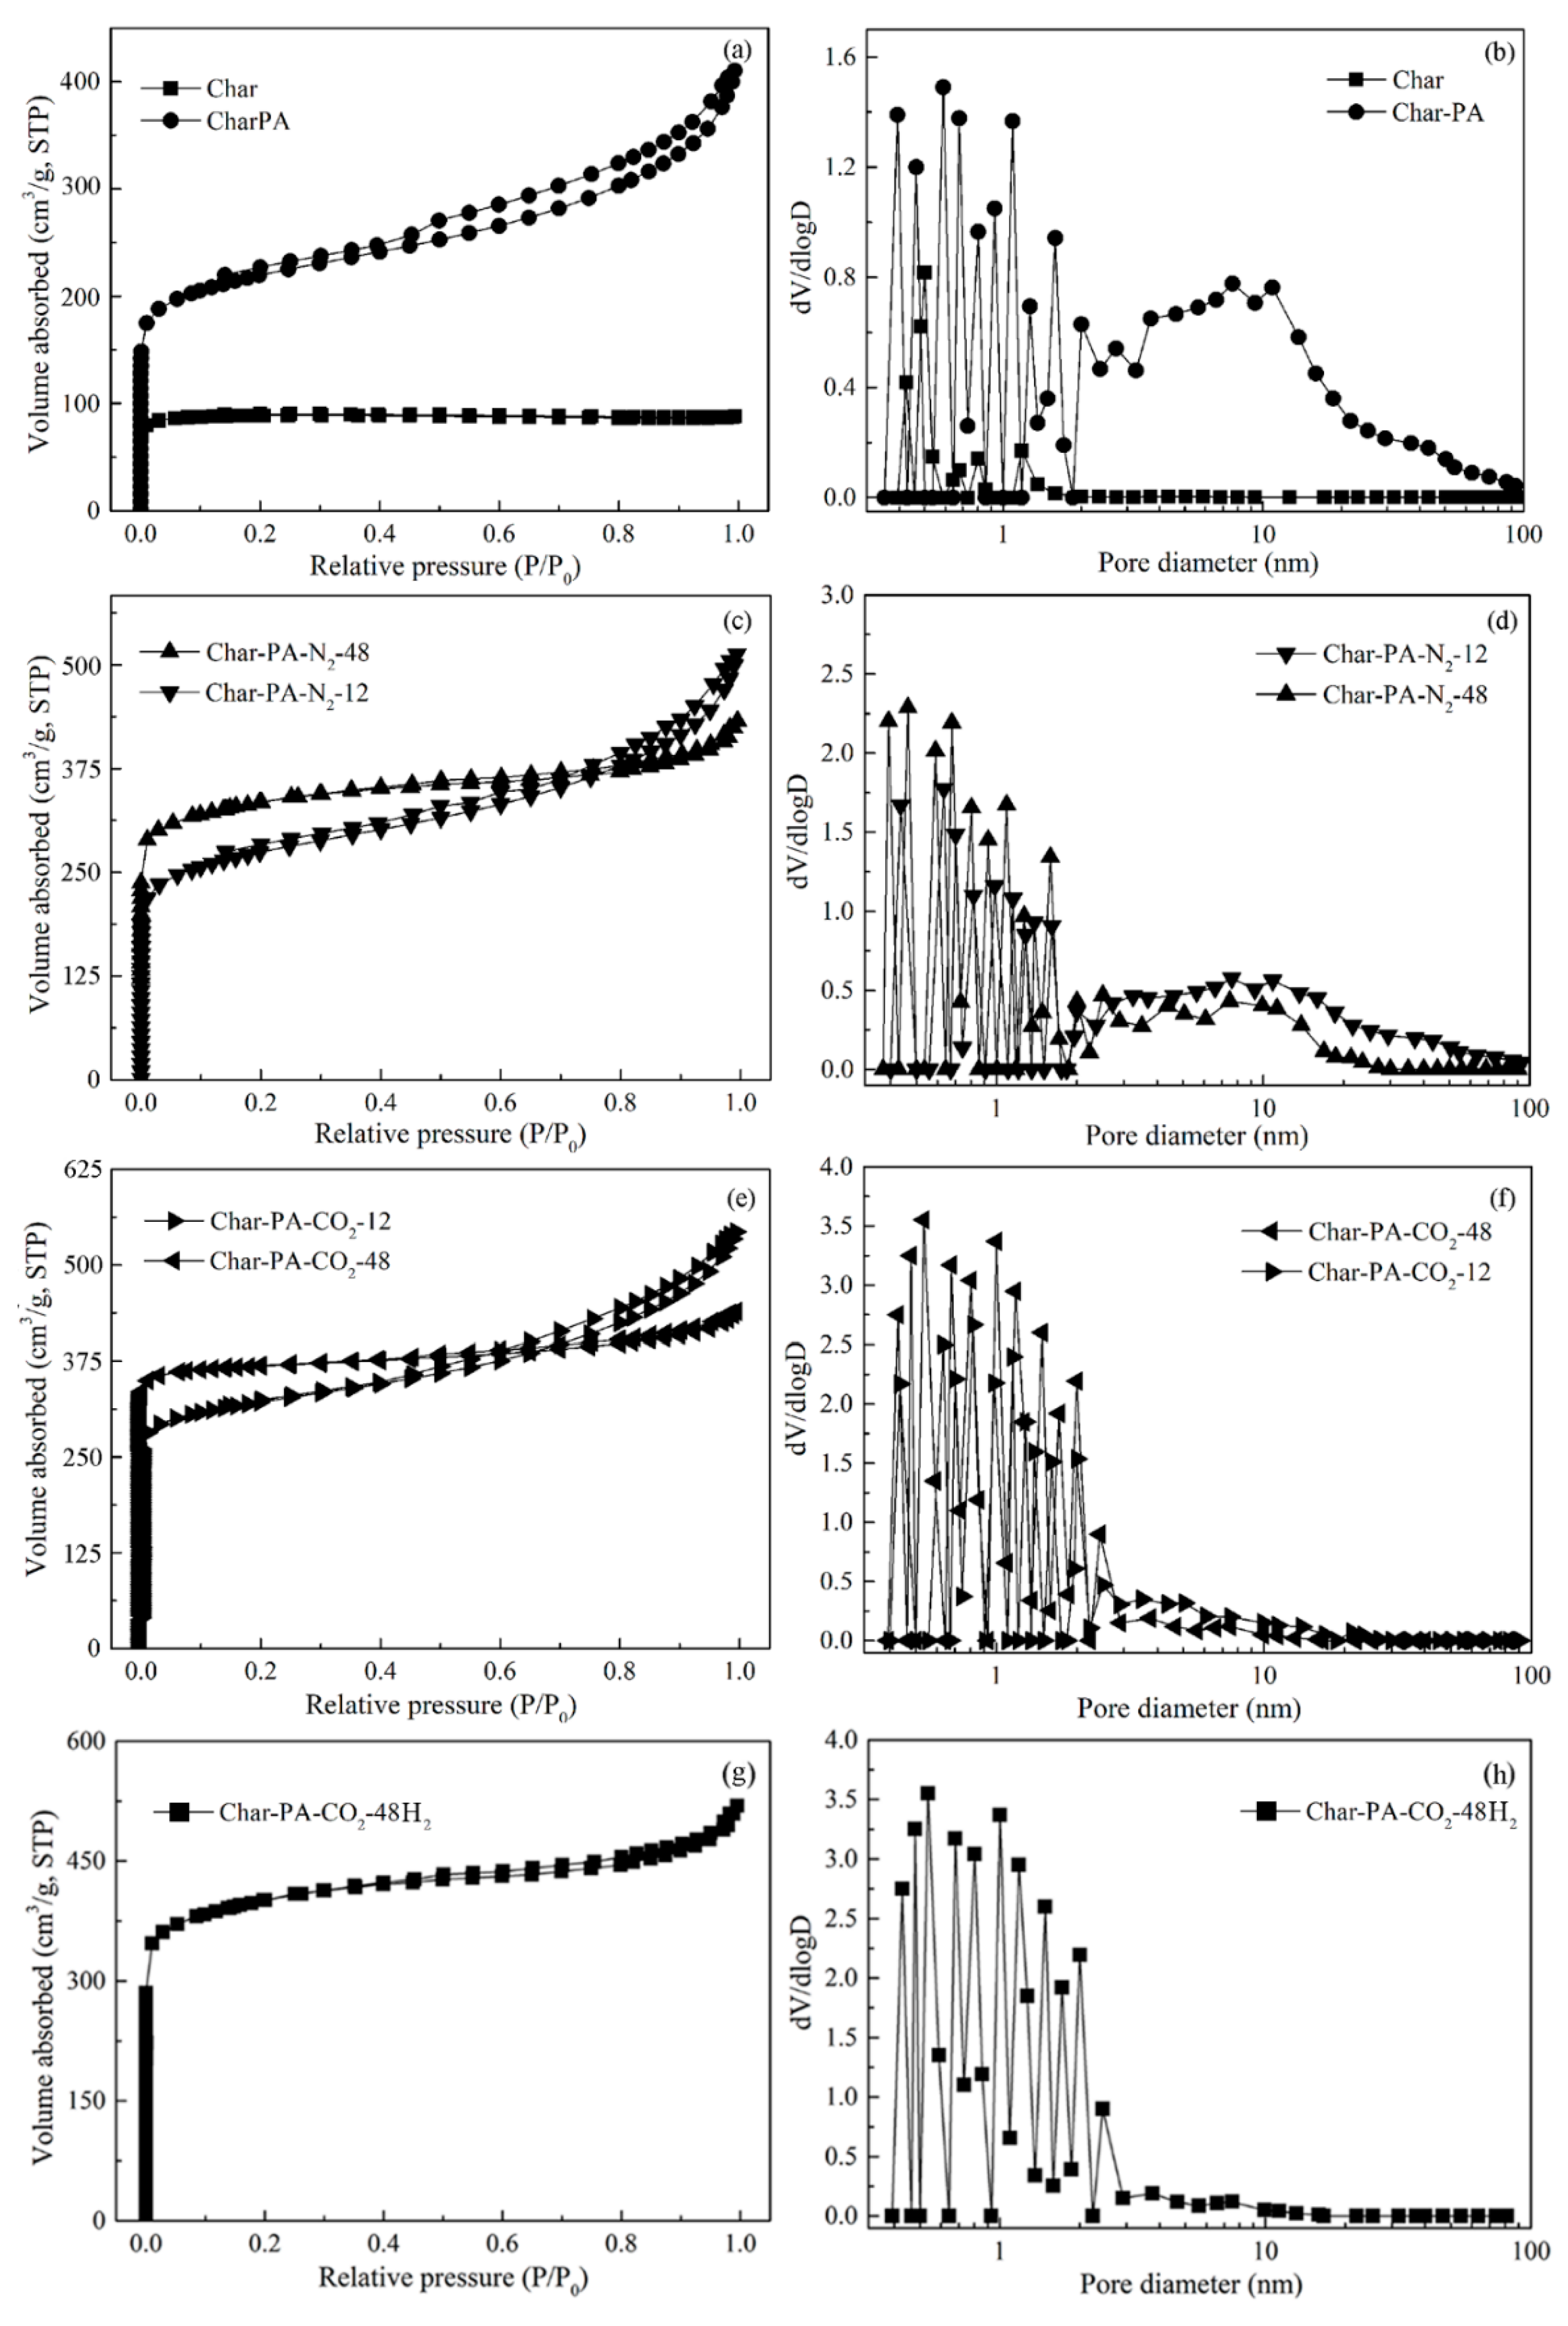
The N2 adsorption isotherm and pore-size distribution of the samples under pyrolysis and different activation conditions are given in Figure 7, and the corresponding pore parameters are shown in Table 4.
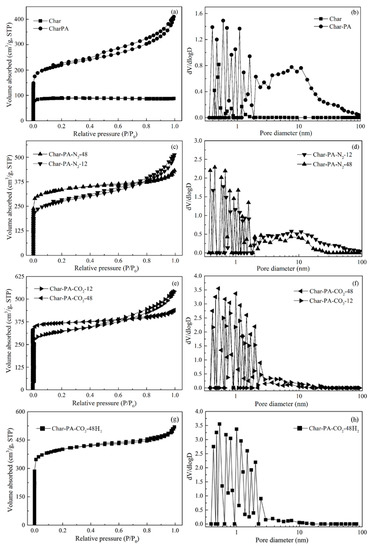
Figure 7.
(a,c,e,g) The N2 adsorption isotherm and (b,d,f,h) pore-size distribution of the samples at different treatment conditions.

Table 4.
The pore structure parameters of the samples at different treatment conditions.
First, the N2 adsorption isotherm of Char is attributed to a type I according to the IUPAC classification, and its N2 adsorption capacity is very small, showing small amounts of pores. The metaplast formed by the combination of transferable hydrogen with free radicals during pyrolysis can plug the pores, thus leading to an SBET value of 48.45 m2∙g−1, Vmic value of 0.034 m3∙g−1 and non-Vmic value of 29.17% for Char, with a narrow size distribution of less than 2 nm. Then, the N2 adsorption isotherm of Char-PA exhibits a typical characteristic of type IV, with the increase of the relative pressure from 0 to 1. This isotherm has begun to branch, and a hysteresis loop has also been formed with the increase of the relative pressure, indicating the formation of hierarchical pores. In the process of CO2 activation, some micropores can be formed at the initial stage of activation, after which these micropores can further be enlarged into mesopores and macropores with the prolongation of the activation time; finally, these mesopores and macropores, as channels, can promote the diffusion of activated gas to help the production of new micropores [17,18]. Therefore, the N2 adsorption capacities of Char-PA are higher than those of Char with the increase of the relative pressure, presenting an SBET value of 414.78 m2∙g−1 and Vmic value of 0.1 m3∙g−1. However, the non-Vmic value of 58.33% of Char-PA with a wide pore distribution indicates the rapid development of mesopores and macropores instead of that of micropores during CO2 activation.
After 12 h of high-energy ball milling, the N2 adsorption isotherms of Char-PA-CO2/N2-12 exhibit the typical characteristic of type IV, with an increase of the relative pressure from 0 to 1. With the increase of the ball-milling time from 12 to 48 h, the flat development of adsorption isotherms and a small hysteresis loop can also be found for Char-PA-CO2/N2-48, with high N2 adsorption capacities at a low pressure and presenting a rapid increase of the SBET and Vmic values and an obvious decrease of the non-Vmic value of Char-PA-CO2/N2-12/48, accompanied by a gradual narrowing of the pore size distribution. These changes indicate a sustained formation of new micropores and a rapid decrease of mesopores and macropores during the ball milling, which are related to the fact that the collapse of the mesopores and macropores caused by the strong mechanical collision brings about the production of new micropores. Furthermore, a stronger solid-gas reaction caused by the mechanical collision under dry ice can favor the development of the porous structure. Therefore, the variety of pore structures of Char-PA-CO2-12/48 is more obvious than that of Char-PA-N2-12/48 under the same ball-milling time.
3.5. Surface Chemical Structure Analysis of XPS
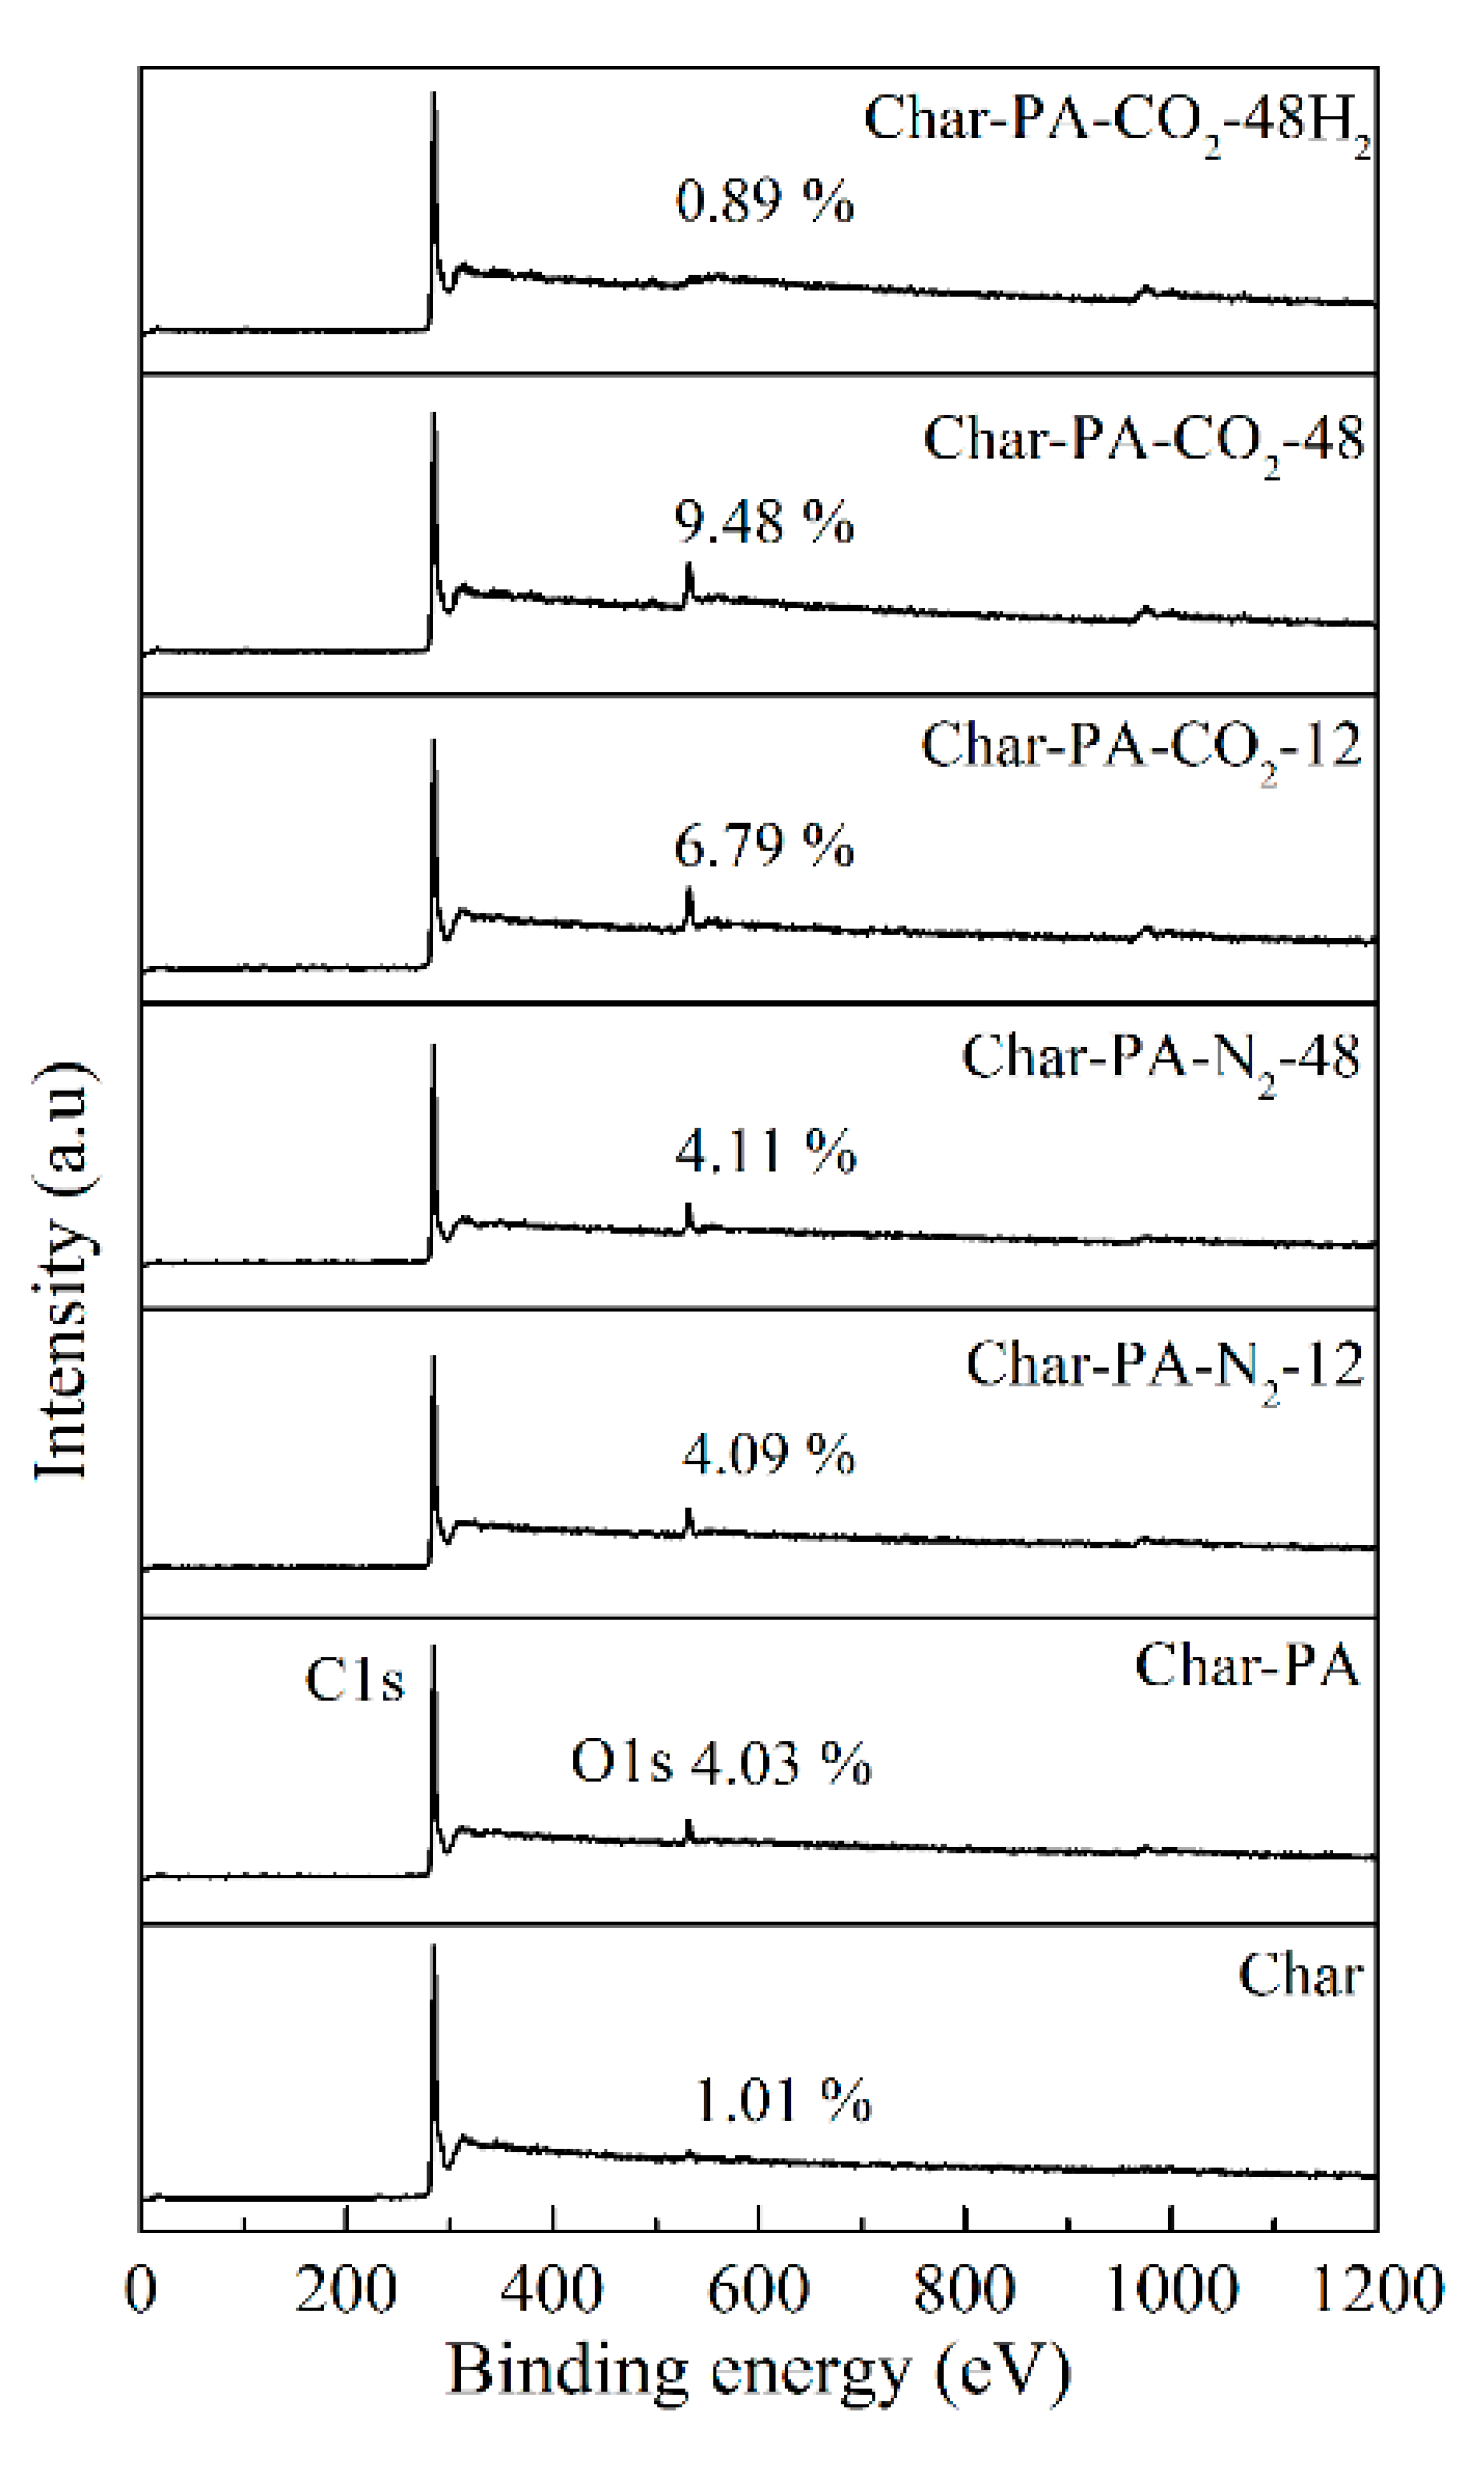
Figure 8 shows the broad scanning energy spectrum of all the samples, determined by XPS in the range of 10–1200 eV binding energy to obtain the strongest peak for most elements. There are two obvious peaks (C1s and O1s peaks) in Char-PA and Char-PA-N2/CO2-12/48, indicating the dominant position of C and O in the element composition; however, the disappearance of the O1s peak of Char is related to the release of the oxygen elements in the form of small molecules (such as CO, CO2) during pyrolysis. With the increase of the ball-milling time from 12 to 48 h, there is a slight increase in the oxygen content of Char-PA-N2-12/48 from 4.09% to 4.11%. A ball milling under dry ice can rapidly promote the combination of surface unsaturated carbon atoms with CO2 to fix a large number of O atoms in the form of oxygen-containing functional groups; thus, the oxygen content of Char-PA-CO2-12/48 increases rapidly from 6.79% to 9.48%.
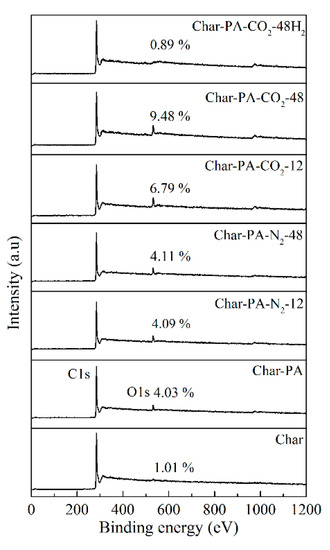
Figure 8.
The survey XPS spectra of the samples at different treatment conditions.
In carbon materials, surface oxygen-containing functional groups are the most important functional groups that have been identified as affecting the surface chemical properties of carbon materials. In order to further explore the types and contents of oxygen functional groups on the surface of Char-PA and Char-PA-N2/CO2-12/48 quantitatively, the O1s peak of five samples is fitted and analyzed according to different binding energies, as follows: carboxyl or ester carbon (C=O) at 530.9 eV, phenolic hydroxyl or ether (C–O) at 532.4 eV, carboxyl or ester carbon (O–C=O) at 533.8 eV and chemisorbed O2 (or H2O) at 535.2 eV. The results of the curve fitting of the five samples are given in Table 5. In addition, the XPS spectra of Char and Char-PA-CO2-48H2 are not treated further using the fitting method due to a minor oxygen content. After CO2 activation, the carbonyl and quinone group (C=O) of Char-PA accounts for the most part (39.6%); its phenol and ether group (C–O) takes second place (27.3%), and the carboxyl group or ester group (O–C=O) and chemisorbed O (or H2O) come last (18.4% and 14.7%) out of all the oxygen-containing functional groups. After ball milling under N2, the proportions of C=O, C–O and O–C=O of Char-PA-N2-12/48 are gradually consistent with each other with the prolongation of the ball-milling time. After ball milling under dry ice, the proportion of O–C=O of Char-PA-CO2-12/48 increases and its proportion of C–O, C=O decreases gradually, indicating the existence of oxidation phenomena. The above results illustrate that the content and type of oxygen-containing groups in the samples can be controlled by the ball-milling treatment in different atmospheres.

Table 5.
The results of the curve fitting of Char-PA and Char-PA-N2/CO2-12/48 in O1s from the XPS spectra.
3.6. Study of SO2 Adsorption
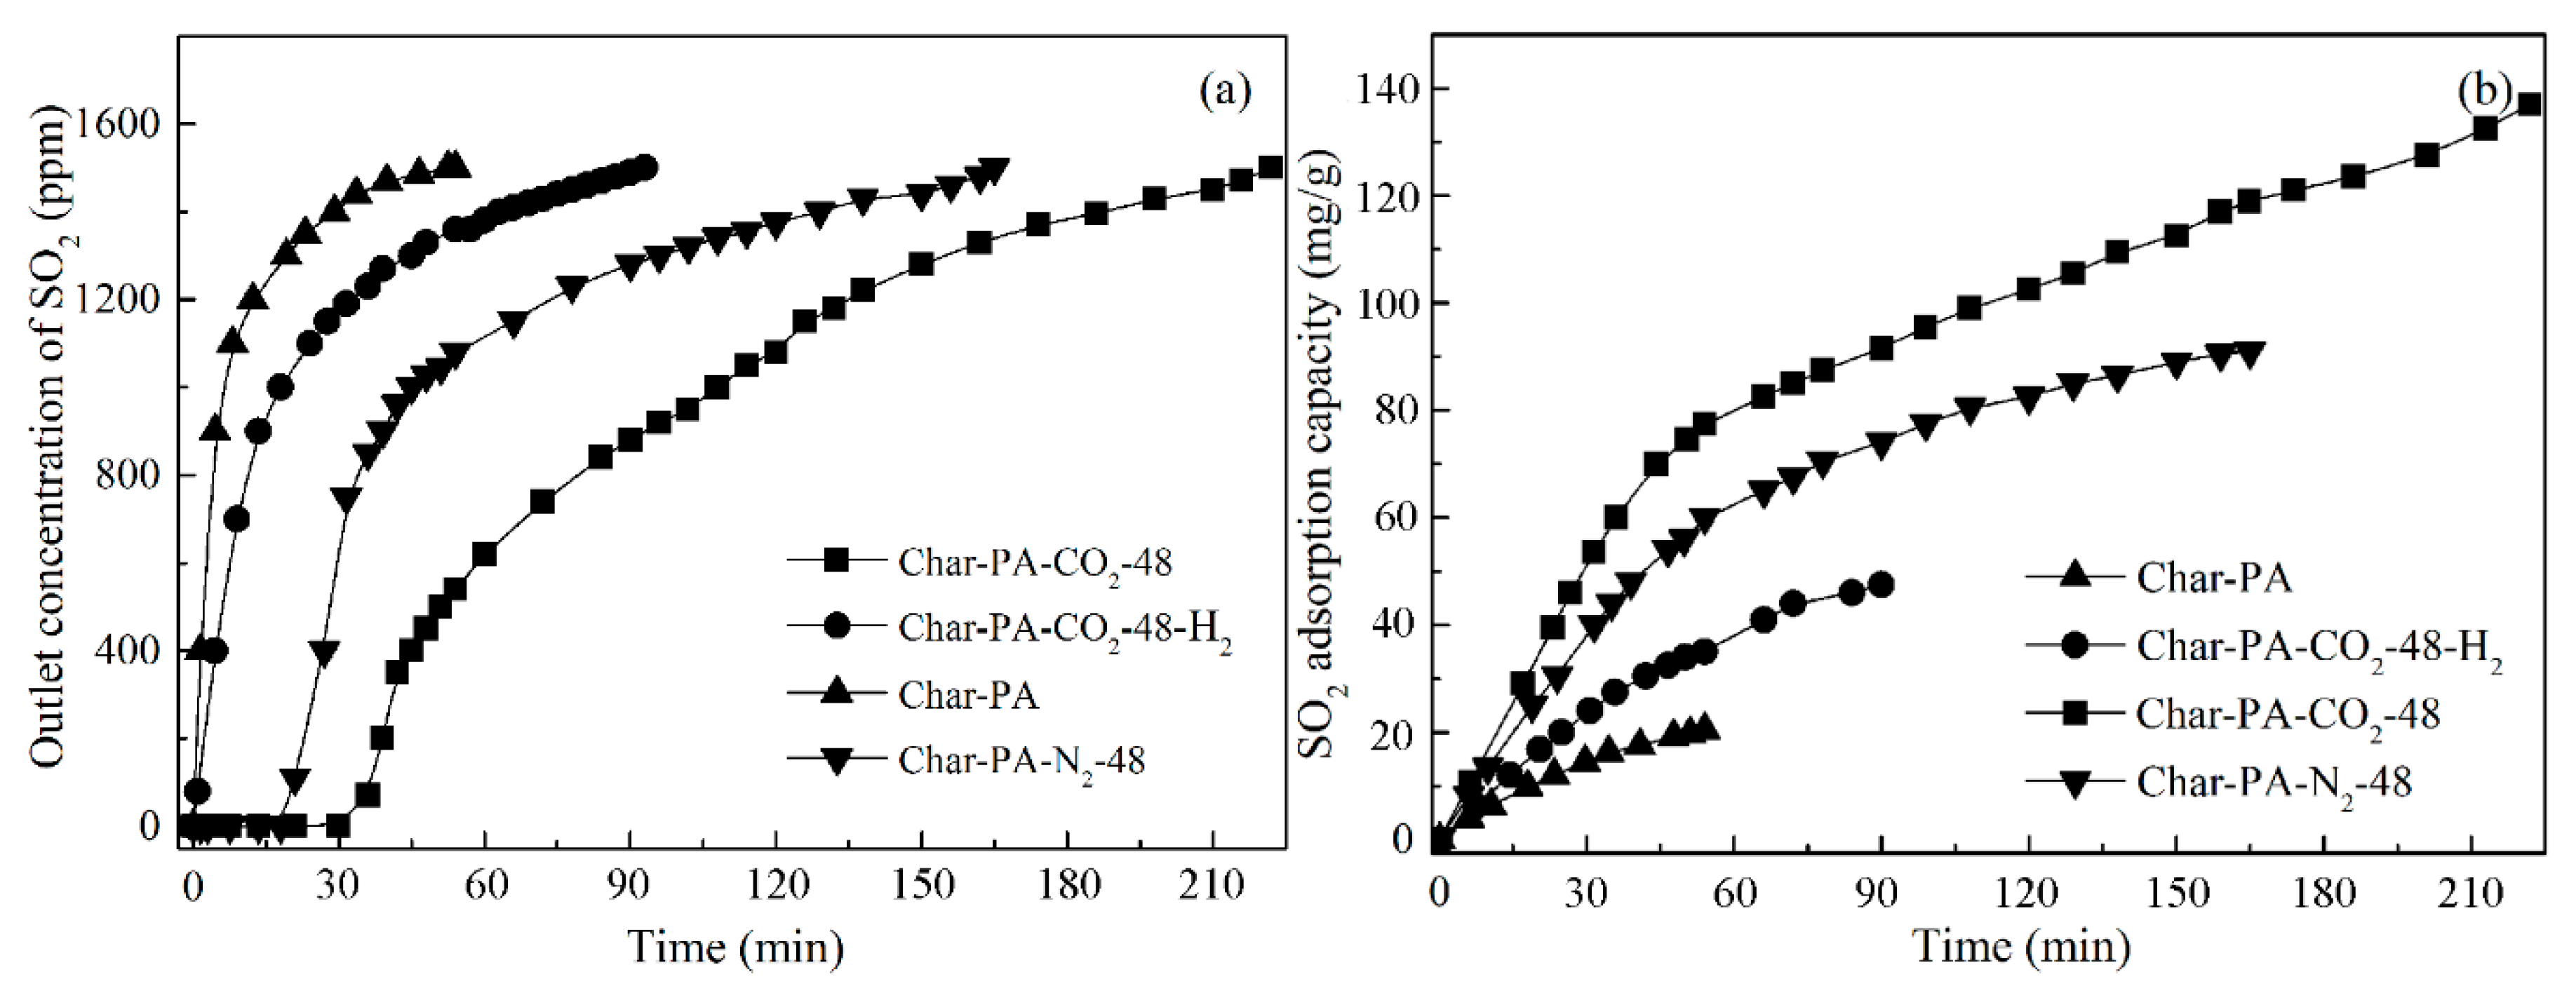
In order to further explore the effect of the physicochemical structure of ACson SO2 adsorption, an SO2 adsorption test of Char-PA, Char-PA-N2-48, Char-PA-CO2-48 and Char-PA-CO2-48-H2 from a simulated flue gas is performed at 80 °C for 210 min. In these tested samples, Char-PA-CO2-48-H2 is obtained via a thermal annealing treatment of Char-PA-CO2-48 at 800 °C for 1 h in 5% H2/Ar atmosphere, and the results of the physicochemical structure and corresponding parameters are given in Figure 2, Figure 3, Figure 4, Figure 5, Figure 6, Figure 7 and Figure 8 and Table 2, Table 3 and Table 4. It can be found that the thermal annealing process has removed almost all of oxygen-containing functional groups (the oxygen content is only 0.89% in Figure 8) but cannot further change its porosity, microstructure and surface morphology. The results of the SO2 removal of Char-PA, Char-PA-N2-48, Char-PA-CO2-48 and Char-PA-CO2-48-H2 are shown in Figure 9.
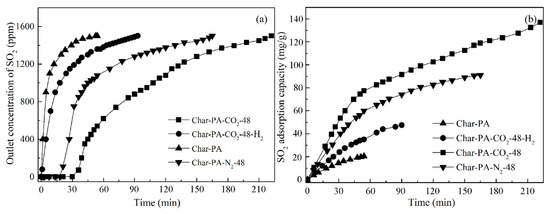
Figure 9.
SO2 removal of typical ACs: (a) SO2 breakthrough curve and (b) SO2 adsorption quantity.
First, the efficient adsorption of Char-PA is mainly presented within only 60 min, while the SO2 concentrations of the gas outlet arrive quickly 1500 ppm; this result indicates that Char-PA has already been penetrated by SO2. In addition, Char-PA can only achieve 21.2 mg/g at the end of the experiment. Therefore, Char-PA, with undeveloped pores and fewer activated sites, can only maintain an efficient SO2 adsorption and conversion at the initial stage. Then, the SO2 adsorption of Char-PA-CO2-48 can be maintained at 100% within 30 min. After that, there is a slow increase from 70 to 1500 ppm in the SO2 concentrations of the gas outlet, and its SO2 adsorption capacity can reach 138.5 mg/g at the end of the experiment. Remarkably, Char-PA-N2-48, with relatively developed pores and some active sites, also has a relatively high SO2 adsorptive capacity (92.2 mg/g) at the end of the experiment, and its SO2 adsorption curve is similar to the curve of Char-PA-CO2-48. In the presence of O2 and H2O, the SO2 removal of porous carbon is a multi-step heterogeneous reaction. First, SO2, O2 and H2O can be rapidly absorbed by a lot of micropores, inside of which the oxidation and hydration of SO2 with O2 and H2O is further catalyzed by active sites to form H2SO4 [45]; after that, the active sites can continue to migrate H2SO4 from micropores to meso-/macro-pores to release the microporous space [46]. Therefore, Char-PA-CO2-48, with a large quantity of micropores and active sites, presents a high adsorption capacity as compared to that of samples in the previous literatures [47,48,49]. In addition, Char-PA-CO2-48-H2, with a large number of micropores and fewer active sites, has a limited adsorptive capacity (48.7 mg/g) at the end of the experiment, and its SO2 adsorption curve is similar to the curve of Char-PA. In the desulphurization process of Char-PA-CO2-48-H2, SO2 can be adsorbed effectively by its micropores in the initial stage, but the adsorbed SO2 within the micropores cannot be further catalyzed and migrated into the mesopores and macropores due to its limited active sites.
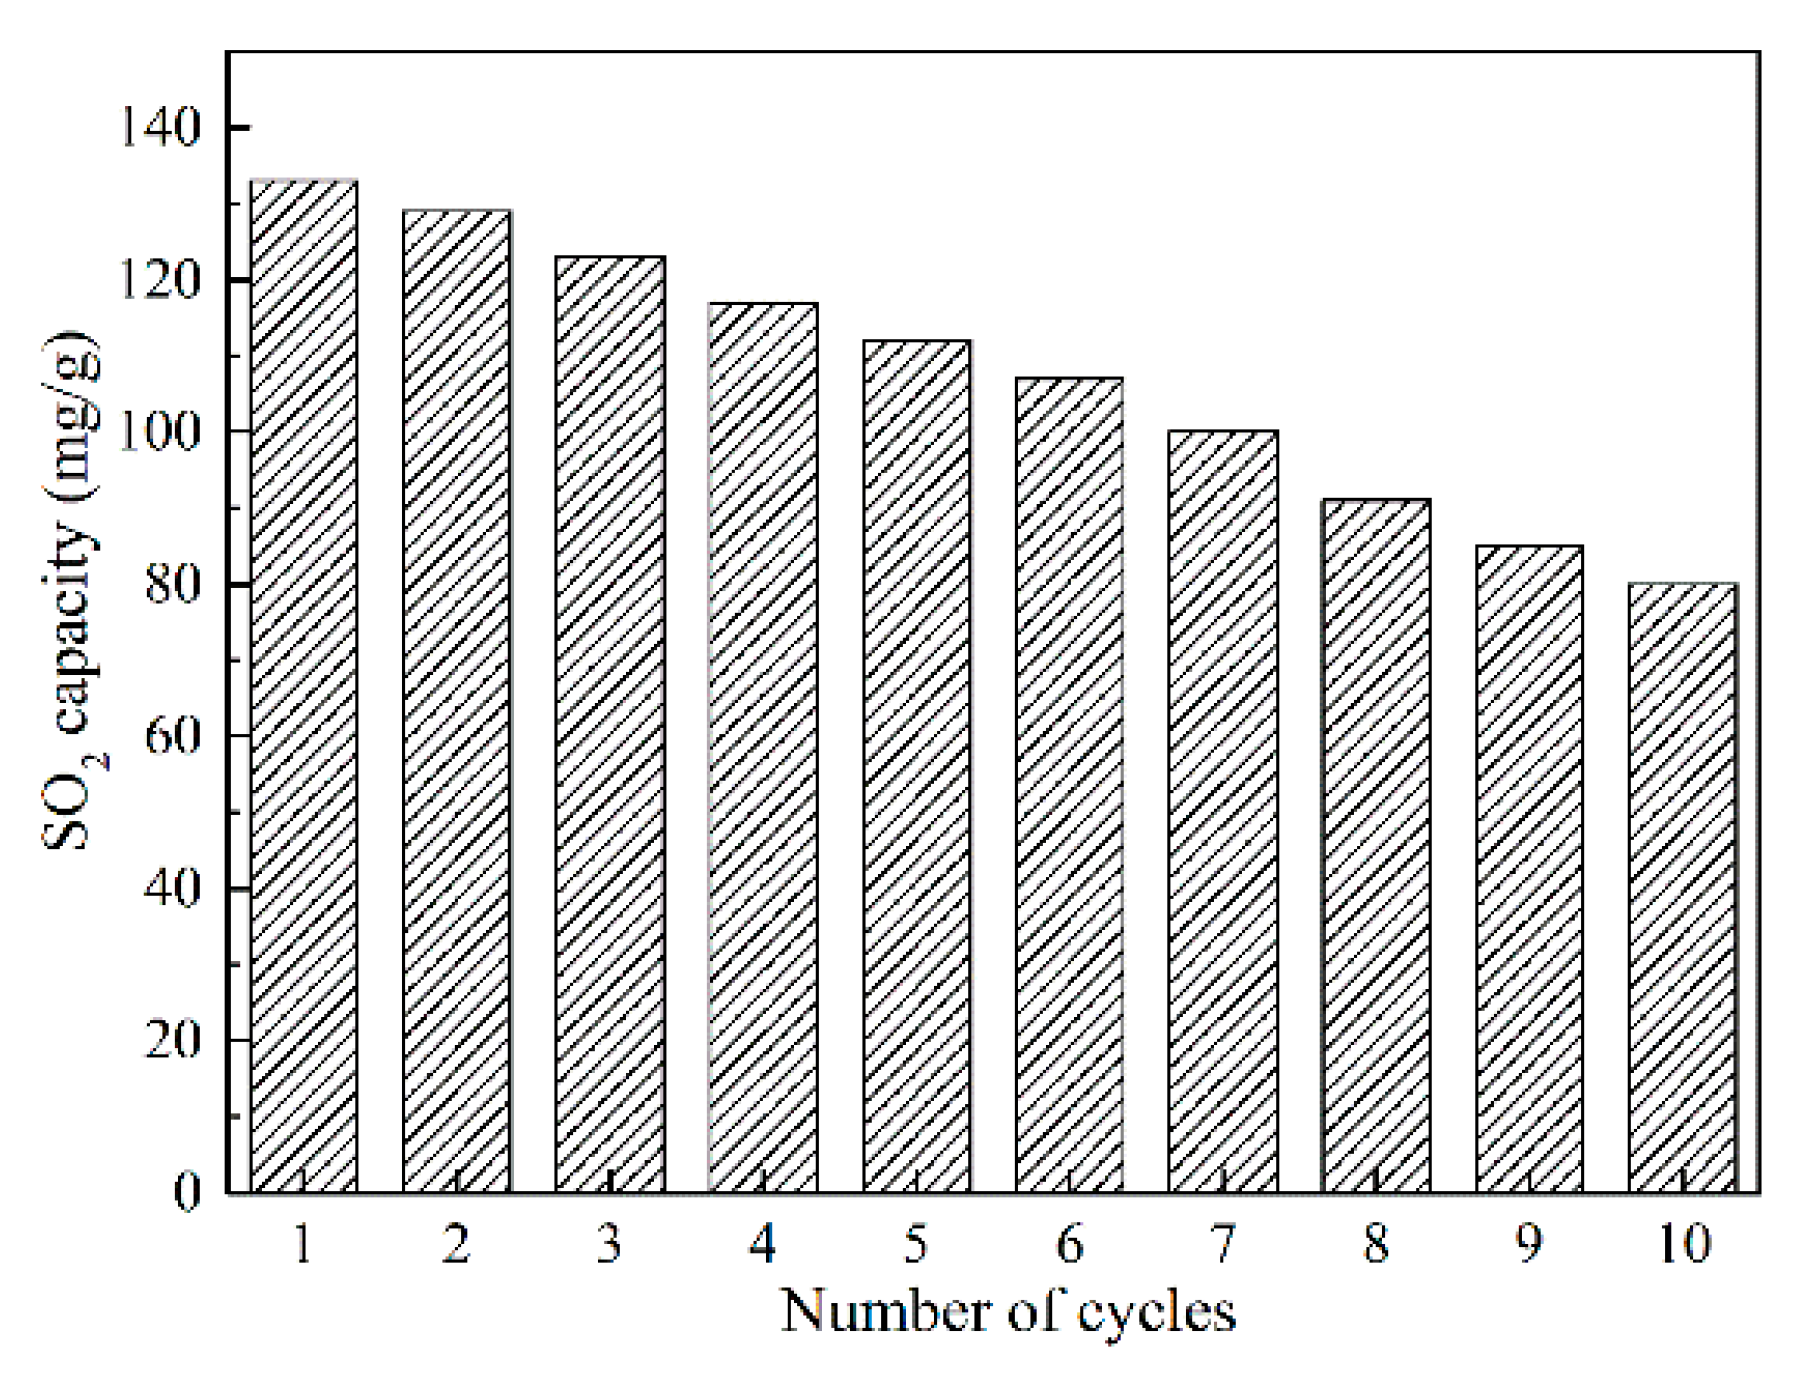
In order to measure the cyclic desulfurization performance of the prepared adsorbent, a thermal regeneration of Char-PA-CO2-48 is performed at 400 °C for 30 min in N2 atmosphere, and the corresponding result is given in Figure 10. The SO2 removal capacities of Char-PA-CO2-48 exhibit a general decreasing trend from 133.3 mg/g in the first-time desulfurization to 81.2 mg/g in the 10th cycle. Pi et al. [47] found that the pore structure and chemically active sites were damaged during a long-time (30 min), high-temperature (400 °C) and repeated thermal-treatment process, thus leading to rapidly decreased SO2 removal capacities.
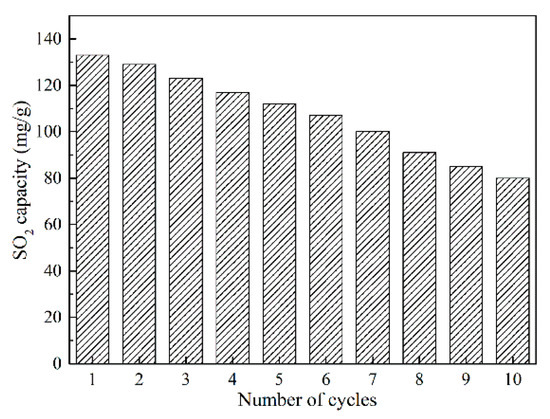
Figure 10.
SO2 removal capacities vs. cycling number of Char-PA-CO2-48.
4. Conclusions
The effect of physical and mechanical activation on the physicochemical structure of coal-based activated carbons (ACs) for SO2 adsorption has been investigated in this work. Char, using Jixi bituminous coal as raw materials obtained by pyrolysis, is activated sequentially via physical and mechanical methods. The results of the physicochemical structure of a series of AC samples indicate that a substantial reduction in the defective structure at the edge of the aromatic layers and the rapid growth of the aromatic layers accompanied by the dehydrogenation of the aromatic rings result in the order transformation of microstructures of Char-PA and its severe carbon losses on the particle surfaces in the stage of CO2 activation. Furthermore, the oxygen content of Char-PA is increased to 4.03%, and the proportions of the different oxygen-containing functional groups in Char-PA are as follows: C=O (39.6%), C–O (27.3%), O–C=O (18.4%) and chemisorbed O (or H2O) (14.7%). The pore development of Char-PA follows a hierarchical model, leading to a relatively low SBET value (414.78 m2/g) and a high value of Non-Vmic (58.33%). Char-PA with undeveloped pores and fewer activated sites can only maintain an efficient SO2 adsorption and conversion within 60 min and achieve 21.2 mg/g at the end of the experiment. In the subsequent mechanical activation under N2 and dry ice from 12 to 48 h, the strong mechanical collision can improve the surface morphology and destroy the parallelism of the aromatic layers and the constancy of the interlayer spacing, resulting in the disordered conversion of the microstructure and the formation of more defective structures with the prolonging of the ball-milling time. In addition, the collapse of mesopores and macropores caused by a strong ball milling facilitates the formation of more micropores, leading to a sustained increase in the SBET value from 715.89 to 1259.74 m2/g and of the micropore volume from 0.22 to 0.34 m3/g, as well as a sustained decrease in Non-Vmic from 33.33 to 19.05% with the prolonging of the ball-milling time. However, the oxygen content of Char-PA-N2-12/48 increases slowly from 4.09 to 4.11%, presenting a similar distribution proportion, whereas the oxygen content of Char-PA-CO2-12/48 increases rapidly from 6.79 to 9.48%, presenting an increased proportion of O–C=O and a decreased proportion of C–O, C=O. It is worth noting that the varieties of physicochemical parameters of Char-PA-CO2-12/48 are more obvious than those of Char-PA-N2-12/48 under the same ball-milling time, which is related to the strong solid-gas reactions between CO2 and the carbon matrix caused by the mechanical collision under dry ice. The desulfurization efficiency of Char-PA-CO2-48 with a desirable physicochemical structure can be maintained at 100% within 30 min and reached 138.5 mg/g. Char-PA-N2-48 has a similar structure to Char-PA-CO2-48, thus presenting a relatively high SO2 adsorptive capacity (92.2 mg/g). Char-PA-CO2-48-H2, with fewer active sites obtained by the thermal annealing treatment, has a limited adsorptive capacity (48.7 mg/g) at the end of the experiment. After the 10th cycle of thermal regeneration, Char-PA-CO2-48 still has a strong adsorptive capacity (81.2 mg/g).
Author Contributions
D.L., S.L. and W.F. conceived and designed the experiments; X.Z., R.S. and Z.H. carried out the experiments; D.L. wrote the paper; D.L. and B.J. reviewed the paper.
Funding
This research was funded by National Natural Science Foundation of China, grant number 51806080, and Scientific Research Fund Project of Jilin Agricultural University, grant number 201801, and Jilin Province Education Department Science and Technology Program during the Thirteenth Five-year Plan Period, grant number JJKH20190940KJ.
Conflicts of Interest
The authors declare no conflict of interest.
References
- Liu, D.D.; Gao, J.H.; Cao, Q.X.; Wu, S.H.; Qin, Y.K. Improvement of activated carbon from Jixi bituminous coal by air peroxidation. Energy Fuels 2017, 31, 1406–1415. [Google Scholar] [CrossRef]
- Sumathi, S.; Bhatia, K.S.; Lee, K.T.; Mohamed, A.R. Adsorption isotherm models and properties of SO2 and NO removal by palm shell activated carbon supported with cerium (Ce/PSAC). Chem. Eng. J. 2010, 162, 194–200. [Google Scholar] [CrossRef]
- Bahamon, D.; Vega, L.F. Systematic evaluation of materials for post-combustion CO2 capture in a temperature swing adsorption process. Chem. Eng. J. 2016, 284, 438–447. [Google Scholar] [CrossRef]
- He, X.J.; Zhang, H.B.; Zhang, H. Direct synthesis of 3D hollow porous graphene balls from coal tar pitch for high performance supercapacitors. J. Mater. Chem. A 2014, 46, 19633–19640. [Google Scholar] [CrossRef]
- Parimal, C.B.; Aola, S.; Rituparna, K.; Mridushmita, B.; Chubaakum, P.; Dipak, S. Activated carbon synthesized from biomass material using single-step KOH activation for adsorption of fluoride: Experimental and theoretical investigation. Korean J. Chem. Eng. 2019, 36, 551–562. [Google Scholar] [CrossRef]
- Li, Y.T.; Pi, Y.T.; Lu, L.M. Hierarchical porous active carbon from fallen leaves by synergy of K2CO3, and their supercapacitor performance. J. Power Sources 2015, 299, 519–528. [Google Scholar] [CrossRef]
- Foo, K.Y.; Hameed, B.H. Preparation and characterization of activated carbon from sunflower seed oil residue via microwave assisted K2CO3 activation. Bioresour. Technol. 2010, 102, 9794–9799. [Google Scholar] [CrossRef]
- Ma, G.F.; Yang, Q.; Sun, K.J. Nitrogen-doped porous carbon derived from biomass waste for high-performance supercapacitor. Bioresour. Technol. 2015, 197, 137–142. [Google Scholar] [CrossRef]
- Elmouwahidi, A.; Bailón-García, E.; Pérez-Cadenas, A.F. Activated carbons from KOH and H3PO4-activation of olive residues and its application as supercapacitor electrodes. Electrochim. Acta 2017, 229, 219–228. [Google Scholar] [CrossRef]
- Rodríguez-Reinoso, F.; Molina-Sabio, M.; González, M.T. The use of steam and CO2 as activating agents in the preparation of activated carbons. Carbon 1995, 33, 15–23. [Google Scholar] [CrossRef]
- Yang, L.; Huang, T.; Jiang, X.; Jiang, W.J. Effect of steam and CO2activation on characteristics and desulfurization performance of pyrolusite modified activated carbon. Adsorption 2016, 22, 1099–1107. [Google Scholar] [CrossRef]
- Valente Nabais, J.M.; Nunes, P.; Carrott, P.J.M.; Carrott, M.M.L.R.; García, A.M.; Díaz-Díezb, M.A. Production of activated carbons from coffee endocarp by CO2 and steam activation. Fuel Process. Technol. 2008, 89, 262–268. [Google Scholar] [CrossRef]
- Zhu, Y.W.; Gao, J.H.; Li, Y.; Sun, F. Preparation of activated carbons for SO2 adsorption by CO2 and steam activation. J. Taiwan Inst. Chem. Eng. 2012, 43, 112–119. [Google Scholar] [CrossRef]
- Zhu, Y.W.; Gao, J.H.; Li, Y.; Sun, F.; Qin, Y.K. Preparation and characterization of activated carbons for SO2 adsorption from Taixi anthracite by physical activation with steam. Korean J. Chem. Eng. 2011, 28, 2344–2350. [Google Scholar] [CrossRef]
- Shu, S.; Guo, J.X.; Liu, X.L.; Wang, X.J.; Yin, H.Q.; Luo, D.M. Effects of pore sizes and oxygen-containing functional groups on desulfurization activity of Fe/NAC prepared by ultrasonic-assisted impregnation. Appl. Surf. Sci. 2016, 360, 684–692. [Google Scholar] [CrossRef]
- Davini, P. Adsorption and desorption of SO2 on active carbon: The effect of surface basic groups. Carbon 1990, 28, 565–571. [Google Scholar] [CrossRef]
- Shiratori, N.; Lee, K.J.; Miyawaki, J.; Hong, S.H.; Mochida, I.; An, B.; Yokogawa, K.; Jang, J.; Yoon, S.H. Pore structure analysis of activated carbon fiber by microdomain-based model. Langmuir 2009, 25, 7631–7637. [Google Scholar] [CrossRef]
- Liu, D.D.; Gao, J.H.; Wu, S.H.; Qin, Y.K. Effect of char structures caused by varying the amount of FeCl3 on the pore development during activation. RSC Adv. 2016, 6, 87478–87485. [Google Scholar] [CrossRef]
- Srinivas, G.; Yue, L.; Neal, S.; Taner, Y.; Zheng, X.G. Design of hyperporous graphene networks and their application in solid-amine based carbon capture systems. J. Mater. Chem. A 2017, 5, 17833–17840. [Google Scholar] [CrossRef]
- Hu, B.; Wang, K.; Wu, L.H.; Yu, S.H.; Antonietti, M.; Titirici, M.M. Engineering carbon materials from the hydrothermal carbonization process of biomass. Adv. Mater. 2010, 22, 813–828. [Google Scholar] [CrossRef]
- Wigmans, T. Industrial aspects of production and use of activated carbons. Carbon 1989, 27, 13–22. [Google Scholar] [CrossRef]
- Dahn, J.R.; Xing, W.; Gao, Y. The “falling cards model” for the structure of microporous carbons. Carbon 1997, 35, 825–830. [Google Scholar] [CrossRef]
- Liu, D.D.; Jia, B.Y.; Liu, X.; Zhao, B.J.; Gao, J.H.; Cao, Q.X.; Wu, S.H.; Qin, Y.K. Effects of oxygen functional groups and FeCl3 on the evolution of physico-chemical structure in activated carbon obtained from Jixi bituminous coal. RSC Adv. 2018, 8, 8569–8579. [Google Scholar] [CrossRef]
- Delogu, F.; Gorrasi, G.; Sorrentino, A. Fabrication of polymer nanocomposites via ball milling: Present status and future perspectives. Prog. Mater. Sci. 2017, 86, 75–126. [Google Scholar] [CrossRef]
- He, S.H.; Qin, Y.B.; Walid, E.; Li, L.; Cui, J.; Ma, Y. Effect of ball-milling on the physicochemical properties of maize starch. Biotechnol. Rep. 2014, 3, 54–59. [Google Scholar] [CrossRef]
- Ong, T.S.; Yang, H. Effect of atmosphere on the mechanical milling of natural graphite. Carbon 2000, 38, 2077–2085. [Google Scholar] [CrossRef]
- Zhang, L.M.; Zhang, R.; Zhan, L.; Qiao, W.M.; Liang, X.Y.; Ling, L.C. Efiect of ball-milling technology on pore structure and electrochemical properties of activated carbon. J. Shanghai Univ. (Engl. Ed.) 2008, 12, 372–376. [Google Scholar] [CrossRef]
- Salver-Disma, F.; Lenain, C.; Beaudoin, B.; Aymard, L.; Tarascon, J.M. Unique effect of mechanical milling on the lithium intercalation properties of different carbons. Solid State Ion. 1997, 98, 145–158. [Google Scholar] [CrossRef]
- Salver-Disma, F.; Tarascon, J.M.; Clinard, C.; Rouzaud, J.N. Transmission electron microscopy studies on carbon materials prepared by mechanical milling. Carbon 1999, 37, 1941–1959. [Google Scholar] [CrossRef]
- Liu, D.D.; Jia, B.Y.; Li, S.; Dong, L.J.; Gao, J.H.; Qin, Y.K. Effect of pyrolysis conditions on the improvement of the physicochemical structure of activated carbon obtained from Jixi bituminous coal. Asia Pac. J. Chem. Eng. 2019, 14, 1–12. [Google Scholar] [CrossRef]
- Pietrzak, R. XPS study and physico-chemical properties of nitrogen-enriched microporous activated carbon from high volatile bituminous coal. Fuel 2009, 88, 1871–1877. [Google Scholar] [CrossRef]
- Gong, X.Z.; Guo, Z.C.; Wang, Z. Variation of char structure during anthracite pyrolysis catalyzed by Fe2O3 and its influence on char combustion reactivity. Energy Fuels 2009, 23, 4547–4552. [Google Scholar] [CrossRef]
- Belhachemi, M.; Rios, R.V.; Addoun, F.; Silvestre-Albero, J.; Sepulveda-Escribano, A.; Rodrìguez-Reinoso, F. Preparation of activated carbon from date pits: Effect of the activation agent and liquid phase oxidation. J. Anal. Appl. Pyrolysis 2009, 86, 168–172. [Google Scholar] [CrossRef]
- Yang, K.B.; Peng, J.H.; Xia, H.Y.; Zhang, L.B.; Srinivasakannan, C.; Guo, S.H. Textural characteristics of activated carbon by single step CO2 activation from coconut shells. J. Taiwan Inst. Chem. Eng. 2010, 41, 367–372. [Google Scholar] [CrossRef]
- Heras, F.; Alonso-Morales, N.; Jimenez-Cordero, D.; Gilarranz, M.A.; Rodriguez, J.J. Granular mesoporous activated carbons from waste tires by cyclic oxygen chemisorption-desorption. Ind. Eng. Chem. Res. 2012, 51, 2609–2614. [Google Scholar] [CrossRef][Green Version]
- Karatepe, N.; Orbak, I.; Yavuz, R.; Özyuğuran, A. Sulfur dioxide adsorption by activated carbons having different textural and chemical properties. Fuel 2008, 87, 3207–3215. [Google Scholar] [CrossRef]
- He, X.F.; Jin, L.J.; Wang, D.; Zhao, Y.P.; Zhu, S.W.; Hu, H.Q. Integrated process of coal pyrolysis with CO2 reforming of methane by dielectric barrier discharge plasma. Energy Fuels 2011, 25, 4036–4042. [Google Scholar] [CrossRef]
- Li, W.; Zhu, Y.M. Structural characteristics of coal vitrinite during pyrolysis. Energy Fuels 2014, 28, 3645–3654. [Google Scholar] [CrossRef]
- Davini, P. SO2 adsorption by activated carbons with various burnoffs obtained from a bituminous coal. Carbon 2001, 39, 1387–1393. [Google Scholar] [CrossRef]
- Li, T.; Zhang, L.; Li, D. Effects of gasification atmosphere and temperature on char structural evolution during the gasification of collie sub-bituminous coal. Fuel 2014, 117, 1190–1195. [Google Scholar] [CrossRef]
- Sasezky, A.; Muckenhuber, H.; Grothe, H. Raman microspectroscopy of soot and related carbonaceous materials: Spectral analysis and structural information. Carbon 2005, 43, 1731–1742. [Google Scholar] [CrossRef]
- Sathe, C.; Pang, Y.; Li, C.Z. Effects of heating rate and ion-exchangeable cations on the pyrolysis yields from a Victorian brown coal. Energy Fuels 1999, 13, 748–755. [Google Scholar] [CrossRef]
- Guo, X.; Tay, H.L.; Li, C.Z. Changes in char structure during the gasification of a Victorian brown coal in steam and oxygen at 800 °C. Energy Fuels 2008, 22, 4034–4038. [Google Scholar] [CrossRef]
- Li, Y.; Yang, H.P.; Hu, J.H.; Wang, X.H.; Chen, H.P. Effect of catalysts on the reactivity and structure evolution of char in petroleum coke steam gasification. Fuel 2014, 117, 1174–1180. [Google Scholar] [CrossRef]
- Gaur, V.; Asthana, R.; Verma, N. Removal of SO2 by activated carbon fibers inthe presence of O2 and H2O. Carbon 2006, 44, 46–60. [Google Scholar] [CrossRef]
- Sun, F.; Gao, J.; Liu, X.; Tang, X.; Wu, S. A systematic investigation of SO2 removal dynamics by coal-based activated cokes: The synergic enhancement effect of hierarchical pore configuration and gas components. Appl. Surf. Sci. 2015, 357, 1895–1901. [Google Scholar] [CrossRef]
- Pi, X.X.; Sun, F.; Gao, J.H.; Zhu, Y.W.; Wang, L.J.; Qu, Z.B.; Liu, H.; Zhao, G.B. Microwave irradiation induced high-efficiency regeneration for desulfurized activated coke: A comparative study with conventional thermal regeneration. Energy Fuels 2017, 31, 9693–9702. [Google Scholar] [CrossRef]
- Guo, Y.Y.; Li, Y.R.; Zhu, T.Y.; Ye, M.; Wang, X. Adsorption of SO2 and chlorobenzene on activated carbon. Adsorption 2013, 19, 1109–1116. [Google Scholar] [CrossRef]
- Guo, Y.Y.; Li, Y.R.; Zhu, T.Y.; Ye, M. Effects of concentration and adsorption product on the adsorption of SO2 and NO on activated carbon. Energy Fuels 2013, 27, 360–366. [Google Scholar] [CrossRef]
© 2019 by the authors. Licensee MDPI, Basel, Switzerland. This article is an open access article distributed under the terms and conditions of the Creative Commons Attribution (CC BY) license (http://creativecommons.org/licenses/by/4.0/).

