4.2. Unsteady Flow Characteristics
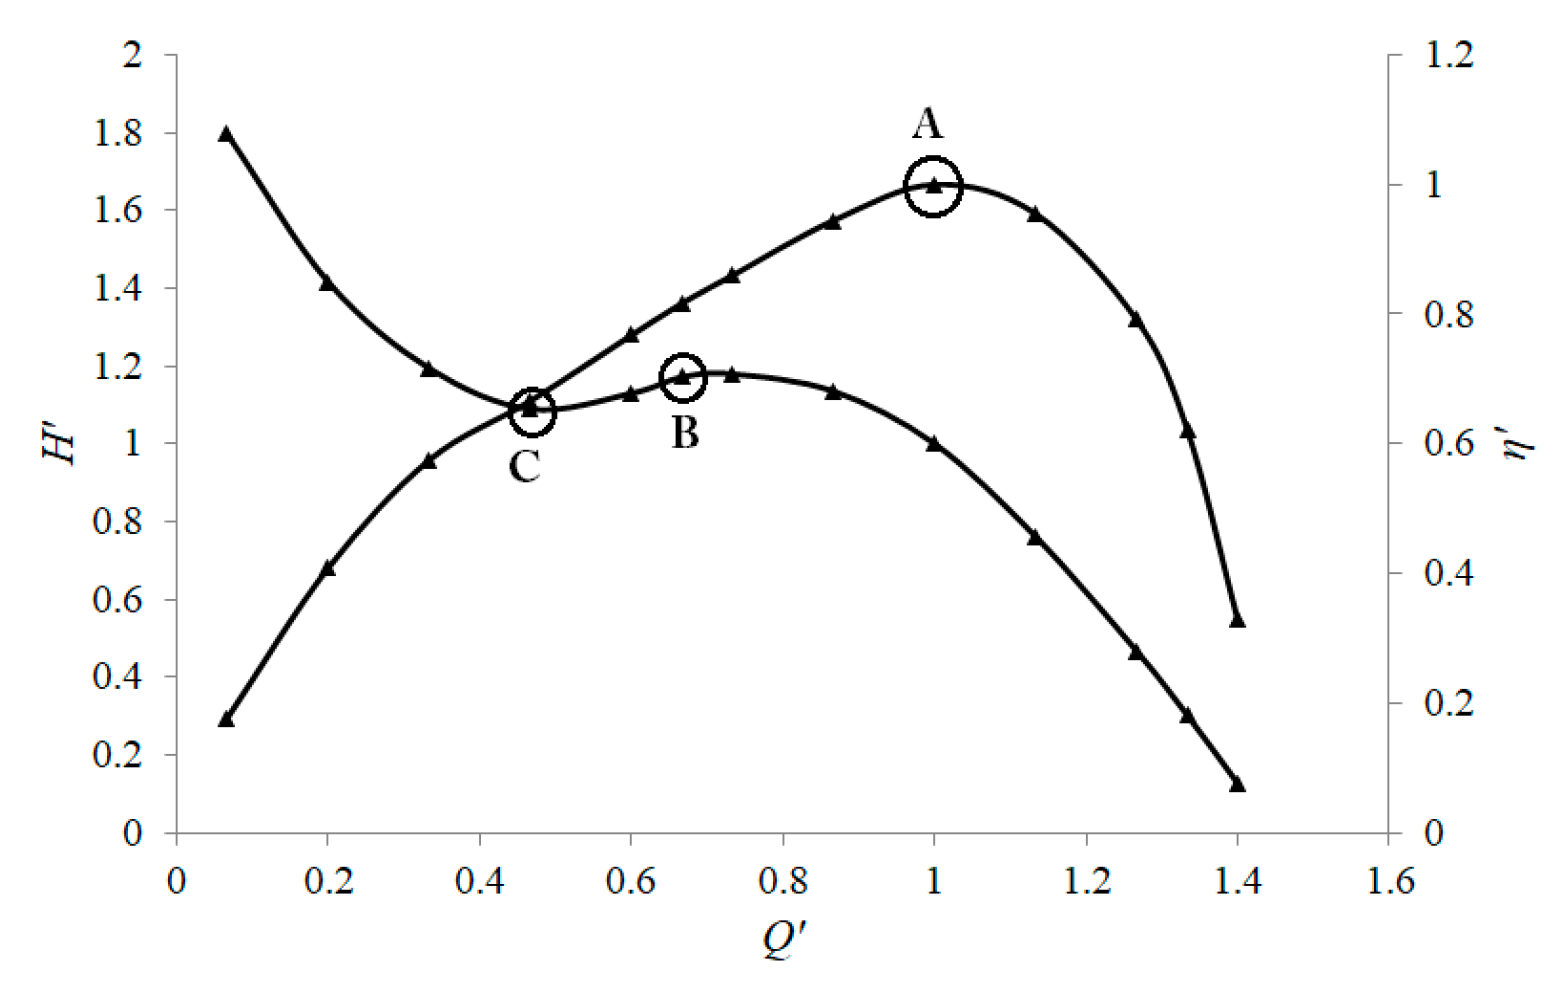
Condition A, condition B, and condition C are chosen to be calculated unsteadily and analyzed.
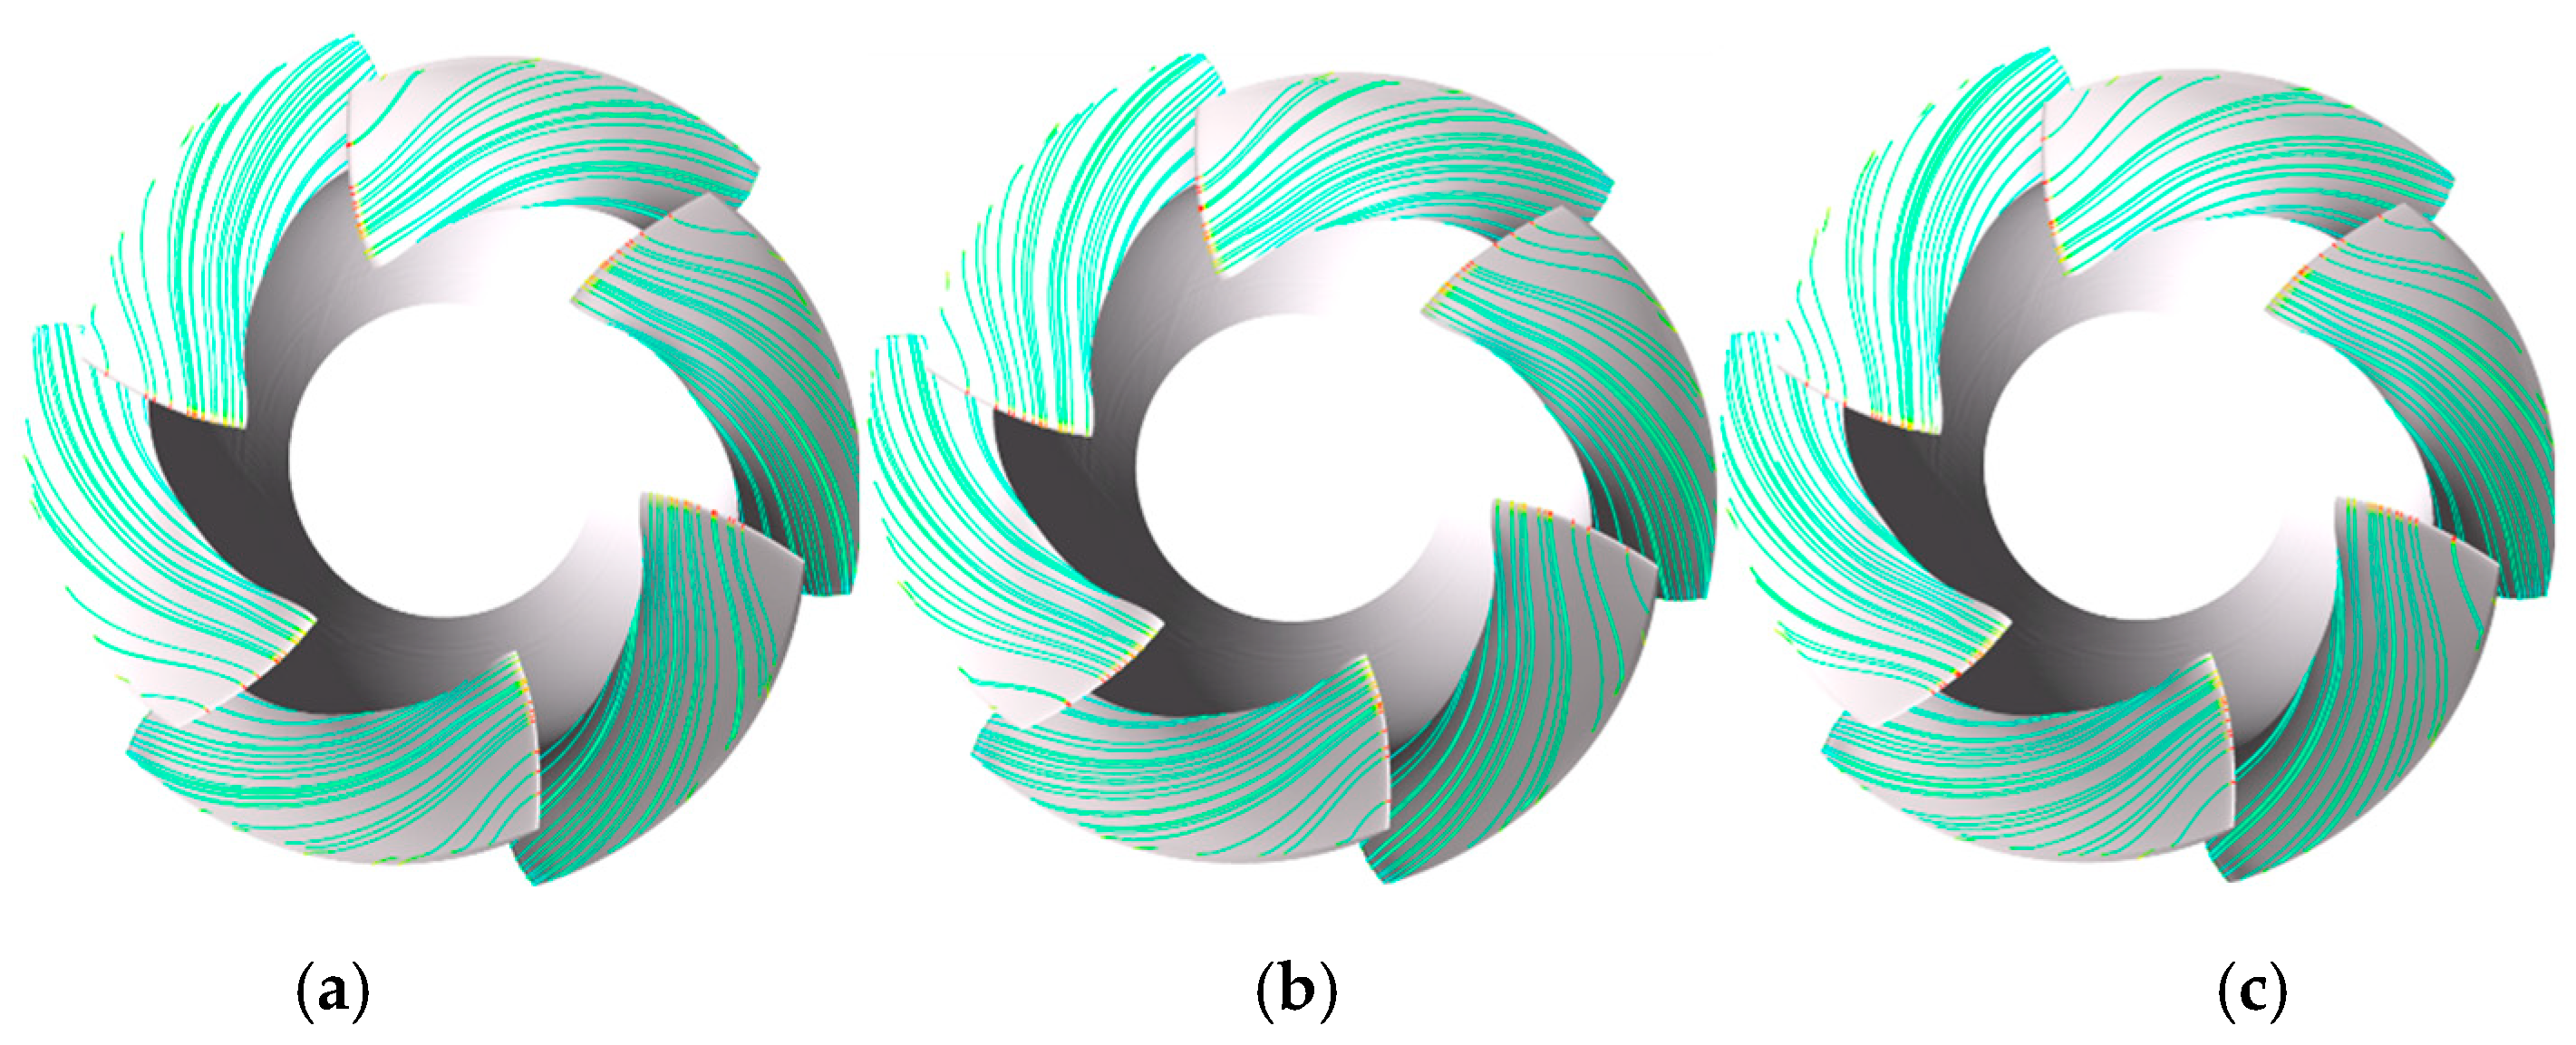
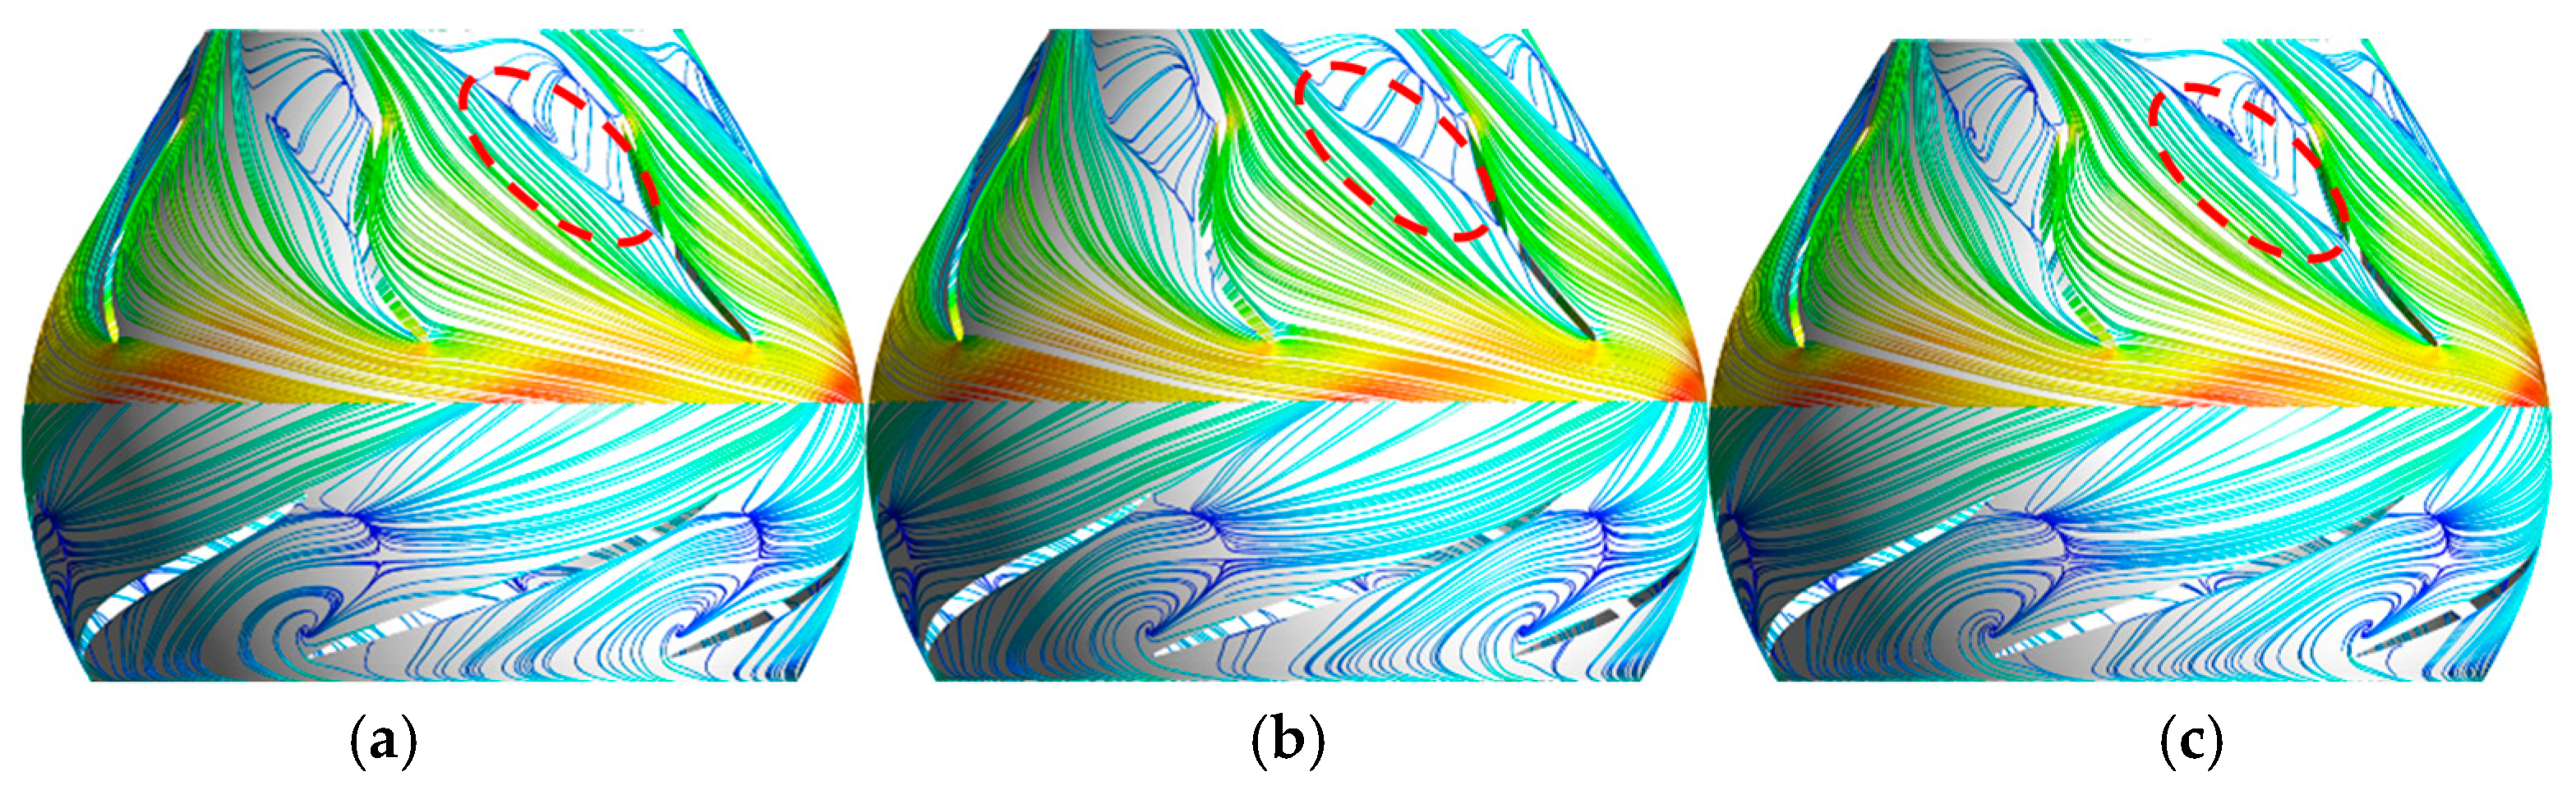
Figure 8,
Figure 9 and
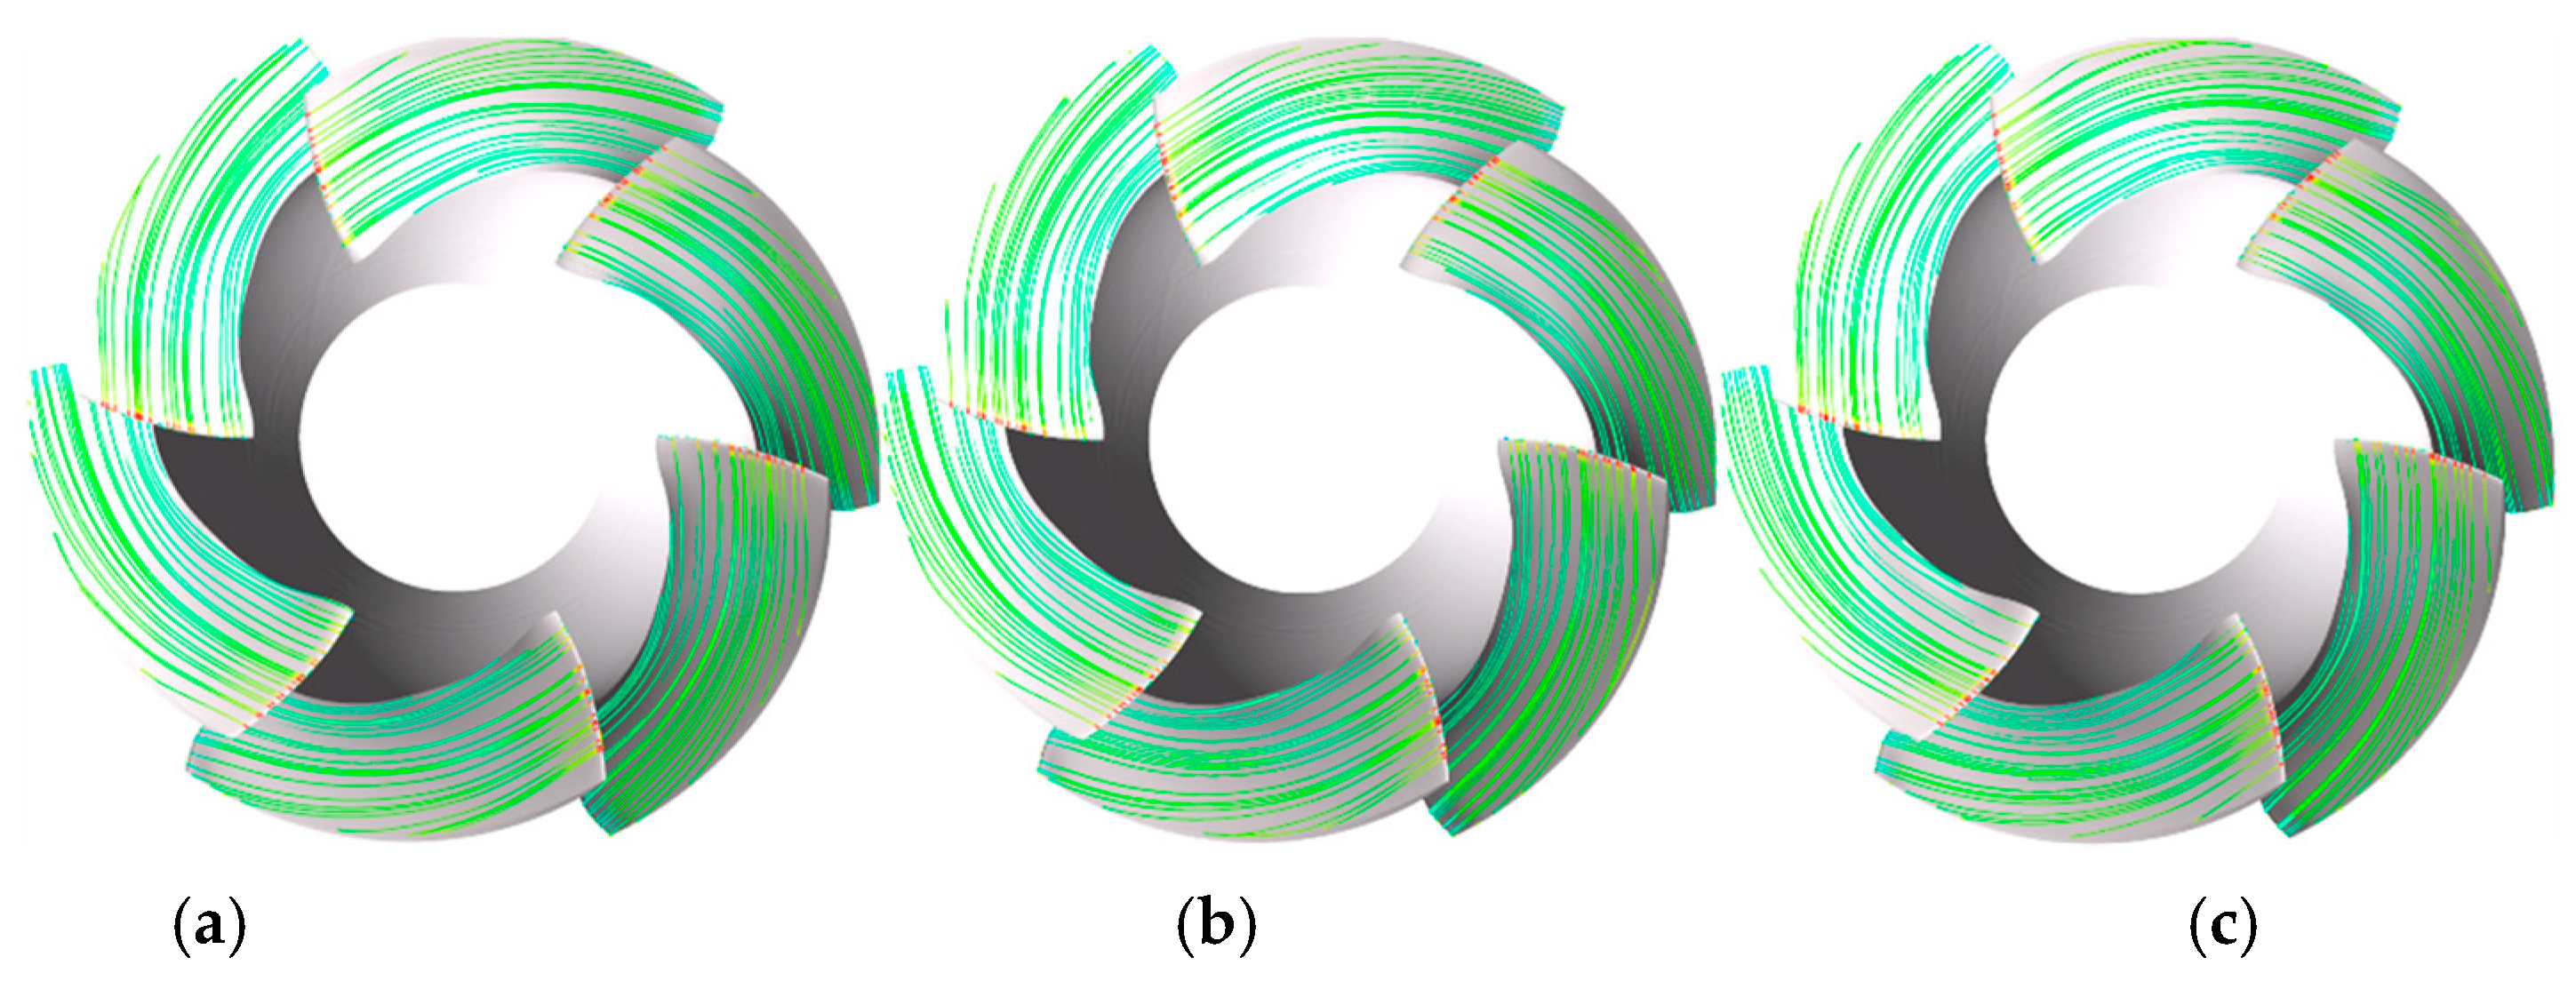
Figure 10 list the surface streamline on the blade of three time points (0T, 1/3T, and 2/3T) in the same period for condition A, B, and C. Under the condition A, surface streamlines on the suction side of each blade are smooth and the velocity at the leading edge is high. In the same period, surface streamline on the blade is stable with the lapse of time, which indicates that the pressure field and velocity field near the blade are stable under this condition. Under condition B, the stream at the leading edge flows to the trailing edge and the tip of the blade. The pressure field and velocity field near the blade are still stable. Under condition C, an evident vortex happens on the surface of the blade and the radial location of core vortex is span = 0.65. The size and shape of the vortex change with time, which indicates that the pressure field and velocity field near the blade are unstable.
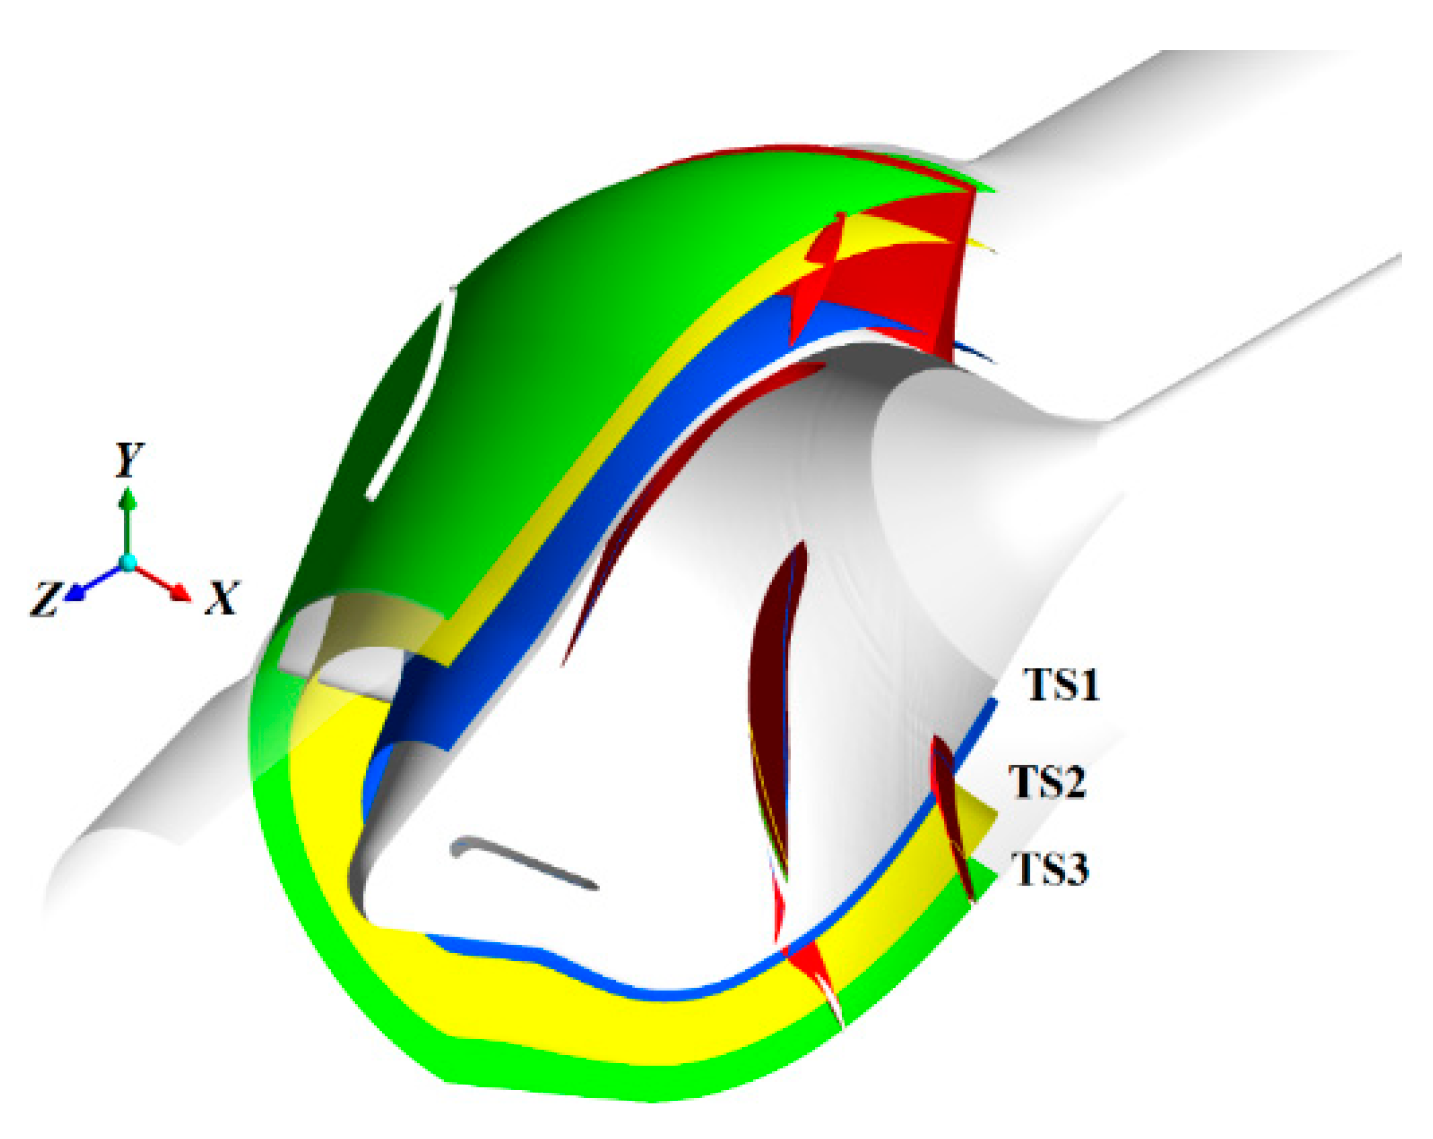
Three turbo surfaces from the hub to the shroud are sliced and recorded as TS1 (span = 0.1) near the hub, TS2 (span = 0.65) near the intermediate surface, and TS3 (span = 0.96) near the shroud, as shown in
Figure 11.
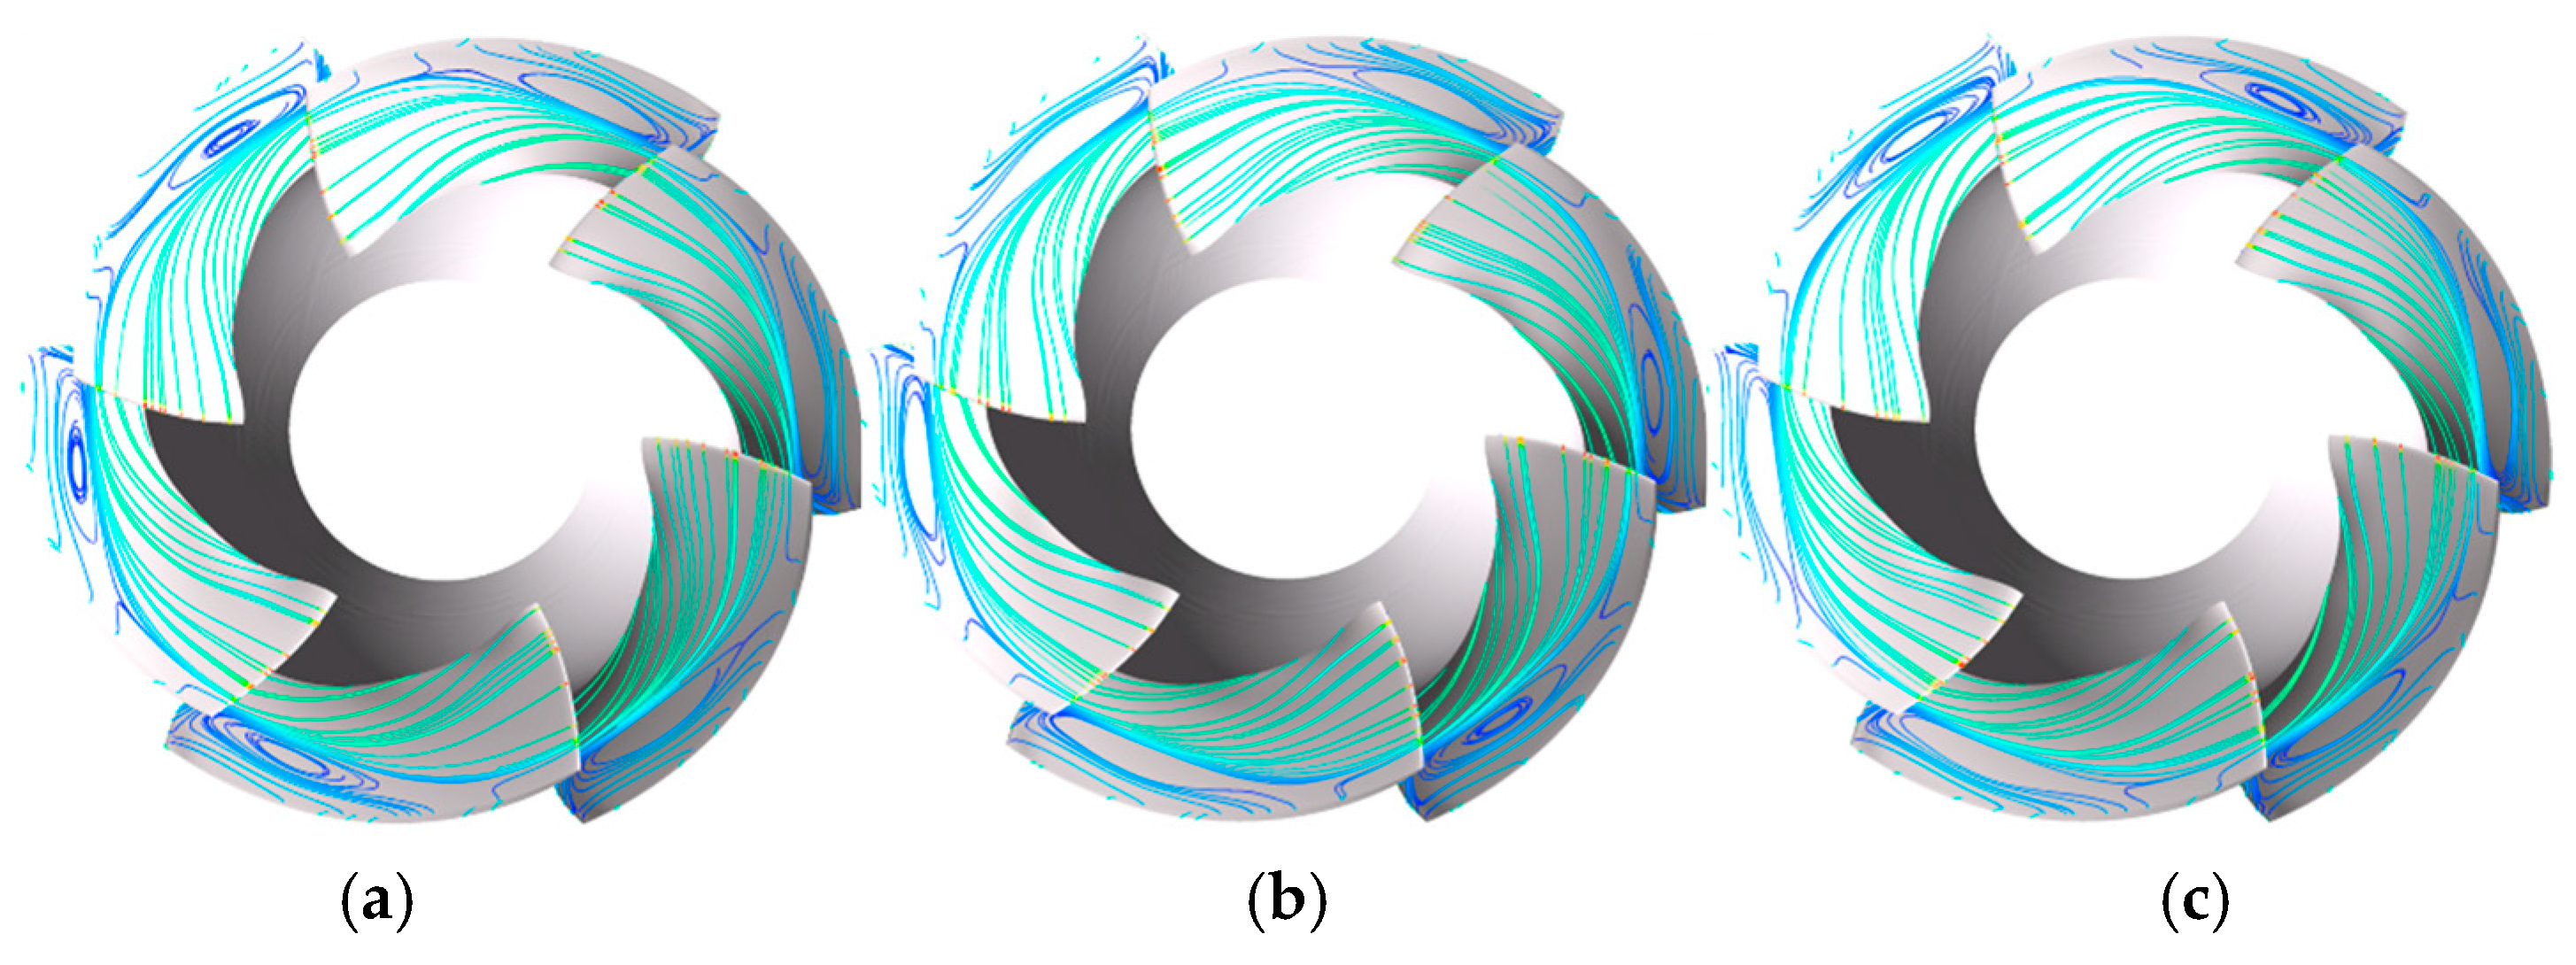
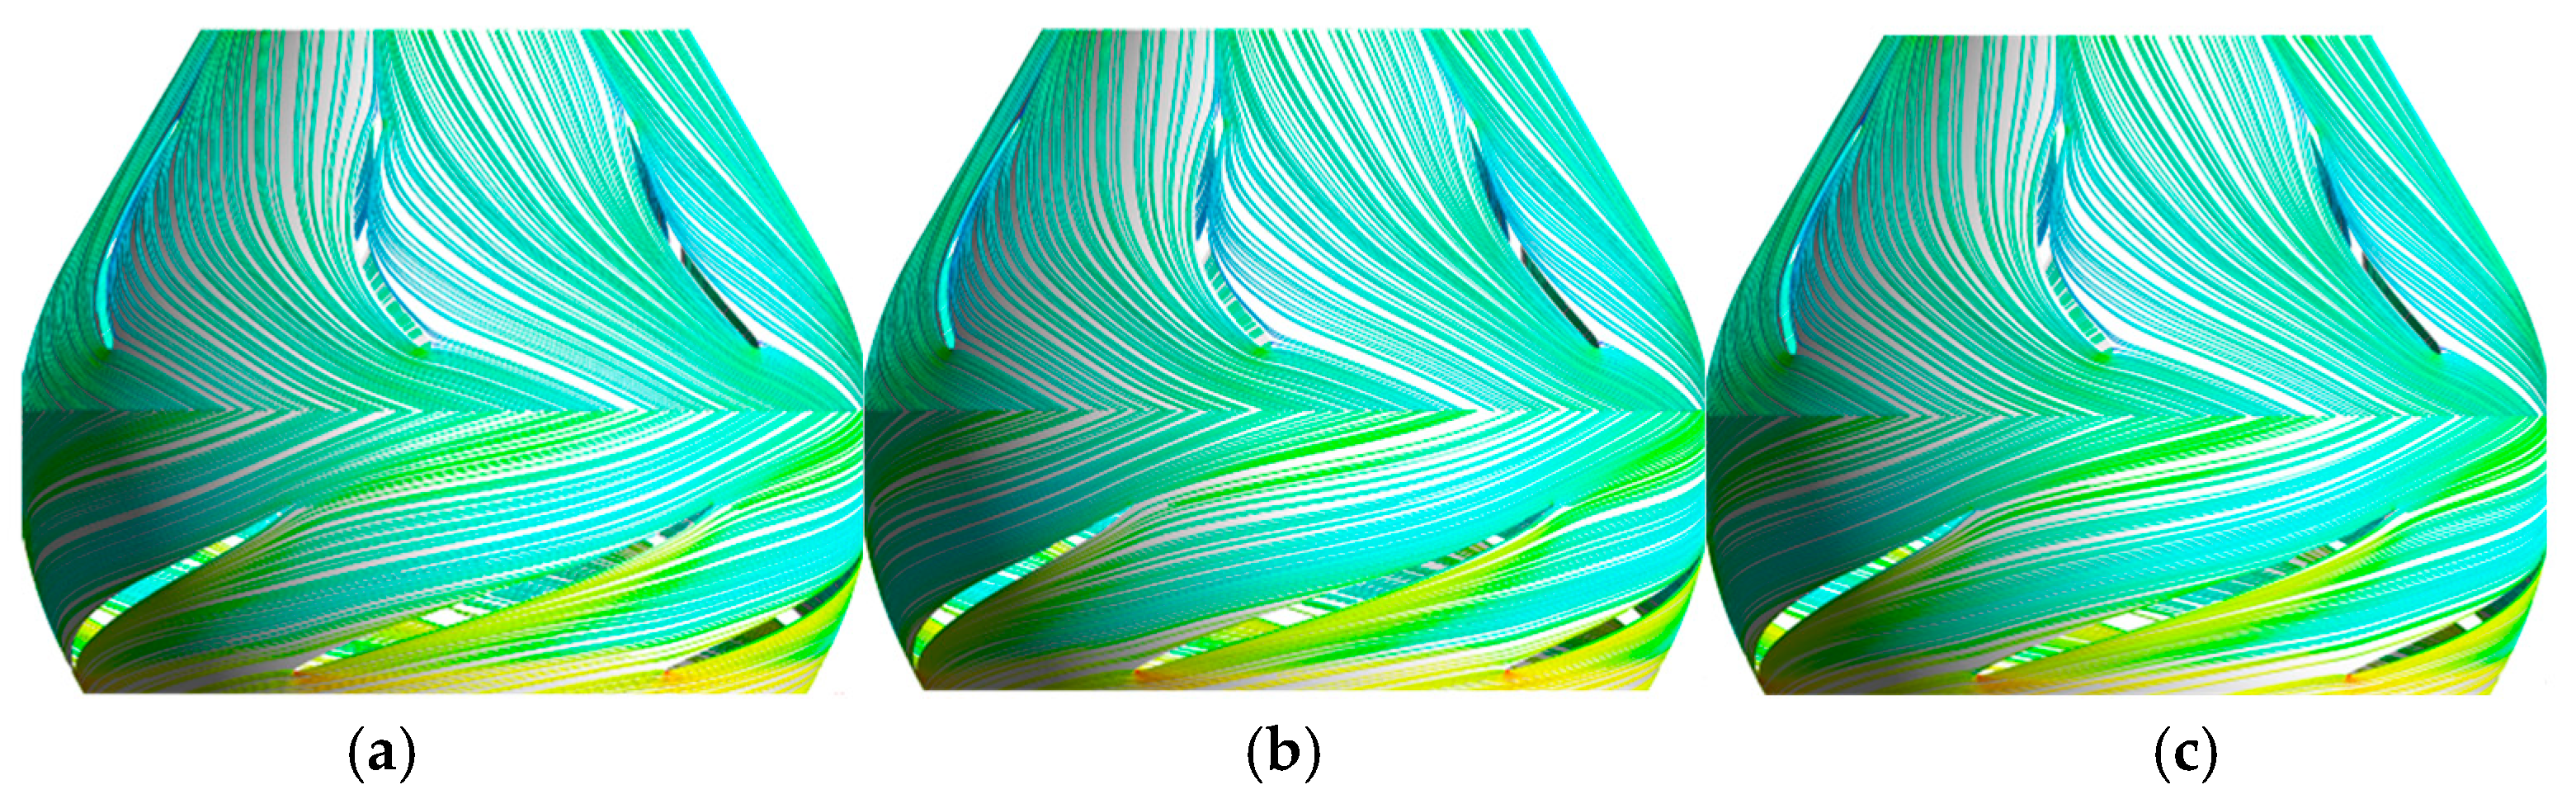
Figure 12,
Figure 13 and
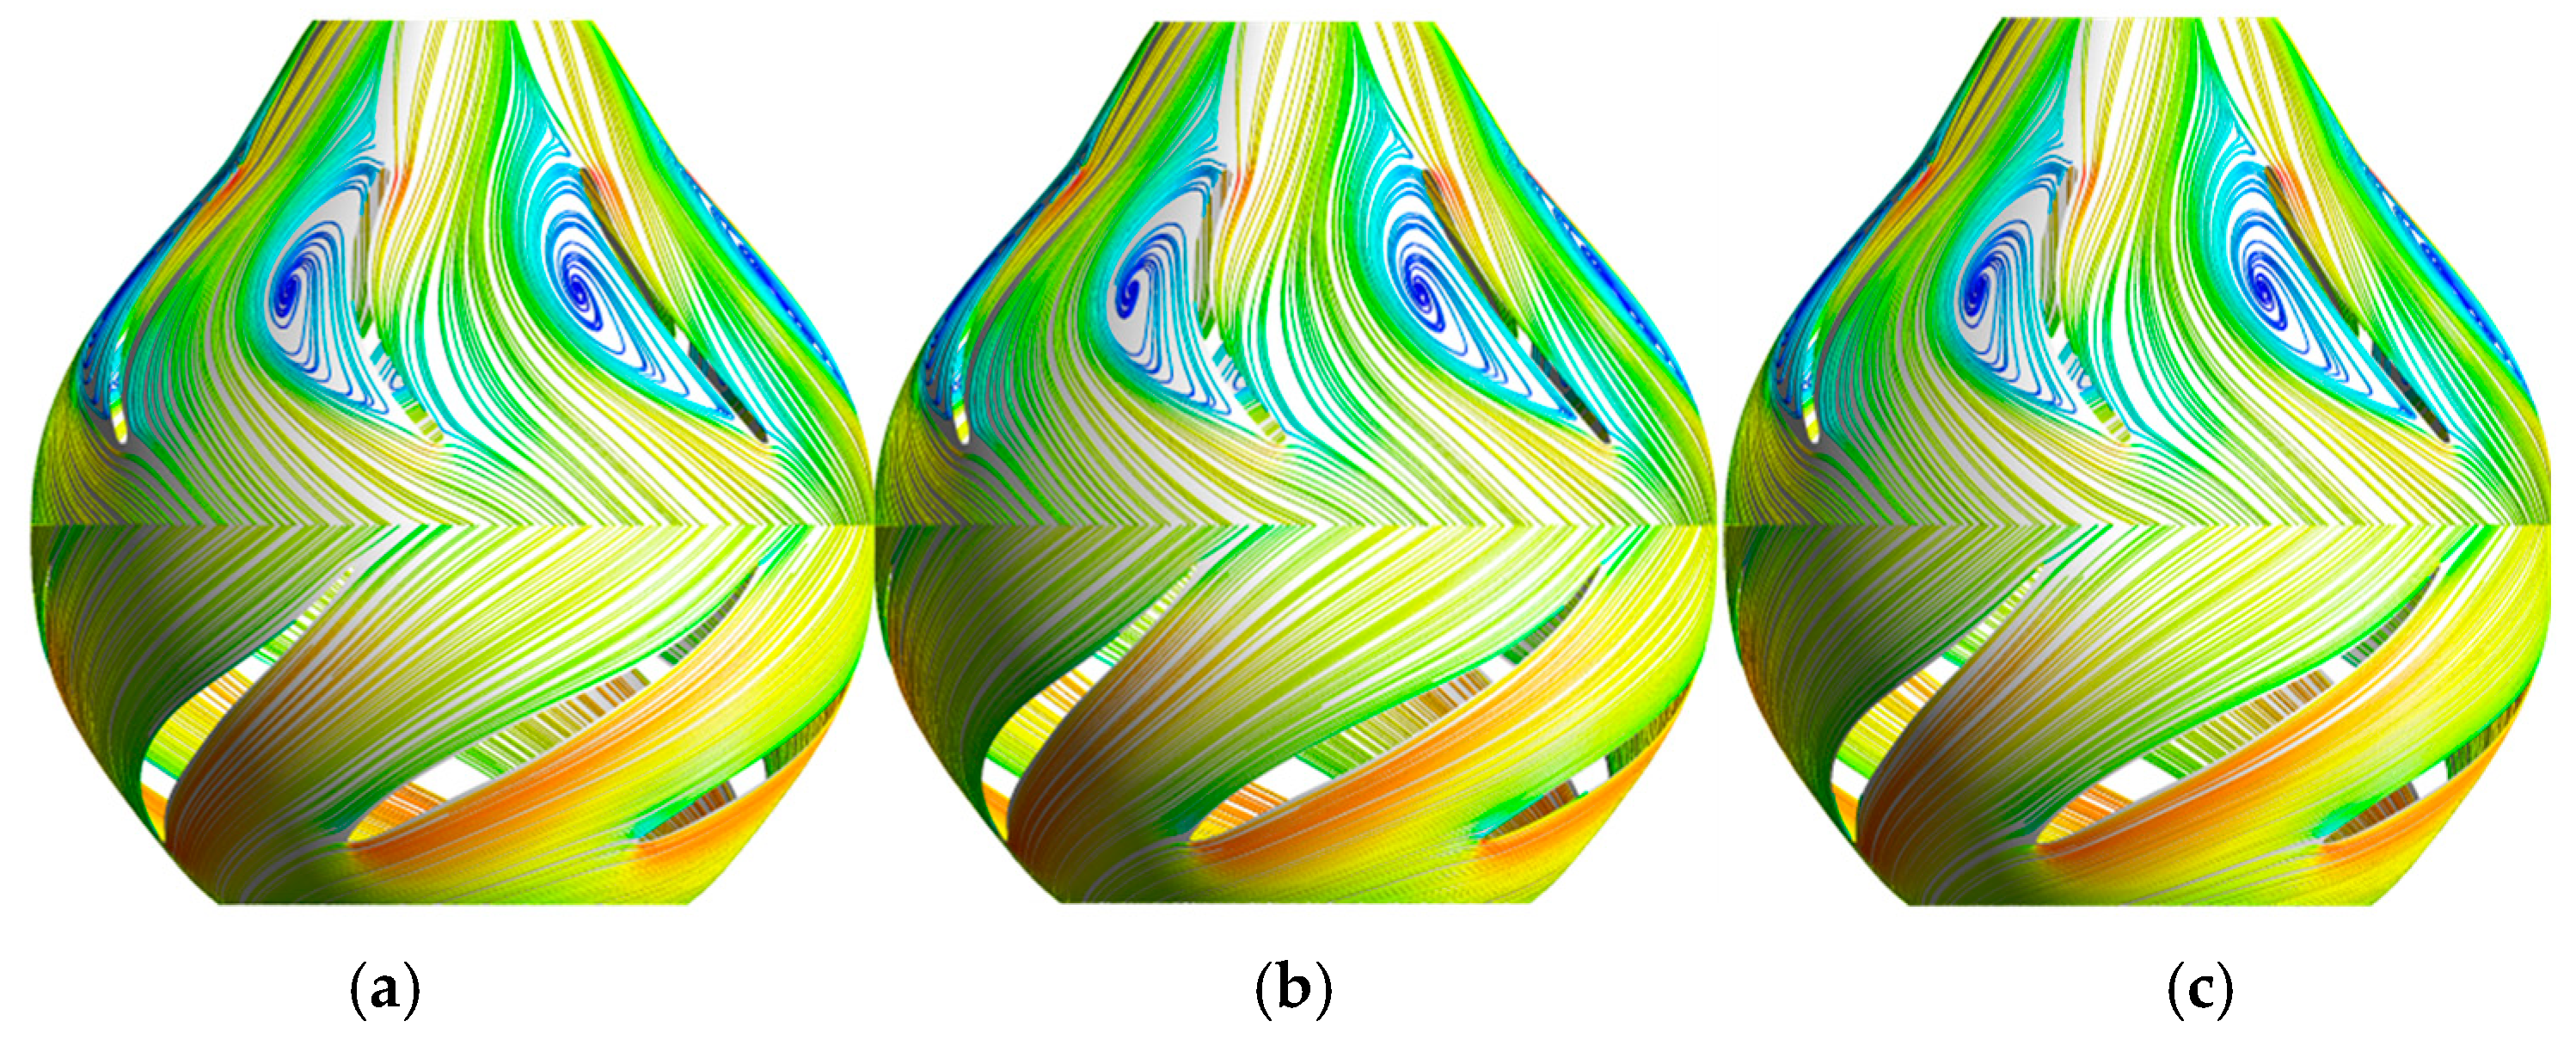
Figure 14 are the streamlines on turbo surfaces TS1 under the condition A, B, and C, in which the velocity in the impeller is the relative velocity and the velocity in the GV is the absolute velocity. Under condition A, the streamlines are steady and vary slightly with time on the turbo surfaces of the impeller and GV. The velocity is rapid on the suction side of the impeller. The inlet attack angle is basically identical to the angle of the leading edge of the airfoil, which results in the excellent inflow condition and smooth stream in the blade-to-blade passage. A small-scale spanning vortex occurs at the tailing edge of the suction. Owing to the adjustment of the GV and the location of the vortex away from the impeller, the geometric shape and magnitude of the vortex shows no evident relationship with the time. Under condition B, slight deviation exists between the inlet attack angle and the airfoil angle of the blade in the impeller and the GV. The low-velocity region of the pressure surface of the leading edge of the impeller blade is enlarged. A large-scale spanning vortex occurs in each groove of GV, which extends from the inlet to the outlet in the axial direction, and occupies about 1/3 of the groove in the spanning direction. The streamlines of other parts in the groove are severely skewed and then gather near the outlet of the GV because of the spanning vortex. Under condition C, the smooth streamline in the groove is mildly affected. A distinct spanning vortex in the groove still exists and covers half of the groove on the spanning direction. The status and range of spanning vortex are basically maintained; however, the vortex core migrates in a small scale and the vortex status modifies, meaning the flow characteristic of GV is unstable.
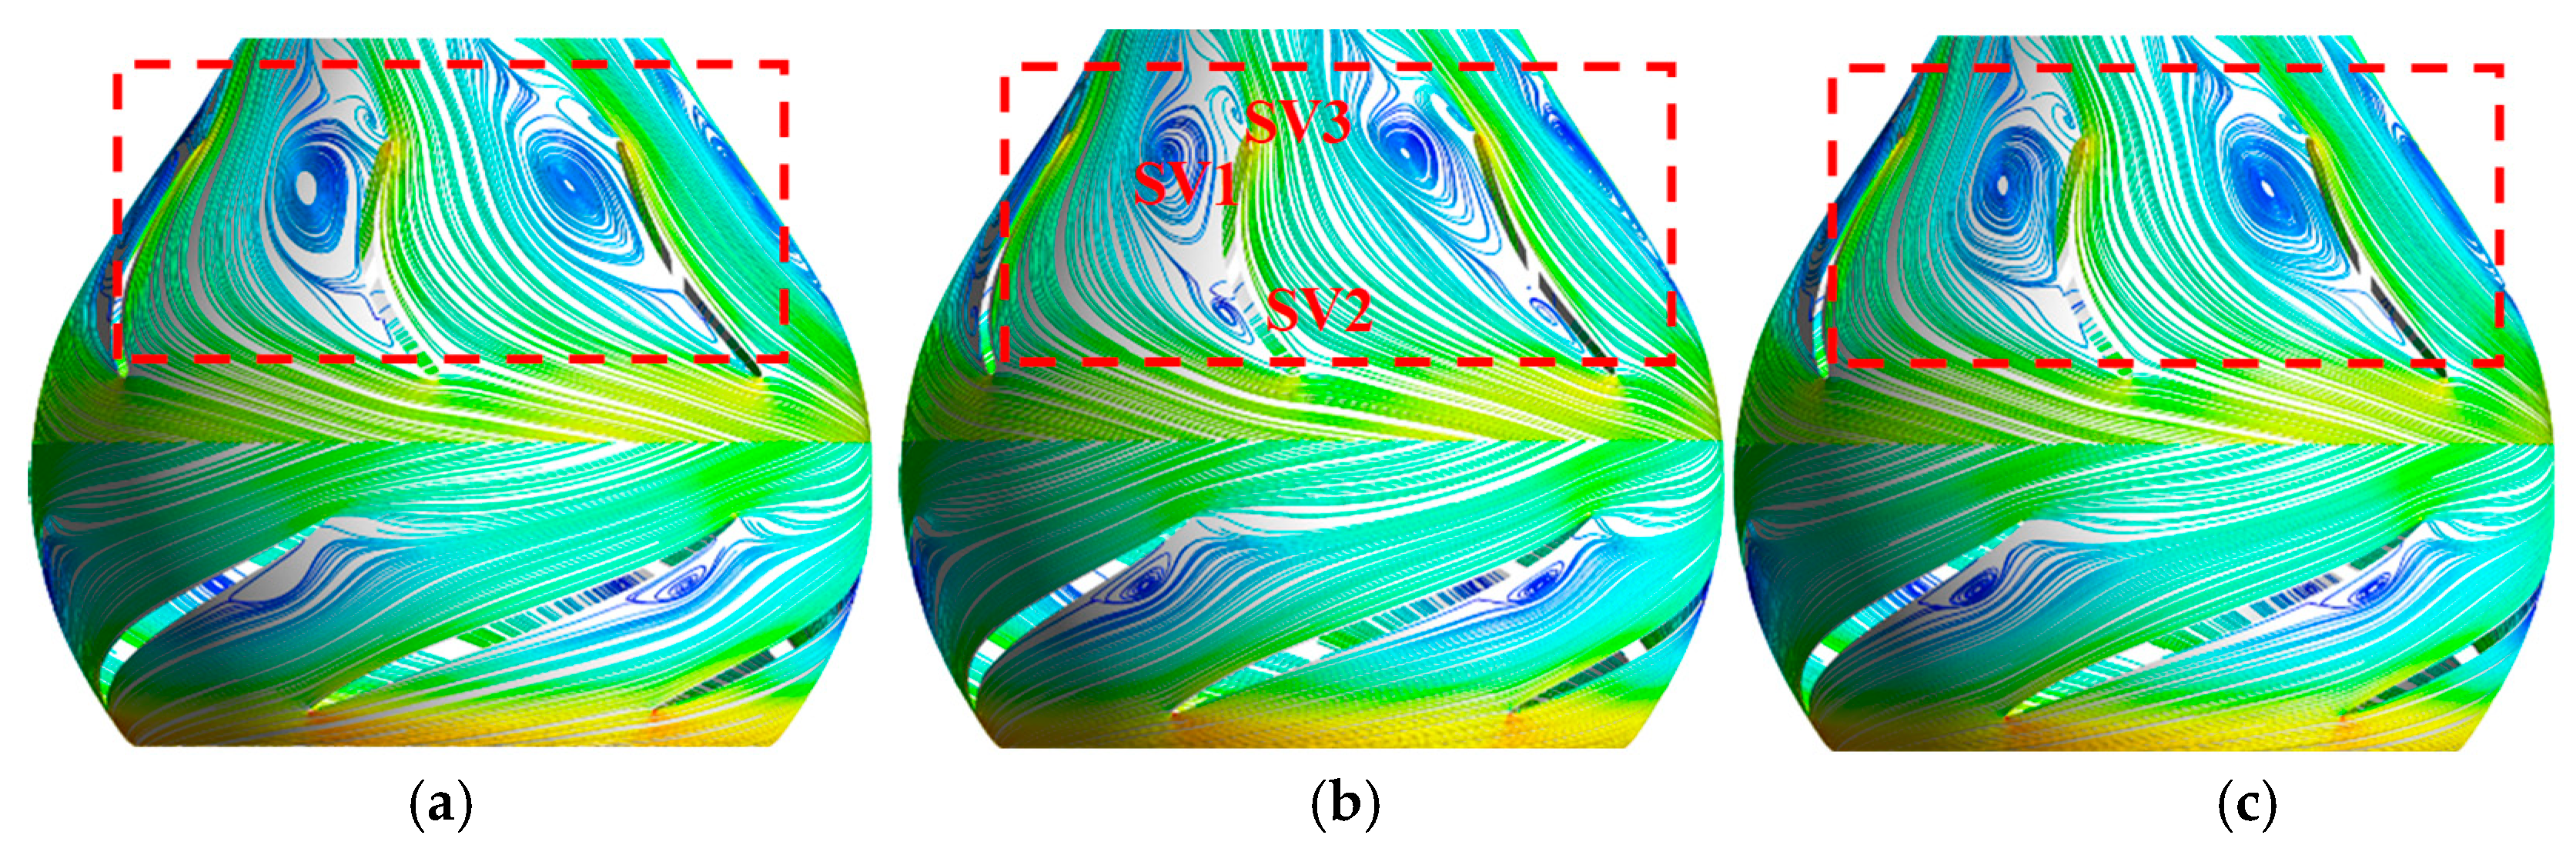
Figure 15,
Figure 16 and
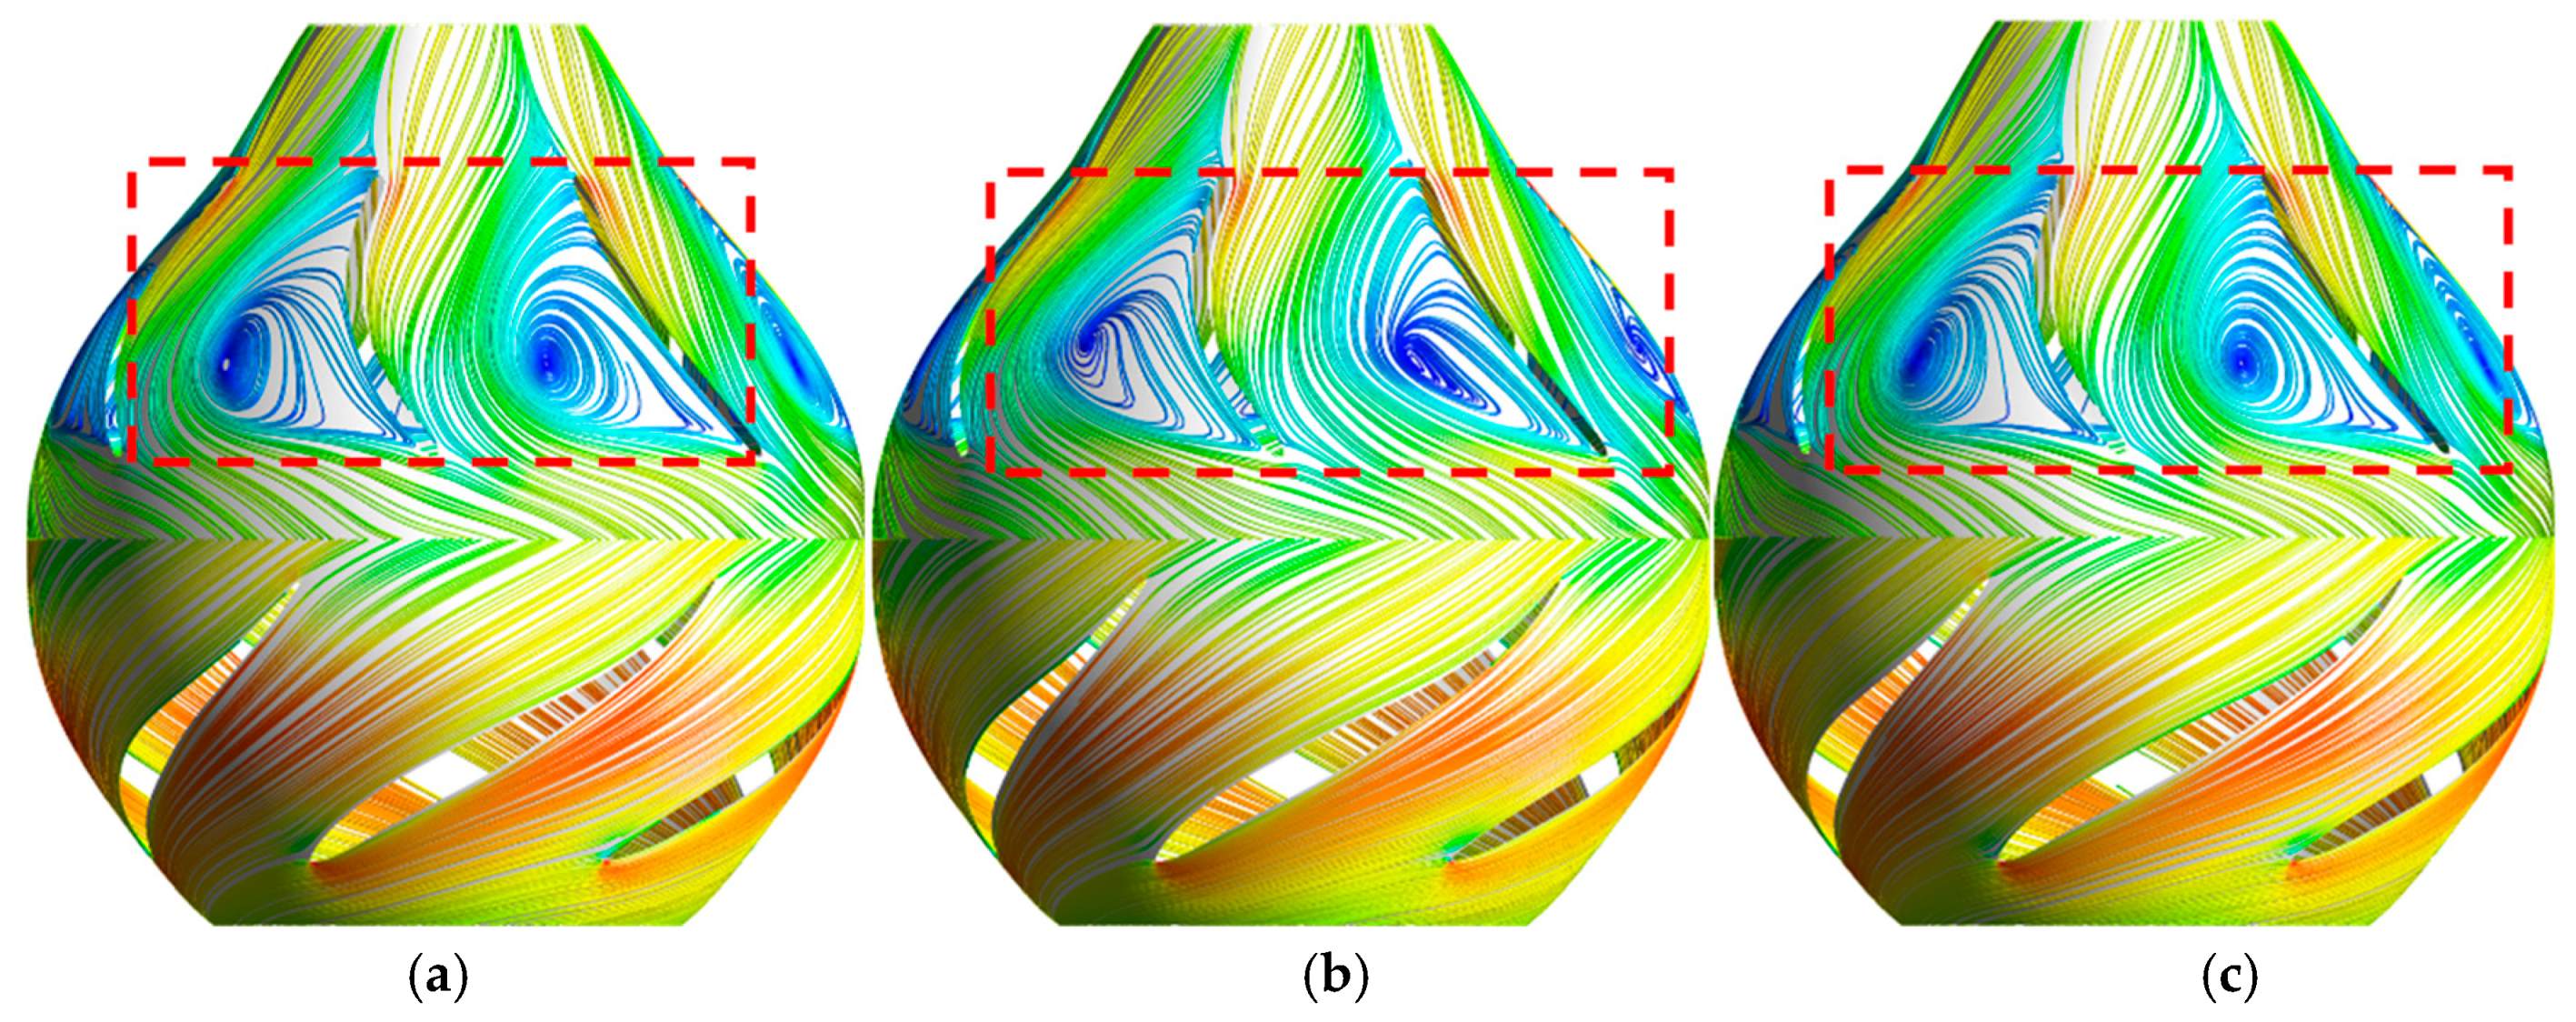
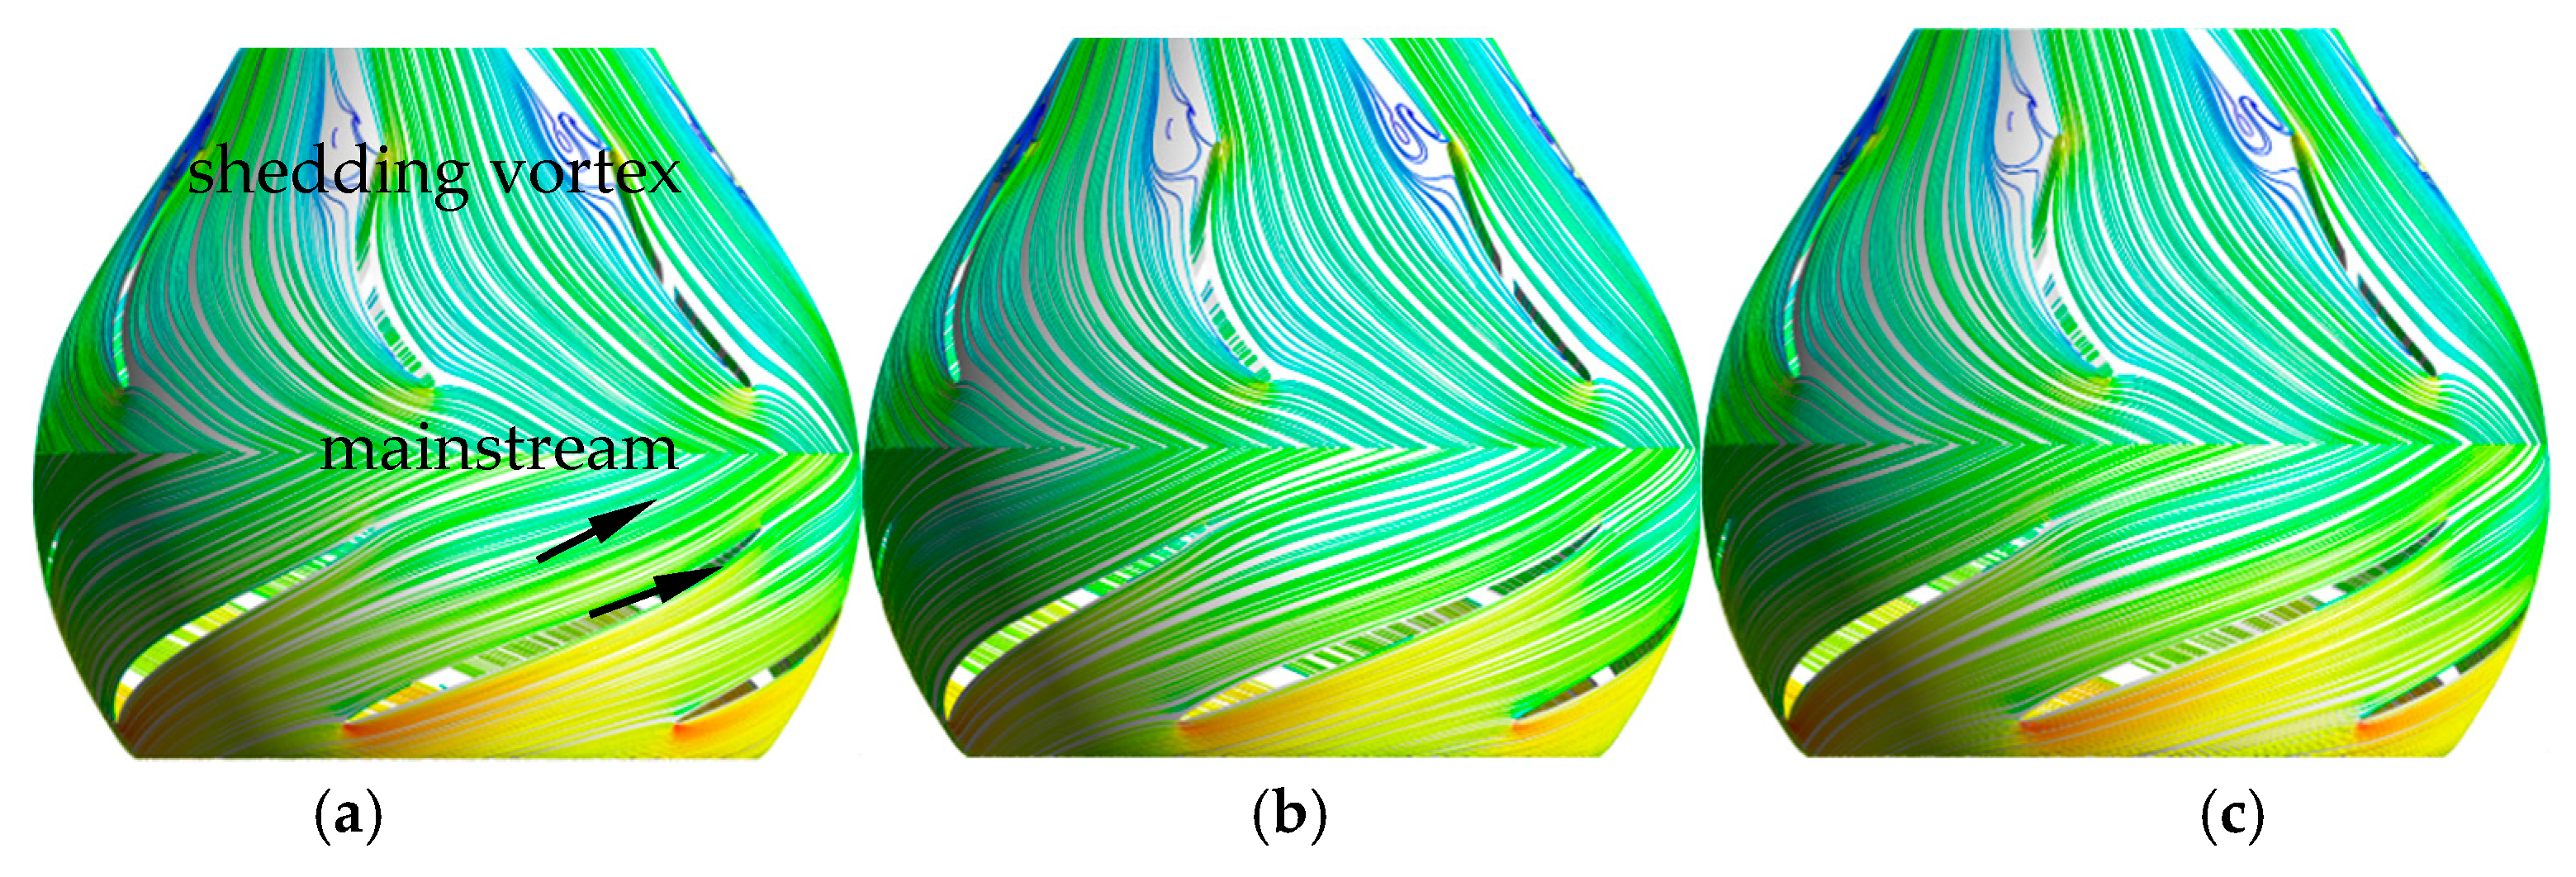
Figure 17 are the streamlines on turbo surfaces TS2 under condition A, B, and C. Under condition A, the streamlines are smooth and no vortex occurs in the blade-to-blade passage of the impeller and GV. Under condition B, a slight deviation also occurs, but the streamlines are smooth in the groove of the impeller. As the arrows indicate in
Figure 16, the streamlines deviate slightly near the tailing edge on the suction side of the impeller. The spanning vortex disappears in the groove of GV, but the shedding vortex is observed on the tailing edge of the outlet in the impeller. Part of the streamlines are severely skewed and have little impact on the mainstream. Under condition C, the inlet attack angle is consistent with the airfoil angle of the blade in the impeller. A distinct spanning vortex is observed near the tailing of different blades. The variation between the inlet attack angle of GV and the airfoil angle of the blade is apparent. Three vortexes marked as SV1, SV2, and SV3 occur on the spanning surface of GV. SV1 and SV2, located at the head edge and tailing edge of suction side, are in the channel of groove and rotate in clockwise. The range of SV1 is much larger than SV2. SV3 is the shedding vortex and located at the tailing of GV twirls on the opposite direction of the spanning vortex. As time passes, the shape and range of SV1, SV2, and SV3 varies.
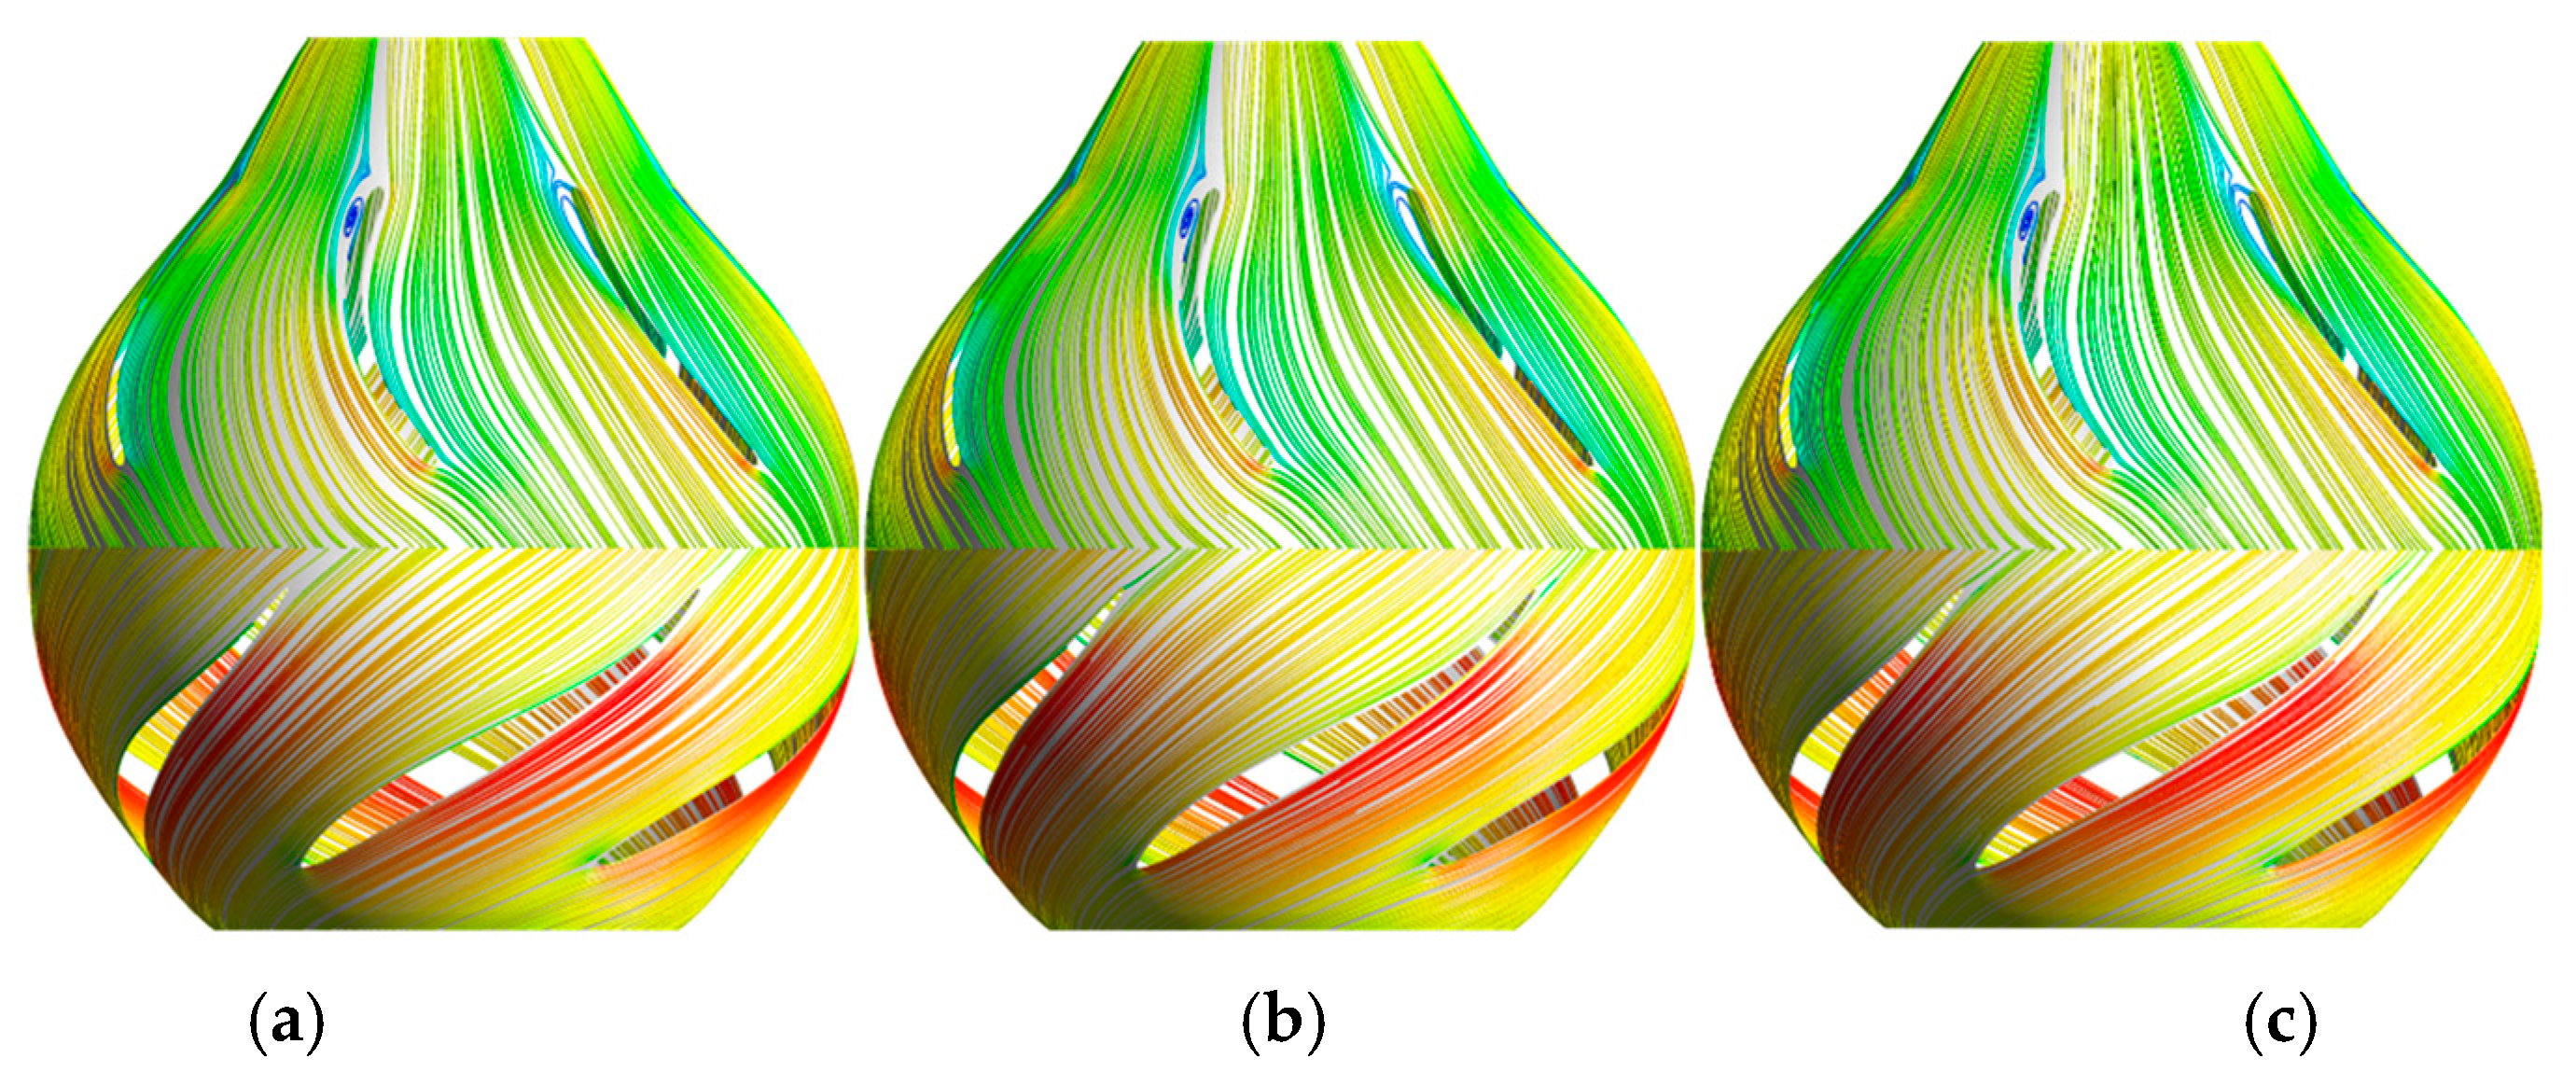
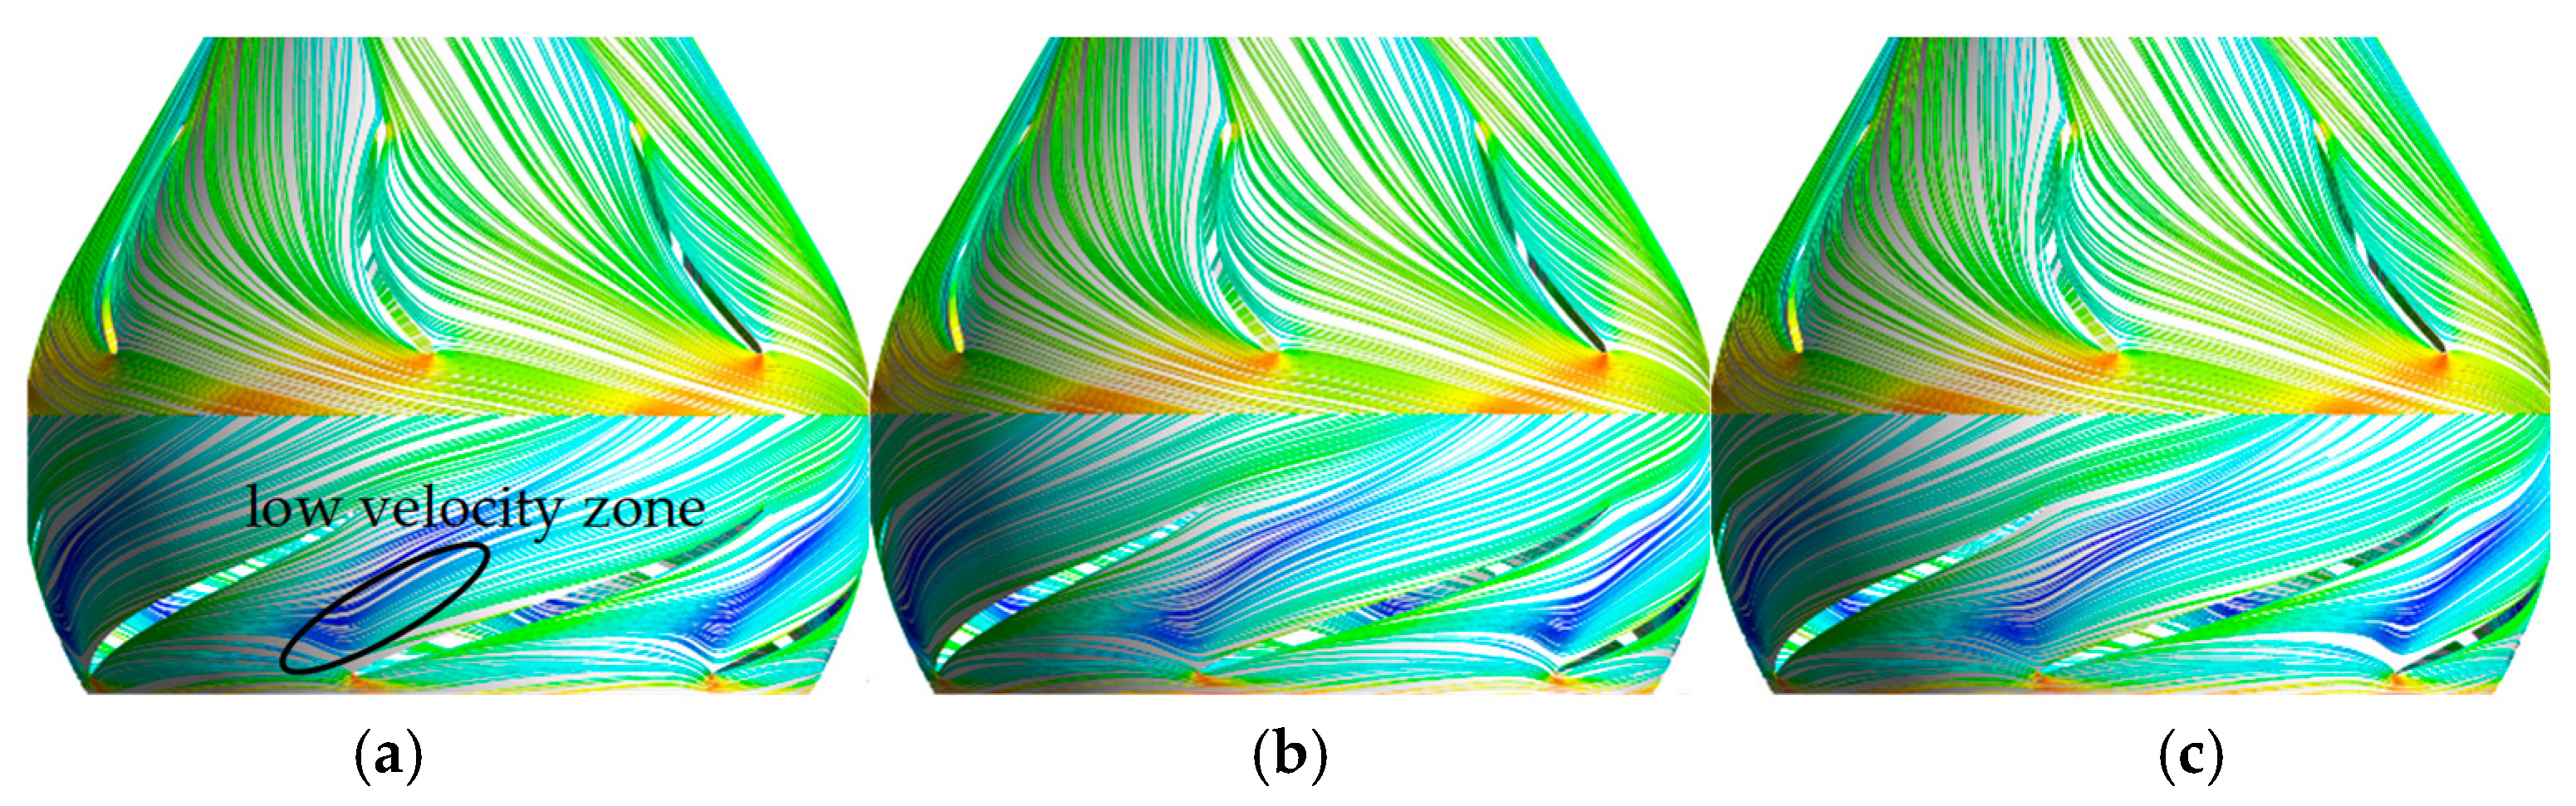
Figure 18,
Figure 19 and
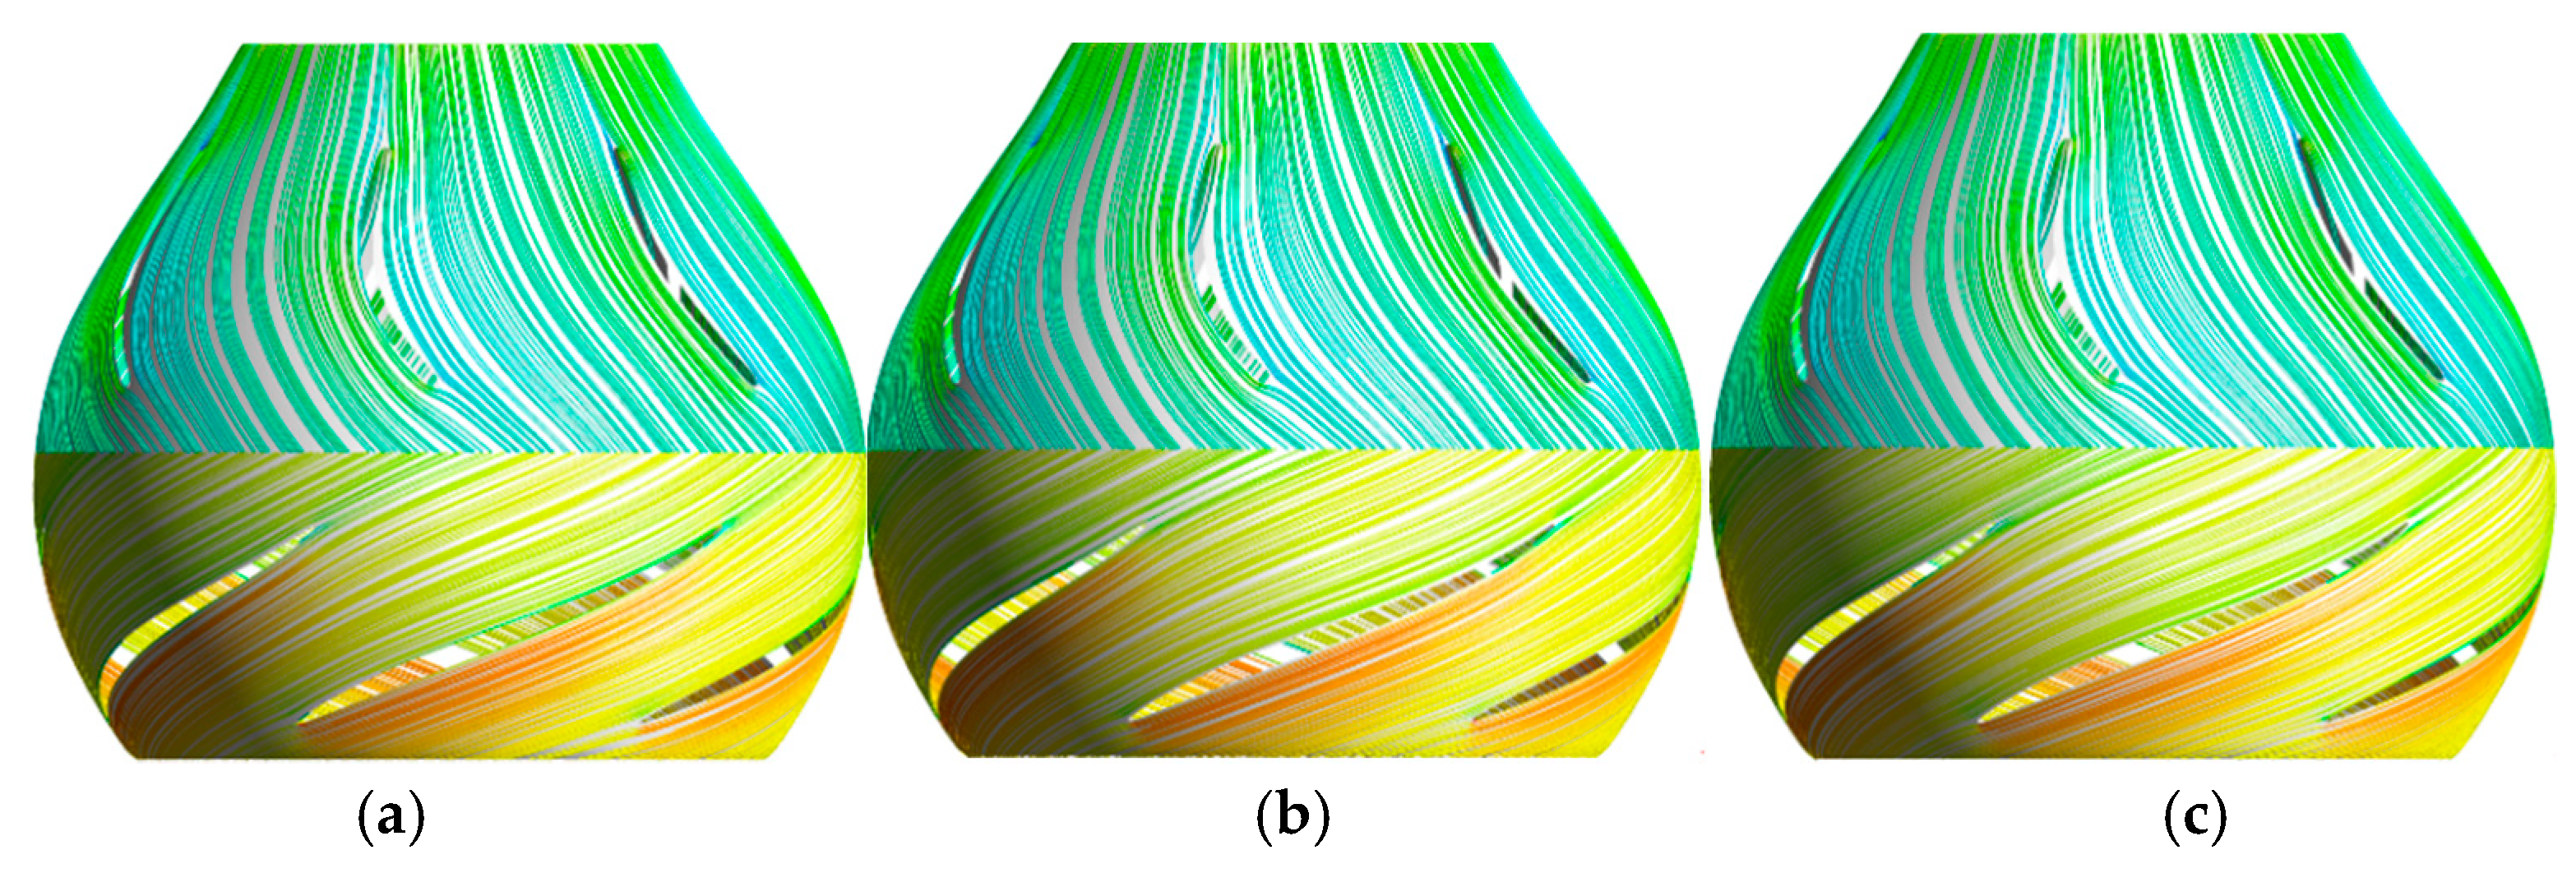
Figure 20 are the streamlines on turbo surfaces TS2 under condition A, B, and C. Under condition A, the inlet attack angle is inconsistent with the angle of the leading edge of the airfoil. In one blade-to-blade passage, part of the stream flows from the suction side to the pressure side, then out of the blade-to-blade passage along the pressure side and the streamlines converge at the tailing edge of airfoil. The flow pattern in the blade-to-blade passage of GV is similar to the impeller. Under condition B, the stream at the entrance of the impeller flows into the neighboring groove on the opposite rotating direction instead of the GV. Part of the stream at the head edge on the suction side flows to the head edge on the pressure side of the neighboring blade and then out of the groove and into the neighboring groove after being dragged by the high-speed steam at the entrance of the groove. A low-velocity zone exists in the groove of the impeller, and the streamline is disordered. Under condition C, the distinction is huge between the inlet attack angle of the impeller and the airfoil angle of the blade, and an obvious spanning vortex appears at the head edge of the pressure side and the tailing edge of the suction side. Both spanning vortexes nearly cover the whole channel of the groove in the spanning direction. The shape of spanning vortex will change with time, but the vortex core will not migrate and the location maintains.
4.3. Pressure Pulsation
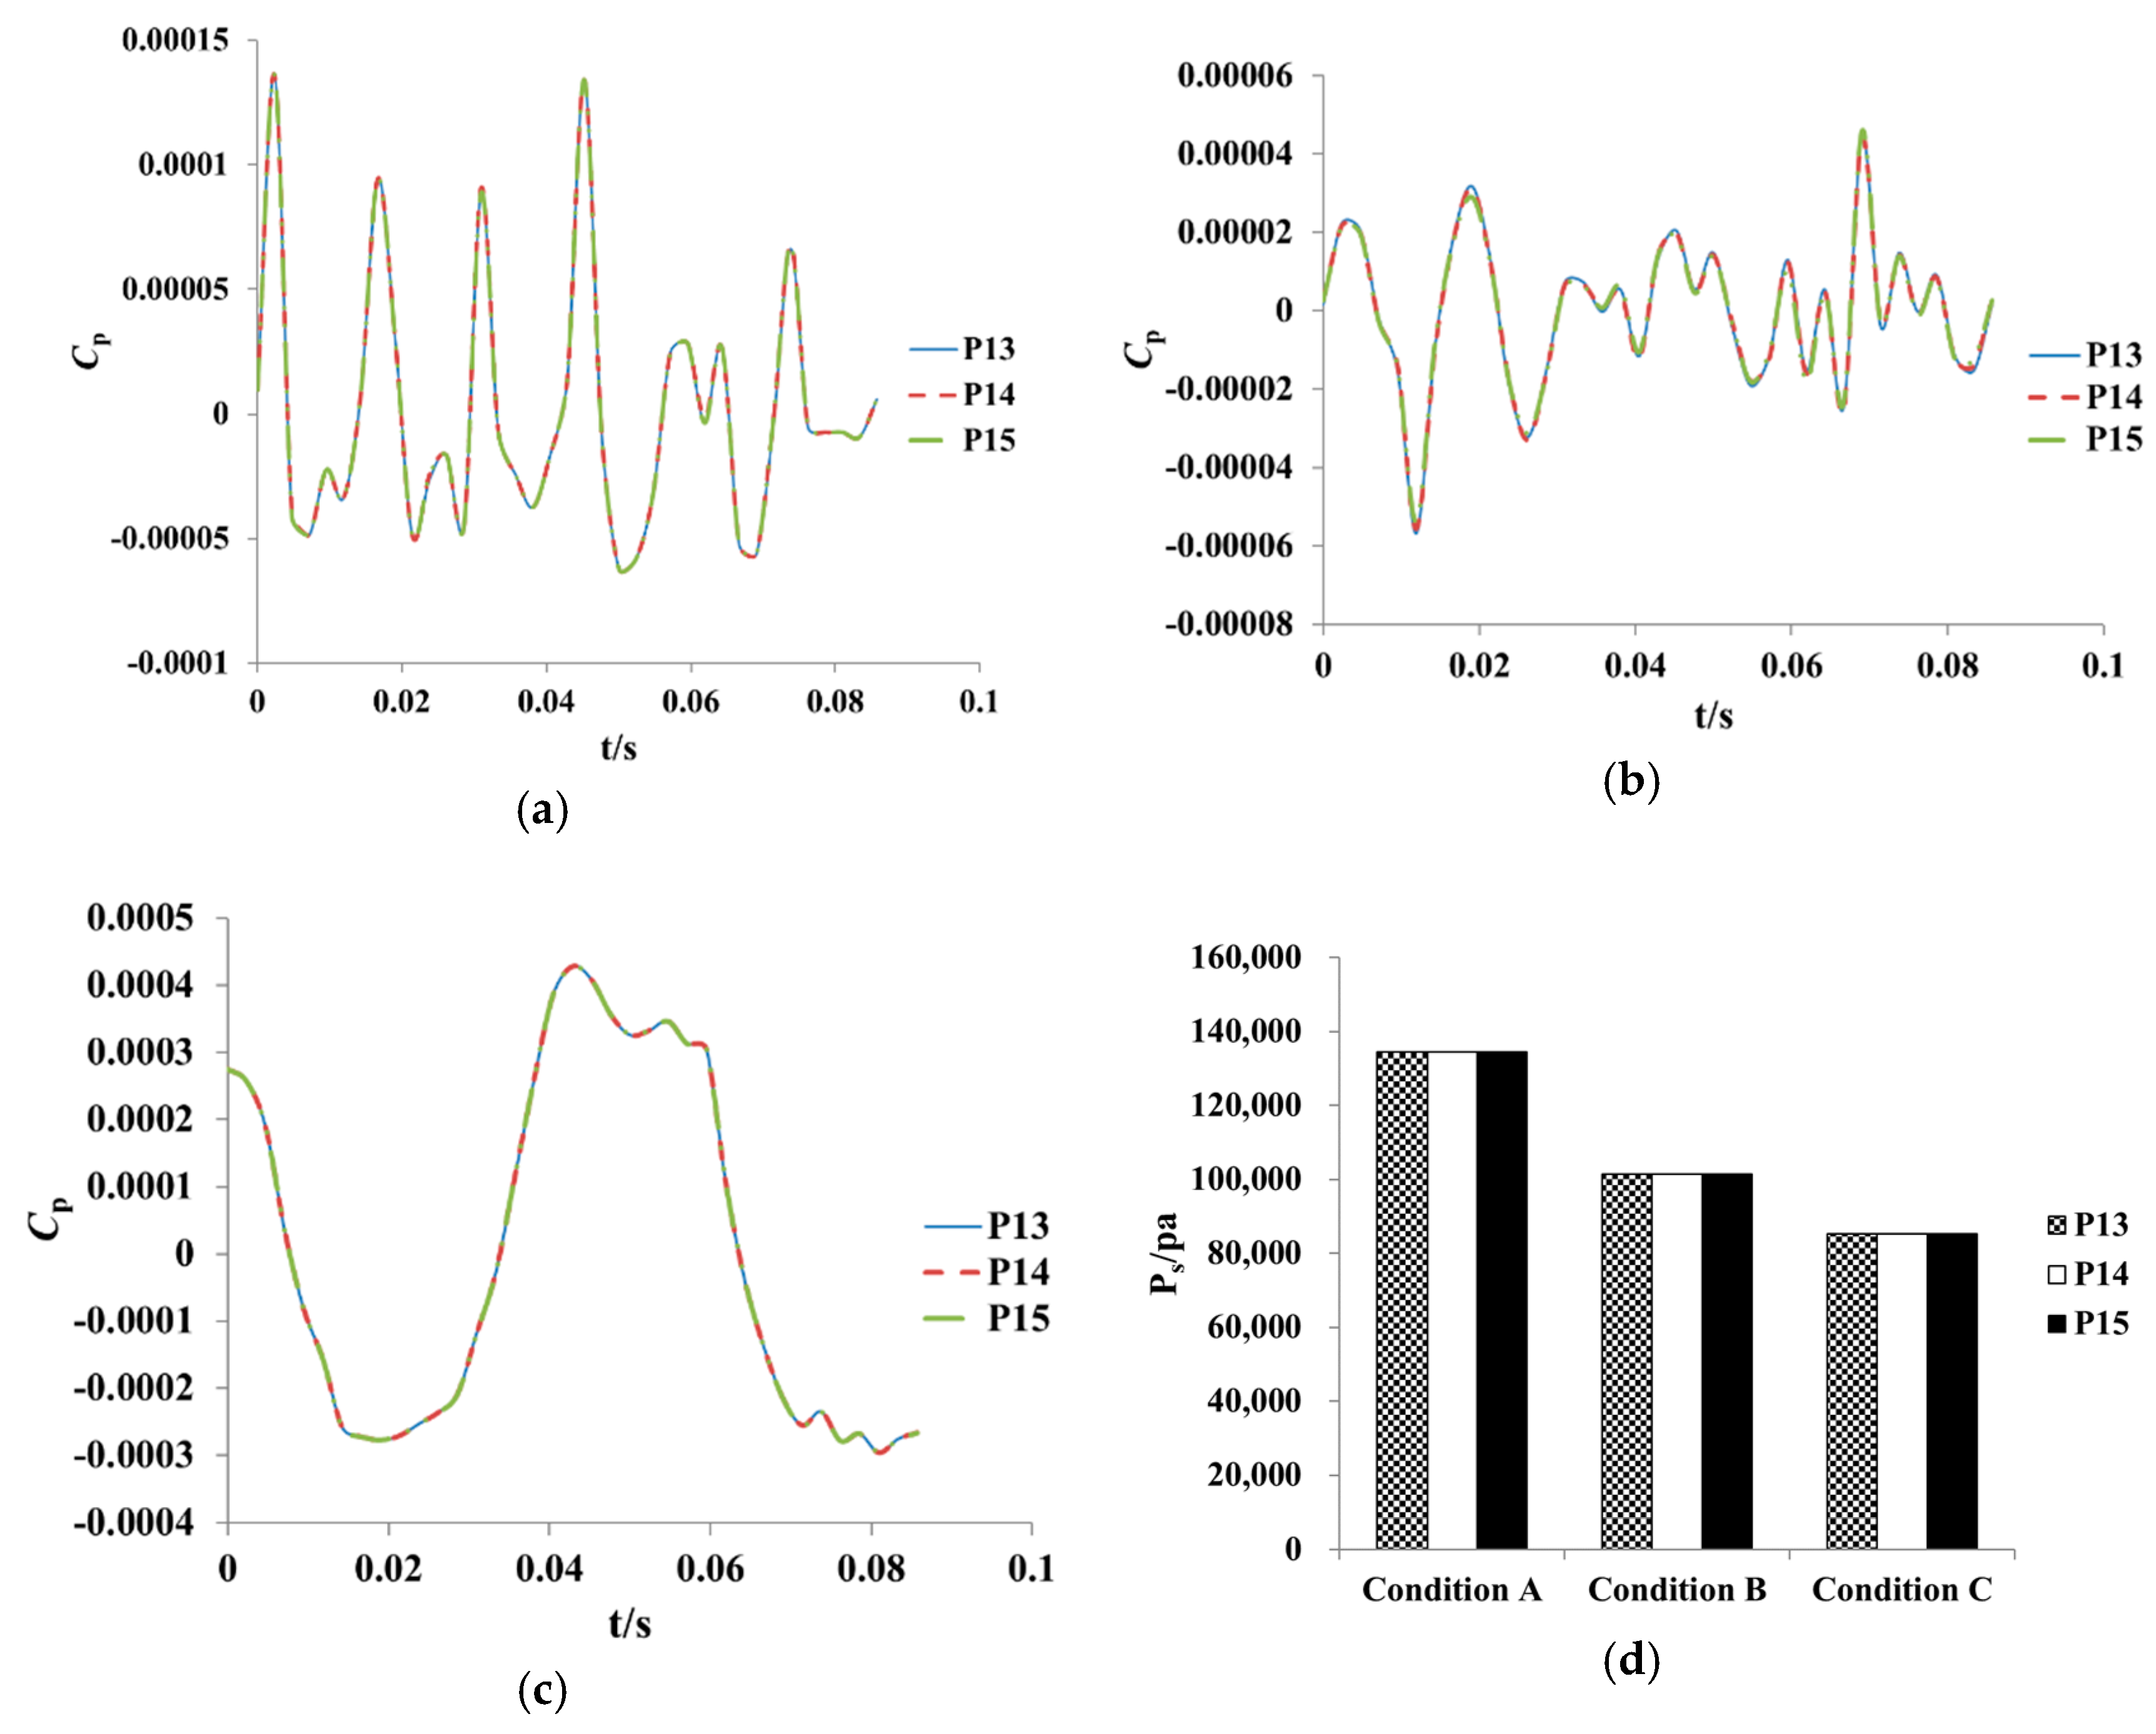
Figure 21 shows the pressure pulsation time domain diagram and comparison of pressure pulsation amplitude of the monitoring probes P13–P15 in a period under condition A, B, and C. The main frequency, the secondary frequency, and the corresponding pressure amplitude of the monitoring probes P13–P15 under condition A, B, and C are listed in
Table 2.
Under the same condition, the pressure pulsation trend of monitoring probes P13–P15 is completely unanimous, but the amplitudes increase sequentially. This indicates that the farther away from the pump shaft, the smaller the pressure pulsation amplitude, the closer to the pump shaft, and the greater the pressure pulsation amplitude due to the stream disturbance. Under different conditions, the pressure pulsation trend on each monitoring probe is quite different, accompanied by poor periodicity, small flow rate, and pressure pulsation amplitude.
The main frequency and secondary frequency of each monitoring probe are 26.25 Hz and 40.83 Hz, corresponding to the 2.25 times and 3.5 times shaft frequency. For the same monitoring probe, great variation exists between the pressure pulsation amplitude of main frequency (MF) and secondary frequency (SF). The pressure pulsation amplitude of MF is three times that of SF. Under different monitoring probes, the pressure pulsation amplitudes of MF and SF decrease as the flow rate reduces and small variation occurs between the pressure pulsation amplitude of MF and SF.
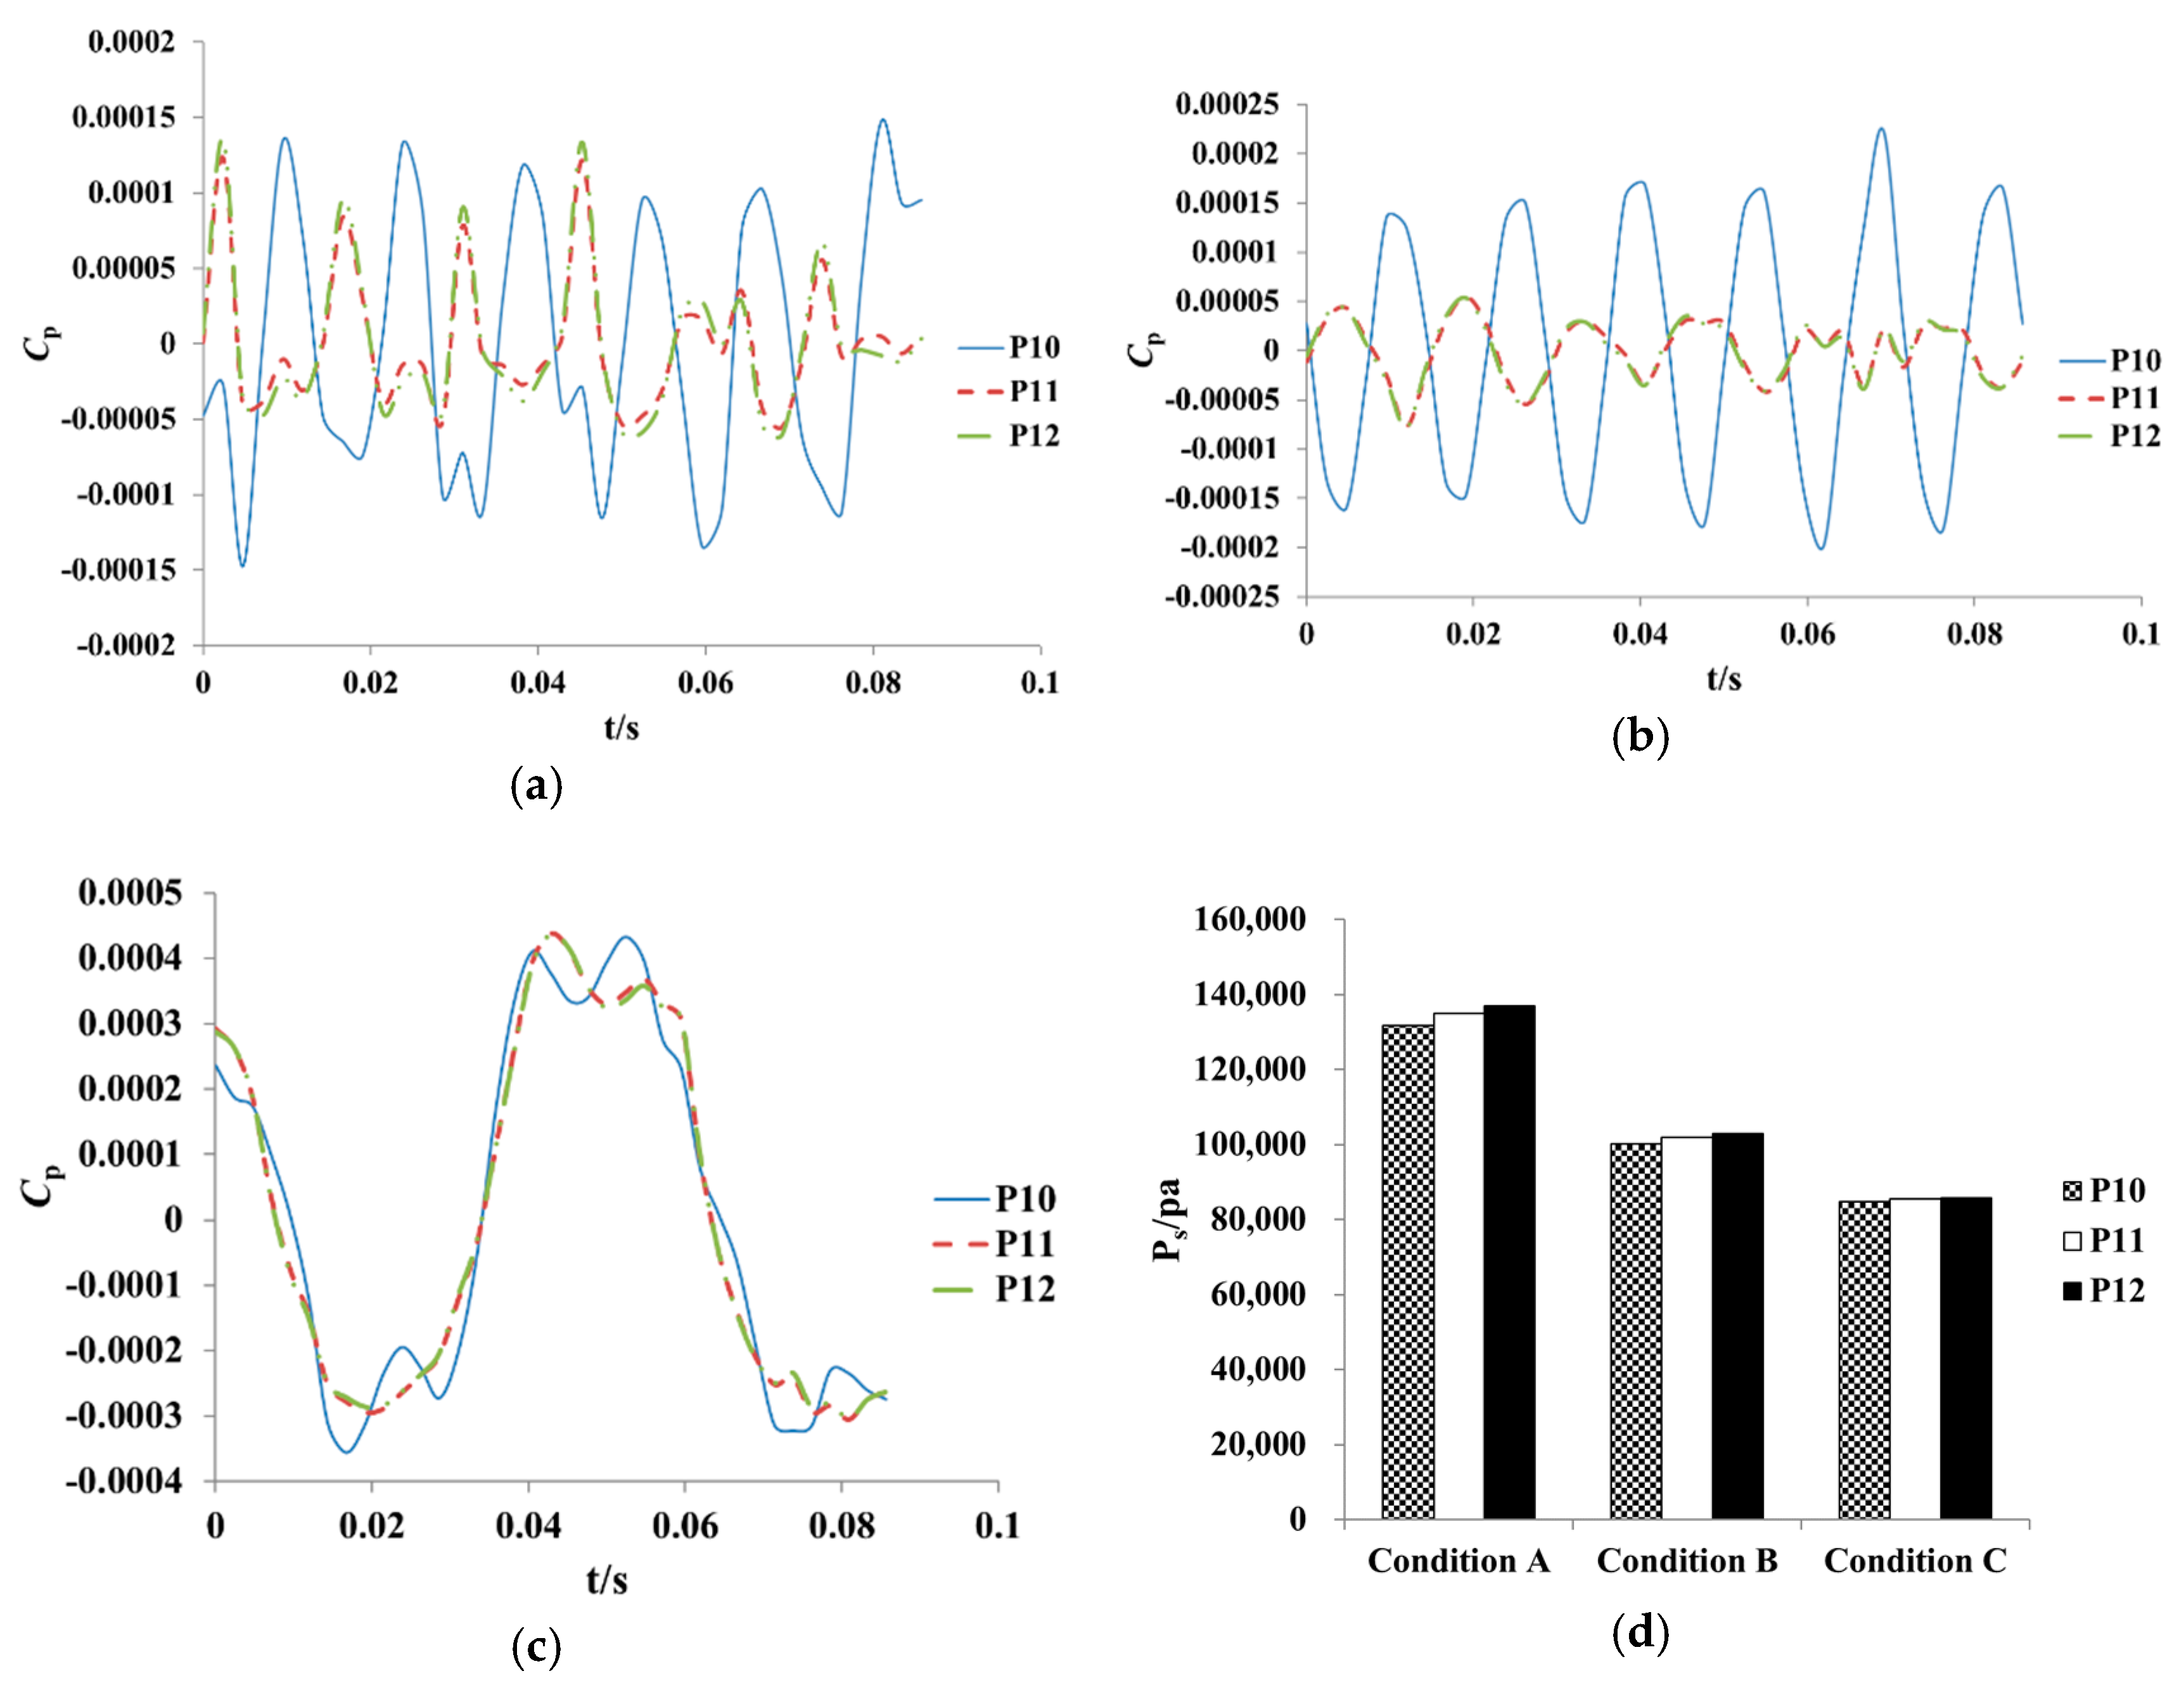
Figure 22 shows the pressure pulsation time domain diagram and comparison of pressure pulsation amplitude of the monitoring probes P10–P12 in a period under different conditions.
Table 3 lists the main frequency, the secondary frequency, and the corresponding pressure amplitude of the monitoring probes P10–P12 under different conditions.
The pressure pulsation amplitude increases from P10 to P12 under the same condition. The pressure pulsation amplitude at P12 is 1.04, 1.03, and 1.01 times of P10 under condition A, B, and C. The closer to the shaft, the greater pressure pulsation amplitude, meaning the pressure pulsation amplitude is affected by the shaft. Under different conditions, the pressure pulsation amplitude and flow rate of each monitoring probe shows a positive relationship.
Under condition A, B, and C the MF and SF on the outlet of prolonged inlet section is completely the same with those in the prolonged inlet section. The rotating impeller has not yet been able to exert a dominant influence on the flow on the outlet of prolonged inlet section. Such a frequency shows no relationship with the blade frequency. The pressure pulsation amplitudes of MF and SF enlarges from P10 to P12 and the pressure pulsation amplitude of MF is also three times of SF.
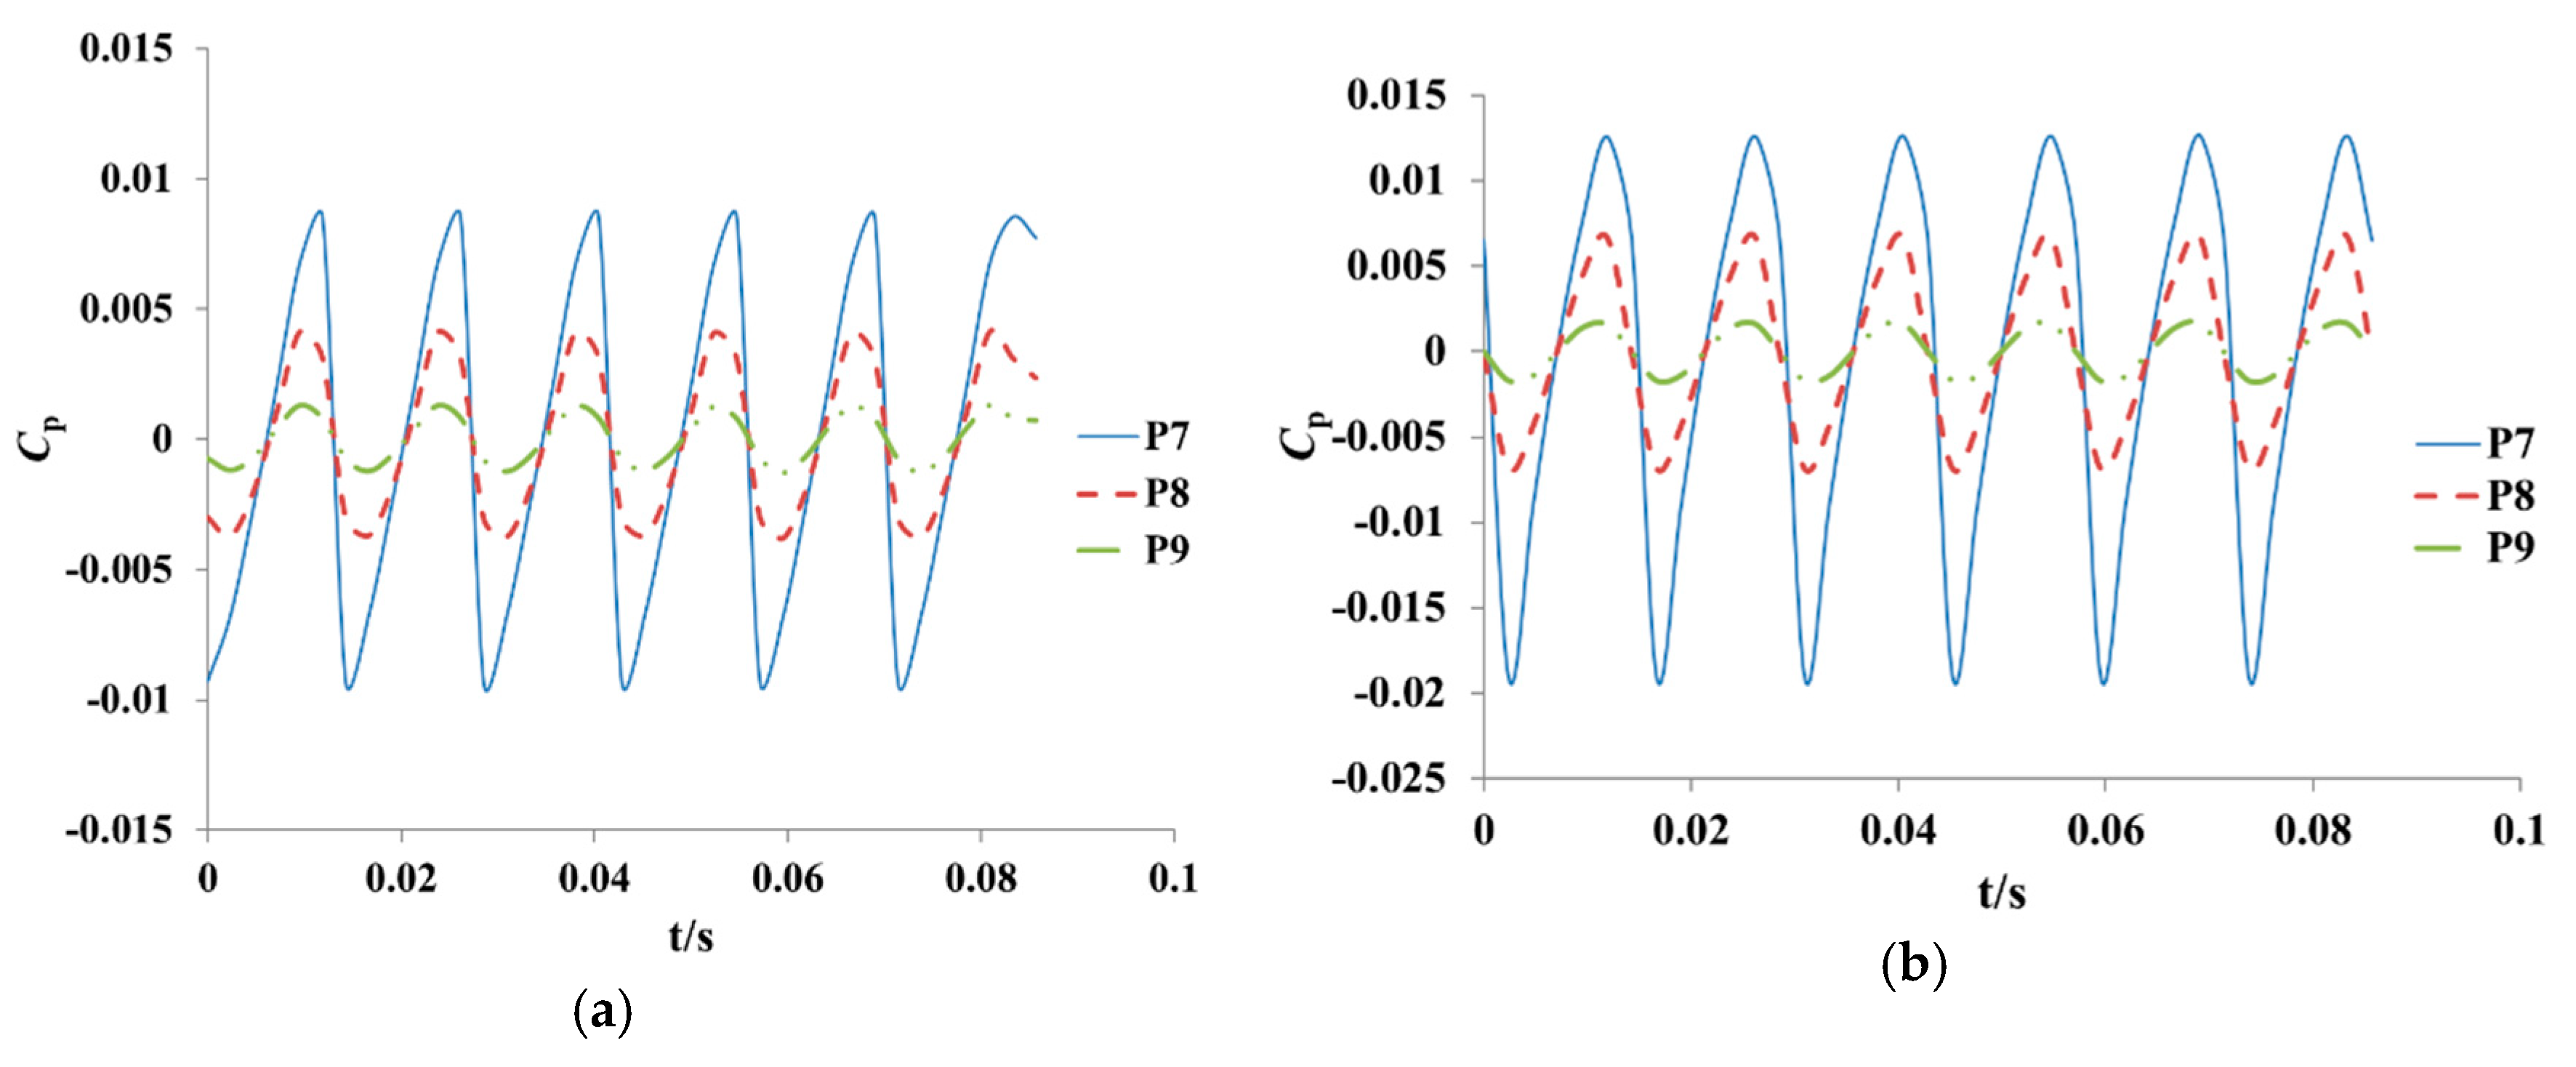
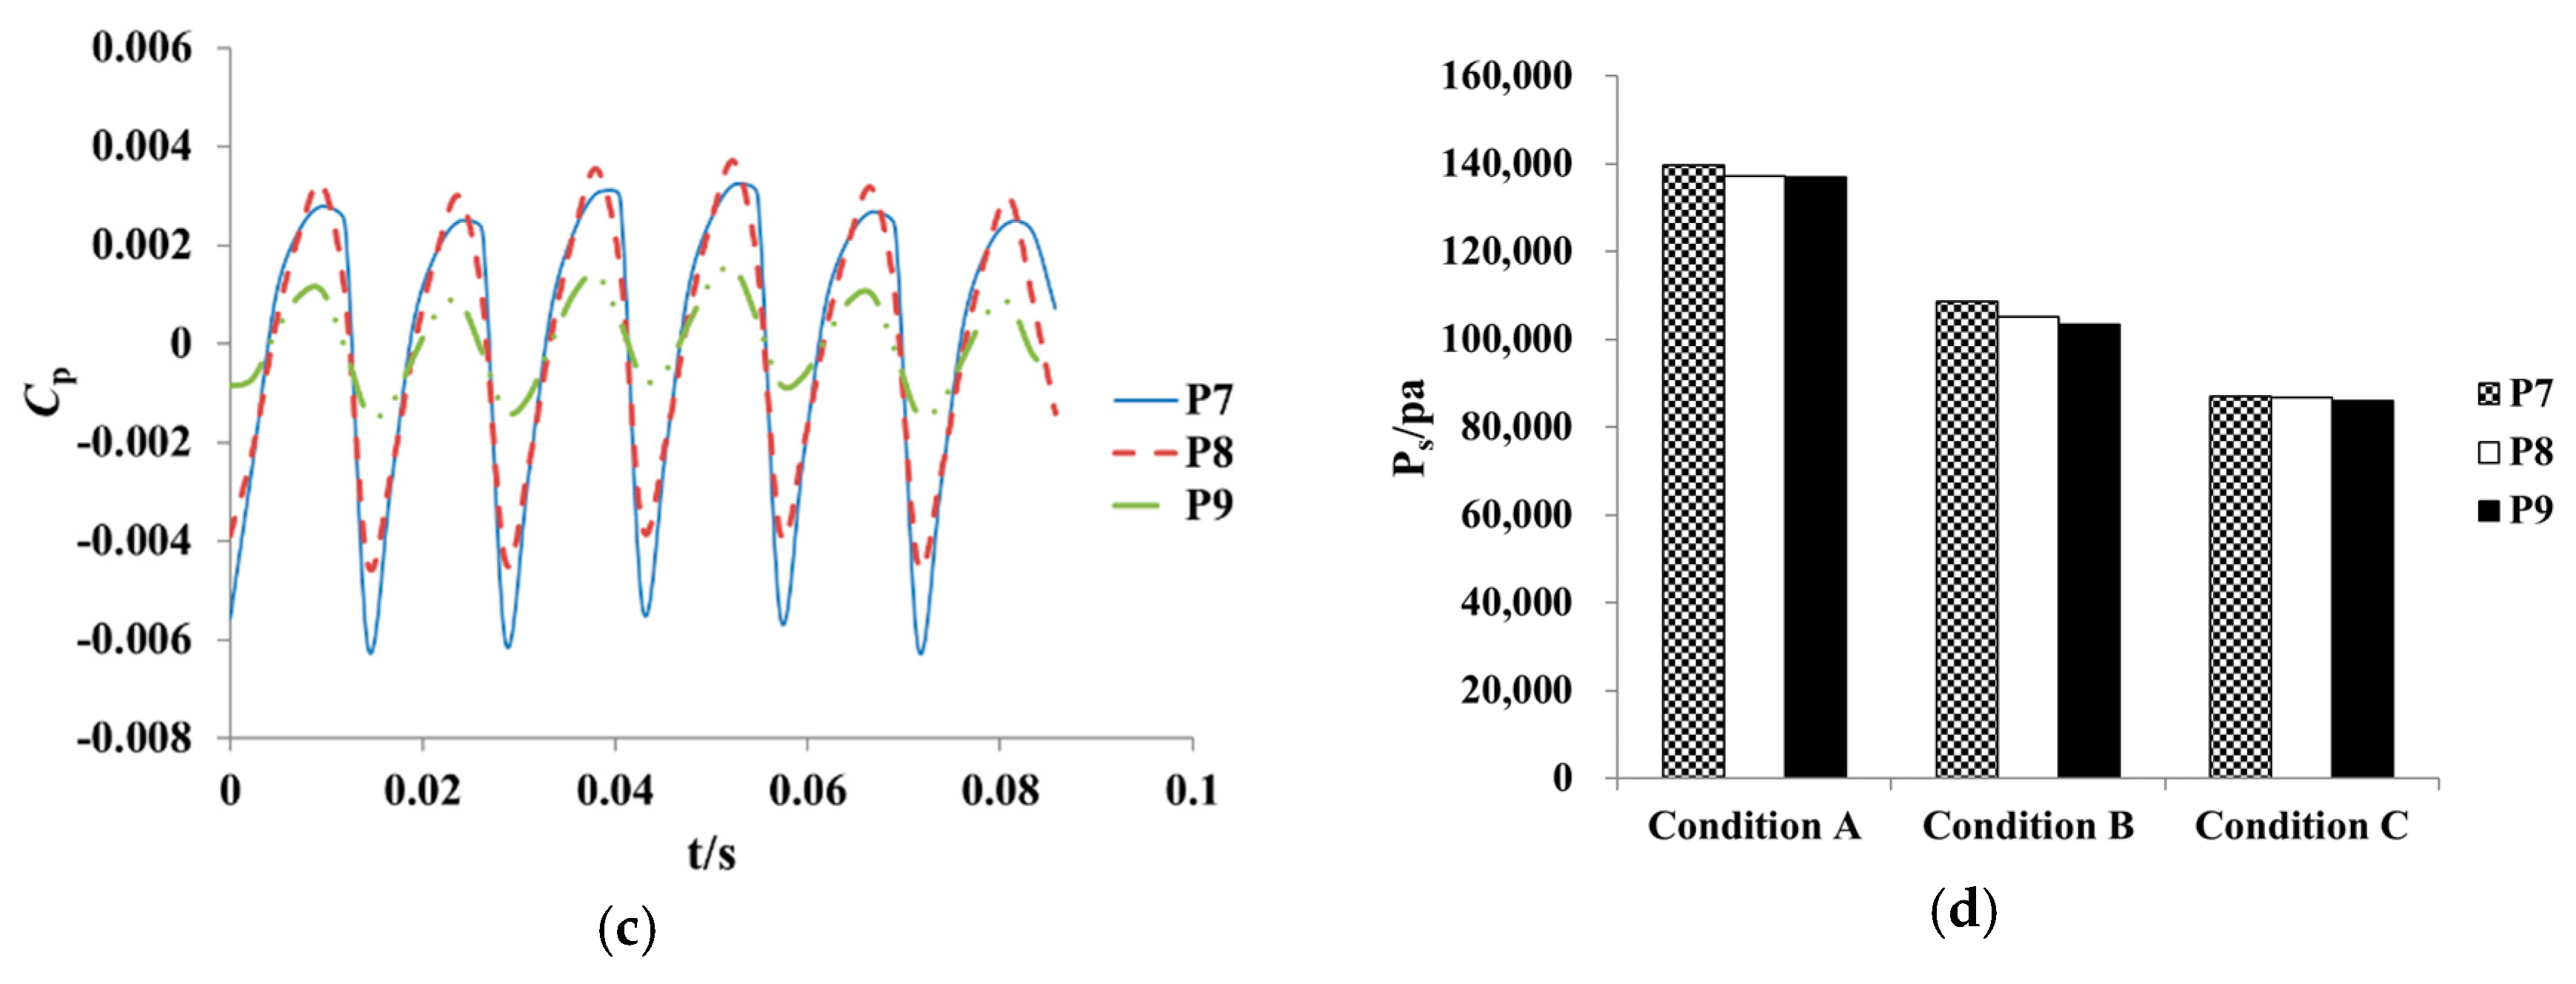
The pressure pulsation time domain diagram and comparison of pressure pulsation amplitude of the monitoring probes P7–P9 in a period under different conditions is shown in
Figure 23. The main frequency, the secondary frequency and the corresponding pressure amplitude of the monitoring probes P7–P9 under different conditions are listed in
Table 4.
In general, the effect of the impeller on the inflow starts from the stream entering into the impeller, but actually the effect of the blade on the inflow begins when the water flow does not enter the impeller, mainly manifested by the pre-spin action on the water flow. Under the same condition, the pressure pulsation amplitude on the monitoring probes P7–P9 is gradually reduced, where P7 is the monitoring probe near the shroud and P9 is the monitoring probe near the hub. Thus, the pressure pulsation amplitude gradually increases from the hub to the shroud. The pressure pulsation amplitude at the monitoring probe P7 is 1.02 times, 1.05 times, and 1.01 times of P9 under condition A, B, and C. Hence, the pressure pulsation amplitude on each monitoring probe is positively correlated with the flow rate under different working conditions.
The frequency domain of monitoring probes set at the inlet of the impeller is observed and analyzed. The MF and SF on the impeller inlet monitoring probe are not certain, wherein the MF is 70 Hz or 26.25 Hz, and the SF is 70 Hz, 140 Hz, or 26.25 Hz. Under condition A, the MF of P7 and P8 is 70 Hz, which is the blade frequency, but the MF of P9 is 2.25 times of the shaft frequency. Under condition B, and C, the MF on each monitoring probe is also the blade frequency, but the SF is 26.25 Hz or 140 Hz. Under all conditions, the pressure pulsation amplitude of MF for P7 and P8 is quite different from the pressure pulsation amplitude of SF. However, the pressure pulsation amplitude of MF of P9 is basically consistent with SF. The monitoring probe P7 is pre-installed near the shroud, and the MF and SF are 70 Hz and 140 Hz, respectively, which is 1 and 2 times the blade frequency. Thus, the blade frequency plays a dominant role in the pressure pulsation near the shroud under condition A, B, and C. The location of monitoring probe P8 is between the shroud and the hub, and the MF is 70 Hz, the SF is 26.25 Hz under condition A and C, but is 140 Hz under condition B. Therefore, the blade frequency is still the dominant factor, but the shaft frequency also begins to play a certain role in it. The monitoring probe P9 is pre-set near the hub. Thus, 26.25 Hz and 70 Hz occur alternately in the MF and the SF of P9, and the pressure pulsation amplitudes of the MF is matched roughly with the SF. This indicates that the pressure pulsation near the hub is affected by both the impeller and the pump shaft.
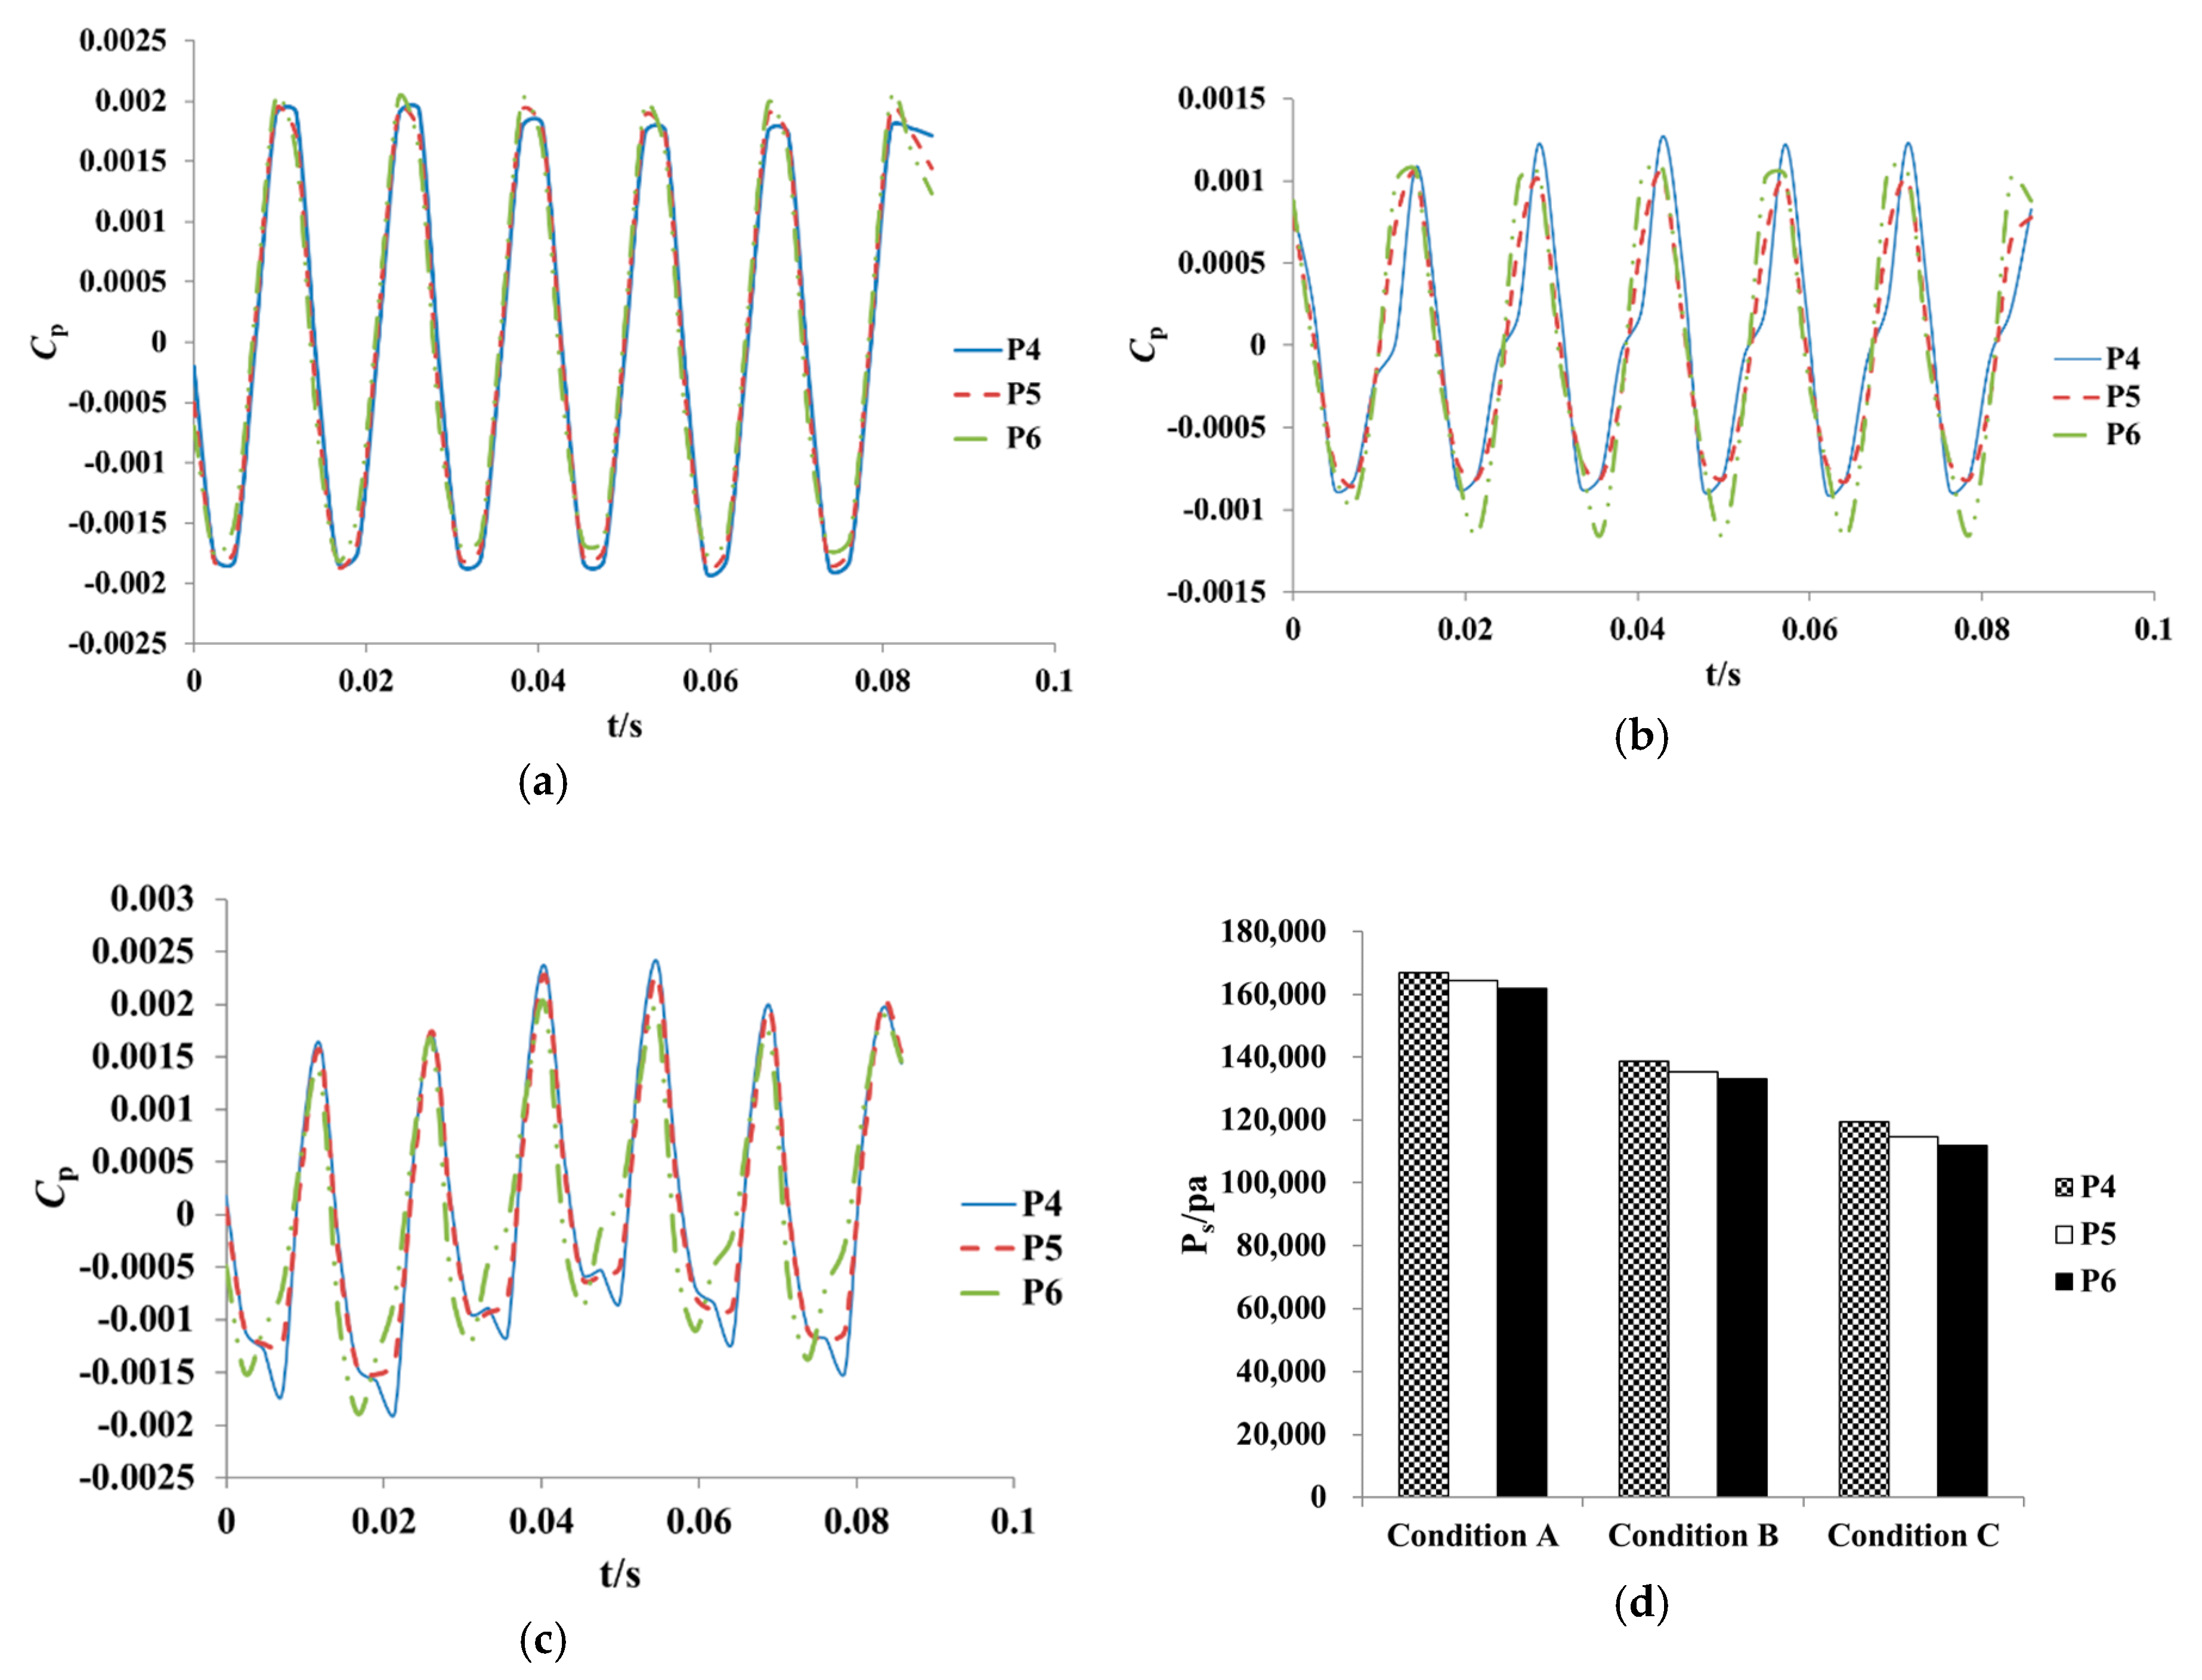
Figure 24 shows the pressure pulsation time domain diagram and comparison of pressure pulsation amplitude of the monitoring probes P4–P6 in a period under different conditions.
Table 5 lists the main frequency, the secondary frequency, and the corresponding pressure amplitude of the monitoring probes P4–P6 under different conditions.
Under the same condition, the pressure pulsation amplitude of P4–P6 decreases successively. Thus, the pressure pulsation amplitude near the shroud of the impeller inlet is higher than near the hub of the impeller outlet. Under condition A, B, and C, the pressure pulsation amplitude of P4 is 1.03 times, 1.04 times, and 1.07 times of P6. Under different conditions, the pressure pulsation amplitude decreases with the reducing flow rate, which indicates that the pressure pulsation amplitude has a positive correlation with the flow rate.
Under condition A, the MF and SF of each monitoring probe are 26.25 Hz and 70 Hz. The pressure pulsation amplitude corresponding to MF is slightly higher than SF. Under condition B, the MF and the SF of each monitoring probe are also 26.25 Hz and 70 Hz. For monitoring probes P4–P6, the pressure pulsation amplitude of MF is 1.98 times, 1.95 times, and 1.55 times of SF. Under condition C, the MF and SF of the monitoring probe P4 are 70 Hz and 26.25 Hz. The MF and SF of the monitoring probes P5 and P6 are 26.25 Hz and 70 Hz, and the pressure pulsation amplitudes of MF and SF are consistent.
Figure 25 shows the pressure pulsation time domain diagram and comparison of pressure pulsation amplitude of the monitoring probes P1–P3 in a period under different conditions.
Table 6 lists the main frequency, the secondary frequency, and the corresponding pressure amplitude of the monitoring probes P1–P3 under different conditions.
Under the same condition, the pressure pulsation amplitudes of the monitoring probes P1–P3 increase sequentially. The pressure pulsation amplitude near the hub of the GVs outlet is higher than it near the shroud of the GVs outlet. Under condition A, B, and C, the pressure pulse amplitude of P1 is 1.02 times of P3. The pressure pulsation amplitude on the same monitoring probe under different conditions is positively correlated with the flow rate.
Under condition A, the MF and the SF of P1–P3 are 26.25 Hz and 40.83 Hz, which are 2.25 times and 3.50 times of the shaft frequency. The pressure pulsation amplitude of the MF is about 3 times of SF. Under condition B, the MF and the SF of P1–P3 are also 26.25 Hz and 40.83 Hz. The pressure pulsation amplitude of the MF is also about 3 times of SF. Under condition C, the MF and SF of P1 are 29.62 Hz and 41.46 Hz. The MF and SF of P2 are 29.17 Hz and 40.83 Hz. The MF and SF of P3 are 29.17 Hz and 40.83 Hz. The MF and SF of P1–P3 are no longer consistent and lacks of regularity. On one hand, the rotation of impeller and shaft affects the flow downstream a little for the outlet of GV is far from the impeller. On the other hand, the flow pattern in the propulsion pump is not stable and the MF and the SF on each monitoring probe are fluctuating in the low frequency range.


