Article

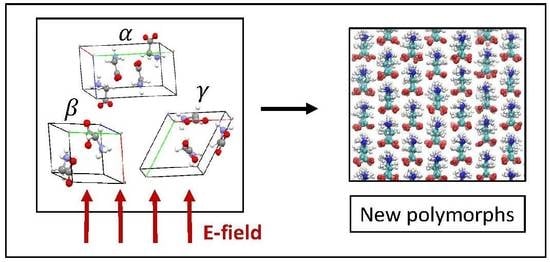
Exploring New Crystal Structures of Glycine via Electric Field-Induced Structural Transformations with Molecular Dynamics Simulations

by
Pelin Su Bulutoglu
1,†,
Conor Parks
2,†,
Nandkishor K. Nere
3,
Shailendra Bordawekar
3 and
Doraiswami Ramkrishna
1,*
1
School of Chemical Engineering, Purdue University, 480 West Stadium Mall, West Lafayette, IN 47907, USA
2
Department of Chemistry and Biochemistry, University of California, San Diego, 9500 Gilman Drive, La Jolla, CA 92093, USA
3
Process Research & Development, AbbVie, Inc., 1 North Waukegan Road, North Chicago, IL 60064, USA
*
Author to whom correspondence should be addressed.
These authors contributed equally to this work.
Processes 2019, 7(5), 268; https://doi.org/10.3390/pr7050268
Submission received: 28 March 2019 / Revised: 28 April 2019 / Accepted: 3 May 2019 / Published: 8 May 2019
(This article belongs to the Special Issue Modeling and Control of Crystallization)

Abstract

:
Being able to control polymorphism of a crystal is of great importance to many industries, including the pharmaceutical industry, since the crystal’s structure determines significant physical properties of a material. While there are many conventional methods used to control the final crystal structure that comes out of a crystallization unit, these methods fail to go beyond a few known structures that are kinetically accessible. Recent studies have shown that externally applied fields have the potential to effectively control polymorphism and to extend the set of observable polymorphs that are not accessible through conventional methods. This computational study focuses on the application of high-intensity dc electric fields (e-fields) to induce solid-state transformation of glycine crystals to obtain new polymorphs that have not been observed via experiments. Through molecular dynamics simulations of solid-state α -, β -, and γ -glycine crystals, it has been shown that the new polymorphs sustain their structures within 125 ns after the electric field has been turned off. It was also demonstrated that strength and direction of the electric field and the initial structure of the crystal are parameters that affect the resulting polymorph. Our results showed that application of high-intensity dc electric fields on solid-state crystals can be an effective crystal structure control method for the exploration of new crystal structures of known materials and to extend the range of physical properties a material can have.

Graphical Abstract

1. Introduction

A solid material’s physical properties, such as dissolution rate, shelf life, nucleation rate, growth rate, and solubility are closely related to its crystal structure. Among these properties, solubility and dissolution rate are directly related to the bioavailability of a drug. A prominent example of polymorphism influencing the bioavailability of an active pharmaceutical ingredient is the antiretroviral drug, ritonavir. Shortly after its release in 1998, it was found that a more stable, less soluble crystalline phase was crystallizing as a result of the manufacturing process. This led to withdrawal of the pharmaceutical from the market until the product was reformulated with the most stable polymorph. Thus, being able to control the resulting structure of crystals is of extreme importance for many industries, including the pharmaceutical industry. Conventional control methods, such as seeding [1,2] and solvent control [3,4] are effective in achieving the desired polymorph, but fail to go beyond a few polymorphs with the lowest energies that are kinetically accessible. However, there are 230 different space groups that molecules can be arranged in, and being able to explore these structures with the help of novel methods can drastically extend the range of physical properties a material can have. Recent studies have shown that externally applied fields have the potential to effectively control polymorphism and to extend the set of observable polymorphs that is not accessible through conventional methods, by altering the molecular Hamiltonian [5,6,7].
External application of electric fields is regarded as a promising new method for polymorph control. Application of an electric field induces collective alignment of dipoles, which alters the thermodynamics and kinetics of accessible crystallization paths. A static electric field perturbs the system’s Hamiltonian H by an additional term H e that accounts for the presence of the electric field. This addition is defined as follows:
H e = μ tot · E
where μ tot is the total dipole vector and E is the electric field vector. Computational studies have confirmed the inducing effect of an electric field on the nucleation of water [8,9]. More interestingly, formation of a new quartz-like polymorph of ice that has never been observed before upon crystallization under the static electric field [10] has been reported. Similar results showing the formation of new polymorphs were obtained experimentally with coronene in the presence of magnetic fields [6] and vinyl-PC in the presence of the dc electric field [5].
The effect of externally applied electric fields on crystallization from solution was observed experimentally through a set of studies by Garetz et al., where supersaturated solutions of urea [11], glycine [12,13], lyzosyme [14], and L-histidine [15] were subjected to laser pulses. It was observed that the laser pulses induced nucleation from these supersaturated solutions, a phenomenon called non-photochemical laser-induced nucleation (NPLIN). It is hypothesized that the oscillating electric field caused by the laser aligned the dipole moments of the molecules, which facilitated their alignment into the crystal structure [11]. More interestingly, it was reported that different polymorphs of glycine could crystallize under different polarizations of light [16]. This shows that externally applied electric fields have the potential to control the resulting polymorph and even create new polymorphs of some substances. In light of these findings, Parks et al. used MD simulations to study the effect of e-fields of varying strengths on the structure and dissolution/growth rate of glycine and paracetamol nanocrystals [7,17]. They observed that the applied electric field led to solid-state transformation of the nanocrystals into a new polymorph that has not been observed before. However, the new polymorphs were not stable after the electric field had been turned off.
It is known that it is much more difficult for structural transformations to take place in solid-state compared to solvent-mediated transformation due to a significant kinetic barrier [18]. Moreover, according to Paul and Curtin’s theory on the steps that must occur for a solid-state transformation, the process of conversion from one solid-state to another starts at the defect sites [19], which are disordered and have higher energy. Since a nanocrystal in solvent is confined in a layer of high-energy surface molecules, it is hypothesized that the solid-state transformation of the glycine nanocrystals in the aforementioned study by Parks et al. [17] starts at the surface molecules and proceeds from there until the nanocrystal is transformed back to its original structure. The high surface area-to-volume ratio of the nanocrystals in solution is viewed as the main element driving the instability in the absence of the field. Consequently, this study aims to test this hypothesis by simulating solid-state crystals of the known polymorphs of glycine ( α -, β -, and γ -glycine) under a high-intensity dc electric field, and monitoring any crystal structure changes during and after the application of the electric field. Moreover, it is aimed at observing the effect of various operational parameters, such as strength and direction of the electric field on the emerging crystal structure. Although the effect of externally applied electric fields on the structural and electronic properties of energetic materials [20,21] has been studied before, to the best of our knowledge, there have been no studies regarding solid-state transformations of organic materials upon the application of an electric field.

2. Methods

2.1. Simulation Details

All molecular dynamics simulations were done using GROMACS 2016.5 [22]. For simulations of glycine crystals, the Generalized Amber Force Field [23] was used with CNDO point charges, since this force field/point charges combination has been shown to accurately reproduce the physical properties of glycine systems [24]. α -, β -, and γ - polymorphs of glycine were subjected to varying intensities of electric fields, and the structural changes of the crystals were observed via molecular dynamics simulations. The unit cell structures of the three polymorphs of glycine were taken from the database of CCDC [25,26,27] (Figure 1), and the unit cells were replicated in x, y, and z directions to create the super-cell structures. Periodic boundary conditions were applied, so no surface effects were present. The crystal super-cells of α -, β -, and γ -glycine contained 2000, 1980, and 1920 glycine molecules, respectively. The crystal slabs were subjected to energy minimization with the steepest descent minimization algorithm, with an energy minimization tolerance of 100.0 kJ/mol/nm, followed by NVT and NPT equilibrations, respectively. The temperature was fixed at 298 K and the pressure was set to 1 bar in all simulations. Modified Berendsen coupling, which contains an additional stochastic term to ensure that a canonical ensemble is generated [28], was used for temperature coupling with a time constant of 0.1 ps. To set the pressure to its desired value, anisotropic pressure coupling was applied due to the inherent anisotropy of the crystals, using Berendsen pressure coupling [29] with a time constant of 2.0 ps. For physical property calculations, isotropic Parrinello-Rahman pressure coupling [30] was used, following equilibration with Berendsen pressure coupling. Isothermal compressibility of water, which is 4.5 × 10 5 bar−1, was taken as an estimate for the thermal compressibility [31]. Prior to 4 ns of anisotropic pressure equilibration, the pressure was equilibrated isotropically for 4 ns to avoid extreme deformation of the simulation box. After equilibration, production runs with electric field were run for 5 ns, and the results were analyzed. Short-range non-bonded and electrostatic forces were truncated at 1.4 nm. The particle mesh Ewald summation algorithm was employed for calculation of long-range electrostatic forces, with an interpolation order of 4 and a Fourier spacing of 0.12 nm. The equations of motion were integrated using the Verlet leap-frog integrator with a time step of 2 fs. Bond constraints were applied to all bonds using the LINCS algorithm with an order of 4, and the number of iterations to correct for rotational lengthening was set as 1.
A parametric study was done to observe the effects of the initial structure of the crystals, as well as the direction and strength of the electric field. The conditions of the simulations are summarized in Table 1.

2.2. Analysis Methods

2.2.1. Dipole Alignment Analysis

Alignment of the molecules within the crystal with the direction of the electric field can be quantified by calculating c o s ( θ ) , cosine of the angle between the dipole moments of the molecules and the direction of the electric field ( θ ) averaged over the number of molecules in the crystal. Equation (2) was used to calculate the dipole moment of a single molecule:
μ = i = 1 N q i r i
where the summation is over the N atoms in the molecule, q i is the charge of the ith atom, and r i is the position of the ith atom. The magnitude of the dipole moment of the glycine zwitterion was calculated to be 10.97 D.

2.2.2. Crystal Structure Analysis

To characterize the new polymorphs that were obtained upon application of the e-field, two vectors were defined within the glycine molecule: V 1 , defined as the vector connecting the two carbon atoms (see C and CA in Figure 2), and V 2 , defined as the vector connecting the carbon and nitrogen atoms (CA and N in Figure 2). Then, for each vector, the distribution of the dihedral angle between the vector of a glycine molecule in the crystal and those of the neighboring molecules were calculated ( ϕ 1 and ϕ 2 for V 1 and V 2 , respectively). This provided us with two order parameters that enabled a comparison between different crystal structures. Order parameters of this type have been used in the literature to differentiate between crystal structures [32]. To see whether these two order parameters are sufficient to distinguish between polymorphs of glycine, the angle distributions for the known polymorphs of glycine have been plotted in Figure 3.
Distributions of ϕ 1 angles for α - and β -glycine crystals can be seen to peak at around 0° and 180°, whereas there is a single peak around 0° for γ -glycine, which is consistent with the experimental structures. The distinction between α - and β -glycine structures is visible when the distribution of ϕ 2 is observed. Distribution of ϕ 2 angles peaks at around 0° and 180° for α -glycine, which shows that molecules are packed in α -glycine such that their CA-N axes are aligned parallel and anti-parallel to each other. On the other hand, for β -glycine, the ϕ 2 angle mainly peaks at around 0°, with an additional wider and shorter peak around ∼150°. Although the molecules are packed similarly in α - and β -glycine crystals, a slight difference can be observed in the distribution of ϕ 2 , which shows that relative orientations of the molecules in β -glycine fluctuate more freely compared to those in the α -glycine. The peak at around −120° for γ -glycine is consistent with the experimentally observed helical chain structure around a three-fold screw axis [33].

3. Results and Discussion

The change in c o s ( θ ) with time upon application of the e-field on an initially α -glycine crystal in the y-direction at varying e-field strengths is plotted in Figure 4. A rapid increase in c o s ( θ ) is observed immediately after the e-field is applied in all cases. This increase is the result of a solid-state transition into a new polymorph, in which the molecules are rotated such that their dipole moments are aligned with the e-field. To observe the extent of the change in crystal structure with the application of an e-field, distributions of ϕ 1 and ϕ 2 are plotted for the crystals obtained at different strengths in Figure 5. The angle distributions show that completely new crystal structures have been obtained from the initial α -glycine structure in the cases of V = 1.0 and 1.50 V/nm. However, when the e-field is applied with a strength of 0.5 V/nm, the resulting crystal structure is very similar to the initial structure: The only difference is that the left tail of the peak of ϕ 2 around 180° is longer for the crystal obtained upon application of the e-field (Figure 5 (Right)). This shows that the crystal does not actually undergo a transformation under the low-intensity e-field, but the e-field causes some molecules to fluctuate more towards the direction of the e-field, causing the slight increase in the c o s ( θ ) observed in Figure 4. Since a solid-state transformation does not take place, the increase in c o s ( θ ) occurs very rapidly. For strengths between 0.25 and 0.75 V/nm, the increase in c o s ( θ ) finalizes within the first 50 ps, whereas the transition into a high-order parameter (in the case of V = 1.0–1.5 V/nm) takes more time to complete. The time required for the crystal to take its final structure was found to be 100 ps, 150 ps, and 250 ps for the strengths of 1.5 V/nm, 1.25 V/nm, and 1.0 V/nm, respectively.
As mentioned in Section 1, it is expected that the solid-state crystals of the new polymorphs obtained upon application of e-field will not undergo a transition after the e-field is turned off, as opposed to the nanocrystals in solution reported in [17], since there are no high-energy surface molecules. To test whether or not the new polymorphs will sustain their structures after the e-field is turned off, the crystals obtained after the application of e-field were simulated for an additional 125 ns without an e-field. Figure 6 shows the c o s ( θ ) against time during and after the application of an e-field with different strengths on an initially α -glycine crystal. For the high-intensity cases ( V = 1.0 V/nm and V = 1.5 V/nm), it can be observed that no change in the alignment of molecules with the direction of the e-field took place even 125 ns after the e-field had been turned off, which is 25 times the duration of the e-field application. This shows that the e-field caused a solid-state transformation that led to metastable new crystal structures when applied to solid single crystals of glycine, whereas glycine nanocrystals in solution subjected to e-field were reported to lose their structure within 5 ns after the field had been turned off [17]. With the absence of highly mobile surface molecules in the solid-state, there exists a high kinetic barrier for a subsequent change in structure. In the case of V = 0.5 V/nm, on the other hand, a slight increase in c o s ( θ ) ( 0.1 ) is observed upon application of e-field, which rapidly goes back to zero after the e-field is turned off. As discussed earlier, the change in c o s ( θ ) does not correspond to a transformation in the crystal structure, but is attributed to the favored fluctuations of the molecules toward the direction of the e-field. Thus, c o s ( θ ) quickly goes back to zero when the e-field is turned off.

3.1. Effect of Initial Crystal Structure

The influence of the initial structure on the resulting crystal structure upon application of e-field was studied by subjecting the three known polymorphs of glycine to an e-field. A brief introduction to the structures of the initial polymorphs is deemed necessary to understand the responses of these polymorphs to the e-field. α - and β - glycine have similar structures in the sense that they are both monoclinic and packed in hydrogen-bonded layers that are formed from centrosymmetric dimers. These layers, extending along the ac-plane, which corresponds to the xz-plane in this study, have the same configuration in both forms [33]. The difference between the two stems from the hydrogen bonds between the layers extending along the b-direction of the unit cell [33], which corresponds to the y-direction in this study. α -glycine is packed in bilayers, in which pairs of layers are bonded together and bilayers interact via weaker C-H⋯O interactions. The layers in β -glycine are packed as single layers, interacting via N-H⋯O hydrogen bonds, contrasting with the bilayer structure of α -glycine. γ -glycine, on the other hand, is trigonal and packs in helical chains around the three-fold screw axis that is parallel to the c-axis [34], which corresponds to the z-direction in this study.
Due to the differences in the initial structures, different responses to the electric field is expected from the different polymorphs. Figure 7 shows the structures of the new polymorphs obtained when the electric field is initially applied on α -, β -, and γ -glycine crystals in the y-direction with a strength of 1.5 V/nm, the highest strength used in the study. From here onward, the new polymorphs are referred to by using codenames for convenience. The initial letter in the codename corresponds to the initial polymorph that was subjected to an e-field, where the second letter corresponds to the direction in which the e-field is applied, and the number following the letter corresponds to the strength of the e-field in V/nm. It can be observed in Figure 7, just by visual inspection, that α - and γ -glycine has undergone a transformation into a similar structure ( α -y1.5 and γ -y1.5), whereas β -glycine transformed into a different structure ( β -y1.5) under the same conditions.
To evaluate the difference in the crystal structures of the polymorphs obtained from different initial structures, distributions of ϕ 1 and ϕ 2 were calculated for each new structure. The angle distributions of the polymorphs obtained when the e-field is applied in the x- and y-directions on the known polymorphs are given in Figure 8a,b, respectively. The angle distributions show that when the e-field is applied in the x-direction, the initially α - and β -glycine crystals transform into the same structure, whereas γ -glycine transforms into a different structure, as the ϕ 1 distribution of γ -x1.5 is unimodal, whereas those of α -x1.5 and β -x1.5 are bimodal. This can be justified by the fact that α - and β -glycine have very similar molecular structures along the xz plane, and their difference results from the interlayer bonds that extend along the y-direction. On the other hand, when the e-field is applied in the y-direction, α - and γ -glycine transform into the same structure, where β -glycine transforms into a different polymorph. Increasing the intensity of the e-field in the y-direction, however, results in further transformation of β -glycine into the same polymorph as α -y1.5 and γ -y1.5, as shown in Figure 8b. This structure is observed when all molecules within the crystal are perfectly aligned with the e-field and the resulting c o s ( θ ) is close to 1.

3.2. Effect of e-Field Strength and Direction

The time averages of c o s ( θ ) values of molecules in initially α -, β -, and γ -glycine crystals are plotted against the e-field strengths in Figure 9. It can clearly be seen that the alignment of the molecules with the e-field increases as the strength of the e-field increases. This is expected, since the increased strength of the e-field results in a bigger contribution to the Hamiltonian, enabling the system to overcome higher energy barriers that lead to new conformations with better alignment. This hypothesis is further supported by the fact that the alignment of the molecules in the resulting conformation does not change until a certain threshold in the intensity of the electric field is crossed. For instance, in Figure 9c, c o s ( θ ) increases from zero to 0.25 with an intensity of 0.50 V/nm, then stays at that value for the intensities of 0.75, 1.00, and 1.25 V/nm. Only when the intensity is increased to 1.50 V/nm does the crystal take its new polymorphic form with complete alignment with the electric field. It is possible that the system is stuck at a new energy minimum between the intensities of 0.50–1.25 V/nm and manages to cross the barrier to another new conformation only when the intensity is 1.50 V/nm. One exception to the trend mentioned above is the peak that c o s ( θ ) makes at V = 0.5 V/nm for the initially β -glycine crystal. It is possible that the strong e-fields (0.75 V/nm and above) force the molecules to rotate rapidly into a new, high-energy structure, where the crystal gets stuck at a new potential energy basin. On the other hand, lower-strength (V = 0.5 V/nm) e-fields are not strong enough to facilitate the transition into the same high-energy structure, but strong enough to initiate a slower transition into a different, lower-energy structure. The potential energies of β -y0.5 and β -y0.75 were calculated as −322.2 and −317.9 kJ/mol, respectively, which supports this idea.
Another conclusion drawn from the parametric study is that the e-field has an anisotropic effect on the structural changes in the crystal. This can be explained by the anisotropic nature of the crystal caused by the number and strengths of the hydrogen bonds among the molecules varying along the three directions. A similar anisotropic effect was observed upon the application of an e-field onto the crystals of lead azide [21] and in the experimental study of Dawson et al. [35], in which polymorphs of glycine were subjected to high pressure to observe the structural changes. Of the three directions, the highest c o s ( θ ) was observed when the e-field was applied in the y-direction. Complete alignment was not observed in any of the runs in the x-direction, but some structural change due to the electric field was still observed in some cases. In the z-direction, however, no structural change was observed in any of the polymorphs with any of the strengths applied. The reason for this can be readily seen in Figure 9c for γ -glycine, since there is already a dipole moment in the z-direction and the e-field in z-direction does not exert any additional force that results in rotational movement of molecules. For α - and β -glycine, on the other hand, the layers that extend along the ac-plane sit parallel to the z-direction, so the dipole moments of the molecules are already aligned with the direction of the e-field. In the light of the aforementioned findings, it can be concluded that the initial structure of the crystal, as well as the strength and direction of the e-field, play an important role in the crystal structure of the new polymorph.

3.3. Analysis of the New Crystals

In this section, some properties of the new polymorphs are presented and compared to the known polymorphs of glycine. Table 2 shows selected properties of both the known polymorphs and the new ones obtained when the e-field is subjected in the y-direction with a strength of 1.5 V/nm. The properties were calculated from 125 ns long simulations at 1 bar and 298 K without the presence of the e-field. It was mentioned in the previous sections that α -y1.5, γ -y1.5, and β -y2.0 crystals were found to have very similar structures. Consistently, the results in Table 2 show that these two crystals have similar physical properties, supporting our previous conclusions.
It can be observed that β -y1.5 has higher potential energy and enthalpy values compared to the known β -glycine structure. Although this is not a sufficient measure to make conclusions about the relative stability of the new polymorph, since the simulations are done at 298 K, it is still worth mentioning that this new polymorph is energetically less favorable than its precursor. However, α -y1.5, γ -y1.5, and β -y2.0 have energies that are comparable, if not slightly lower, compared to their precursors. This shows that the molecules are packed efficiently in this new structure with complete alignment, and no unrealistic bonds with high energy are present. Moreover, enthalpies of α -y1.5, β -y2.0, and γ -y1.5 were found to be comparable with each other, but significantly lower compared to the enthalpy of β -y1.5. The same trend can be observed when the density and specific volume values are examined. It is interesting to note that densities of the new α -y1.5, β -y2.0, and γ -y1.5 crystals are higher compared to the densities of α - and γ -glycine crystals, which shows that the molecules are more densely packed in this new crystal structure. The β -y1.5 crystal, on the other hand, has a much lower density, both compared to the initial β -glycine crystal and α -y1.5 and γ -y1.5 crystals.

4. Conclusions

It was shown via MD simulations that single solid-state α -, β -, and γ -glycine crystals subjected to high-intensity dc electric fields undergo solid-state transformation to form new crystal structures, provided that the strength of the e-field is high enough to overcome the energy barrier for the transition. Stability of the new polymorphs were evaluated by turning the e-field off and simulating the crystals for an additional 125 ns, which is 25 times longer than the duration of the e-field application. Unlike the nanocrystals reported in the study by Parks et al. [17], the new polymorphs did not undergo any structural changes during the period after the e-field was switched off, which was attributed to the absence of high-energy surface molecules that lower the kinetic barrier for solid-state transformations significantly. A parametric study was conducted to observe the effects of strength and direction of the e-field, as well as the initial structure. The results showed that the direction of the e-field has an important influence on the resulting crystal structure. No transformation has been observed when the e-field was applied in the z-direction (along the c-axis of the crystals). Moreover, alignment of the dipole moments of molecules within the crystal with the direction of the e-field was found to increase as the strength of the e-field increases. Different crystal structures have been observed to respond differently to the e-field. However, studies with e-fields in the y-direction showed that all three initial polymorphs transformed into the same structure when the intensity of the e-field was high enough to achieve complete alignment of molecules with the e-field. Calculation of properties of the known and new polymorphs revealed that the new polymorphs that were identified to have the same structure also had similar physical properties. Our results showed that application of high-intensity dc electric fields on solid-state crystals can be an effective crystal structure control method to explore new crystal structures of known materials and to extend the range of physical properties which a material can have.

Author Contributions

Conceptualization, C.P. and P.S.B.; methodology, C.P. and P.S.B.; validation, P.S.B. and C.P.; formal analysis, P.S.B. and C.P.; investigation, P.S.B.; resources, D.R., N.K.N. and S.B.; data curation, P.S.B. and C.P.; writing—original draft preparation, P.S.B.; writing—review and editing, P.S.B., C.P. and D.R.; visualization, P.S.B.; supervision, D.R., N.K.N., S.B.; project administration, D.R., N.K.N., S.B.; funding acquisition, D.R., N.K.N., S.B. Data were generated by Purdue University. AbbVie Inc., North Chicago, USA, provided financial support for a studentship of P.S.B.; N.K.N., and S.B. are present employees of AbbVie Inc.

Funding

This study was sponsored by AbbVie Inc. through Grant Number 8000053025 and 8000069224.

Conflicts of Interest

The authors declare no conflict of interest.

References

  1. Beckmann, W. Seeding the desired polymorph: Background, possibilities, limitations, and case studies. Org. Process. Res. Dev. 2000, 4, 372–383. [Google Scholar] [CrossRef]
  2. Cimarosti, Z.; Castagnoli, C.; Rossetti, M.; Scarati, M.; Day, C.; Johnson, B.; Westerduin, P. Development of drug substances as mixture of polymorphs: Studies to control form 3 in casopitant mesylate. Org. Process. Res. Dev. 2010, 14, 1337–1346. [Google Scholar] [CrossRef]
  3. Weissbuch, I.; Torbeev, V.Y.; Leiserowitz, L.; Lahav, M. Solvent effect on crystal polymorphism: Why addition of methanol or ethanol to aqueous solutions induces the precipitation of the least stable β form of glycine. Angew. Chem. 2005, 117, 3290–3293. [Google Scholar] [CrossRef]
  4. Kitamura, M.; Hara, T.; Takimoto-Kamimura, M. Solvent effect on polymorphism in crystallization of BPT propyl ester. Cryst. Growth Des. 2006, 6, 1945–1950. [Google Scholar] [CrossRef]
  5. Adrjanowicz, K.; Paluch, M.; Richert, R. Formation of new polymorphs and control of crystallization in molecular glass-formers by electric field. Phys. Chem. Chem. Phys. 2018, 20, 925–931. [Google Scholar] [CrossRef]
  6. Potticary, J.; Terry, L.R.; Bell, C.; Papanikolopoulos, A.N.; Christianen, P.C.; Engelkamp, H.; Collins, A.M.; Fontanesi, C.; Kociok-Köhn, G.; Crampin, S.; et al. An unforeseen polymorph of coronene by the application of magnetic fields during crystal growth. Nat. Commun. 2016, 7, 11555. [Google Scholar] [CrossRef] [Green Version]
  7. Parks, C.; Koswara, A.; Tung, H.H.; Nere, N.; Bordawekar, S.; Nagy, Z.K.; Ramkrishna, D. Molecular dynamics electric field crystallization simulations of paracetamol produce a new polymorph. Cryst. Growth Des. 2017, 17, 3751–3765. [Google Scholar] [CrossRef]
  8. Svishchev, I.M.; Kusalik, P.G. Crystallization of liquid water in a molecular dynamics simulation. Phys. Rev. Lett. 1994, 73, 975. [Google Scholar] [CrossRef] [PubMed]
  9. Yan, J.; Patey, G. Molecular dynamics simulations of ice nucleation by electric fields. J. Phys. Chem. 2012, 116, 7057–7064. [Google Scholar] [CrossRef]
  10. Svishchev, I.M.; Kusalik, P.G. Quartzlike polymorph of ice. Phys. Rev. B 1996, 53, R8815. [Google Scholar] [CrossRef]
  11. Garetz, B.; Aber, J.; Goddard, N.; Young, R.; Myerson, A. Nonphotochemical, polarization-dependent, laser-induced nucleation in supersaturated aqueous urea solutions. Phys. Rev. Lett. 1996, 77, 3475. [Google Scholar] [CrossRef]
  12. Sun, X.; Garetz, B.A.; Myerson, A.S. Supersaturation and polarization dependence of polymorph control in the nonphotochemical laser-induced nucleation (NPLIN) of aqueous glycine solutions. Cryst. Growth Des. 2006, 6, 684–689. [Google Scholar] [CrossRef]
  13. Aber, J.E.; Arnold, S.; Garetz, B.A.; Myerson, A.S. Strong dc electric field applied to supersaturated aqueous glycine solution induces nucleation of the γ polymorph. Phys. Rev. Lett. 2005, 94, 145503. [Google Scholar] [CrossRef]
  14. Lee, I.S.; Evans, J.M.; Erdemir, D.; Lee, A.Y.; Garetz, B.A.; Myerson, A.S. Nonphotochemical laser induced nucleation of hen egg white lysozyme crystals. Cryst. Growth Des. 2008, 8, 4255–4261. [Google Scholar] [CrossRef]
  15. Sun, X.; Garetz, B.A.; Myerson, A.S. Polarization switching of crystal structure in the nonphotochemical laser-induced nucleation of supersaturated aqueous l-histidine. Cryst. Growth Des. 2008, 8, 1720–1722. [Google Scholar] [CrossRef]
  16. Zaccaro, J.; Matic, J.; Myerson, A.S.; Garetz, B.A. Nonphotochemical, laser-induced nucleation of supersaturated aqueous glycine produces unexpected γ-polymorph. Cryst. Growth Des. 2001, 1, 5–8. [Google Scholar] [CrossRef]
  17. Parks, C.; Koswara, A.; Tung, H.H.; Nere, N.; Bordawekar, S.; Nagy, Z.K.; Ramkrishna, D. Extending the Crystal Landscape Through Electric Field Controlled Crystallization—A Molecular Dynamics Case Study. ChemRxiv 2018. [Google Scholar] [CrossRef]
  18. Byrn, S.R.; Zografi, G.; Chen, X.S. Solid-State Properties Of Pharmaceutical Materials; John Wiley & Sons: Hoboken, NJ, USA, 2017. [Google Scholar]
  19. Yu, L.; Stephenson, G.A.; Mitchell, C.A.; Bunnell, C.A.; Snorek, S.V.; Bowyer, J.J.; Borchardt, T.B.; Stowell, J.G.; Byrn, S.R. Thermochemistry and conformational polymorphism of a hexamorphic crystal system. J. Am. Chem. Soc. 2000, 122, 585–591. [Google Scholar] [CrossRef]
  20. Li, Z.; Huang, H.; Zhang, T.; Zhang, S.; Zhang, J.; Yang, L. First-principles study of electric field effects on the structure, decomposition mechanism, and stability of crystalline lead styphnate. J. Mol. Model. 2014, 20, 2072. [Google Scholar] [CrossRef]
  21. Li, Z.; Huang, H.; Zhang, T.; Xu, J.; Zhang, J.; Yang, L. Electric-Field-Induced Structural and Electronic Changes and Decomposition of Crystalline Lead Azide: A Computational Study. J. Phys. Chem. C 2015, 119, 8431–8437. [Google Scholar] [CrossRef]
  22. Abraham, M.J.; Murtola, T.; Schulz, R.; Páll, S.; Smith, J.C.; Hess, B.; Lindahl, E. GROMACS: High performance molecular simulations through multi-level parallelism from laptops to supercomputers. SoftwareX 2015, 1, 19–25. [Google Scholar] [CrossRef]
  23. Wang, J.; Wolf, R.M.; Caldwell, J.W.; Kollman, P.A.; Case, D.A. Development and testing of a general amber force field. J. Comput. Chem. 2004, 25, 1157–1174. [Google Scholar] [CrossRef] [Green Version]
  24. Cheong, D.W.; Boon, Y.D. Comparative study of force fields for molecular dynamics simulations of α-glycine crystal growth from solution. Cryst. Growth Des. 2010, 10, 5146–5158. [Google Scholar] [CrossRef]
  25. Jönsson, P.G.; Kvick, Å. Precision neutron diffraction structure determination of protein and nucleic acid components. III. The crystal and molecular structure of the amino acid α-glycine. Acta Crystallogr. Sect. B Struct. Crystallogr. Cryst. Chem. 1972, 28, 1827–1833. [Google Scholar] [CrossRef]
  26. Drebushchak, T.N.; Boldyreva, E.V.; Shutova, E.S. β-Glycine. Acta Crystallogr. Sect. Struct. Rep. Online 2002, 58, o634–o636. [Google Scholar] [CrossRef]
  27. Iitaka, Y. The crystal structure of β-glycine. Acta Crystallogr. 1960, 13, 35–45. [Google Scholar] [CrossRef]
  28. Bussi, G.; Donadio, D.; Parrinello, M. Canonical sampling through velocity rescaling. J. Chem. Phys. 2007, 126, 014101. [Google Scholar] [CrossRef] [Green Version]
  29. Berendsen, H.J.; Postma, J.V.; van Gunsteren, W.F.; DiNola, A.; Haak, J. Molecular dynamics with coupling to an external bath. J. Chem. Phys. 1984, 81, 3684–3690. [Google Scholar] [CrossRef]
  30. Parrinello, M.; Rahman, A. Polymorphic transitions in single crystals: A new molecular dynamics method. J. Appl. Phys. 1981, 52, 7182–7190. [Google Scholar] [CrossRef]
  31. Abraham, M.; Hess, B.; van der Spoel, D.; Lindahl, E. User Manual; Version 5.0.7; The GROMACS Development Teams at the Royal Institute of Technology and Uppsala University: Uppsala, Sweden, 2015. [Google Scholar]
  32. Mandal, T.; Larson, R.G. Nucleation of urea from aqueous solution: Structure, critical size, and rate. J. Chem. Phys. 2017, 146, 134501. [Google Scholar] [CrossRef]
  33. Iitaka, Y. The crystal structure of γ-glycine. Acta Crystallogr. 1958, 11, 225–226. [Google Scholar] [CrossRef]
  34. Di Profio, G.; Reijonen, M.T.; Caliandro, R.; Guagliardi, A.; Curcio, E.; Drioli, E. Insights into the polymorphism of glycine: Membrane crystallization in an electric field. Phys. Chem. Chem. Phys. 2013, 15, 9271–9280. [Google Scholar] [CrossRef]
  35. Dawson, A.; Allan, D.R.; Belmonte, S.A.; Clark, S.J.; David, W.I.; McGregor, P.A.; Parsons, S.; Pulham, C.R.; Sawyer, L. Effect of high pressure on the crystal structures of polymorphs of glycine. Cryst. Growth Des. 2005, 5, 1415–1427. [Google Scholar] [CrossRef]
Figure 1. Unit cells of α -, β -, and γ -glycine. Arrows indicate the x-, y-, and z- directions in which the e-field was applied.
Processes 07 00268 g001
Figure 2. Glycine zwitterion. V 1 is a vector that connects the CA and C atoms within the molecule, and V 2 is a vector that connects the CA and N atoms within the molecule.
Processes 07 00268 g002
Figure 3. Relative orientation vectors of the molecules in the known polymorphs of glycine. (Left) distribution of ϕ 1 angles, (right) distribution of ϕ 2 angles. Distributions were obtained from 1 ns long NPT simulations of α -, β -, and γ -glycine crystals.
Processes 07 00268 g003
Figure 4. Change in c o s ( θ ) vs. time upon application of e-field on the initially α -glycine crystal. E-field was applied in the y-direction with strengths changing between 0.25 and 1.5 V/nm.
Processes 07 00268 g004
Figure 5. Relative orientation vectors of the molecules in the new crystals obtained upon application of e-field in y-direction on an initally α -glycine crystal with V = 0.5 , 1.0 and 1.5 V/nm. (Left) distribution of ϕ 1 angles, (right) distribution of ϕ 2 angles.
Processes 07 00268 g005
Figure 6. (Left) Alignment of the molecules in an initially α -glycine crystal. An electric field with a strength of 0.5 V/nm (red), 1.0 V/nm (black), and 1.5 V/nm (blue) was applied for 5 ns and then turned off. The simulation was carried on for an additional 125 ns. (Right) Snapshot of the new polymorph obtained 125 ns after the e-field (in y-direction, V = 1.5 V/nm) had been turned off.
Processes 07 00268 g006
Figure 7. Snapshots of the crystal structures of α -, β -, and γ -glycine crystals before and after the e-field is applied in the y-direction with a strength of 1.5 V/nm. The snapshots are taken after the 125 ns long stability simulations started after the e-field is turned off.
Processes 07 00268 g007
Figure 8. Relative orientation distributions of molecules in the new polymorphs obtained from initially α -, β -, and γ -glycine crystals when the e-field is applied in (a) x-dir and (b) y-dir. (V = 1.50 V/nm for all cases presented in this plot, except for the additional β -y2.0 distribution, in which case the strength of the applied e-field was 2.0 V/nm.)
Processes 07 00268 g008
Figure 9. Time-averaged c o s ( θ ) values for the cases where an e-field was applied on (a) initially α -glycine, (b) initially β -glycine, (c) initially γ -glycine crystals. Lines are there to guide the eye. c o s ( θ ) were averaged over the final 1 ns of the 5 ns simulations in the presence of the e-field.
Processes 07 00268 g009
Table 1. Summary of the parameters that were tested in the simulations. The values in parentheses correspond to the number of molecules in the crystals used in the simulations.
ParameterValue
Initial Structure α -(2000), β -(1980) and γ -(1920)
Direction of the electric fieldx, y, z
Strength of the electric field (V/nm)0.25, 0.50, 0.75, 1.00, 1.25, 1.50
Table 2. Properties of known and new polymorphs of glycine at 1 bar and 298 K, obtained by subjecting the known polymorphs to an e-field in the y-direction with V = 1.5 V/nm. Properties of β -y2.0 are also included. Values in parentheses are root mean square deviations.
ParameterPotential Energy (kJ/mol)Enthalpy (kJ/mol)Cp (J/mol)Density (kg/m3)Specific Volume ( × 10 5 ) (m3/mol)
α -gly 323.1 ( ± 0.19 ) 297.1 ( ± 0.26 ) 186.3 1607.6 ( ± 1.84 ) 4.67
β -gly 320.2 ( ± 0.20 ) 294.2 ( ± 0.26 ) 194.7 1604.8 ( ± 2.15 ) 4.68
γ -gly 322.1 ( ± 0.20 ) 296.0 ( ± 0.27 ) 191.5 1605.4 ( ± 2.09 ) 4.68
α -y1.5 322.8 ( ± 0.19 ) 296.8 ( ± 0.26 ) 188.8 1627.0 ( ± 2.24 ) 4.61
β -y1.5 317.7 ( ± 0.20 ) 291.6 ( ± 0.27 ) 188.3 1525.1 ( ± 2.33 ) 4.92
β -y2.0 322.9 ( ± 0.19 ) 297.0 ( ± 0.25 ) 188.8 1620.1 ( ± 2.33 ) 4.63
γ -y1.5 323.5 ( ± 0.20 ) 297.5 ( ± 0.28 ) 189.7 1625.7 ( ± 2.41 ) 4.62

