Article

Air-Core–Liquid-Ring (ACLR) Atomization Part II: Influence of Process Parameters on the Stability of Internal Liquid Film Thickness and Resulting Spray Droplet Sizes

by
Marc O. Wittner
1,*,
Miguel A. Ballesteros
2,
Frederik J. Link
3,
Heike P. Karbstein
1 and
Volker Gaukel
1,*
1
Institute of Process Engineering in Life Sciences: Food Process Engineering, Karlsruhe Institute of Technology, 76131 Karlsruhe, Germany
2
Department of Chemical Engineering, Universidad de Los Andes, Bogota 111711, Colombia
3
Department of Chemical Engineering, Imperial College London, London SW7 2AZ, UK
*
Authors to whom correspondence should be addressed.
Processes 2019, 7(9), 616; https://doi.org/10.3390/pr7090616
Submission received: 8 July 2019 / Revised: 5 September 2019 / Accepted: 6 September 2019 / Published: 10 September 2019

Abstract

:
Air-core–liquid-ring (ACLR) atomization presents a specific type of internal mixing pneumatic atomization. It can be used for disintegration of high viscous feed liquids into small droplets at relatively low gas consumptions. However, the specific principle of ACLR atomization is still under research and no guidelines for process and atomizer design are available. Regarding literature on pre-filming atomizers, it can be hypothesized for ACLR atomization that the liquid film thickness inside the exit orifice of the atomizer, as well as the resulting spray droplet sizes decrease with increasing air-to-liquid ratio (ALR) and decreasing feed viscosity. In this study, the time dependent liquid film thickness inside the exit orifice of the atomizer was predicted by means of computational fluid dynamics (CFD) analysis. Results were compared to high speed video images and correlated to measured spray droplet sizes. In conclusion, the hypothesis could be validated by simulation and experimental data, however, at high viscosity and low ALR, periodic gas core breakups were detected in optical measurements. These breakups could not be predicted in CFD simulations, as the simplification of an incompressible gas phase was applied in order to reduce computational costs and time. Nevertheless, the presented methods show good potential for improvement of atomizer geometry and process design as well as for further investigation of the ACLR atomization principle.

Graphical Abstract

1. Introduction

Disintegration of liquids into small and uniform droplets is an important task in many industrial processes, such as combustion, coating or spray drying [1,2]. For this purpose, different atomization principles can be applied. In pneumatic atomization, the kinetic energy of a compressed gas stream is used as source of atomization energy [3,4]. Generally, it can be distinguished between internal and external mixing pneumatic atomizers. In external mixing pneumatic (ExMP) atomizers, atomization gas and liquid are mixed under atmospheric conditions, outside the atomizer. ExMP atomizers are known for the ability to atomize highly viscous liquids into very small droplets [2,5]. However, specific gas consumption is considerably high. For characterization of processing conditions, typically the air-to-liquid ratio by mass (ALR) is used (Equation (1)).
ALR = M gas M L
where, Mgas and ML are the mass flow rates of gas and liquid, respectively. ExMP atomizers are typically operated at ALRs between one and ten [1]. It is further reported that an increase of ALR beyond a value of three does not lead to a further reduction of the Sauter mean diameter of the produced droplet size distribution. However, the width of the distribution can be decreased by further increasing the ALR. While wider distributions are requested in some applications, e.g., gas turbine combustion, other applications require narrow distributions for stable operation, e.g., spray drying or coating [2].
Internal mixing pneumatic (IMP) atomizers are reported to consume less air in atomization of highly viscous liquids [6,7,8]. In IMP atomizers, gas and liquid are brought into contact in a mixing zone inside the atomizer and leave it through an exit orifice in a two-phase flow. Hence, gas and liquid stream have to share the cross-sectional area of the exit orifice. In most cases, no targeted mixing of gas and liquid is performed [9]. However, for targeted mixing, like in an effervescent atomizer, different authors consider an annular flow pattern inside the exit orifice as beneficial for stable droplet size generation [10,11]. In this kind of flow pattern, the liquid passes the exit orifice in form of an annular film, located between the nozzle wall and a continuous gas core. In this case the exit orifice might serve as a pre-filming area. Generally, in pre-filming pneumatic atomizers the liquid is spread over a dedicated surface by transmission of energy from the fast-moving atomization gas in a shearing action, prior to the actual disintegration into droplets. The shearing intensity increases with increasing relative velocity between gas and liquid phase as well as with decreasing liquid viscosity and surface tension. In turn, increasing shear intensities result in the reduction of the mean liquid film thickness [12,13] and resulting droplet sizes [2]. However, time dependent fluctuations of the liquid film thickness at the tip of the pre-filming area can occur as a result of the processing conditions applied [14,15,16,17].
The air-core–liquid-ring (ACLR) atomizer is an IMP atomizer, which is specifically designed to induce an annular flow pattern inside the exit orifice [18]. Therefore, a gas capillary is used for direct injection of a continuous gas core, shortly before the exit orifice. As with all pneumatic atomizers, time averaged droplet sizes decrease in a non-linear way with increasing ALR and increase with increasing viscosity at constant ALR [18,19,20,21,22]. Additionally, it was shown that time dependent fluctuations of resulting droplet sizes increase with viscosity and decrease with gas pressures [23]. Most likely, these fluctuations in resulting droplet sizes are correlated with fluctuation of the liquid film thickness, mentioned above. These fluctuations, as well as time averaged values of liquid film thickness and resulting droplet sizes might be reduced by an increase of the shearing intensity applied by the atomization gas, and therefore by an increase in ALR.
When an ACLR atomizer is used, the ALR can be increased in two different ways. The first way is to decrease the liquid flow rate at constant gas pressure [18]. In practical use, the mass flow rate of gas increases under these conditions, which is most likely caused by a decrease in pressure loss over the length of the exit orifice. Therefore, it can be assumed that the cross-sectional area of the gas core inside the atomizer increases. Hence, the liquid film thickness has to decrease with decreasing liquid flow rate at constant gas pressure. The second way to increase the ALR is to increase the gas pressure at constant liquid flow rate [22]. An increase in gas pressure leads to an increase of gas density. As a consequence, the mass flow rate of gas increases leading to an increase in ALR. However, in one of our previous studies on ACLR atomization we found no significant influence of different gas pressure levels at constant ALR on resulting spray droplet sizes [24]. Hence, it can be assumed that the compressed gas core expands completely over the length of the exit orifice to atmospheric conditions at the tip of the nozzle, leading to an increase in gas velocity and therefore in kinetic energy. Following this assumption, compressibility of the gas phase can be disregarded at the tip of the nozzle, when a continuous gas core is ensured.
With regards to the previously reviewed mechanism of pre-filming atomization, we hypothesize that higher input gas pressures and therefore higher ALRs are transformed to higher values of kinetic energy, resulting in thinner liquid films at the exit of the ACLR atomizer. Regarding aforementioned literature [22], we further hypothesize that higher gas pressures or lower viscosities result in reduced time dependent fluctuations of the internal liquid film thickness and therefore of resulting spray droplet sizes.
In this study, different analytical methods were applied, in order to investigate the correlations between process conditions, internal liquid film thickness, and resulting spray droplet sizes in ACLR atomization at different viscosities. In the first step, time dependent spray droplet sizes were measured by means of high frequency laser diffraction spectroscopy. Furthermore, liquid film thicknesses inside the exit orifice of the ACLR atomizer were determined by an optical method, based on high speed video capturing. Results of both measurement techniques were compared, in order to evaluate the made hypotheses. Although experimental investigations are very complex, important parameters like internal velocity and pressure fields cannot be measured. Therefore, computational fluid dynamics (CFD) simulation of atomizer internal two phase flows were preformed. These simulations were performed in order to gain deeper insight into to nozzle internal flow conditions and to evaluate the possibility of process optimization without performing experimental investigations in future studies. If process simulations represent internal flow conditions to sufficient extent, this procedure is of high importance for practical application, as process development could be accelerated at relatively low costs. Although relatively high input gas pressures of up to 0.8 MPa were applied, simulations were performed under the assumption of an incompressible gas phase. This simplification was used as complete expansion of the gas phase to atmospheric conditions can be assumed over the length of the atomizer’s exit orifice [24]. The potential decrease in accuracy was accepted with regards to significant reduction of computational time and costs in this first study. For validation of simulations, measured and simulated values of the liquid film thickness were compared. Besides the effect of increasing gas pressure, the influence of decreasing viscosity on liquid film thickness was investigated in simulations as well as in measurements. In simulations, also velocity and pressure loss, as well as the occurring wall shear stress were analysed. Detailed investigation of the liquid sheet disintegration into spray droplets was not in the scope of this study, however the underlying mechanisms will be investigated in further studies.

2. Materials and Methods

2.1. Model Solution

Aqueous solutions of maltodextrin (C*Dry MD01958, Overlack GmbH, Mönchengladbach, Germany) with dry matter contents of 40% and 47% were used in the experiments performed. The moisture content of maltodextrin powder (X = 4.5%, dry basis) was considered in the calculation of the water content. The model solutions were characterized by viscosity (µ), surface tension (σ), density (ρ) and refractive index (RI). All measurements were executed in triplicate at a temperature of 25 °C. Mean values and relative uncertainty values ur(γ) of these parameters are summarized in Table 1. Viscosity measurements were performed using a rotary rheometer (MCR 101/301, Anton Paar GmbH, Graz, Austria) with coaxial cylinder geometry (CC27). Within the measurement range of shear-rates between 1 and 1000 s−1 the solutions showed Newtonian behaviour. Surface tension was measured with a Wilhelmy plate system (DCAT 21, DataPhysics Instruments GmbH, Filderstadt, Germany). For measurement of refractive index (RI) a refractometer (Carl-Zeiss, Oberkochen, Germany) was used. Density was measured by use of a pycnometer.

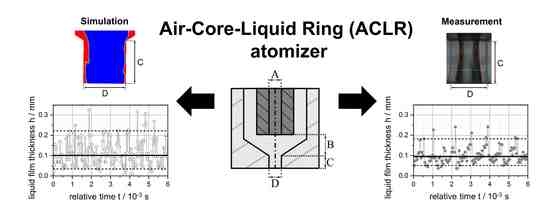
2.2. Air-Core–Liquid-Ring Atomizer

In an ACLR atomizer, an annular flow pattern is generated in the exit orifice by injection of a compressed gas core in the middle of the liquid stream. The inner geometry of the used atomizer corresponded to the one used in several former studies [18,19,20,21,22,23,25,26]. However, the body part of the atomizer was made of acrylic glass for optical accessibility of the exit orifice. All parts of the inner geometry were rotationally symmetric. A scheme of the used ACLR atomizer is shown in Figure 1. The gas capillary was made of stainless steel. The inner diameter of the gas capillary (A) as well as diameter (D) and length (C) of the exit orifice were 1.5 mm each. The length of the mixing zone (B) was 2.4 mm.

2.3. Spray Test Rig

Like in former studies, a modular test rig was used for spray experiments [22,23,24]. Liquid flow rates of 30 and 40 L·h−1 were supplied by an eccentric screw pump (NM011BY, Erich Netzsch GmbH and Co. Holding KG, Waldkraiburg, Germany) and measured by a flow meter (VSI 044/16, VSE GmbH, Neuenrade, Germany). Compressed air was used as atomization gas. The air was supplied by a compressor (Renner RSF-Top 7.5, Renner GmbH, Güglingen, Germany) with a pressure vessel volume of 90 L. Relative pressures between 0.4 and 0.8 MPa were adjusted by using a pressure regulator. Corresponding gas volume flows were measured by a gas flow meter (ifm SD6000, ifm electronic, Essen, Germany). The liquid pressure was not monitored in the performed investigations. All trials were performed at room temperature. For calculations, a mean temperature of 25 °C was assumed. In atomization trials, either flow conditions inside the atomizer (see Section 2.5), or spray droplet size measurements (see Section 2.4) were investigated. In the test rig the spray was collected in a vessel below the measurement zone. The vessel was equipped with a filter and connected to an exhaust fan to prevent recycling of small droplets into the measurement zone.

2.4. Droplet Size Measurement

For characterization of the atomization process, droplet size measurements were performed by using a laser diffraction spectroscope (Spraytec, Malvern Instruments, Malvern, UK). It was equipped with a 750 mm focal lens, offering a droplet size measuring range of 2–2000 µm. The spectrometer was placed 250 mm underneath the exit orifice of the atomizer. The laser beam crossed the full cone spray angle at the nozzle axis centreline. Measurements were conducted at the maximum available measurement frequency of 10 kHz over a time of 1 s, leading to the recording of 10,000 droplet size distributions per measurement. In order to evaluate the stability of generated droplet sizes, a method described by Kleinhans et al. was adapted [20]. The original method is based on the evaluation of the number sum distribution of Sauter mean diameters QSMD. Thereof, the characteristic values 5th percentile (x5,0), 50th percentile (x50,0, i.e., median) and 95th percentile (x95,0) are derived. Relative positions of these characteristic values allow the assessment of the atomization steadiness. In the here presented study, instead of Sauter mean diameter (SMD) the 50th percentile of the volumetric sum distribution (x50,3) was used as parameter for characterization of the atomization process. This parameter represented the median droplets of a distribution. However, in laser diffraction measurements of sprays from pneumatic atomizers the beam steering effect has to be taken into account. This systematic error leads to the detection of apparent large spray droplets, caused by fluctuation of the refractive index in fast flowing gas phase. Consequently, large droplets are strongly influenced by the beam steering effect in uncorrected distributions. This error can be corrected by a specific method, which is based on the application of a multi-modal log-normal fit to the measured droplet size distribution [23]. From this multi-modal distribution the modality of apparent droplets, caused by beam steering, is excluded. In the here presented study, this correction was applied to each of the 10,000 droplet size distribution of the measurement by automatic fitting of individual tetramodal log-normal distributions and subsequent exclusion of apparent droplet sizes. For this purpose, a specific routine in Matlab software (The MathWorks Inc., Natick, MA, USA) was used.

2.5. Visualisation of Internal Liquid Film Thickness

Flow conditions inside the exit orifice of the atomizer were optically analysed. Therefore, a high-speed video camera (OS3-V3-S3, Integrated Design Tools Inc., Tallahassee, FL, USA) was used. It was equipped with a 150 mm macro lens (150 mm F2.8 EX DG OS HSM, Sigma, Kawasaki, Japan) with polarizing filter. The exit orifice of the atomizer was illuminated from the opposite side of the camera with diffused light of a high performance light-emitting diode (constellation 120 E, Imaging Solution GmbH, Eningen unter Achalm, Germany). The camera was focused to the middle of the exit orifice. Within one measurement 200 images were taken at a frame rate of 20 kHz, leading to a measurement time of 0.01 s. The exposure time of image capturing was 18 µs. As the two-phase flow was not rotationally symmetrical, left and right film thicknesses were analysed separately in each image. For determination of liquid film thicknesses, an automated routine in Matlab software (The MathWorks Inc., Natick, MA, USA) was used. In Figure 2 the performed steps of image processing are illustrated by means of a sample image, taken at the following processing conditions: viscosity µ = 0.39 Pa·s, liquid volume flow QL = 40 L·h−1, gas pressure pgas = 0.4 MPa and air-to-liquid ratio ALR = 0.05.
Firstly, images were converted from 16-bit RGB to 8-bit grey scale (Figure 2A). Thereafter, phase boundaries were identified by detection of grey scale gradients in each line of pixels. For this purpose the Prewitt operator was used [27]. The phase boundaries between the acrylic glass and the liquid were marked in blue, while boundaries between liquid and gas core were marked in red (Figure 2B). For determination of time dependent liquid film thicknesses, a line probe was used (Figure 2C: green line). Along the line probe, two film thicknesses were defined as distances between exit orifice walls (blue) and fluid phase boundaries (red). For presentation of time dependent liquid film thickness, both values of one image were averaged. For calculation of distances, distortion effects caused by the round surface of the exit orifice, were neglected in this first study. Hence, a linear scaling factor along the radius of the exit orifice was assumed. This factor was defined as exit orifice diameter (1.5 mm) divided by the amount of pixels between exit orifice boundaries (blue lines). Resolution was around 20 µm/pixel. It has to be mentioned that under the made assumption, optical distortions lead to an increasing underestimation of measurement results with increasing distance to the centre of the nozzle. Therefore the deviation between measured and real film thickness increases with decreasing liquid film thickness. Maximum film thickness was defined as half exit orifice diameter (750 µm). This value equals a complete interruption of the gas core. This would mean that no annular flow pattern was present under the corresponding processing conditions. In order to assess the specific fluctuation frequency of film thicknesses, fast Fourier transformation (FFT) was applied in OriginPro software (OriginLab Corporation, Northampton, UK).

2.6. Simulation of Internal Flow Conditions

Three-dimensional (3D) simulation of internal flow conditions was performed by computational fluid dynamics (CFD) analysis in STAR-CCM+ software (Siemens PLM Software Inc., Plano, TX, USA). The geometry of the atomizer was discretized with a polyhedral mesh, which divides the space into small and relatively uniform multi-faceted cells. Smaller cells of the mesh were located near the walls for improved modelling of the boundary layers. Moreover, the mesh was refined progressively in flow direction to diameters of 1.8 µm in the outlet region. In order to ensure developed flow conditions of gas and liquid, the atomizer geometry upstream the mixing area was included in the calculations (total length: 60 mm). In Figure 3A the 2D section of the polyhedral mesh is shown, corresponding to atomizer geometry in Figure 1.
The two-phase flow was modelled as an isothermal and immiscible composition of two incompressible fluids by use of the volume of fluid (VOF) method in time steps of around 3.5 µs. Gas compressibility was disregarded in this study, in order to reduce computational costs and time of the simulations performed. This simplification was applied, based on the assumption that the gas core was already fully expanded to atmospheric conditions at the tip of the nozzle [24]. Resulting potential reductions in accuracy were estimated by comparison with optical measurements of the liquid film thickness (see Section 2.5). The VOF method captures the interface between liquid and gas phase by calculating the volume fraction of liquid in each cell of the mesh [28]. When the liquid volume fraction of a cell is equal to one or zero, the cell is completely occupied by either liquid or gas, respectively. Surface tension force was modelled by the continuum surface force (CSF) model [29]. The model was complemented with the interface momentum dissipation (IMD) model that helps to reduce the so-called parasitic currents. These artificial fluid motions may arise in calculations, due to discretization errors at the interface between gas and liquid. Again, discretization errors are caused by discontinuities in the solution field for example, when high gradients in velocity or viscosity are present. As for the turbulence model, the SST k-ω model was applied. This model is a variation of the original two-equations k–ω model [30], solved for kinetic energy k and the specific dissipation rate ω. The shear–stress–transport (SST) extension is used to reduce the sensitivity of the k–ω model to inlet conditions in boundary layer computation [31]. Additionally, the γ-transition model was applied to improve the modelling of laminar to turbulence transition [32]. This model solves for an additional transport equation to the two-equation SST k–ω model, in order to predict the onset of transition in a turbulent boundary layer.
As the liquid flow inlet condition, a mass flow inlet boundary was used, while for gas flow calculations, a stagnation inlet boundary was applied. In a stagnation inlet boundary, an imaginary plenum, far upstream the region of interest is assumed, in which the flow is completely at rest. In incompressible flow calculation, Bernoulli’s equation is used to relate total pressure, static pressure and velocity. In this case the set gas pressure before the atomizer is used as inlet parameter. Outlet conditions of gas and liquid flow were set as pressure outlet boundaries. As stated above, it was assumed that atmospheric conditions were present at the atomizer exit.
To calculate the time dependent liquid film thickness at the nozzle tip, a set of two perpendicular horizontal line probes was created. Along each line probe, two film thicknesses were defined as distances between exit orifice walls and fluid phase boundaries. In total, four time dependent values of the liquid thickness were calculated per time step, from which an average time dependent liquid film thickness was calculated. To compare simulated and measured (see Section 2.5) fluctuation frequencies of film thicknesses, fast Fourier transformation (FFT) was also applied to simulation results in OriginPro software (OriginLab Corporation, Northampton, UK).

3. Results

3.1. Time Dependent Variation of x50,3

In order to assess median value and temporal stability of resulting droplet sizes in dependency of the applied process conditions, time dependent values of x0,3, are shown in Figure 4 for measurements at µ = 0.39 Pa·s and QL = 40 L·h−1. Results at pgas = 0.4 MPa are shown on the left, results at pgas = 0.8 MPa are shown on the right. As described in Section 2.4, the median value is represented by the solid black line (x50,0). Accordingly, the distribution width is represented by the two dashed black lines. The lower dashed line represents x5,0 and the upper dashed line represents x95,0.
At low pgas of 0.4 MPa and low corresponding ALR of 0.05 a wide distribution of x50,3 was found. In this case, x5,0 was 115 µm and x95,0 was 351 µm. The distribution was not symmetrical, as the median value x50,0 was shifted from the centre in direction of lower values (x50,0 = 169 µm). An increase of pgas to 0.8 MPa and a corresponding increase of ALR to 0.13 led to a decrease of all three named characteristic values of x50,3 (x5,0 = 84 µm; x50,0 = 107 µm; x95,0 = 160 µm). The decrease of x95,0 was more pronounced than the decrease of x5,0 and the distribution width decreased strongly. However, also at pgas = 0.8 MPa scattered large values of x50,3 were found. Measurements were performed in triplicate, showing uncertainty values of x5,0 < 7.6%, x50,0 < 7.0% and x95,0 < 6.8%. Similar behaviour was already reported for the Sauter mean diameter [22].
In conclusion, time dependent x50,3 followed the general correlation of decreasing droplet sizes with increasing ALR under the investigated conditions. Moreover, temporal stability of the x50,3 increased with increasing ALR, as the difference between large (x95,0) and small (x5,0) time dependent values of x50,3 decreased. This result was of high importance for processes with the need of stable droplet size distributions, such as spray drying or coating.

3.2. Optical Analysis of the Time Dependent Internal Liquid Film Thickness

In the following section, results of the time dependent liquid film thickness inside the exit orifice of the used ACLR atomizer are shown. In order to investigate the hypothesis of decreasing droplet sizes with decreasing liquid film thickness, these results were compared to the values of time dependent droplet sizes presented before.
In Figure 5, time dependent values of the liquid film thickness inside the exit orifice of the ACLR atomizer are shown for identical processing conditions as in Section 3.1. Measurement points are connected with straight lines for improved visibility. For characterization of the distribution, the percentiles x5,0 (lower dashed line), x50,0 (solid line) and x95,0 (upper dashed line) were used.
At pgas = 0.4 MPa (ALR = 0.05), a relatively wide distribution with x5,0 of 96 µm and x95,0 of 409 µm was found. The calculated frequency of the time dependent fluctuation of the liquid film thickness of was 1.4 kHz. The distribution was not symmetrical and x50,0 (184 µm) was shifted to smaller film thicknesses. This was based on the fact, that in intervals of around 4 ms the maximum film thickness value of 75 µm was measured, which corresponded to the complete interruption of the gas core (see Section 2.5). For illustration, a sequence of three images showing the breakup of the gas core at t = 6.45 ms is given in Figure 6. Consequently, no stable annular flow pattern was present under the named processing conditions, although interruptions only last for a short time <1 × 10⁻⁴ s.
Increasing pgas from 0.4 to 0.8 MPa (ALR = 0.13), the median value decreased to x50,0 = 112 µm. Furthermore, distribution width decreases, as characteristic values x05,0 and x95,0 decrease to 59 µm and 215 µm, respectively. Moreover, no interruptions of the gas core were detected, while the calculated frequency of fluctuation increased to 2 kHz.
Comparing the presented findings, the presented optical method could be used for correlation of process dependent liquid film thicknesses and resulting droplet sizes. An increase in pgas from 0.4 to 0.8 MPa, and therefore an increase in ALR from 0.05 to 0.13, led to a decrease in median value and distribution width of time dependent liquid film thickness and spray droplet sizes. Consequently, the hypothesis of decreasing spray droplet sizes with decreasing liquid film thickness was verified by the presented results. Moreover, the accuracy of the measurement method could be improved, when potential distortion effects are considered by the measurement routine in future studies. Nevertheless, the prediction of process dependent liquid film thicknesses seems to be very promising for process design.
In the next section, CFD simulation results of internal flow conditions are presented. Optical measurements of the liquid film thickness were used for validation of CFD simulations. In addition to the prediction of the liquid film thickness, validated CFD simulations offered the possibility to analyse process relevant parameters that could not be measured experimentally, e.g., velocity and pressure fields and wall shear stress. Therefore, CFD simulations could be used to gain a deeper understanding of internal flow conditions of ACLR atomizers, which again could be used for efficient geometry and process design.

3.3. Simulation of the Time Dependent Internal Liquid Film Thickness

As an example of internal flow conditions, the simulated volume fraction of liquid is shown in a 2D section of the atomizer geometry in Figure 7. The line probe, used for assessment of simulated liquid film thicknesses is indicated by a white dashed line. In the real flow, each volume fraction could either be filled by liquid (volume fraction of liquid = 1) or by gas (volume fraction of liquid = 0, see Section 2.6). In the used VOF method, values between 0 and 1 may be present at the surface between the two phases, representing an artificial surface film. The sharpness of the modelled surface between liquid and gas flow increased with decreasing thickness of the artificial surface film.
In Figure 8 simulated liquid film thicknesses in dependency of processing time are depicted for identical processing conditions as in Section 3.1 and Section 3.2. Like in Figure 4 and Figure 5, results at pgas = 0.4 MPa are shown left and results at pgas = 0.8 MPa are shown right. Measurement points are connected by straight lines for improved visibility. For characterization of the distribution, the percentiles x5,0 (lower dashed line), x50,0 (solid line) and x95,0 (upper dashed line) were used.
At pgas = 4 MPa and an ALR of 0.05, a periodic variation in liquid film thickness with a relatively wide distribution (x5,0 = 118 µm; x95,0 = 524 µm) was predicted and x50,0 (186 µm) was shifted to smaller film thicknesses. The fluctuation of the liquid film thickness was predicted as 1.67 kHz. Although the comparison between characteristic values of simulation and measurement show relatively good accordance (x5,0: −19%; x50,0: −1%; x95,0: −23%), the time dependent progression of the liquid film thickness appear very periodical, compared to the results of the optical measurements. This was based on the fact that occurring interruptions of the gas core (Section 3.2) could not be reflected in the simulations performed, as the compressibility of the gas phase was disregarded. Hence, internal flow conditions cannot be predicted precisely by CFD simulations at the low ALR of 0.05. However, general tendencies of process dependent changes in thickness and stability of the liquid film were reflected by simulation and experimental measurements. In future studies, the influence of gas compressibility on the atomizer internal liquid flow conditions will be investigated.
An increase of pgas to 0.8 MPa and therefore of ALR to 0.13 led to a less uniform variation of the predicted film thickness over time. This behaviour was mirrored by the correlated frequency spectrum, where two overlaying main frequencies of 1.16 and 2.5 kHz were present. Like in the performed optical measurements, derived median value and distribution width decrease with increasing pgas (x5,0 = 78 µm; x50,0 = 149 µm; x95,0 = 342 µm). In comparison, all characteristic values of the time dependent liquid film thickness were lower in the experimental results, than in simulation (x5,0: −24%; x50,0: −25%; x95,0: −37%), which was in accordance to the results at lower pgas.
The most important advantage of CFD simulations is the possibility to visualize flow variables that cannot be measured experimentally, like velocity and pressure profiles or the shear stresses on the nozzle walls. These variables are important for both, the understanding of flow conditions and process design. Since the compressibility of the gas was disregarded, the actual values may have differed from the simulation profiles presented, but the trends and patterns were expected to behave similarly, just as it was observed with the liquid film thickness. It should be noticed, nonetheless, that the system varied significantly with time and the profiles shown were at specific simulation times. Therefore, the flow variables were compared in terms of range of values, averages and general behaviour rather than on the exact values of the flow variables at the respective simulation time.
In Figure 9, volume fraction of liquid, as well as velocity and pressure profiles are shown at simulation time steps with the largest film thickness (see Figure 8) for pgas of 0.4 MPa and 0.8 MPa. As already shown before, the maximum film thickness decreased with increasing gas pressure and therefore with increasing ALR. As expected, a higher ALR caused a higher gas velocity in the nozzle, since the mass flow of the gas was increased. In the experimental setup, a higher gas flow was also related to a higher gas pressure, because of the way the gas compression system was set. In most annular flow correlations, such as the model proposed by Hewitt [33], or the separated flow model (SFM) [34], increasing the gas velocity or the gas pressure leads to a higher interfacial shear stress. The interfacial shear stress is one of the two forces that increases the liquid velocity, along with the gravitational force that depends on the liquid density. Since the liquid flow was fixed, a larger liquid velocity meant the liquid required less cross-sectional area to flow, leading to a decrease in liquid film thickness. This decrease in the film thickness with higher ALRs was exactly what was observed in the experimental and simulations results. The low velocities observed for the 0.05 ALR could help explain the large film thickness variation that was seen in the liquid phase profile. Such low phase velocities may not be enough to form a stable annular flow, so the liquid film periodically collapses, forming bridges of liquid that break up the gas core, leading to a slug flow pattern. Hence, the small differences between gas and liquid velocity are an important hint on instable flow conditions, although a complete gas phase breakup may not be observed in the simulation because of the incompressibility assumption for the gas.
Besides the liquid film thickness, also the pressure loss in the atomizer and the shear stress on the nozzle wall were analysed in dependency of the ALR. The atomizer internal pressure loss profile was calculated with respect to the entry pressure of the gas to the atomizer, as seen in Figure 9. The average pressure loss in the nozzle was defined as the difference in pressure over the whole length of the exit orifice C (see Figure 1, Figure 3 and Figure 7). These values are shown in Table 2, together with the related values of wall shear stress. The low level of the pressure profile along the atomizer at ALR 0.05 was most likely due to the small phase velocities discussed before. However, while the general pressure loss values were lower, the average pressure loss along the atomizer nozzle was actually larger for the 0.05 ALR than for ALR 0.13. This indicated that the average nozzle pressure loss actually decreased with increasing ALR.
The larger average pressure loss may have been related to the fact that a lower ALR was related to a larger film thickness, which means that less cross-sectional was available for the gas to flow through in the nozzle channel. This contraction and associated pressure loss caused by the liquid film could be particularly noticed in the pressure profile depicted for ALR of 0.05, as the average pressure loss increased significantly in the middle of the nozzle channel, where the liquid film was thicker. On the other hand, the increase in wall shear stress with increasing ALR was most likely caused by the higher liquid velocity, which in turn was generated by the higher gas shear stress on the interface. This makes sense with the correlational models for multiphase annular flow [33].
In conclusion, it can be stated that an increase in ALR was related to a significant increase in gas velocity and therefore in the velocity difference between gas and liquid film. This leads to an increase in the total pressure level inside the exit orifice of the atomizer, however average pressure loss over the channel length decreased. Therefore, a certain gas velocity seems to be essential to set up stable annular flow conditions inside the exit orifice of ACLR atomizers. This is an important information for the design of future atomization processes, which can only be derived from CFD simulations. Performed simulations had no issue with convergences, ran relatively quickly and could be run in parallel for different operation conditions. Therefore, it seems like the used simplification with incompressible gas phase can be used for relative comparison of different processing conditions, when it is aimed to produce an as thin and stable as possible liquid film. It has to be kept in mind that the absolute values of the predicted liquid film thickness might differ from real values. Further CFD simulations with consideration of the gas compressibility will be performed, in order to better quantify the errors caused by the assumptions made.

3.4. Influence of Viscosity on Measured and Simulated Liquid Film Thickness

In order to evaluate the influence of viscosity on time dependent liquid film thickness, the results of measurement (left) and simulation (right) at µ = 0.12 Pa·s and ALR = 0.15 (QL = 30 L·h−1; pgas = 0.6 MPa) are presented in Figure 10. The volume fraction of liquid, as well as the velocity and pressure profile at the simulation time step with the largest film thickness are depicted in Figure 11. In this study, processing conditions were chosen, which resulted in a similar ALR as the process at µ = 0.39 Pa·s, with QL = 40 L·h−1 and pgas = 0.8 MPa (ALR = 0.13). In the measurement results of the internal liquid film thickness (left), only the first 6 ms of the measurement are plotted to give a better comparability with the simulation, which was run for only 6 ms. However, characteristic values of Q0 (x5,0; x50,0; x95,0) were calculated from all gained values of the measurement over a time of 10 ms. In correlated droplet size measurements all characteristic values of the x50,3 distribution decreased to values of x5,0 = 83 µm, x50,0 = 100 µm and x95,0 = 128 µm. This is in good accordance with the known effect of decreasing droplet sizes with decreasing viscosity at constant ALR [18,19,22].
In the measurement of the internal liquid film thickness, a median liquid film thickness of x50,0 = 95 µm was found. Values of x5,0 and x95,0 were 51 µm and 182 µm, respectively. Fluctuation frequency was 1.21 kHz. In the simulation, predicted median film thickness was only by 13% higher (x50,0 = 108 µm), however, variation of the film thickness was larger than in experimental results. The value of x5,0 was 35 µm and 31% lower, while the value of x95,0 was 222 µm and 22% higher than in the measurement. Two main fluctuation frequencies of 1.51 and 2.02 kHz were present. In comparison to the results at 0.39 Pa·s and ALR = 0.13, median value and distribution width decreased in measurement and in simulation.
As comparable ALR could be reached at lower pgas of 0.6 MPa at the lower viscosity, the general pressure loss inside the exit orifice decreased (see Figure 11), with respect to the gas pressure at the inlet. Although, higher gas velocities were present in the centre of the nozzle, the larger available cross-sectional area for the gas to flow resulted in smaller pressure loss along the exit orifice of the atomizer C (0.231 MPa). Additionally, the resistance of the liquid against acceleration by the gas decreased with decreasing viscosity and wall shear stress (0.0293 MPa) were lower at a viscosity of 0.12 Pa·s, compared to the viscosity of 0.39 Pa·s. Since the wall shear forces acted as an opposing force to the flow of the liquid, lower wall shear stress increased the liquid velocity, which means the liquid needed less cross-sectional area to maintain the same volume flow. Thus, just as it was seen in the experimental and simulation results, a lower viscosity was related to a thinner liquid film thickness. On the other hand, this lower resistance of the liquid against the shearing action of the gas led to a relatively wavy character of the liquid surface.
In conclusion, the general hypothesis of decreasing internal liquid film thickness with decreasing viscosity was validated in measurement and simulation. CFD simulations showed that the lower resistance of the liquid against acceleration by the gas core and resulting smaller liquid film thickness that allowed more cross-sectional area for the gas to flow, led to a lower average pressure loss over the exit orifice of the atomizer. This allows the application of similar ALRs at lower gas pressure levels, compared to higher liquid viscosities. Quantitative deviations in liquid film thicknesses estimations by measurement and simulation can be caused by various factors. From the measurement side, possible factors were manufacturing tolerances in the atomizer geometry, optical distortions, or variations in flow conditions, caused by slightly different processing temperatures. From the simulation side, deviation could have been caused by disregarding of gas compressibility and the assumption of pressure equilibrium, directly at the atomizer exit. Although the presented methods have to be improved in the named points for future studies, they are very promising tools for further development of ACLR atomizers and processes and to gain deeper understanding of occurring flow conditions.

4. Discussion

In Section 3, methods for determination of the time dependent fluctuation of the characteristic droplet size x50,3 after ACLR atomization (Section 3.1), as well as of the liquid film thickness inside the exit orifice were introduced and applied to selected examples. The main results of the analyses of liquid film thicknesses performed are summarized in Table 3. After validation of CFD simulations, also velocity and pressure fields, as well as occurring wall shear stresses inside the exit orifice of the atomizer were analysed.
For the liquid film thickness, results of the simulation and of the optical measurement showed the same tendencies that have been hypothesized based on literature on pre-filming ExMP atomizers in Section 1: all characteristic values of the time dependent distribution decreased with increasing ALR (0.05 to 0.13) at constant viscosity of 0.39 Pa·s, as well as with increasing viscosity (0.12 Pa·s to 0.39 Pa·s) at similar ALR (0.13 and 0.15).
These dependencies were supported by the analysis of related velocity and pressure profiles. It could be shown, that an increase in ALR leads to an increase in gas velocity. This in turn increased the shear forces acting on the liquid phase. The correlated acceleration of the liquid film, in combination with the fixed liquid flow led to thinner liquid films with increasing ALR. A decrease in viscosity on the other hand was connected to the lower resistance of the liquid film against the acting shear forces. Therefore, thinner liquid films were formed at lower viscosities. However, the surface of the liquid film got more unstable and wavy, due to lower damping capacity.
Considering liquid film thickness, absolute values between simulation and optical measurement showed deviations between 1% and 39% (see Section 3.2, Section 3.3 and Section 3.4). These deviations had to be evaluated according to the aimed area of implementation and were most likely based on uncorrected distortion effects in the optical measurement, due to the round shape of the exit orifice and on the assumption of an incompressible gas phase in numerical simulations. Analytical methods will be improved in future studies; however, the methods can already be used for comparative analysis between different processing conditions or atomizer geometries. In optical measurements, the fluctuation frequency of the liquid film thickness ranged between 1.21 kHZ and 2.0 kHz and appeared to decrease with ALR and viscosity. Still, this trend has to be further investigated in future studies, due to the small number of experiments and the lack of supporting information from literature. In the numerical simulations two overlaying main frequencies were identified in FFT analysis at increased ALR (0.15 at a viscosity of 0.12 Pa·s and 0.13 at a viscosity of 0.32 Pa·s). Therefore, no correlation between process parameters and fluctuation frequency can be framed at this point.
Like hypothesized (see Section 1), characteristic values of the time dependent distribution of the characteristic droplet size x50,3 were in the same order of magnitude like the liquid film thickness. Therefore, liquid film thickness and resulting median droplet size (x50,3) could be correlated for the examples presented. This correlation is important for process improvement and atomizer development, as the selection of process and geometry parameters can be performed according to numerical simulations of the atomizer internal flow conditions. Moreover, CFD simulations can be used to gain deeper insight into the physical properties of present flow conditions, as process variables can be analysed that cannot be measured experimentally. Still, further investigations have to be performed in order to frame a statistically valid empirical correlation function for the dependencies between process parameters, liquid film thickness and resulting droplet sizes.

5. Conclusions

In the presented study, different methods for investigation of the effect of the liquid film thickness on resulting spray droplet sizes in ACLR atomization were used. The focus was on the relations between processing conditions, internal liquid film thickness and resulting spray droplet sizes at different viscosities. It was hypothesized that increasing ALRs or decreasing viscosities lead to decreasing liquid film thicknesses inside the exit orifice and to smaller resulting spray droplets. Furthermore, it was assumed that higher gas pressures and therefore an increase in ALR result in reduced time dependent fluctuations of the internal liquid film thickness and of resulting spray droplet sizes. CFD simulation results represent the described tendencies as median value and fluctuation of the film thickness decrease with increasing ALR and decreasing viscosity. Analysis of calculated velocity and pressure profiles can be used to explain the found tendencies. An increase in ALR was related to an increase in the velocity difference between gas and liquid film and a decrease in average pressure loss over the channel length. Decreasing viscosity resulted in smaller liquid film thicknesses due to lower resistance of the liquid against acceleration by the gas core. The resulting larger cross-sectional area for the gas allowed application of similar ALRs at lower gas pressure levels, compared to higher liquid viscosities. However, at high viscosity and low ALR, periodic gas core breakups were detected in optical measurements. These gas core breakups could not be predicted in CFD simulations, as the simplification of an incompressible gas phase was applied. Still, it can be concluded that a certain viscosity dependent gas velocity seems to be essential to set up stable annular flow conditions inside the exit orifice of ACLR atomizers. It was assumed that deviations between measurement and simulation can be decreased by further improving the used methods and by consideration of the compressibility of the gas phase. Nevertheless, the presented methods show good potential for improvement of atomizer geometry and process design as well as for further investigation of the ACLR atomization principle.

Author Contributions

Conceptualization, M.O.W. and V.G.; methodology, M.O.W., F.J.L. and M.A.B.; validation, M.O.W., M.A.B., F.J.L., H.P.K. and V.G.; investigation, M.O.W., M.A.B. and F.J.L.; writing—original draft preparation, M.O.W.; writing—review and editing, M.A.B., F.J.L., H.P.K. and V.G.; visualization, M.O.W.

Funding

This research received no external funding.

Acknowledgments

The authors express their thanks to Andrea Butterbrodt and Markus Fischer for experimental and technical support. Major parts of computational time have been kindly provided by the Steinbuch Center of Computing of the Karlsruhe Institute of Technology. Furthermore, we acknowledge support by the KIT-Publication Fund of the Karlsruhe Institute of Technology.

Conflicts of Interest

The project was partly funded by Kompetenznetz Verfahrenstechnik Pro3 e.V.

References

  1. Lefebvre, A.H. Atomization and Sprays; Hemisphere Publishing Corp: Philadelphia, PA, USA, 1989; ISBN 0-89116-603-3. [Google Scholar]
  2. Ashgriz, N. Handbook of Atomization and Sprays; Springer: Berlin, Germany, 2011; ISBN 978-1-4419-7263-7. [Google Scholar]
  3. Lefebvre, A.H. Twin-fluid atomization: Factors influencing mean drop size. At. Sprays 1992, 2, 101–119. [Google Scholar] [CrossRef]
  4. Lefebvre, A.H. Energy Considerations in Twin-Fluid Atomization. J. Eng. Gas Turbines Power 1992, 114, 89–96. [Google Scholar] [CrossRef]
  5. Masters, K. Spray Drying in Practice; SprayDryConsult International ApS: Charlottenlund, Danmark, 2002; ISBN 87-986606-08-3. [Google Scholar]
  6. Mlkvik, M.; Stähle, P.; Schuchmann, H.P.; Gaukel, V.; Jedelsky, J.; Jicha, M. Twin-fluid atomization of viscous liquids: The effect of atomizer construction on breakup process, spray stability and droplet size. Int. J. Multiph. Flow 2015, 77, 19–31. [Google Scholar] [CrossRef] [Green Version]
  7. Buckner, H.J.; Sojka, P.E. Effervescent Atomization of High-Viscosity Fluids: Part I. Newtonian Liquids. At. Sprays 1991, 1, 239–252. [Google Scholar] [CrossRef]
  8. Jedelsky, J.; Jicha, M.; Slama, J.; Otahal, J. Development of an Effervescent Atomizer for Industrial Burners. Energy Fuels 2009, 23, 6121–6130. [Google Scholar] [CrossRef]
  9. Chin, J.S. Effervescent atomization and internal mixing air assist atomization. Int. J. Turbo Jet Engines 1995, 12, 119–127. [Google Scholar] [CrossRef]
  10. Stähle, P.; Gaukel, V.; Schuchmann, H.P. Influence of feed viscosity on the two-phase flow inside the exit orifice of an effervescent atomizer and on resulting spray characteristics. Food Res. Int. 2015, 77, 55–62. [Google Scholar] [CrossRef]
  11. Shepard, T.G. Bubble Size Effect on Effervescent Atomization. Ph.D. Thesis, University of Minnesota, Minneapolis, MN, USA, 2011. [Google Scholar]
  12. Lefebvre, A.H. Airblast Atomization. Prog. Energy Combust. Sci. 1980, 6, 233–261. [Google Scholar] [CrossRef]
  13. Rizk, N.K.; Lefebvre, A.H. The Influence of Liquid-Film Thickness on Airblast Atomization. J. Eng. Power 1980, 102, 706–710. [Google Scholar] [CrossRef]
  14. Déjean, B.; Berthoumieu, P.; Gajan, P. Experimental study on the influence of liquid and air boundary conditions on a planar air-blasted liquid sheet, Part I: Liquid and air thicknesses. Int. J. Multiph. Flow 2016, 79, 202–213. [Google Scholar] [CrossRef]
  15. Déjean, B.; Berthoumieu, P.; Gajan, P. Experimental study on the influence of liquid and air boundary conditions on a planar air-blasted liquid sheet, Part II: Prefilming zone length. Int. J. Multiph. Flow 2016, 79, 214–224. [Google Scholar] [CrossRef]
  16. Sattelmayer, T.; Wittig, S. Internal Flow Effects in Prefilming Airblast Atomizers: Mechanisms of Atomization and Droplet Spectra. J. Eng. Gas Turbines Power 1986, 108, 465. [Google Scholar] [CrossRef]
  17. Volz, M.; Nittel, L.; Habisreuther, P.; Zarzalis, N. Numerical Study of Liquid Film Characteristics at Varying Operating Conditions in Prefilmer Airblast Atomizer. Chem. Ing. Tech. 2016, 88, 192–199. [Google Scholar] [CrossRef]
  18. Stähle, P.; Gaukel, V.; Schuchmann, H.P. Comparison of an Effervescent Nozzle and a Proposed Air-Core-Liquid-Ring (ACLR) Nozzle for Atomization of Viscous Food Liquids at Low Air Consumption. J. Food Process Eng. 2017, 40, 12268. [Google Scholar] [CrossRef]
  19. Stähle, P.; Schuchmann, H.P.; Gaukel, V. Performance and Efficiency of Pressure-Swirl and Twin-Fluid Nozzles Spraying Food Liquids with Varying Viscosity. J. Food Process Eng. 2017, 40, 12317. [Google Scholar] [CrossRef]
  20. Kleinhans, A.; Georgieva, K.; Wagner, M.; Gaukel, V.; Schuchmann, H.P. On the characterization of spray unsteadiness and its influence on oil drop breakup during effervescent atomization. Chem. Eng. Process. Process Intensif. 2016, 104, 212–218. [Google Scholar] [CrossRef]
  21. Kleinhans, A.; Hornfischer, B.; Gaukel, V.; Schuchmann, H.P. Influence of viscosity ratio and initial oil drop size on the oil drop breakup during effervescent atomization. Chem. Eng. Process. Process Intensif. 2016, 109, 149–157. [Google Scholar] [CrossRef]
  22. Wittner, M.O.; Karbstein, H.P.; Gaukel, V. Spray performance and steadiness of an effervescent atomizer and an air-core-liquid-ring atomizer for application in spray drying processes of highly concentrated feeds. Chem. Eng. Process. Process Intensif. 2018, 128, 96–102. [Google Scholar] [CrossRef]
  23. Wittner, M.O.; Karbstein, H.P.; Gaukel, V. Pneumatic atomization: Beam steering correction in laser diffraction measurements of spray droplet size distributions. Appl. Sci. 2018, 8, 1738. [Google Scholar] [CrossRef]
  24. Wittner, M.; Karbstein, H.; Gaukel, V. Air-Core-Liquid-Ring (ACLR) Atomization: Influences of Gas Pressure and Atomizer Scale Up on Atomization Efficiency. Processes 2019, 7, 139. [Google Scholar] [CrossRef]
  25. Wittner, M.O.; Karbstein, H.P.; Gaukel, V. Spray drying of high viscous food concentrates: Investigations on the applicability of an Air-Core-Liquid-Ring (ACLR) nozzle for liquid atomization. In Proceedings of the 21st International Drying Symposium, IDS 21st International Drying Symposium, Valencia, Spain, 11–14 September 2018; Cárcel, J.A., Clemente, G., Mulet, A., Eds.; Editorial Universitat Politècnica de València: Valencia, Spain, 2018; pp. 1221–1228, ISBN 978-84-9048-688-7. [Google Scholar]
  26. Wittner, M.O.; Karbstein, H.P.; Gaukel, V. Energy efficient spray drying by increased feed dry matter content: Investigations on the applicability of Air-Core-Liquid-Ring atomization on pilot scale. Dry. Technol. 2019, 1–9. [Google Scholar] [CrossRef]
  27. Prewitt, J. Object Enhancement and Extraction. In Picture Processing and Psychopictorics; Lipkin, B.S., Ed.; Elsevier Science: Oxford, UK, 1970; pp. 75–150. ISBN 9780323146852. [Google Scholar]
  28. Hirt, C.; Nichols, B. Volume of fluid (VOF) method for the dynamics of free boundaries. J. Comput. Phys. 1981, 39, 201–225. [Google Scholar] [CrossRef]
  29. Brackbill, J.; Kothe, D.; Zemach, C. A continuum method for modeling surface tension. J. Comput. Phys. 1992, 100, 335–354. [Google Scholar] [CrossRef]
  30. Wilcox, D.C.; Rubesin, M.W. Progress in Turbulence Modeling for Complex Flow Fields Including Effects of Compressibility No. 19800012043, Moffett Field, CA, USA. 1980. Available online: https://ntrs.nasa.gov/search.jsp?R=19800012043 (accessed on 5 September 2019).
  31. Menter, F.R. Improved Two-Equation K-Omega Turbulence Models for Aerodynamic Flows No. 19930013620, Moffett Fields, CA, USA. 1992. Available online: https://ntrs.nasa.gov/search.jsp?R=19930013620 (accessed on 9 October 2018).
  32. Menter, F.R.; Smirnov, P.E.; Liu, T.; Avancha, R. A One-Equation Local Correlation-Based Transition Model. Flow Turbul. Combust. 2015, 95, 583–619. [Google Scholar] [CrossRef]
  33. Hewitt, G. Annular Two-Phase Flow; Elsevier Science: Burlington, NJ, USA, 1970; ISBN 9781483285238. [Google Scholar]
  34. Ghajar, A.J.; Bhagwat, S.M. Gas-Liquid Flow in Ducts. In Multiphase Flow Handbook; Michaelides, E.E., Crowe, C.T., Schwarzkopf, J.D., Eds.; CRC Press: Boca Raton, FL, USA, 2016; pp. 287–356. ISBN 9781315371924. [Google Scholar]
Figure 1. Scheme of used air-core–liquid-ring (ACLR) atomizer geometry. (A) diameter of the gas capillary (1.5 mm); (B) length of the mixing zone (2.4 mm); (C) length of the exit orifice (1.5 mm); (D) diameter of the exit orifice (1.5 mm).
Processes 07 00616 g001
Figure 2. Sample image of flow conditions inside the exit orifice of the atomizer (µ = 0.39 Pa·s; QL = 40 L·h−1, pgas = 0.4 MPa, air-to-liquid ratio (ALR) = 0.05). (A) Image before analysis. (B) Image with marked boundaries of the exit orifice (blue lines), as well as boundaries between liquid and gas core (red). (C) Image with additional line probe (green line).
Processes 07 00616 g002
Figure 3. Two-dimensional section of the polyhedral mesh, corresponding to atomizer geometry in Figure 1. (A) Diameter of the gas capillary; (B) length of the mixing zone; (C) length of the exit orifice; (D) diameter of the exit orifice.
Processes 07 00616 g003
Figure 4. Time dependent values of the 50th percentile of the volumetric sum distribution x50,3 (grey dots) at µ = 0.39 Pa·s and QL = 40 L·h−1 are shown for measurements at pgas = 0.4 MPa (left) and pgas = 0.8 MPa (right). Additionally, the 5th percentile x5,0 (lower dashed line), 50th percentile x50,0 (solid line) and 95th percentile x95,0 (upper dashed line) of x50,3 are given.
Processes 07 00616 g004
Figure 5. Time dependent liquid film thickness h (grey dots) for measurements at µ = 0.39 Pa·s and QL = 40 L·h−1. Results at pgas = 0.4 MPa (left) and pgas = 0.8 MPa (right) are given. Additionally, x5,0 (lower dashed line), x50,0 (solid line) and x95,0 (upper dashed line) of the liquid film thickness are given.
Processes 07 00616 g005
Figure 6. Breakup of the gas core inside the exit orifice of the atomizer (µ = 0.39 Pa·s; QL = 40 L·h−1, pgas = 0.4 MPa, ALR = 0.05). (A) Begin of the breakup. Liquid film was still detectable at the line probe (green line; time: 6.40 × 10⁻³ s). (B) Complete breakup. The exit orifice was almost completely filled with liquid (time: 6.45 × 10⁻³ s). (C) Fully established gas core after breakup (time: 6.50 × 10⁻³ s).
Processes 07 00616 g006
Figure 7. Exemplary 2D section of the nozzle geometry with simulated volume fraction of liquid. For comparison of time dependent liquid film thicknesses with optical measurements, a line probe (close up view; white dashed line) was used (cf. Figure 3). Additionally, length (C) and diameter (D) of the exit orifice, are indicated (cf. Figure 1 and Figure 2).
Processes 07 00616 g007
Figure 8. Time dependent simulation results of liquid film thickness h (grey rings) at µ = 0.39 Pa·s and QL = 40 L·h−1. Results at pgas = 0.4 MPa (left) and pgas = 0.8 MPa (right) are given. Additionally, x5,0 (lower dashed line), x50,0 (solid line) and x95,0 (upper dashed line) of the liquid film thickness are given.
Processes 07 00616 g008
Figure 9. Profiles of the volume fraction of liquid (top row), velocity (middle row) and pressure loss in the atomizer (bottom row) at µ = 0.39 Pa·s and QL = 40 L·h−1. Results at ALR = 0.05 and pgas = 0.4 MPa (left), as well as at ALR = 0.13 and pgas = 0.8 MPa (right) are given.
Processes 07 00616 g009
Figure 10. Time dependent values of measured (left, grey dots) and simulated (right, grey rings) film thickness h at µ = 0.12 Pa·s and ALR = 0.15 (QL = 30 L·h−1; pgas = 0.6 MPa). Additionally, x5,0 (lower dashed line), x50,0 (solid line) and x95,0 (upper dashed line) of the liquid film thickness are given.
Processes 07 00616 g010
Figure 11. Profiles of the volume fraction of liquid (left), velocity (middle) and pressure loss in the atomizer (right) at µ = 0.12 Pa·s and ALR = 0.15 (QL = 30 L·h−1; pgas = 0.6 MPa).
Processes 07 00616 g011
Table 1. Physical properties: viscosity (µ), surface tension (σ), density (ρ) and refractive index (RI), as well as corresponding uncertainty values ur(γ) of test solutions at 25 °C. Dry matter content cMD is given as dry base value (d.b.).
cMD (% d.b.)µ (Pa·s)ur(µ) (%)σ (N·m−1)ur(σ) (%)ρ (kg·m−3)ur(ρ) (%)RI (-)ur(RI) (%)
400.129.790.0730.0211750.021.400.07
470.393.790.0740.0512180.061.420.04
Table 2. Pressure loss and wall shear stress values at the nozzle wall for a liquid viscosity of 0.39 Pa·s and two different ALR: 0.05 and 0.13.
ALRPressure Loss (MPa)Wall Shear Stress (MPa)
0.050.3820.0396
0.130.3220.0655
Table 3. Characteristic values of the characteristic droplet size x50,3 and of the time dependent distribution of the liquid film thickness from simulation and optical measurement in dependency of the process parameters applied.
Process ParametersLiquid Film ThicknessChar. Droplet Size x50.3
SimulationOptical Measurement
µALRx5,0x50,0x95,0x5,0x50,0x95,0x5,0urx50,0urx95,0ur
(Pa·s)(-)(µm)(µm)(µm)(µm)(µm)(µm)(µm)(%)(µm)(%)(µm)(%)
0.120.15351082225195182831.71001.61281.6
0.390.05118186524961844091155.21696.23516.0
0.390.137814934259112215847.61077.01606.8

