Article

Analysis of Dynamic Characteristics and Control Strategies of a Solvent Dehydration Distillation Column in a Purified Terephthalic Acid Plant

1
School of Energy and Power Engineering, University of Shanghai for Science and Technology, Shanghai 200093, China
2
Shanghai Key Laboratory of Multiphase Flow and Heat Transfer in Power Engineering, Shanghai 200093, China
*
Author to whom correspondence should be addressed.
Processes 2020, 8(1), 125; https://doi.org/10.3390/pr8010125
Submission received: 9 December 2019 / Revised: 15 January 2020 / Accepted: 17 January 2020 / Published: 19 January 2020
(This article belongs to the Section Chemical Processes and Systems)

Abstract

:
In this study, a solvent dehydration column of purified terephthalic acid (PTA) plant was used as the research object. Based on a dynamic model of the solvent dehydration column, a dynamic sensitivity analysis of the key parameters was carried out using Aspen Dynamics. After the dynamic model reached stability, the reflux rate, methyl acetate concentration, and reflux temperature of the solvent dehydration column were adjusted and the changes of the key separation indexes under the corresponding disturbance were analyzed. According to the analysis results, a sensitive plate temperature controller was added to carry out the dynamic sensitivity analysis. In addition, the acetic acid (HAc) concentration of the bottom of the column was found to be unstable in the dynamic sensitivity analysis. Considering the HAc concentration controller of the column bottom, two control strategies were designed. By analyzing the dynamic response of the feed flow disturbance under different control strategies, a more suitable control strategy under different conditions was obtained. From this, a reasonable method could be derived to design the control strategy, thereby providing a theoretical basis for further real-time optimization and advanced control of solvent dehydration in a PTA plant.

1. Introduction

Purified terephthalic acid (PTA) is an important raw material in the polyester and textile industries. Formed by catalytic oxidation of p-xylene (PX), it was first obtained via continuous selective hydrogenation of terephthalic acid [1]. In the process of PX oxidation to produce PTA, HAc was used as a solvent and water was formed during the reaction. The unreacted precursor, PX, and the byproduct, methyl acetate (MA), were also contained in the HAc solvent due to the incomplete oxidation reaction and the side reaction. Thus, the HAc recovery process in the production of PTA was an aqueous solution of HAc containing impurities, i.e., PX and MA [2].
In the HAc dehydration system, due to the strong association of HAc molecules, its relative volatility with water was close to 1, ordinary rectification was challenging to separate, and industrial heterogeneous azeotropic distillation was commonly used [3,4]. Among them, the most extensively used entrainers included N-butyl acetate (NBA) [5,6,7], N-propyl acetate (NPA) [8], and I-butyl acetate (IBA) [9]. The PTA production process was a typical heterogeneous azeotropic distillation system; the steady-state PTA simulation production process [10,11,12] was demonstrated elsewhere. However, among the variables of multiphase azeotropic distillation [13,14], the coupling was serious, characterized by parameter sensitivity, multistability, nonlinearity [15,16,17], and, usually, nonconvergence, thereby greatly increasing the difficulty of control; some predictive control models were applied to solve these problems [18,19]. The importance of dynamic performance analysis of the HAc dehydration process was increasingly obvious. Zeng Genbao et al. [20] used Aspen Dynamics to investigate the dynamic performance of the heterogeneous azeotropic distillation of the HAc dehydration process.
Han et al. [21] improved a controller to identify disturbances, which can be applied to the PTA solvent dehydration unit. Wei Qianqian et al. [22] added a temperature controller to the recovery column in the HAc dehydration extractive distillation process to adjust the reflux ratio and overcome the disturbance of the HAc component in the feed. Wang et al. [23] proposed a new temperature control strategy, which selected temperature-sensitive plates by singular value decomposition and closed-loop analysis methods, thereby providing certain reference significance.
Although some studies were conducted on the design of dynamic modeling and control strategies for HAc dehydration systems, no dynamic sensitivity analysis has ever been performed. A dynamic model better describes the operating conditions of the system, and dynamic sensitivity analysis better reflects the impact of changes in key process parameters and operating conditions on the real-time separation of the process and energy consumption, therefore offering better proof and ideas for the design of the control strategy.
In this paper, HAc dehydration with NPA as the entrainer was studied, considering the influence and recycling of the unreacted precursor, PX, and the byproduct, MA, in the solvent, HAc. The steady-state model of the five-component mixture described in our previous research [24] was used as the basis. Dynamic sensitivity analysis of the dynamic simulation and the key parameters was carried out using Aspen Dynamics software. The obtained dynamic sensitivity analysis results not only better described the performance of the solvent dehydration column in real time, but also provided a more accurate basis for the design of the dynamic model’s control strategies. Through studying the performance of feed mass flow disturbance under the control strategies, a more suitable control strategy was obtained. Furthermore, the theoretical basis and method guidance were provided to design the control scheme and to achieve further real-time optimization and advanced control for solvent dehydration in the PTA plant, and even for the industrial HAc dehydration process.

2. Steady-State Simulation

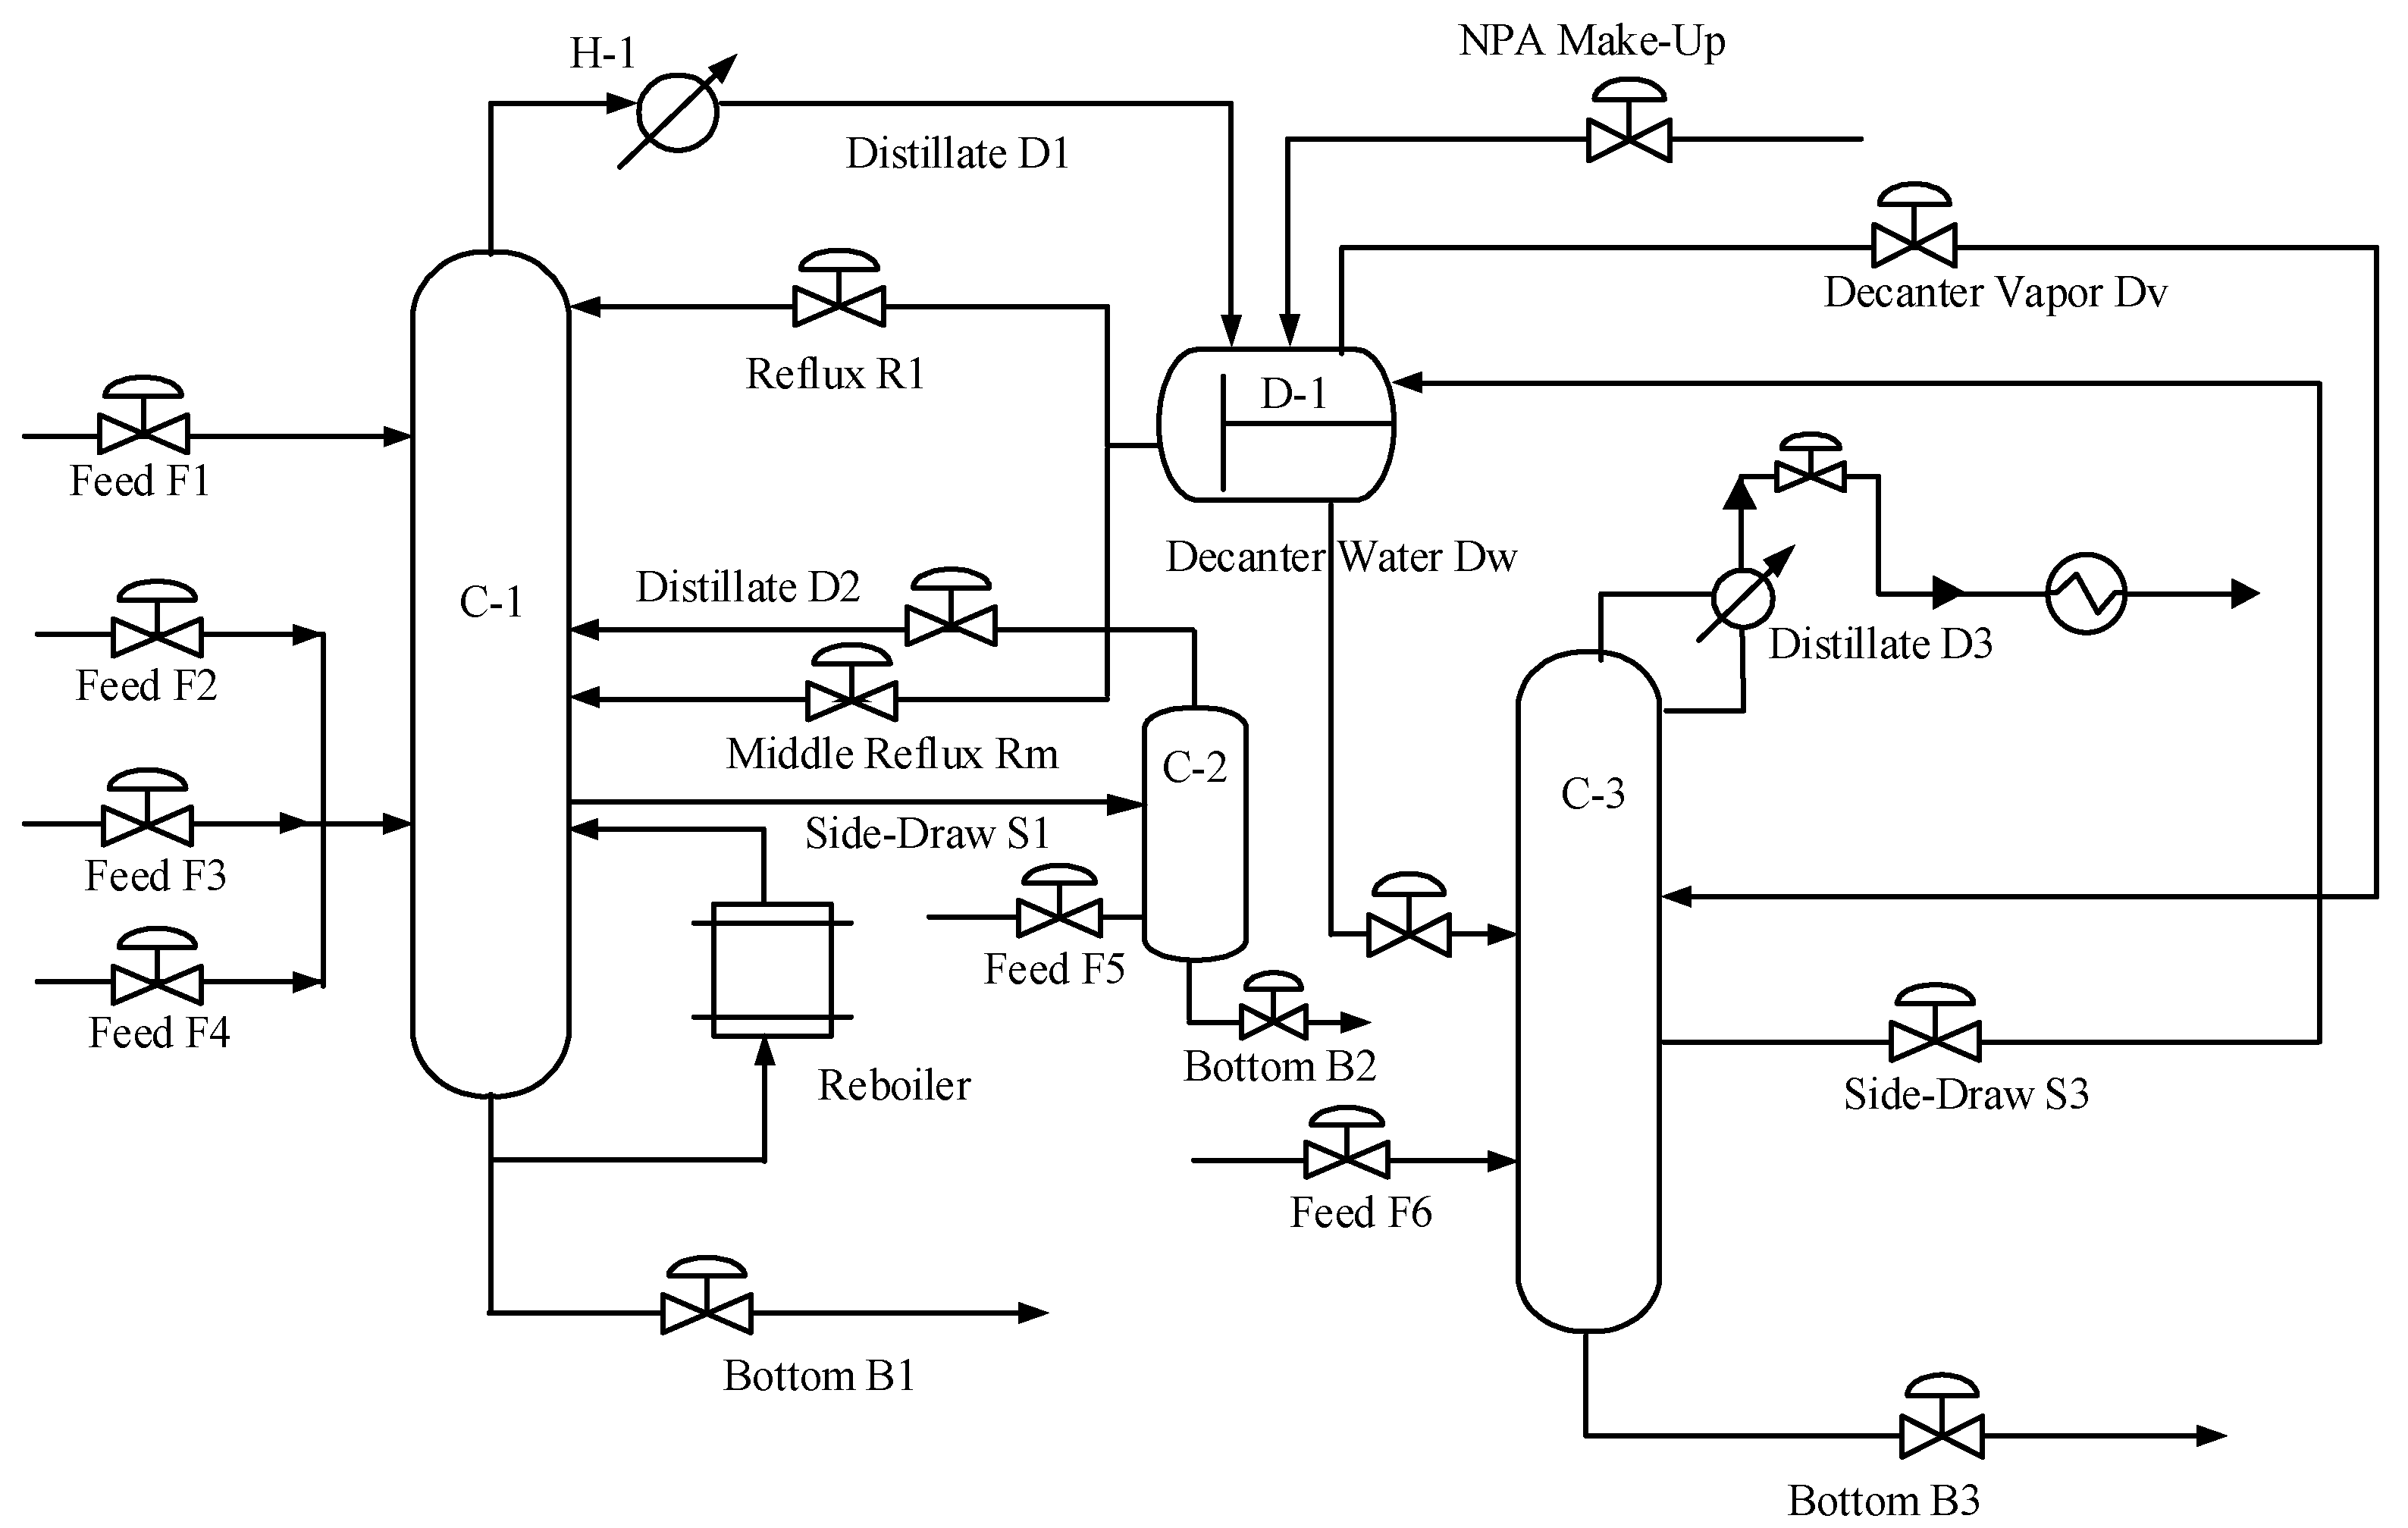
2.1. Steady-State Process for the Dehydration of HAc

The flow diagram of the studied industrial dehydration process is shown in Figure 1. Four feeds feed 1~4 (F1–F4) extended from the upstream process into the dehydration column (C-1). The four feeds were separated in C-1 using NPA as entrainer to make the top distillate (D1) containing few HAc (ppm scale) and the bottom stream (B1) containing 95 wt% HAc. D1 was sent to the decanter (D-1). Reflux (R1) and Middle Reflux (Rm) frome D-1 were refluxed into C-1. The side-draw of C-1 (S1), was taken from the upper part of C-1 and sent to the PX recovery column (C-2). Feed 5 (F5) provided the heat required for the C-2. The distillate of C-2 (D2) was sent back to the C-1 column as the overhead vapor of C-2. In addition, PX and HAc in the bottom discharge (B2) were returned to the reactor. The gas phase of D-1 (Dv) entered the upper rectifying section of the azeotrope recovery column (C-3), the water phase of D-1 (Dw) was sent to the bottom stripping section of C-3, and C-3 was directly heated by the steam feed (F6). The distillate of C-3 (D3) was cooled and recovered by a cooler in a storage tank and then pumped to the oxidation reactor to inhibit the formation of MA, thereby reducing the oxidation side reaction. The bottom liquid (B3) was cooled and pumped to the wastewater user and the sewage treatment plant. To further recover the MA, the non-condensable tail gas at the top of the C-3 entered the atmospheric pressure absorption column.
We studied the physical model and parameters of the five-component mixture and the steady-state simulation and analysis in previous research [24,25,26]. All physical parameters, specific feed data, and other column parameters were discussed in these previous papers [24,25,26]. The process was mainly divided into four main components, including the HAc dehydration column, the PX recovery column, the decanter, and the NPA recovery column. The HAc dehydration column was selected by a RadFrac model with a reboiler but without a condenser. The PX recovery column was selected by a RadFrac model without a reboiler or a condenser. The NPA recovery column was selected by the RadFrac model simulation with a reboiler and a condenser. The top condenser was selected by the Heater model and the decanter was selected by the Flash3 model (a flash tank with three exit streams). The resulting simulation process, as seen in Figure 1, was obtained by adding flow dividers, pumps, and logistics modules, such as feed streams, discharge streams, connecting streams, and recycle streams, according to the process’s flow and requirements with Aspen Plus.
According to our previous research [24], compared with the other two columns, the HAc dehydration column C-1 consumed the most energy and possessed the most parameters. The working conditions were more complicated and the simulation calculation was more difficult. Therefore, the C1 column in the HAc dehydration process was an important research object. During actual production, the total amount of PX was small and C-2 was a small-load column (less than 4000 kg/h. The distribution, the separation principle, and the separation task of the column were relatively simple. Therefore, C-2 did not affect separation much or consume much energy during the whole HAc dehydration process, so the column was not considered in the subsequent actual overload condition model analysis. Due to the contents of PX and HAc in the feed components of the C-3 column being very small, these two components were ignored in this study. Additionally, only the NPA–MA–water ternary system was considered.
In this paper, the C-1 and C-3 columns were the main research objects. Regardless of the C-2 column, the discharge stream D2 was set to a fixed value. Dynamic simulation research was carried out to analyze the dynamic performance of the whole process. The association parameters in the Hayden and O’Connell(HOC) equation provided by Huang et al. [26] were combined with the binary interaction parameters in the Universal Quasi-Chemical Model [27] equation (UNIQUAC) and the mathematical steady-state equilibrium model of mass balance (M), phase equilibrium (E), summation (S), and energy balance (H) (MESH) equations [28]. Then, the established steady-state model was used as the basis of the dynamic model using Aspen Plus Dynamic software.

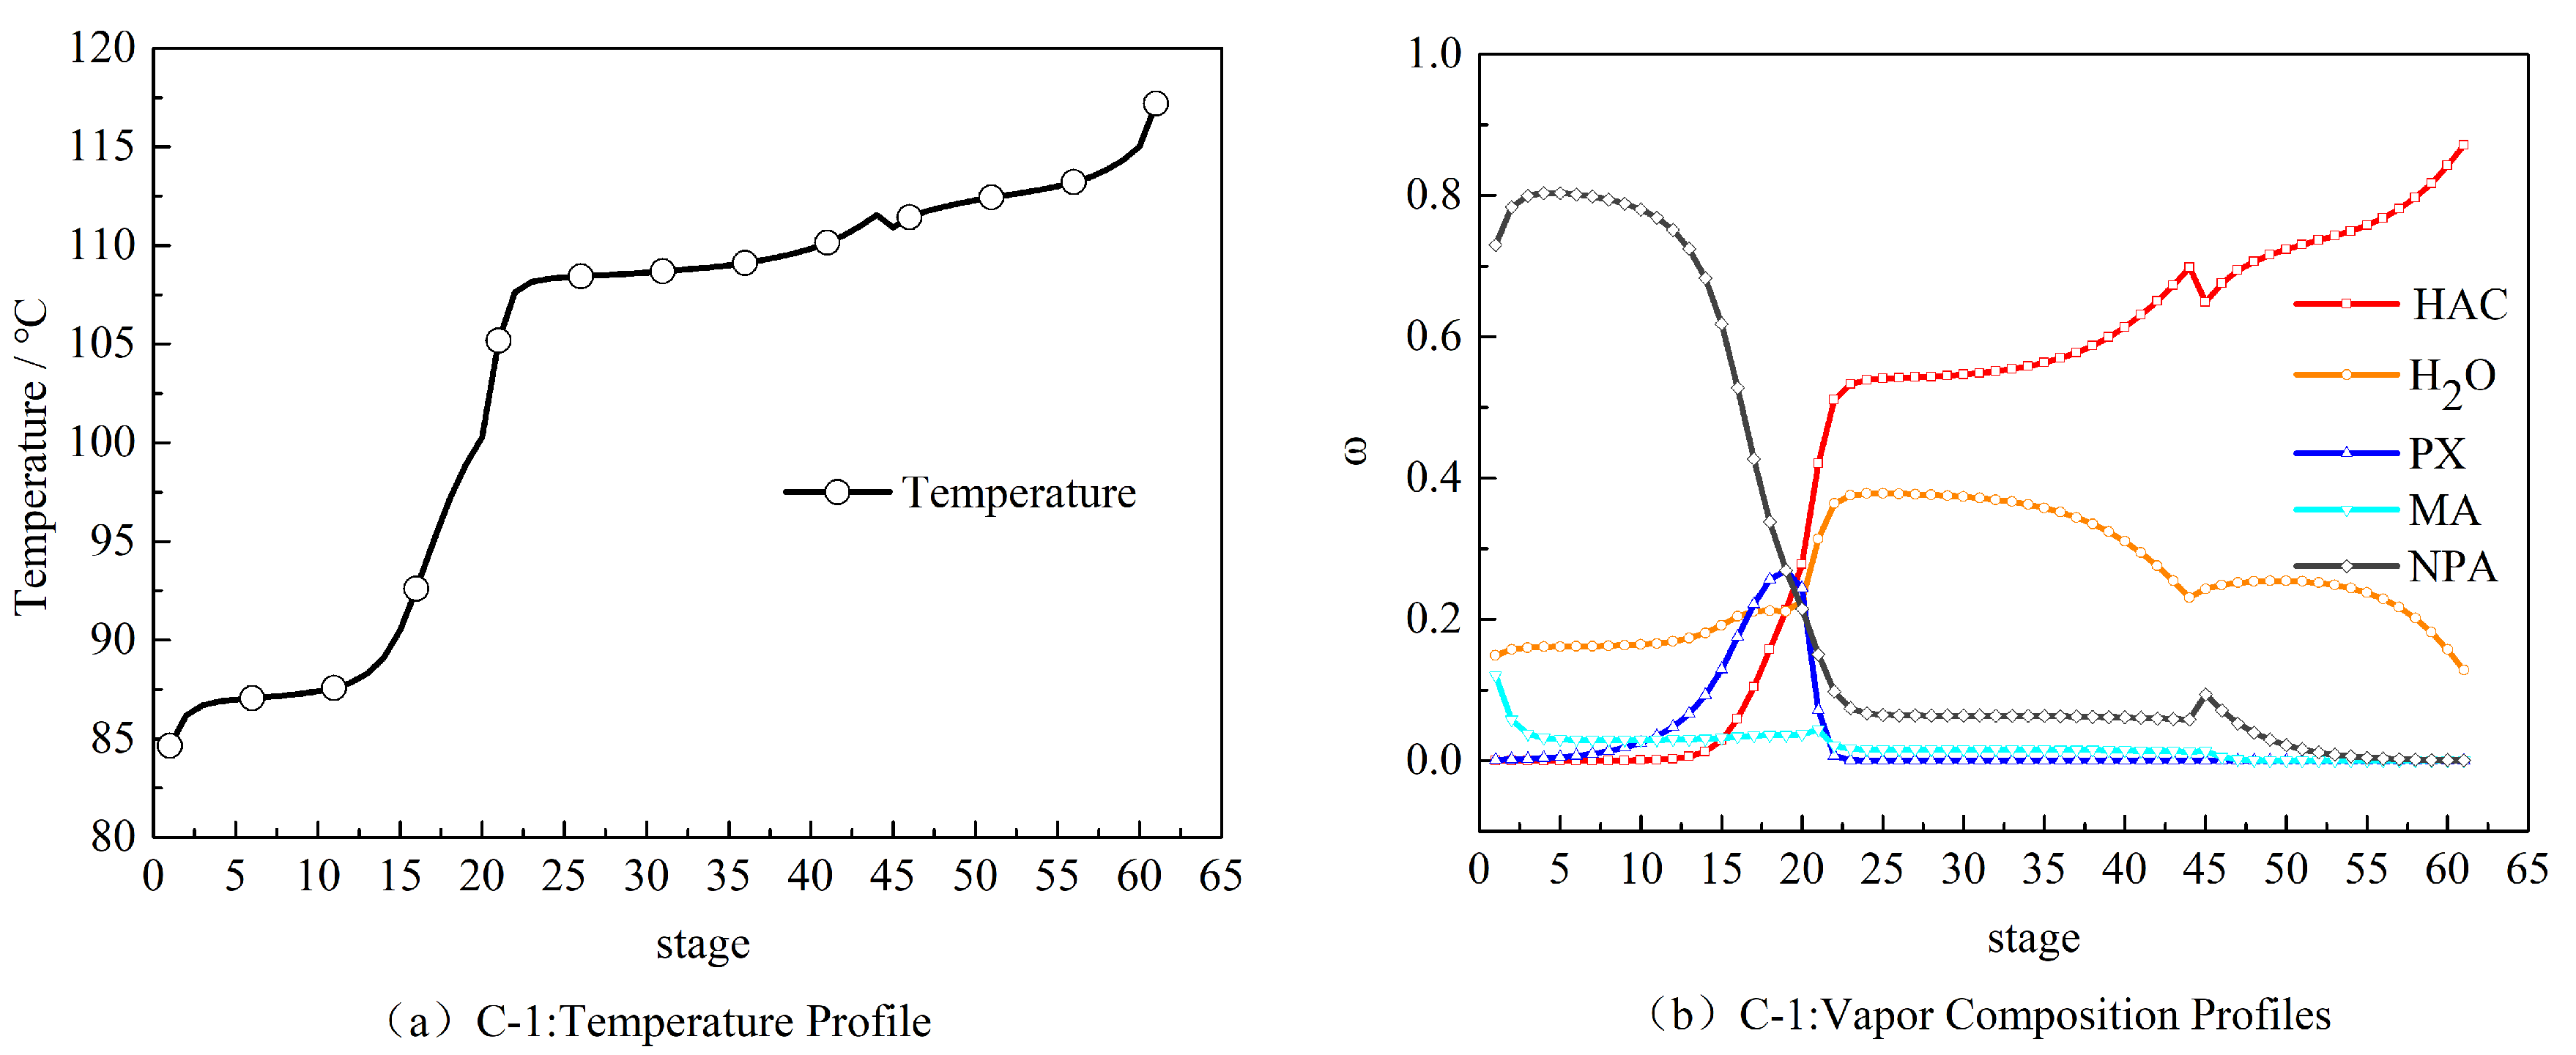
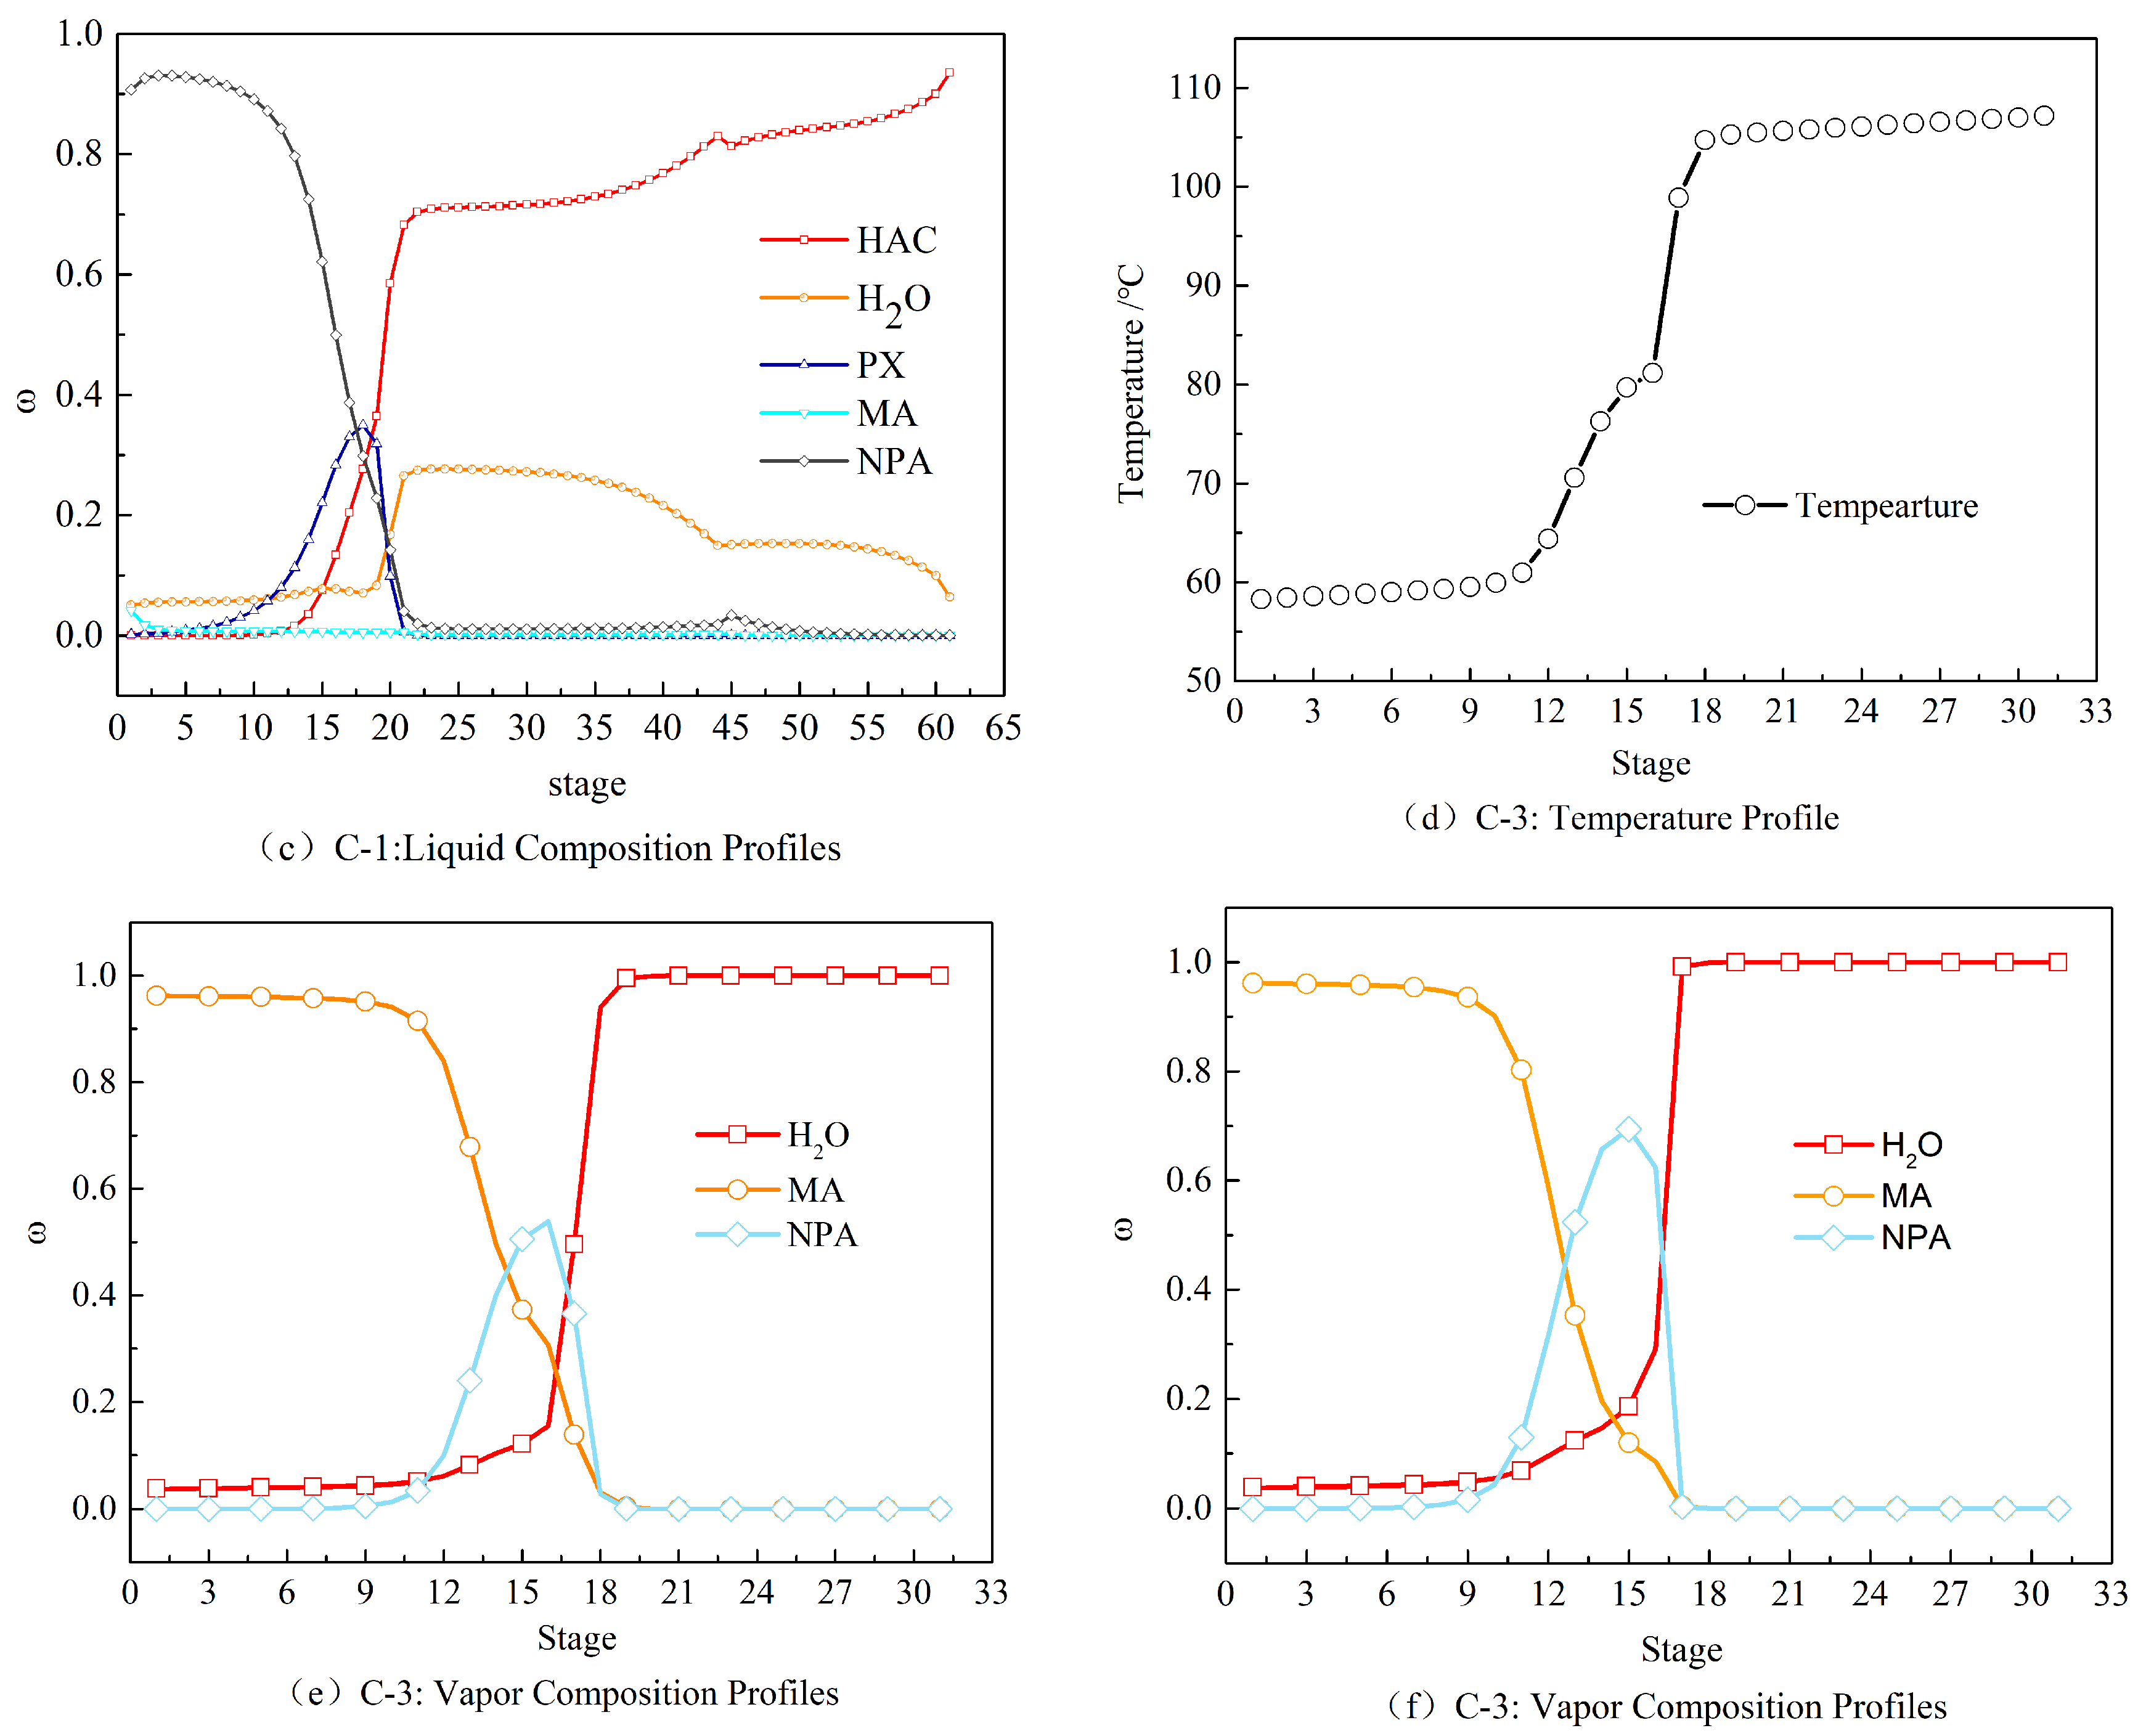
2.2. Steady-State Results of the HAc Dehydration Column

Using the actual working condition data, Table 1 presents the simulation results of the component contents [24]. The mass flow rate of the C-1 column was obviously larger than that of C-3 column, with a 5-component mixing system existing. However, the contents of HAc and PX in the C-3 column were very small, therefore, only a 3-component mixing system needed to be considered.
Under steady-state, the temperature distribution of the tray and the composition distribution of the gas and liquid phases in the HAc dehydration column C-1 and the azeotrope recovery column C-3 are shown in Figure 2. From the top of the tower to the 14th tray and from the 25th tray to the tower kettle, the temperature changes were relatively stable, showing a slight upward trend. Between the 15th and 20th stage trays, the temperature variation range was large. At the same time, the HAc content increased sharply from 0% to 75% from the 13th plate to the 24th plate. The concentration of the HAc and water at the bottom and the top of the column was less than 0.1% and the bottom water content of the column was less than 7%. The temperature of the C-3 column varied greatly between the 11th and the 20th trays. In addition, the distribution of components in the azeotrope recovery column changed noticeably. In this interval, the MA content dropped sharply to 0, the water content rose sharply to 1, and the azeotropic agent NPA gradually increased from 0 to the maximum value on the 15th and 16th plates, followed by a gradual decrease to 0. The contents of the HAc and PX in this column were small, close to 0, and could be ignored. There was hardly any NPA entrainer at the top and bottom of the column, and all the entrainer only produced in the middle side-draw, which indicated that the entrainer recovered well.
Through analyzing the steady-state simulation results of the HAc dehydration system under actual working conditions, it was found that the C-1 HAc dehydration column consumed the most energy, had the most parameters, and had more complex working conditions than the other two columns, making the simulation calculations more difficult. The contents of PX and HAc in the feed components of C-3 column were very small, therefore, only a ternary system needed to be considered. The tray series was smaller and the heat duty was lower. Therefore, the C-1 column in the HAc dehydration process was more valuable in terms of research and was more suitable for the dynamic simulation and control analysis of azeotropic distillation.

3. Dynamic Simulation and Control

3.1. Balanced Dynamic Mathematical Model

The mathematical model used for the distillation column is the most widely used and mature theory to establish a multicomponent separation process model using the equilibrium stage concept [29]. The separation of any first-order tray in distillation column can be described via the mass balance equation (M), the phase equilibrium equation (E), the normalized equation (S), and the heat-balance equation (H).
Through the combination of the reboiler equation, the condenser equation, the physical property equation, and the MESH equation in a distillation column, the obtained variables can be solved. This system of equations is characterized by strong nonlinearity, strong coupling, and many variables. Among many solving methods, Goldstein et al. [30] and Naphtali et al. [31] used Newton’s method to solve the MESH equation, thereby providing certain reference significance. Considering the heterogeneous azeotropic distillation of the five-component mixture system with the vapor–liquid–liquid three-phase equilibrium, the HAc dehydration column in the current work assumed that there were n trays in the distillation column sorted from top to bottom. The sequence number of the first tray at the top of the column was 1 and the last tray at the bottom of the column was n. The general tray structure of the distillation column is shown in Figure 3, representing the material and heat-balance diagram of tray j in the model column.
To facilitate the solution of the dynamic equation, a dynamic mathematical model of the equilibrium stage of the distillation column after assumptions [32] was introduced, as shown in Table 2.
For the HAc dehydration process, before using Aspen Dynamics software for the dynamic simulation, it was necessary to set up dynamic parameters on the basis of a steady-state model. The tray type was selected as the sieve tray [33] and the column diameter was determined to be 4.46 m, as calculated using the Aspen Plus simulation. The simple packing option was selected for the water conservancy setting of the column. From Equation (1), the theoretical tray height was 0.333 m, where N denotes the theoretical plate number, HETP is the theoretical plate equivalent height, and h indicates the number of theoretical plates.
h = N × ( H E T P )
The calculation of the size of the column was based on 50% of the total volume in the column maintained for 5 min. The length-to-diameter ratio of the equipment was 2. According to Equation (2), the column height was 5.35 m and the diameter was 2.2 m. D was the diameter and V was the column volume.
V = π D 2 4 × ( 2 D )

3.2. Determination of the Sensitive Plate

A sensitive plate was employed to ensure stable product composition in the control column to prevent light components from flowing to the bottom of the column and heavy components reassembling in the top of the column. Many methods can be used for sensitive plate selection, such as slope criteria, sensitivity criteria, singular value decomposition criteria, constant temperature criteria, minimum product fluctuation criteria, etc. [34]. In this paper, the sensitivity criterion was used to find the tray with the most obvious temperature change under conditions of small operation variable disturbances, thus controlling the tray and thereby the overall temperature in the column.
In combination with the steady-state sensitivity analysis results [25], the reflux flow rate had the greatest influence on the temperature in the column. The reflux flow rate was used as the operation variable to select the sensitive plate of the HAc dehydration column. Figure 4 showed the temperature changes of each tray caused by the disturbance of the reflux R1 flow rate (+0.01%). Noticeably, the 16th tray haf the greatest response when disturbed by reflux and was closer to the top reflux tray position than the 21th tray. Consequently, the 16th tray was selected as the sensitive plate of the HAc dehydration column.

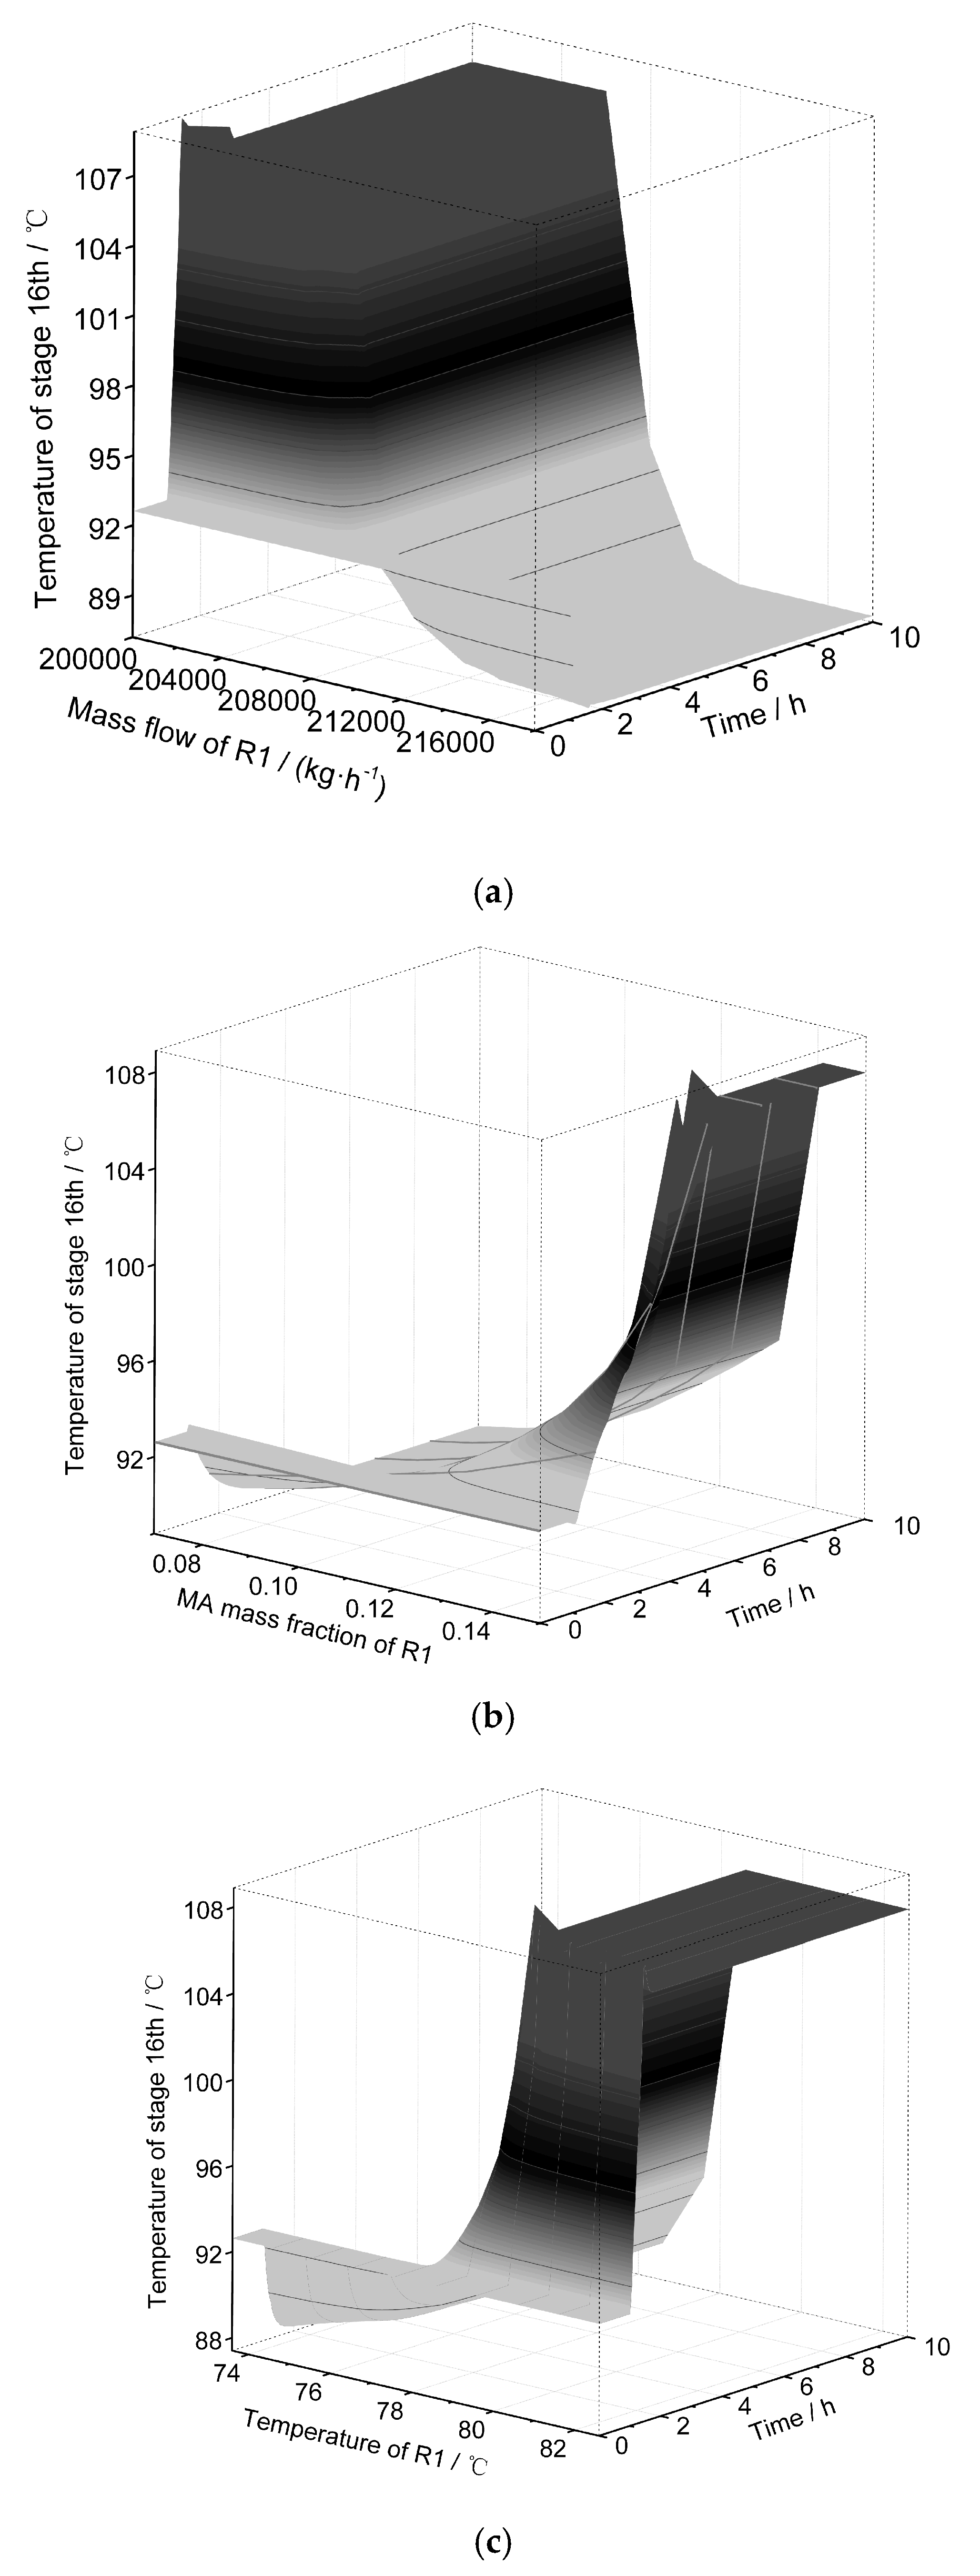
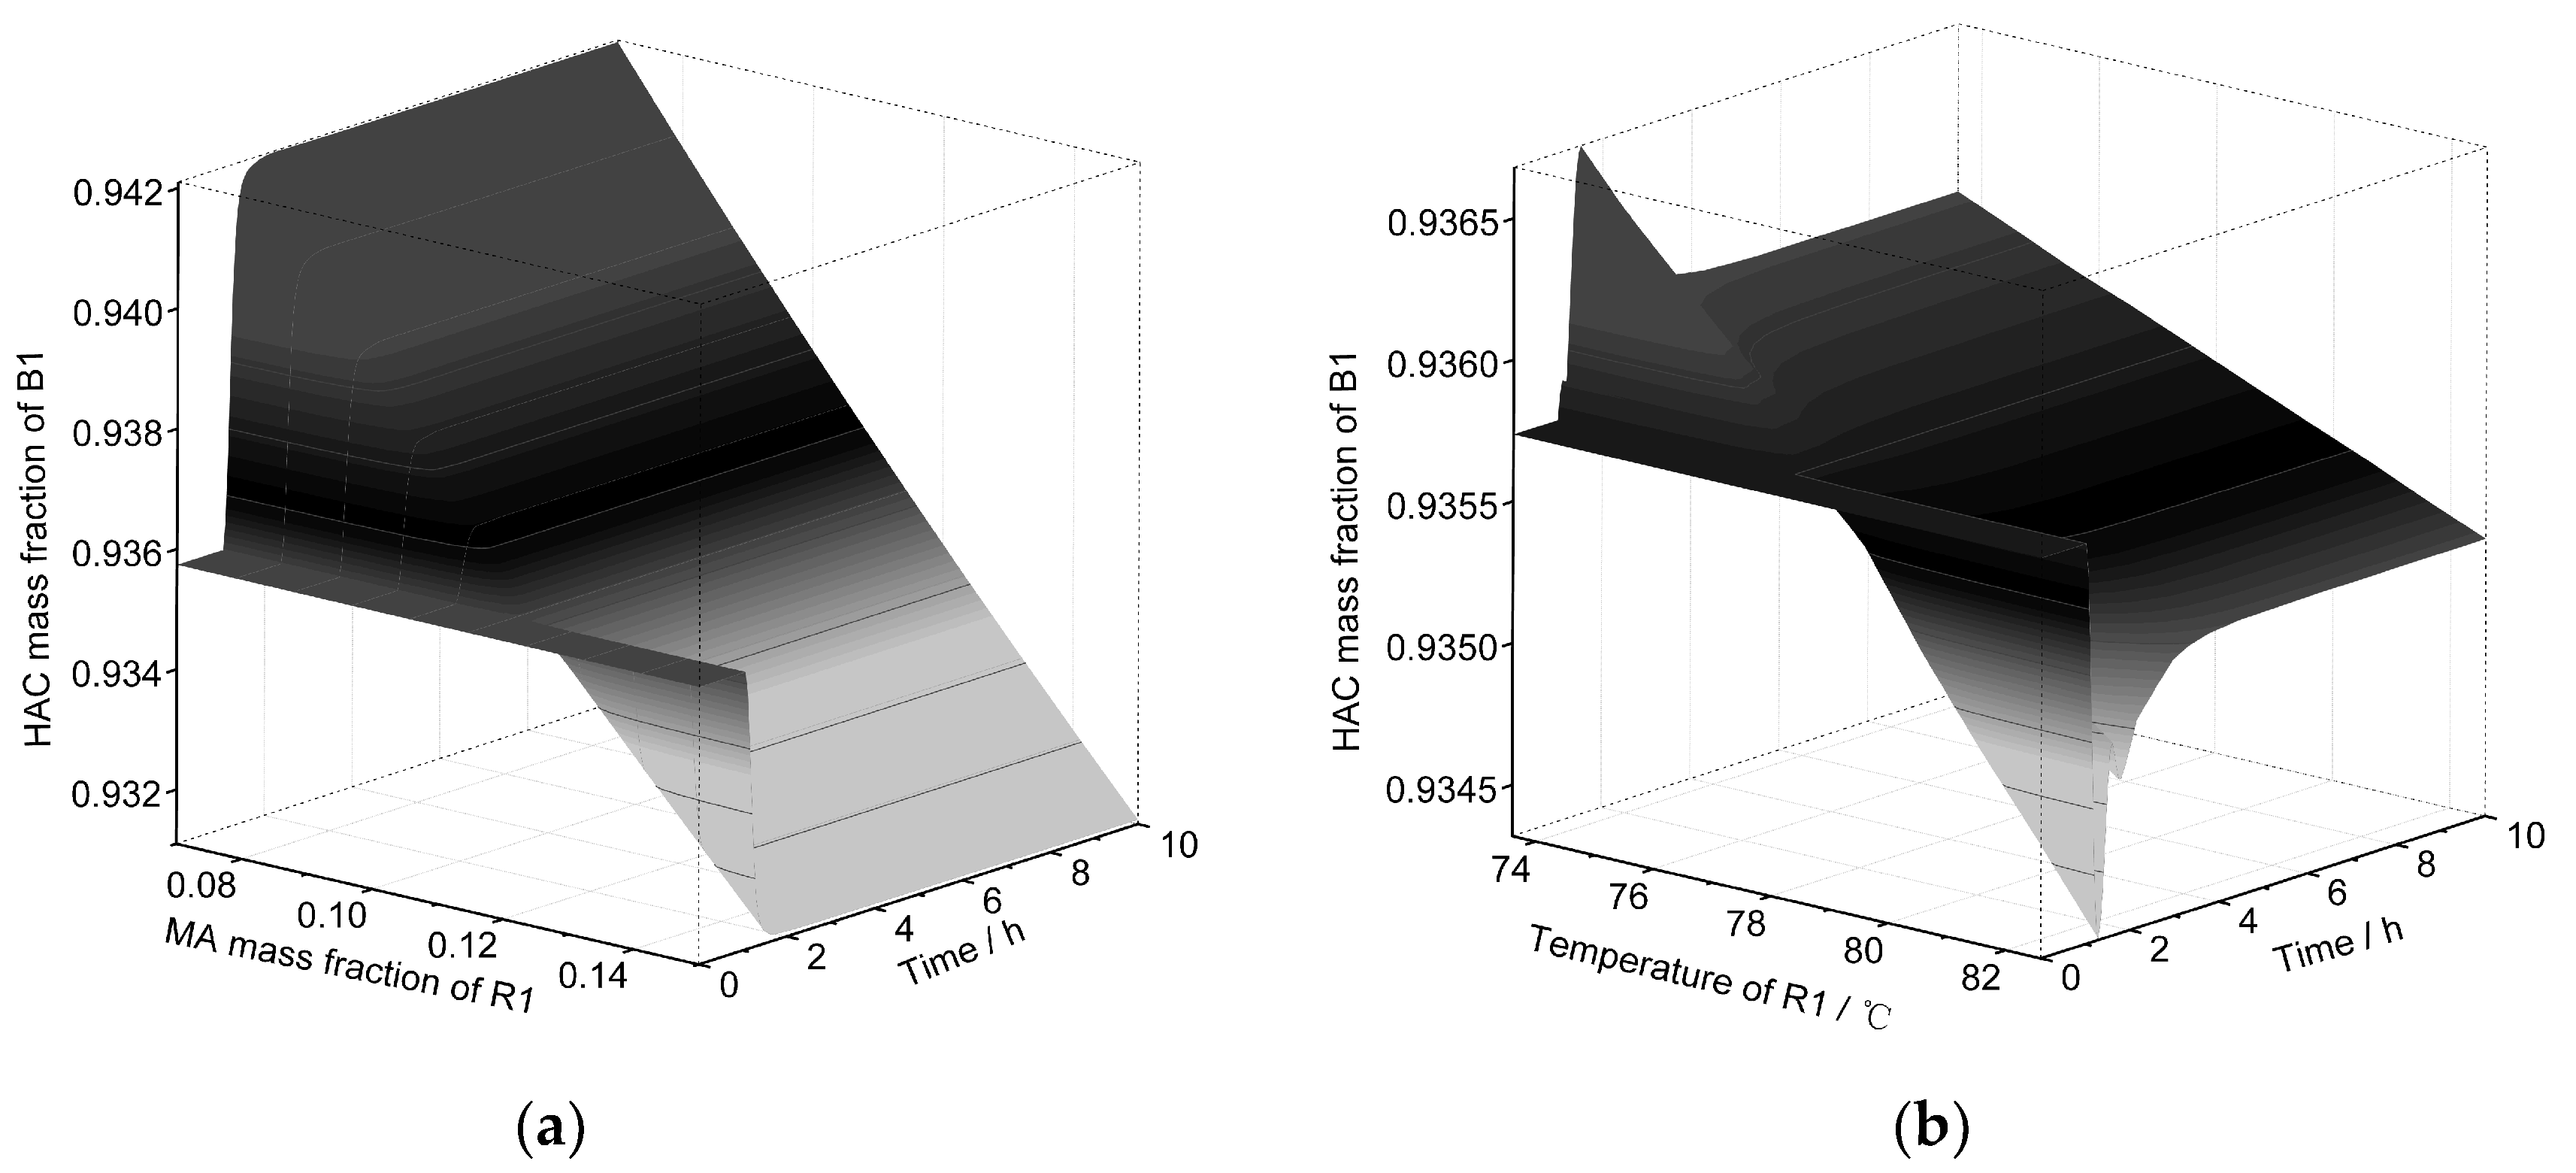
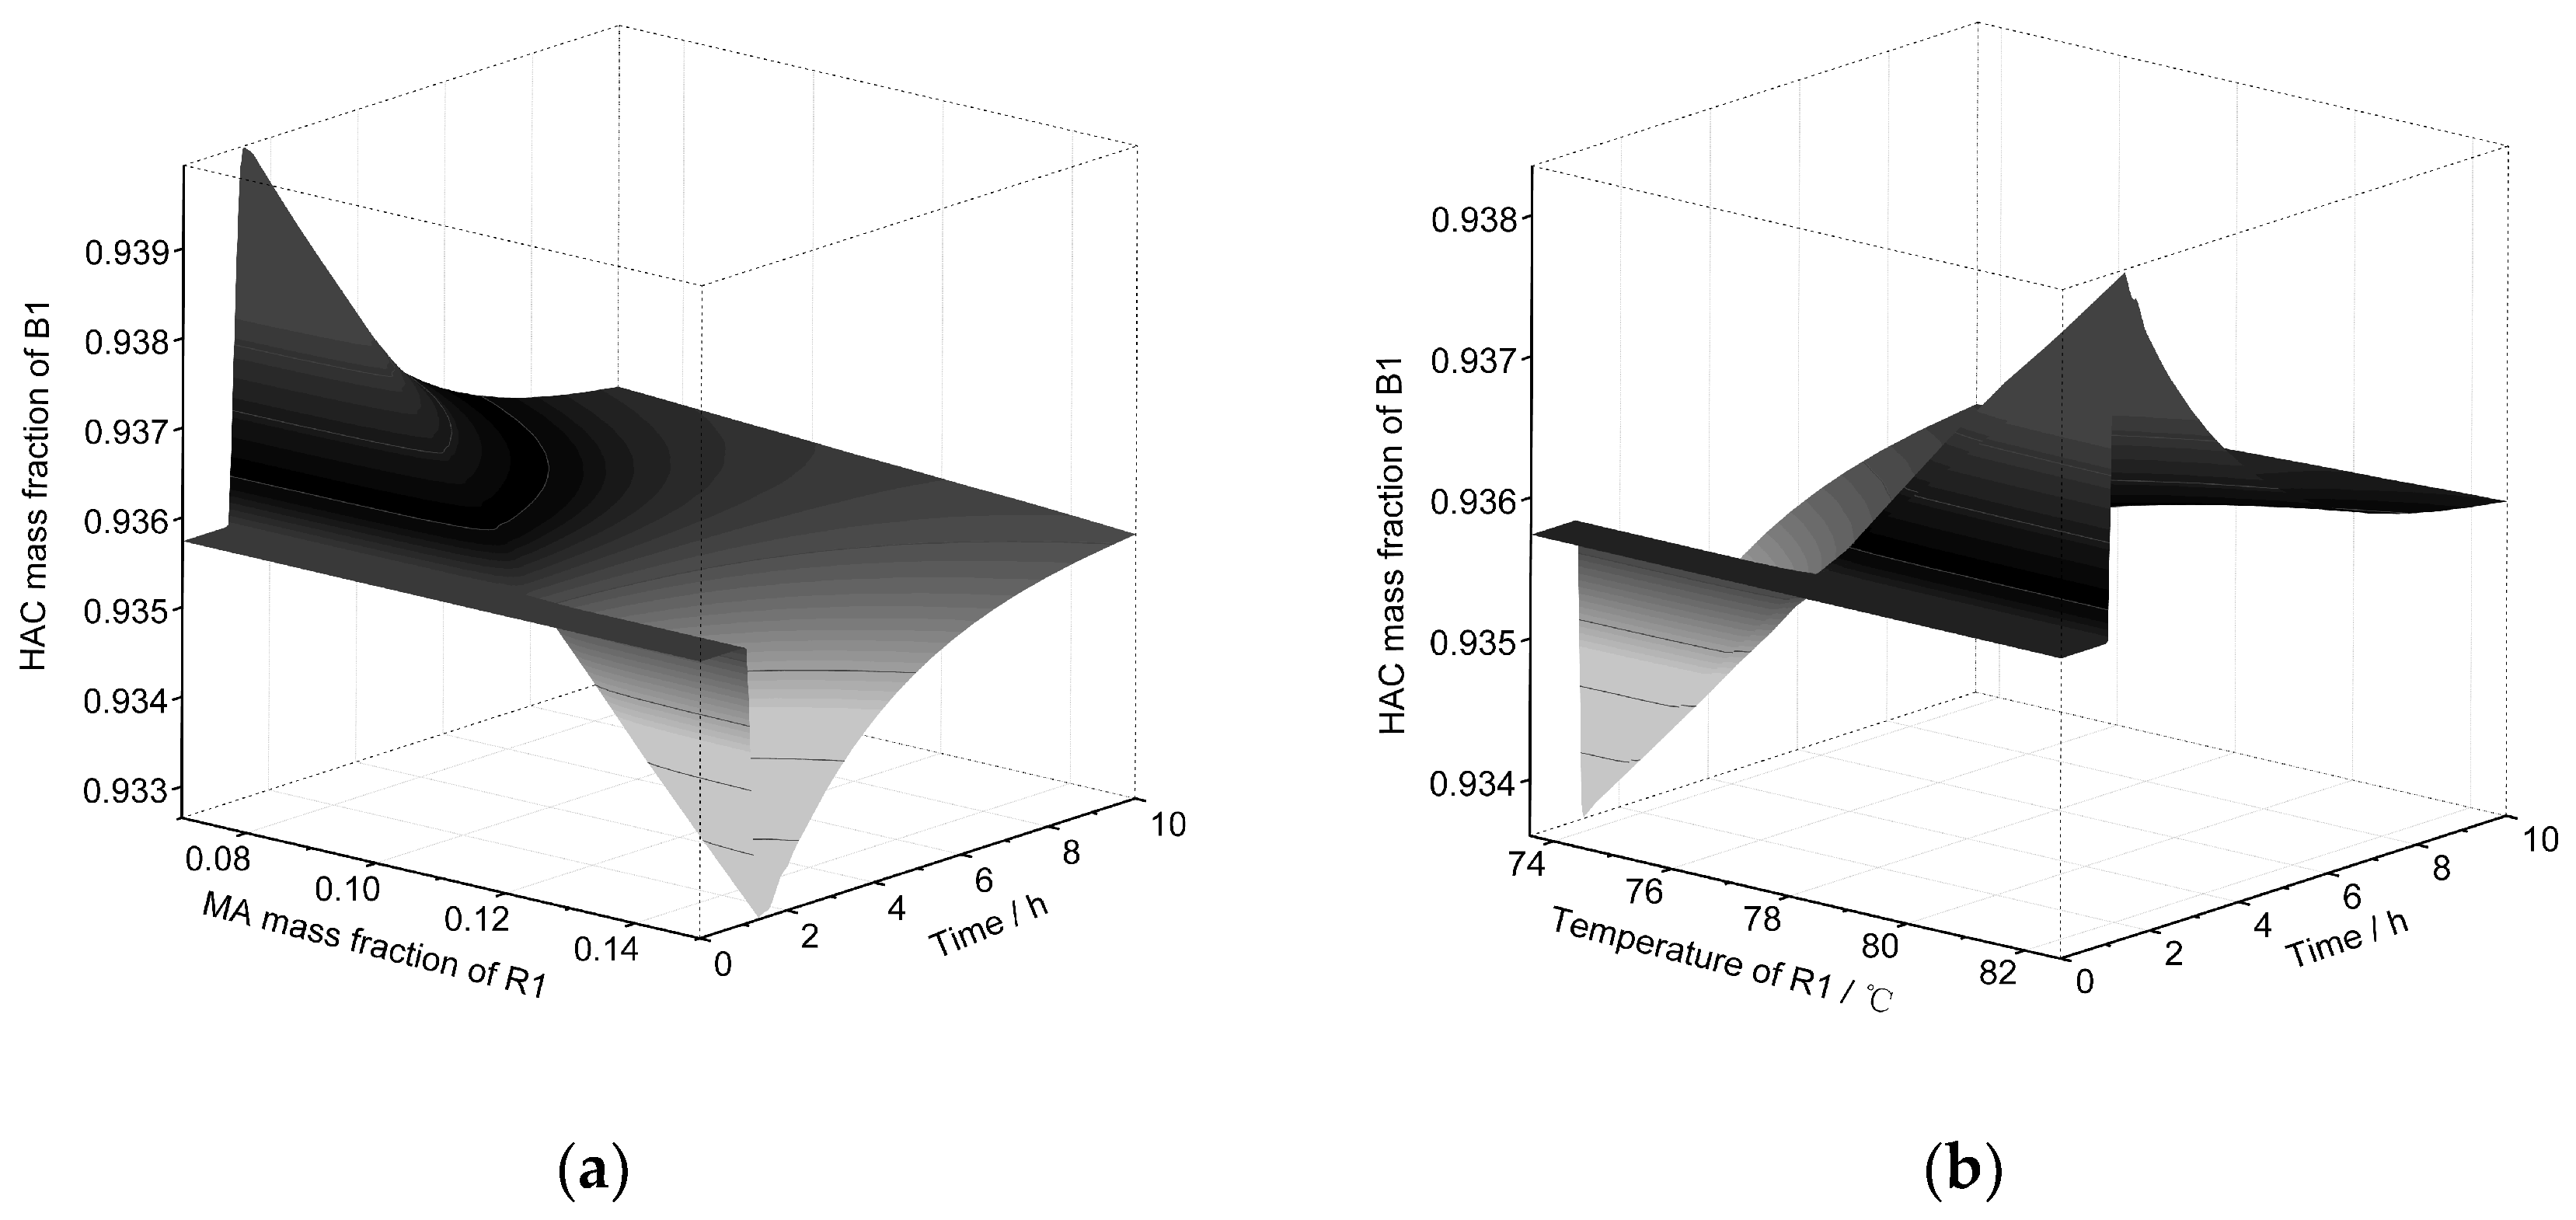
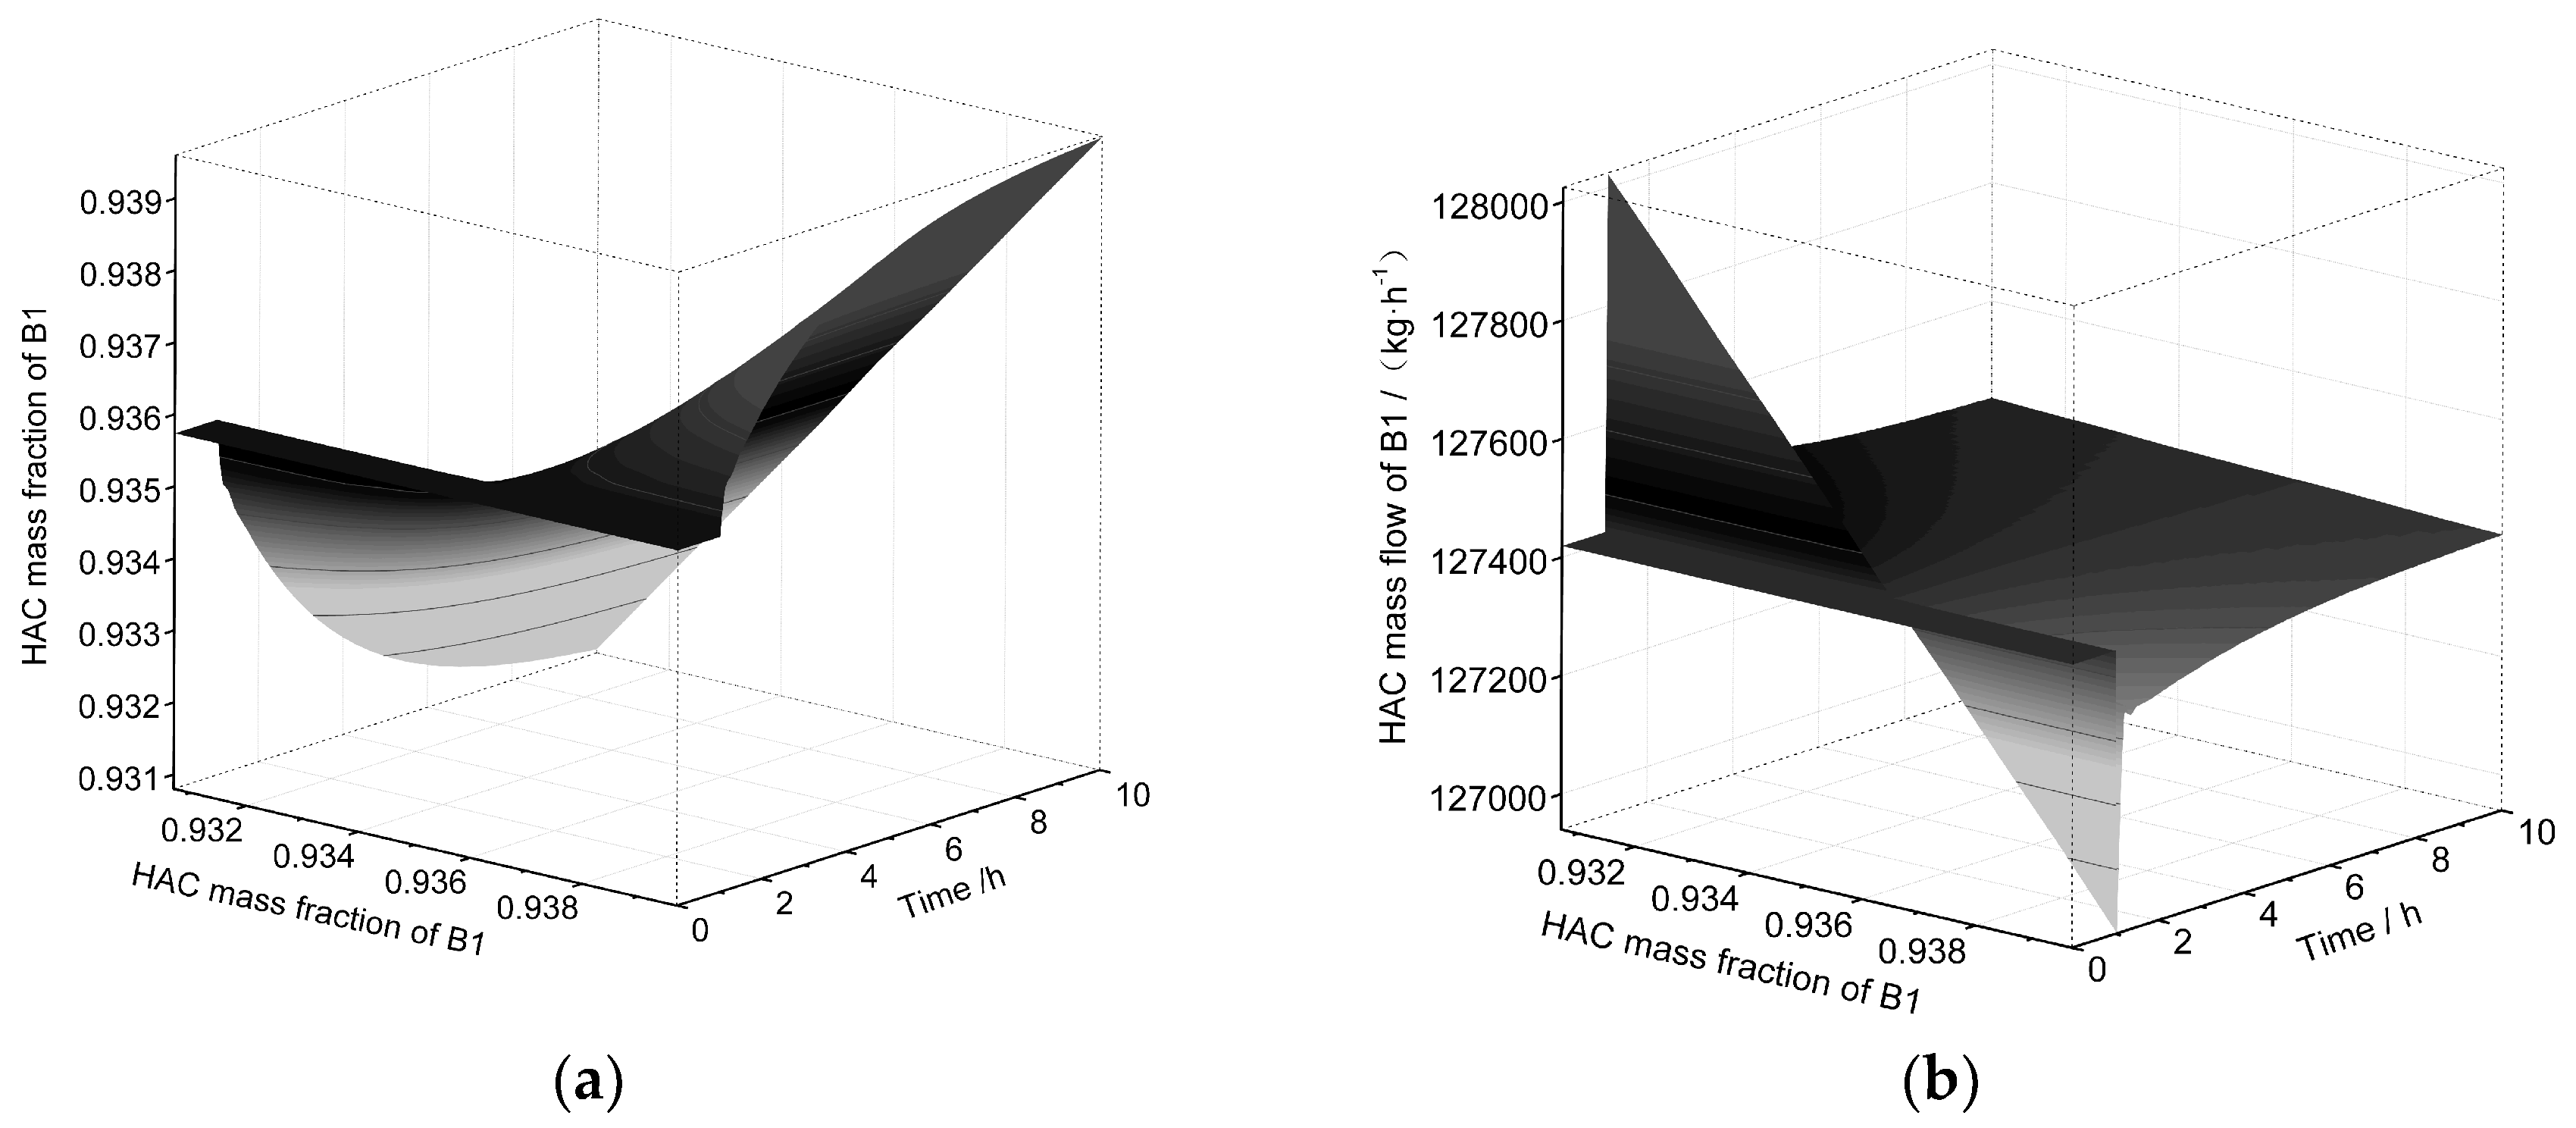
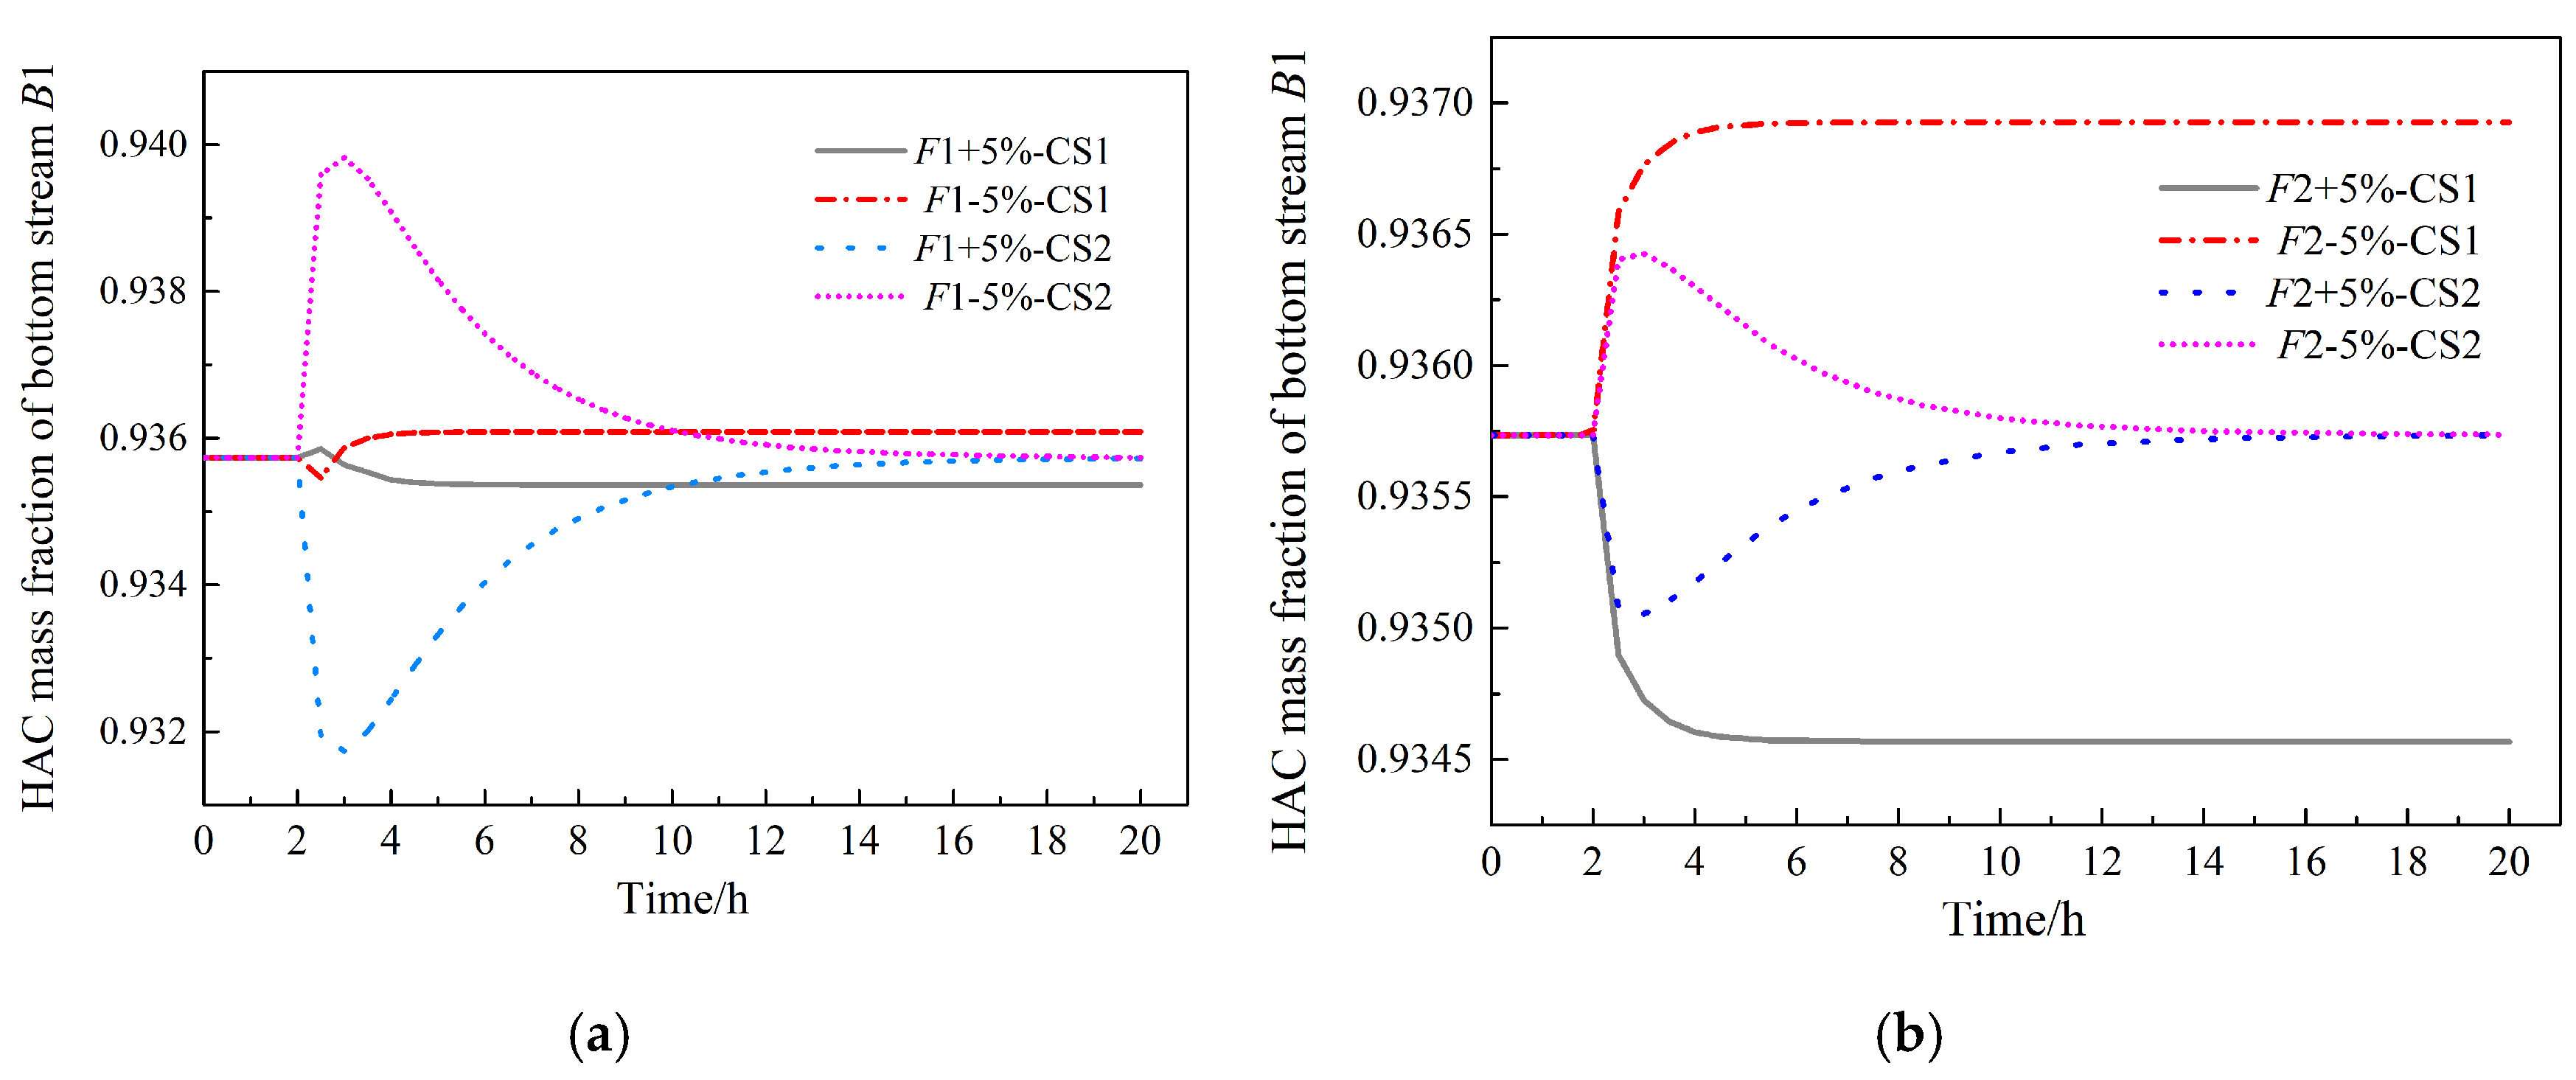
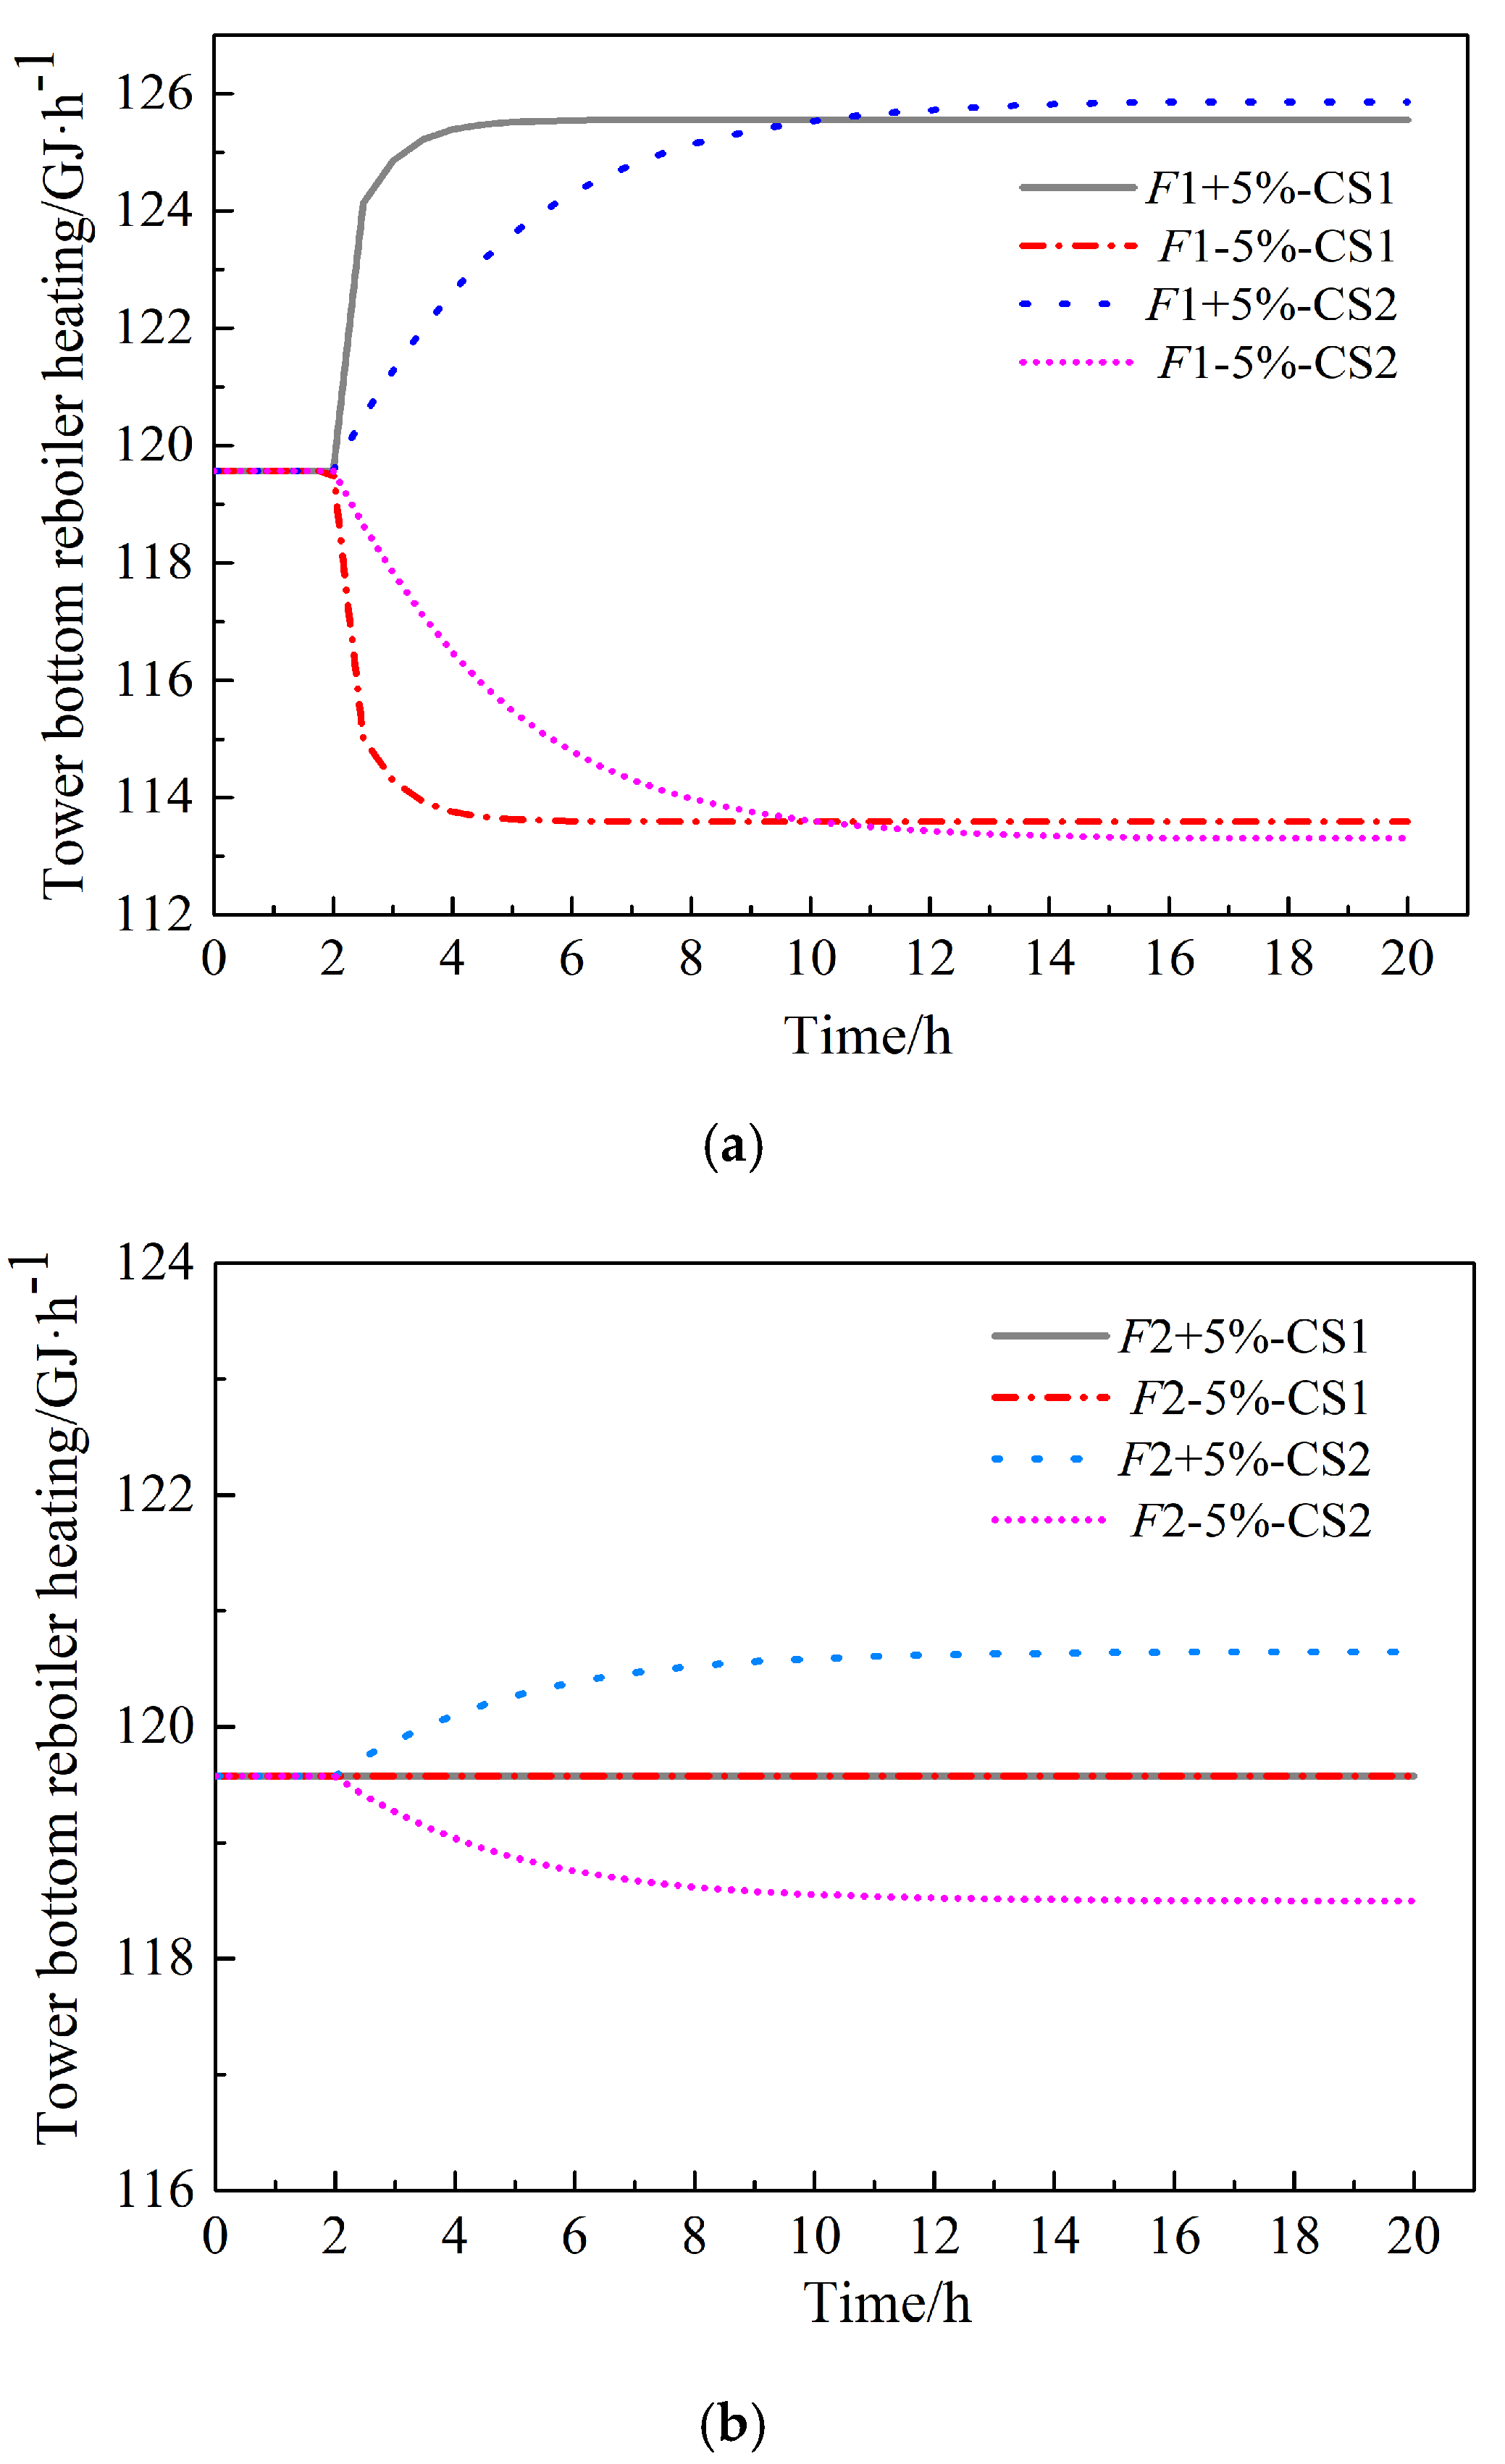
3.3. Dynamic Sensitivity Analysis

Dynamic sensitivity analysis reflects the time-dependent relationship between operational variables and target variables better than steady-state sensitivity analysis. According to the results of the steady-state sensitivity analysis [24], besides the great influence of the reflux flow rate, the MA mass fraction and reflux temperature of the reflux also exerted great influence on the temperature in the column. Additionally, the reflux strand also played a role in ensuring the stability of the components in the column and reducing the temperature fluctuation in most of the azeotropic distillation columns. As a result, the dynamic characteristics of the HAc dehydration column were analyzed from the mass flow rate, the MA mass fraction, and the temperature of the reflux.
As presented in Figure 5, when changes occurred in the mass flow rate of R1, the mass fraction of MA in R1, and the temperature of R1, the temperature of the sensitive plate responded quickly to reach a stable state. Through comparisons between Figure 5a,b it was demonstrated that the temperature of the sensitive plate in Figure 5b increased more and decreased less, which was not conducive to the control of the situation when the mass fraction of the MA decreased. In comparisons between Figure 5a,c, the mass flow rate and temperature were found to have great influence on the temperature of the sensitive plate. Nevertheless, considering the frequent flow changes, the cheaper price, and the smaller delay of the flow controller in the process, it was more appropriate to control the temperature of the sensitive plate with the mass flow rate of the R1 stream strand.
After adding the controller of the reflux R1 mass flow to control the sensitive plate temperature, the dynamic characteristics of the HAc products in the bottom of the HAc dehydration column were analyzed by the remaining two key parameters of the R1 stream strand, as seen in Figure 6, to judge the performance of the new temperature controller in dealing with disturbances. When the MA mass fraction and the temperature of reflux R1 were disturbed, the HAc concentration at the bottom of the column reached a new steady-state, failing to maintain the required concentration.
During the HAc dehydration process, there were certain requirements for the HAc concentration at the bottom of the column. In practice, the key parameters of the reflux R1 changed within a certain range. It was necessary to add other controller components to maintain the concentration at the bottom of the column. The component controller was the most direct component of the controller to affect the HAc concentration at the bottom of the column and the reboiler was closest to the bottom of the column and directly affected the temperature, thus affecting the component distribution. Therefore, a group of component controllers (the heat duty of the reboiler and the concentration of HAc at the bottom) was added; this is discussed later in control strategy 2.
As shown in Figure 7, the dynamic characteristics of the HAc mass flow in B1 were analyzed by the MA mass fraction and the temperature of R1 after adding the temperature and component controllers. Obviously, when the two key parameters of R1 were disturbed, the HAc mass flow rate of B1 responded rapidly and the value was quickly adjusted to be near the steady mass flow rate before the addition of the controllers. Therefore, through the above analysis of the dynamic characteristic, the two new controllers were found to play a significant role in maintaining the bottom product requirements when disturbing the key parameters of the reflux R1.
During actual production, if the concentration of HAc in the column bottom was fine-tuned according to different requirements or load changes, the HAc product in the column bottom could be judged in terms of whether it satisfied the new specifications and standards under the controller provided. As shown in Figure 8, the dynamic characteristics of the HAc concentration in the bottom B1 after adding the controller were analyzed. Figure 8a demonstrates that the HAc concentration of B1 responded quickly to the new concentration requirements. Figure 8b shows that HAc mass flow of B1 returned to the previous steady mass flow after a rapid response, ensuring the stable production of products under the new specifications and standards.

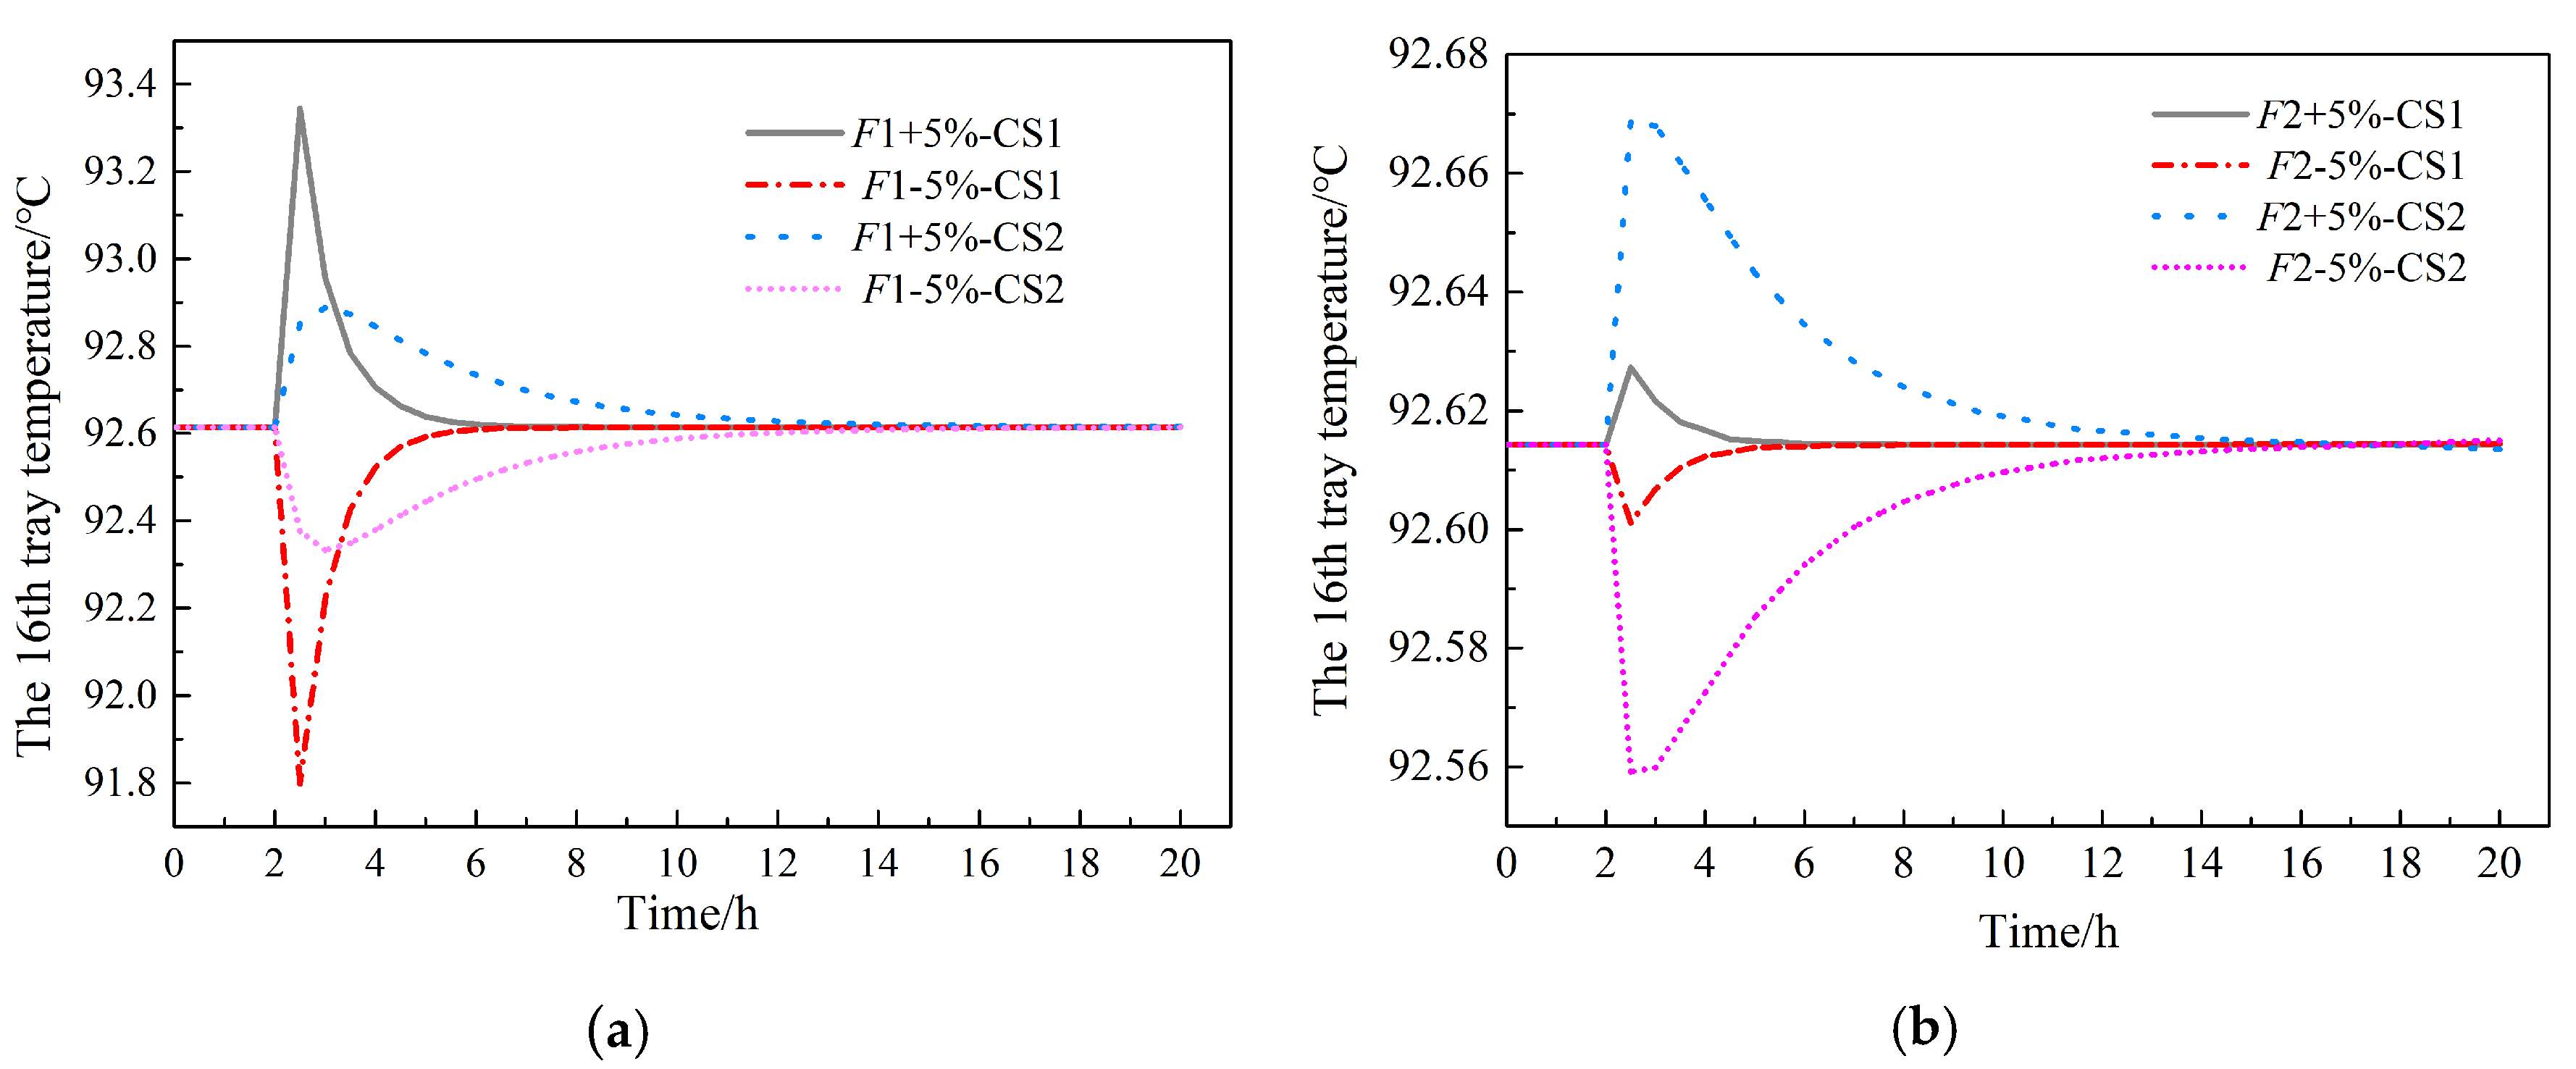
3.4. Analysis of Control Strategies

The dynamic sensitivity analysis results were used as a reference to design the strategies, as shown in Figure 9. The HAc dehydration column used the reflux R1 to control the temperature of the sensitive plate. For control strategy 1 (CS1), considering that the water content in F1 was the highest, it exerted a great influence on the heating capacity of the column. Therefore, a proportional controller R_ratio1 was added to the heating amount of the F1 feed and the column reboiler [35]. In terms of control strategy 2 (CS2), the component controller was introduced to control the HAc mass fraction of the bottom B1 using the heat of the reactor reboiler. For the two strategies, the other controllers remained the same, flow controllers were added to the remaining streams, a pressure controller was added to the top of the column, and a liquid level controller was added to the bottom.
In the control system of the present study, the parameters of the control scheme were tuned using the relay-feedback test and determined according the Tyreus–Luyben tuning method [36]. The controller gain (Kc) at the top of the column due to the pressure controller was given a default value of 20%, the integration time was 12 min, and the column’s liquid level controller Kc was given a default value of 10% because only the proportional control was used. Furthermore, the integration time was set to a larger value of 9999 min and the gain in Kc of the flow controller and the integration time were uniformly set to 1% and 20 min, respectively. The temperature of the sensitive plate was controlled using the R1 reflow and the dead time D1 was set to 1 min. The heat of the column reboiler controlled the HAc concentration at the bottom of the column. The lag time of the component controller was longer and the dead time D2 was set to 3 min.
On the basis of the above two control strategies, after setting appropriate parameters, more appropriate control strategies under different requirements were obtained by comparing the dynamic response analysis results. Because the feeding positions of F2, F3, and F4 in the HAc dehydration column remained the same and the temperature, mass flow rate, and component contents were relatively similar, F2 was chosen as the research focus in the dynamic response analysis. The corresponding dynamic response analysis was carried out in combination with F1. The flow rate of F1 was several times that of the other feed streams and there were large flow fluctuations when small disturbances occurred. In this paper, the mass flow rates of F1 and F2 feed were disturbed by ±5% mass flow after two hours of steady-state operation.
According to Figure 10, when the mass flow rate of the feed stream F1 and F2 was changed, the influence of F1 on temperature was greater than that of F2. Although the F1 temperature was lower than the F2 stream, the F1 feed position was closer to the sensitive plate position. When the mass flow rates of F1 and F2 increased, the sensitive plate temperature rose and then returned to the steady-state as it brought in more water and MA impurities, thereby causing the heat duty to increase. Therefore, the temperature of the tray rose and the valve opening degree was reduced to the flow rate, thereby reducing the heat duty. Thus, the temperature was lower. When the mass flow rate of the feed stream F1 increased, the corresponding magnitude of the sensitive plate temperature in CS1 would be larger than that of CS2, because the R_ratio1 proportional controller caused the heaty duty of the bottom of the column’s reboiler to increase correspondingly. Consequently, the heaty duty had a great influence on the temperature inside the column. When the mass flow rate of the feed stream F2 was changed ±5%, the temperature of the sensitive plate appeared to be within ±0.03 °C. The temperature of the sensitive plate quickly returned to steady-state under the two control strategies, thus, both control strategies had good control over the effects on the disturbance of the mass flow of F2.
Figure 11 demonstrates that when the mass flow rates of feed streams F1 and F2 changed, the influence of F1 on the HAc concentration at the bottom was larger than F2 due to the larger flow rate, increased water content, and lower temperature. When the mass flow rate of F1 increased, the concentration of HAc in CS1 first increased and then decreased to a lower level for the increased heat duty of the reboiler, thereby causing the concentration of the HAc to increase. Afterward, the adjustment of the valve opening reduced, thus reducing the heat. However, with the increasing water content, the concentration of the HAc at the bottom of the column decreased to a lower level. In CS2, the concentration of the HAc at the bottom of the column first decreased and then increased to the previous concentration due to the increase in the amount of water brought in by F1 and the decrease in the concentration of the HAc at the bottom of the column due to the lower temperature. Subsequently, the HAc concentration at the bottom of the returned to the target concentration by adjusting the opening of the valve and coordinating the concentration controller. When F2 increased, the HAc concentration in CS1 first reduced and then stabilized. Due to the lack of a proportional controller and the increase in water content, CS2 quickly achieved the desired HAc concentration by adjusting the heating capacity of the reactor through a concentration controller. Although both control strategies were able to achieve steady-state, CS2 better maintained the concentration of HAc at the bottom of the column.
As seen from Figure 12, since the HAc concentration at the top of the column itself was very low, the mass flow rate of the varying amplitude reaction was very small, and the two control strategies for the HAc concentration at the top of the column were stable with fast responses and were able to return to the concentrations of the target conditions quickly.
As seen from Figure 13, the CS1 strategy had a dynamic response to the heat of the reactor reboiler when the flow rate of F1 was disturbed. It converged quickly and stably because the reactor only added a proportional controller to the feed stream F1 with a large water content. When the flow rate of F1 increased, the heating capacity of the reactor first increased and then stabilized, because the heating capacity increased with the increase in feed water content and MA impurities in order to achieve the target concentration at the bottom of the column. When the feed flow disturbance occurred in CS2, there was a dynamic response of the heat duty, which converged quickly and displayed extremely good control strategy performance.

4. Conclusions

In this paper, based on a dynamic model of a solvent dehydration column of a PTA plant, dynamic sensitivity analysis of the column was carried out. Based on the analysis results, predictions regarding the dynamic performance and control strategies of the column were obtained. Two control strategies were proposed. Under the disturbance of mass flow of feed F1 or F2, the performances of the two strategies were analyzed and compared. Through comparative analysis, both strategies were proven to control the HAc dehydration column well. CS2 had a better performance than CS1 in terms of controlling the HAc content at the bottom of the column. When disturbance occurred in the feed, the corresponding treatment response quickly appeared, and the mass fraction of the target operating condition was restored. However, considering the expensive price of the component analysis instruments and the long sampling period, the design scheme of CS1 was considered to be preferable under the premise that both strategies satisfied the control requirements.

Author Contributions

Conceptualization, X.H.; Data curation, X.H. and J.W.; Formal analysis, X.H.; Funding acquisition, Z.L.; Investigation, X.H., J.W. and Z.L. All authors have read and agreed to the published version of the manuscript.

Funding

This work was supported financially by Shanghai Rising-Star Program (19QB1401700) and Shanghai Sailing Program (17YF1413100).

Conflicts of Interest

The authors declare no conflict of interest.

Abbreviations

FFeed mass flow: kg/h
hMoore han
LjLiquid phase mass flow at stage j, kg/h
MjMass flow at level j, kg/h
S L j Liquid phase production, kg/h
S V j Gas phase production, kg/h
QjHeat transfer with the outside world, kJ/h
VjGas phase mass flow at stage j, kg/h
Xi,jLiquid phase mass fraction of component i at level j
Yi,jGas phase mass fraction of component i at level j
Zi,jMolar fraction of component i feed at stage j
Upper corner
α, βRepresenting two liquid phases
Lower corner
iComponent
jTray level

References

  1. Xing, J.L.; Zhao, J.; Jiang, P.F. Multivariable predictive control of PX oxidation reaction process. CIESC J. 2012, 63, 2726–2732. [Google Scholar]
  2. Huang, D.W.; Li, S.J. Multi-stable study on heterogeneous azeotropic distillation of acetic acid dehydration. Comput. Appl. Chem. 2010, 27, 1395–1398. [Google Scholar]
  3. Widagdo, S.; Seider, W.D. Journal review. Azeotropic distillation. AIChE J. 1996, 42, 96–130. [Google Scholar] [CrossRef]
  4. Hu, S.; Zhang, B.J.; She, Z.H. Application and research progress of azeotropic distillation in chemical production. Chem. Ind. Eng. Prog. 2010, 29, 2207–2219. [Google Scholar]
  5. Kurooka, T.; Yamashita, Y.; Nishitani, H.; Hashimoto, Y.; Yoshida, M.; Numata, M. Dynamic simulation and nonlinear control system design of a heterogeneous azeotropic distillation column. Comput. Chem. Eng. 2000, 24, 887–892. [Google Scholar] [CrossRef]
  6. Luyben, W.L. Control of the Heterogeneous Azeotropic n-Butanol/Water Distillation System. Energy Fuel 2008, 22, 4249–4258. [Google Scholar] [CrossRef]
  7. Wasylkiewicz, S.K.; Kobylka, L.C.; Castillo, F.J.L. Optimal design of complex azeotropic distillation columns. Chem. Eng. J. 2000, 79, 219–227. [Google Scholar] [CrossRef]
  8. Xing, J.L.; Huang, X.H.; Yuan, W.K. Process Simulation of Industrial Acetic Acid Dehydration System via Heterogeneous Azeotropic Distillation. CIESC J. 2012, 63, 2681–2687. [Google Scholar]
  9. Chien, I.L.; Chen, W.H.; Chang, T.S. Operation and decoupling control of a heterogeneous azeotropic distillatin column. Comput. Chem. Eng. 2000, 24, 893–899. [Google Scholar] [CrossRef]
  10. Wang, L.; Xi, L. Thermodynamic analysis and azeotropic distillation simulation for acetic acid-water-butyl acetate system. J. Chem. Ind. Eng. 2005, 56, 1260–1266. [Google Scholar]
  11. Pham, H.N.; Doherty, M.F. Design and Synthesis of Azeotropic Distillation: II. Residue Curve Maps. Chem. Eng. Sci. 1990, 45, 1837–1843. [Google Scholar] [CrossRef]
  12. Foucher, E.R.; Doherty, M.F.; Malone, M.F. Automatic screening of entrainers for homogeneous azeotropic distillation. Ind. Eng. Chem. Res. 1991, 30, 760–772. [Google Scholar] [CrossRef]
  13. Tripodi, A.; Compagnoni, M.; Ramis, G.; Rossetti, I. Pressure-swing or extraction-distillation for the recovery of pure acetonitrile from ethanol ammoxidation process: A comparison of efficiency and cost. Chem. Eng. Res. Des. 2017, 127, 92–102. [Google Scholar] [CrossRef]
  14. Tripodi, A.; Manzini, D.; Compagnoni, M.; Ramis, G.; Rossetti, I. Alternative integrated distillation strategies for the purification of acetonitrile from ethanol ammoxidation. J. Ind. Eng. Chem. 2018, 59, 35–49. [Google Scholar] [CrossRef]
  15. Chengfei, L. Dynamic Simulation and Analysis of Industrial Purified Terephthalic Acid Solvent Dehydration Process. Chin. J. Chem. Eng. 2011, 19, 89–96. [Google Scholar]
  16. Laroche, L.; Bekiaris, N.; Andersen, H.W.; Morari, M. The curious behavior of homogeneous azeotropic distillation—Implications for entrainer selection. AIChE J. 1992, 38, 1309–1328. [Google Scholar] [CrossRef]
  17. Skouras, S.; Kiva, V.; Skogestad, S. Feasible separations and entrainer selection rules for heteroazeotropic batch distillation. Chem. Eng. Sci. 2005, 60, 2895–2909. [Google Scholar] [CrossRef]
  18. Rashid, M.M.; Mhaskar, P.; Swartz, C.L.E. Handling multi-rate and missing data in variable duration economic model predictive control of batch processes. AIChE J. 2017, 63, 2705–2718. [Google Scholar] [CrossRef]
  19. Rashid, M.M.; Patel, N.; Mhaskar, P.; Swartz, C.L. Handling sensor faults in economic model predictive control of batch processes. AIChE J. 2019, 65, 617–628. [Google Scholar] [CrossRef]
  20. Zeng, G.B.; Li, S.J.; Qian, F. Dynamic simulation and control of acetic acid dehydration system. Comput. Appl. Chem. 2008, 25, 533–536. [Google Scholar]
  21. Han, K.; Zhao, J.; Zhu, Y.C. An MPC controller for online identification of disturbance model and its application in solvent dehydration column device. CIESC J. 2008, 59, 1657–1664. [Google Scholar]
  22. Wei, Q.Q.; Ma, F.Y.; Zhong, M. Study on the control of acetic acid dehydration extractive distillation. Comput. Appl. Chem. 2013, 30, 542–546. [Google Scholar]
  23. Wang, S.-J.; Huang, K. Design and control of acetic acid dehydration system via heterogeneous azeotropic distillation using p-xylene as an entrainer. Chem. Eng. Process. Process. Intensif. 2012, 60, 65–76. [Google Scholar] [CrossRef]
  24. Huang, X.; Li, Z.; Tian, Y. Process optimization of an industrial acetic acid dehydration progress via heterogeneous azeotropic distillation. Chin. J. Chem. Eng. 2018, 26, 1631–1643. [Google Scholar] [CrossRef]
  25. Huang, X.; Zhong, W.; Peng, C.; Qian, F. Isobaric Vapor-Liquid Equilibrium of Binary Systems: P-Xylene + (Acetic Acid, Methyl Acetate and n-Propyl Acetate) and Methyl Acetate + n-Propyl Acetate in an Acetic Acid Dehydration Process. Chin. J. Chem. Eng. 2013, 21, 171–176. [Google Scholar] [CrossRef]
  26. Huang, X.; Zhong, W.; Du, W.; Qian, F. Thermodynamic Analysis and Process Simulation of an Industrial Acetic Acid Dehydration System via Heterogeneous Azeotropic Distillation. Ind. Eng. Chem. Res. 2013, 52, 2944–2957. [Google Scholar] [CrossRef]
  27. Simonetty, J.; Yee, D.; Tassios, D. Prediction and correlation of liquid-liquid equilibriums. Ind. Eng. Chem. Process. Des. Dev. 1982, 21, 174–180. [Google Scholar] [CrossRef]
  28. Block, U.; Hegner, B. Development and application of a simulation model for three-phase distillation. AIChE J. 1976, 22, 582–589. [Google Scholar] [CrossRef]
  29. Zhou, S.H.; Tang, L.S. A Double Iterative Method for Solving the MESH Equations of Distillation Column. CIESC J. 1992, 43, 705–711. [Google Scholar]
  30. Goldstein, R.P.; Stanfield, R.B. Flexible Method for the Solution of Distillation Design Problems Using the Newton-Raphson Technique. Ind. Eng. Chem. Process. Des. Dev. 1970, 9, 78–84. [Google Scholar] [CrossRef]
  31. Naphtali, L.M.; Sandholm, D.P. Multicomponent separation calculations by linearization. AIChE J. 1971, 17, 148–153. [Google Scholar] [CrossRef]
  32. Shang, C.J. Study on Modeling and Optimization of Solvent Dehydration Column. Master’s Thesis, Zhejiang University, Zhejiang, China, 2003. [Google Scholar]
  33. Qiu, G.Y.; Ding, F.; Li, Q.S. Research and application of guided sieve column in acetic acid distillation. Chem. Ind. Eng. Prog. 2005, 24, 118–120. [Google Scholar]
  34. Liu, L.X.; Chen, M.Q.; Liu, Y.L. Study on the control of azeotropic dividing bulkhead columns and extractive dividing bulkhead columns. Chem. Ind. Eng. Prog. 2017, 36, 756–765. [Google Scholar]
  35. Li, Q.; Guan, W.; Wang, L.; Wan, H.; Guan, G. Dynamic Simulation and Control of a Complete Industrial Acetic Acid Solvent Dehydration System in Purified Terephthalic Acid Production. Ind. Eng. Chem. Res. 2015, 54, 11330–11343. [Google Scholar] [CrossRef]
  36. Luyben, W.; Lu, P. Application of Aspen Simulation Software in Distillation Design and Control; Shanghai East China University of Science and Technology Press: Shanghai, China, 2015; pp. 98–111. [Google Scholar]
Figure 1. Acetate dehydration steady-state process flow.
Processes 08 00125 g001
Figure 2. Temperature and composition distribution during the steady-state of C-1 and C-3.
Processes 08 00125 g002aProcesses 08 00125 g002b
Figure 3. Three-phase balance model of the vapor–liquid–liquid rectification tray structure.
Processes 08 00125 g003
Figure 4. Sensitivity analysis of the R1 reflux in the C-1 column.
Processes 08 00125 g004
Figure 5. Dynamic sensitivity analysis of the R1 strand on the temperature of sensitive plate. (a) Dynamic sensitivity analysis of the R1 mass flow. (b) Sensitivity analysis of the MA mass fraction in R1. (c) Sensitivity analysis of the R1 temperature.
Processes 08 00125 g005
Figure 6. Sensitivity analysis of adding temperature controller. (a) Dynamic sensitivity analysis of the MA mass fraction in the R1 to the HAc mass fraction at the bottom of the column. (b) Dynamic sensitivity of temperature in the R1 to the HAc mass fraction at the bottom of the column.
Processes 08 00125 g006
Figure 7. Sensitivity analysis of the added temperature and component controllers. (a) Dynamic sensitivity analysis of the MA mass fraction in the R1 to the HAc mass fraction at the bottom of the column. (b) Dynamic sensitivity of the temperature in the R1 to the HAc mass fraction at the bottom of the column.
Processes 08 00125 g007
Figure 8. Sensitivity analysis of the HAc concentration in the bottom of the column after adding temperature and component controllers. (a) Sensitivity analysis of the HAc concentration at the bottom of the column. (b) Sensitivity analysis of the HAc mass flow at the bottom of the column.
Processes 08 00125 g008
Figure 9. Control strategies for the HAc dehydration system. (a) Control strategy 1 and (b) control strategy 2.
Processes 08 00125 g009
Figure 10. The control responses of CS1 and CS2 on the temperature of the 16th try. (a) Responses to disturbance in feed F1 and (b) responses to disturbance in feed F2.
Processes 08 00125 g010
Figure 11. The control responses of CS1 and CS2 to the mass fraction on the HAc at the bottom. (a) Responses to disturbance in feed F1 and (b) responses to disturbance in feed F2.
Processes 08 00125 g011
Figure 12. The control responses of the CS1 and CS2 strategies on the mass fraction of the HAc at the top. (a) Responses to disturbance in feed F1 and (b) responses to disturbance in feed F2.
Processes 08 00125 g012
Figure 13. The control response of CS1 CS2 to the heating of the column boiler reboiler. (a) Response to disturbance in feed F1 and (b) response to disturbance in feed F2.
Processes 08 00125 g013
Table 1. C-1 column discharge results in the HAc dehydration process under actual overload conditions.
EquipmentOutlet StreamTemperaturePressureFlowHAcWaterNPAPXMA
°CMPaKg·h−1wt%wt%wt%wt%wt%
C-1S1105.20.123820068.326.640.50.6
D184.60.12251,181014.9730.112
B1117.20.13136,14293.66.4000
C-3S381.20.1220,500-29.162.4-8.5
D358.30.113000-3.80-96.2
B3107.20.1333,900-10-0
Table 2. Dynamic mathematical model of the distillation column.
Equilibrium Equation
M d ( M j X i , j ) d t = L j 1 x i , j 1 + V j + 1 y i , j + 1 ( L j + S L j ) x i , j ( V j + S V j ) y i , j + F j z i , j
E y i , j = K i , j x i , j * = K i , j x i , j ( 1 E M i , j ) x i , j 1 E M i , j , E M i , j = x i , j x i , j 1 x i , j * x i , j 1
S i = 1 5 x i , j α = 1 i = 1 5 x i , j β = 1 i = 1 5 y i , j = 1
H d ( M j h j ) d t = M j d h j d t + h j d M j d t = L j 1 h j 1 + V j + 1 h j + 1 ( L j + S L j ) h j ( V j + S V j ) H j + F j h F , j + Q j

