Article

Screening of Amino Acids and Surfactant as Hydrate Promoter for CO2 Capture from Flue Gas

by
Jyoti Shanker Pandey
*,
Yousef Jouljamal Daas
and
Nicolas von Solms
*
Center for Energy Resource Engineering (CERE), Department of Chemical Engineering, Technical University of Denmark, 2800 Lyngby, Denmark
*
Authors to whom correspondence should be addressed.
Processes 2020, 8(1), 124; https://doi.org/10.3390/pr8010124
Submission received: 7 November 2019 / Revised: 8 January 2020 / Accepted: 10 January 2020 / Published: 19 January 2020

Abstract

:
In this study, the kinetics of flue gas hydrate formation in bulk water in the presence of selected amino acids and surfactants are investigated. Four amino acids (3000 ppm) are selected based on different hydropathy index. Constant-ramping and isothermal experiments at 120 bar pressure and 1 °C temperature are carried out to compare their hydrate promotion capabilities with surfactant sodium dodecyl sulfate (SDS) (500–3000 ppm) and water. Based on experimental results, we report the correlation between hydrate promotion capability of amino acids and their hydrophobicity. Hydrophobic amino acids show stronger flue gas hydrate promotion capability than water and hydrophilic amino acids. We discuss the controlling mechanisms to differentiate between promoters and inhibitors’ roles among the amino acids. Between 2000–3000 ppm concentrations, hydrophobic amino acids have near similar promotion capabilities as SDS. This research highlights the potential use of amino acids as promoters or inhibitors for various applications.

1. Introduction

To reduce CO2 emissions into the atmosphere, the scientific focus has been on the advancement of CO2 capture, separation, and storage technologies from pre-combustion (CO2/H2) and post-combustion (CO2/N2) feed gases [1]. Post-combustion CO2 released from thermal power plants, cement plants, steel plants, coal-based chemical plants has been considered as a significant factor behind the increase in the greenhouse effect [2]. Gas hydrate-based CO2 capture, separation, and storage has been proposed for its potential as an eco-friendly and less costly technology, and it could provide an innovative solution to capture CO2 [3,4]. Another advantage of using a hydrate based technique to separate CO2 from flue gas is the advantage of using hydrate formation for separating CO2 is due to less energy consumption than traditional means [5]. Hydrate formation is divided into three main steps, which include the dissolution of CO2-rich gas into liquid phase, hydrate nucleation, and hydrate growth phase. While the nucleation stage indicates the supersaturation of the liquid phase by CO2-rich gas, the growth phase is responsible for gas capture into the hydrate phase. Linga et al. [6] have proposed a multistage hydrate based CO2 separation process from a CO2-rich gas system and showed 36–42% CO2 recovery in the first step, in the form of hydrate using pure water and a CO2/N2 system.
The post-combustion CO2-rich gas system includes 15–25% CO2 in a CO2/N2 gas mixture [6,7] and including impurities, such as SO2, H2S, and fly ash. Thermodynamic studies confirm that such a CO2/N2 system would require high compression and high energy consumption during the hydrate-based gas separation process, which makes it costly to adopt at a commercial scale. For commercialization, chemicals known as promoters are starting to become considered for CO2 capture, separation, and storage applications, due to their role in lowering formation pressure, formation time, enhanced gas uptake, and improvement in kinetics. Dasthi et al. [3] have reviewed the role of different promoters in hydrate-based CO2 capture.
Thermodynamic promoters such as tetrahydrofuran (THF) [8] and cyclopentane [9] have been successfully tested previously for CO2 capture and separation from a gas mixture at lower formation pressure. Kinetic hydrate promoters, such as the surfactant sodium dodecyl sulfate (SDS), are known to improve formation both individually and along with other promoters, such as THF [10] and TBAB [11]. Other advantages include increased storage capacity and low dosage. Many theories have been proposed to explain the effect of SDS on the growth mechanism, and a change in interfacial properties of the solution in the presence of surfactant has been widely accepted as a governing mechanism. A review of all possible mechanisms during surfactant-based gas hydrate formation can be found from Yanhe et al. [12].
Few studies on kinetics have been done to evaluate and compare the promotion capability of surfactants for CO2 capture, separation, and storage from a CO2-rich feed gas mixture [7,13,14]. Kumar et al. [14] have studied CO2 capture from 15–20% CO2 in a CO2/N2 mixture using liquid water and found 55–57% CO2 recovery in hydrate at 7.7 MPa and 0.6 °C. In the presence of impurities, such as SO2, it was found to lead to a higher temperature, lower formation pressure, and faster nucleation during CO2 hydrate formation from the CO2/N2 feed gas. In another study, it was found that fly ash impurities do not affect flue gas hydrate thermodynamics but enhance the formation kinetics, including CO2 recovery [15]. Several reactors configurations, including fixed bed or stirred reactor, have been used to conduct laboratory-scale CO2 hydrate formation and capture [4]. CO2 capture from CO2-rich gas mixtures is also studied in the context of methane production from gas hydrate reservoirs [16]. Existing promoters have many disadvantages. For example, thermodynamic promoters occupy some of the cages within the hydrate cage, which leads to lower gas uptake within the structure. Many are derivative of petrochemical feedstock, thus not environmentally friendly. Kinetic promoters, e.g., surfactants, are also considered harmful to the environment and difficult to naturally degrade, as evaluated by Scott et al. [17]. SDS also form foam during the hydrate dissociation that may cause blockage and lead to additional maintenance at the industrial scale. Hence, there is a need for green, non-toxic chemicals for CO2 hydrate formation with a high formation rate and high gas uptake.
Amino acids are being seen as an attractive chemical for CO2 capture applications via hydrate formation because of their ability to mix with water through hydrogen bonding and because of their nontoxic nature, nonvolatility, and eco-friendliness. The absence of foam in the presence of amino acids during degassing is also an added advantage, and there would be no emissions risk from pilot plants compared to amine-based technologies. Initial research indicates that the amino acid mechanism to enhance hydrate formation is different from surfactants, and their performance in terms of flue gas hydrate promotion, CO2 recovery, and hydrate stability is mostly unstudied.
Different conclusions are reported in the literature about the role of amino acids at different capacities, such as kinetic hydrate inhibition, thermodynamic hydrate inhibitor, and kinetics hydrate promotion. However, there is no reported evidence of classifying amino acids as a thermodynamic hydrate promoter. Sa et al. [18] reported that amino acids exhibit substantial electric charges/electrostatic interactions with water as zwitterions and interact with water molecules through strong hydrogen bonding, due to their hydrophilic nature, which qualifies them as suitable inhibitors. Sa et al. [19,20] evaluated many amino acids and concluded that amino acids’ thermodynamic inhibition is more visible at higher amino acid concentrations. Sa et al. [21] also categorizes a few amino acids as kinetic hydrate inhibitors and found that inhibition decreases with an increase in hydrophobicity. The inhibition effect also depends on the history of water, concentration of the additive, length, and nature of the side chain of the amino acid. Water perturbation is also expected to cause the inhibition effect [22]. Recent studies using L-valine and L-methionine [23] also show that hydrophilic certain amino acids enhance pure CO2 hydrate growth kinetics. However, gas hydrate-based CO2 capture using amino acids is still in the early stages of development [24]. The effect of amino acids on hydrate growth are not well understood and on the kinetics of flue gas hydrate formation is investigated, and different parameters, such as nucleation temperature, induction time, gas uptake capacity, and CO2 recovery, are calculated. Based on experimental results, amino acid performance is compared with water and SDS. This work also highlights the potential application of the rocking cell for flue gas hydrate formation and CO2 capture studies. The rocking cell is traditionally used to study the hydrate inhibitors to determine onset time and onset temperature, using constant temperature and constant ramping techniques. Recently, our group has demonstrated a successful experimental analysis for methane hydrate formation kinetics in the presence of SDS with rocking cells [25].

2. Materials and Methods

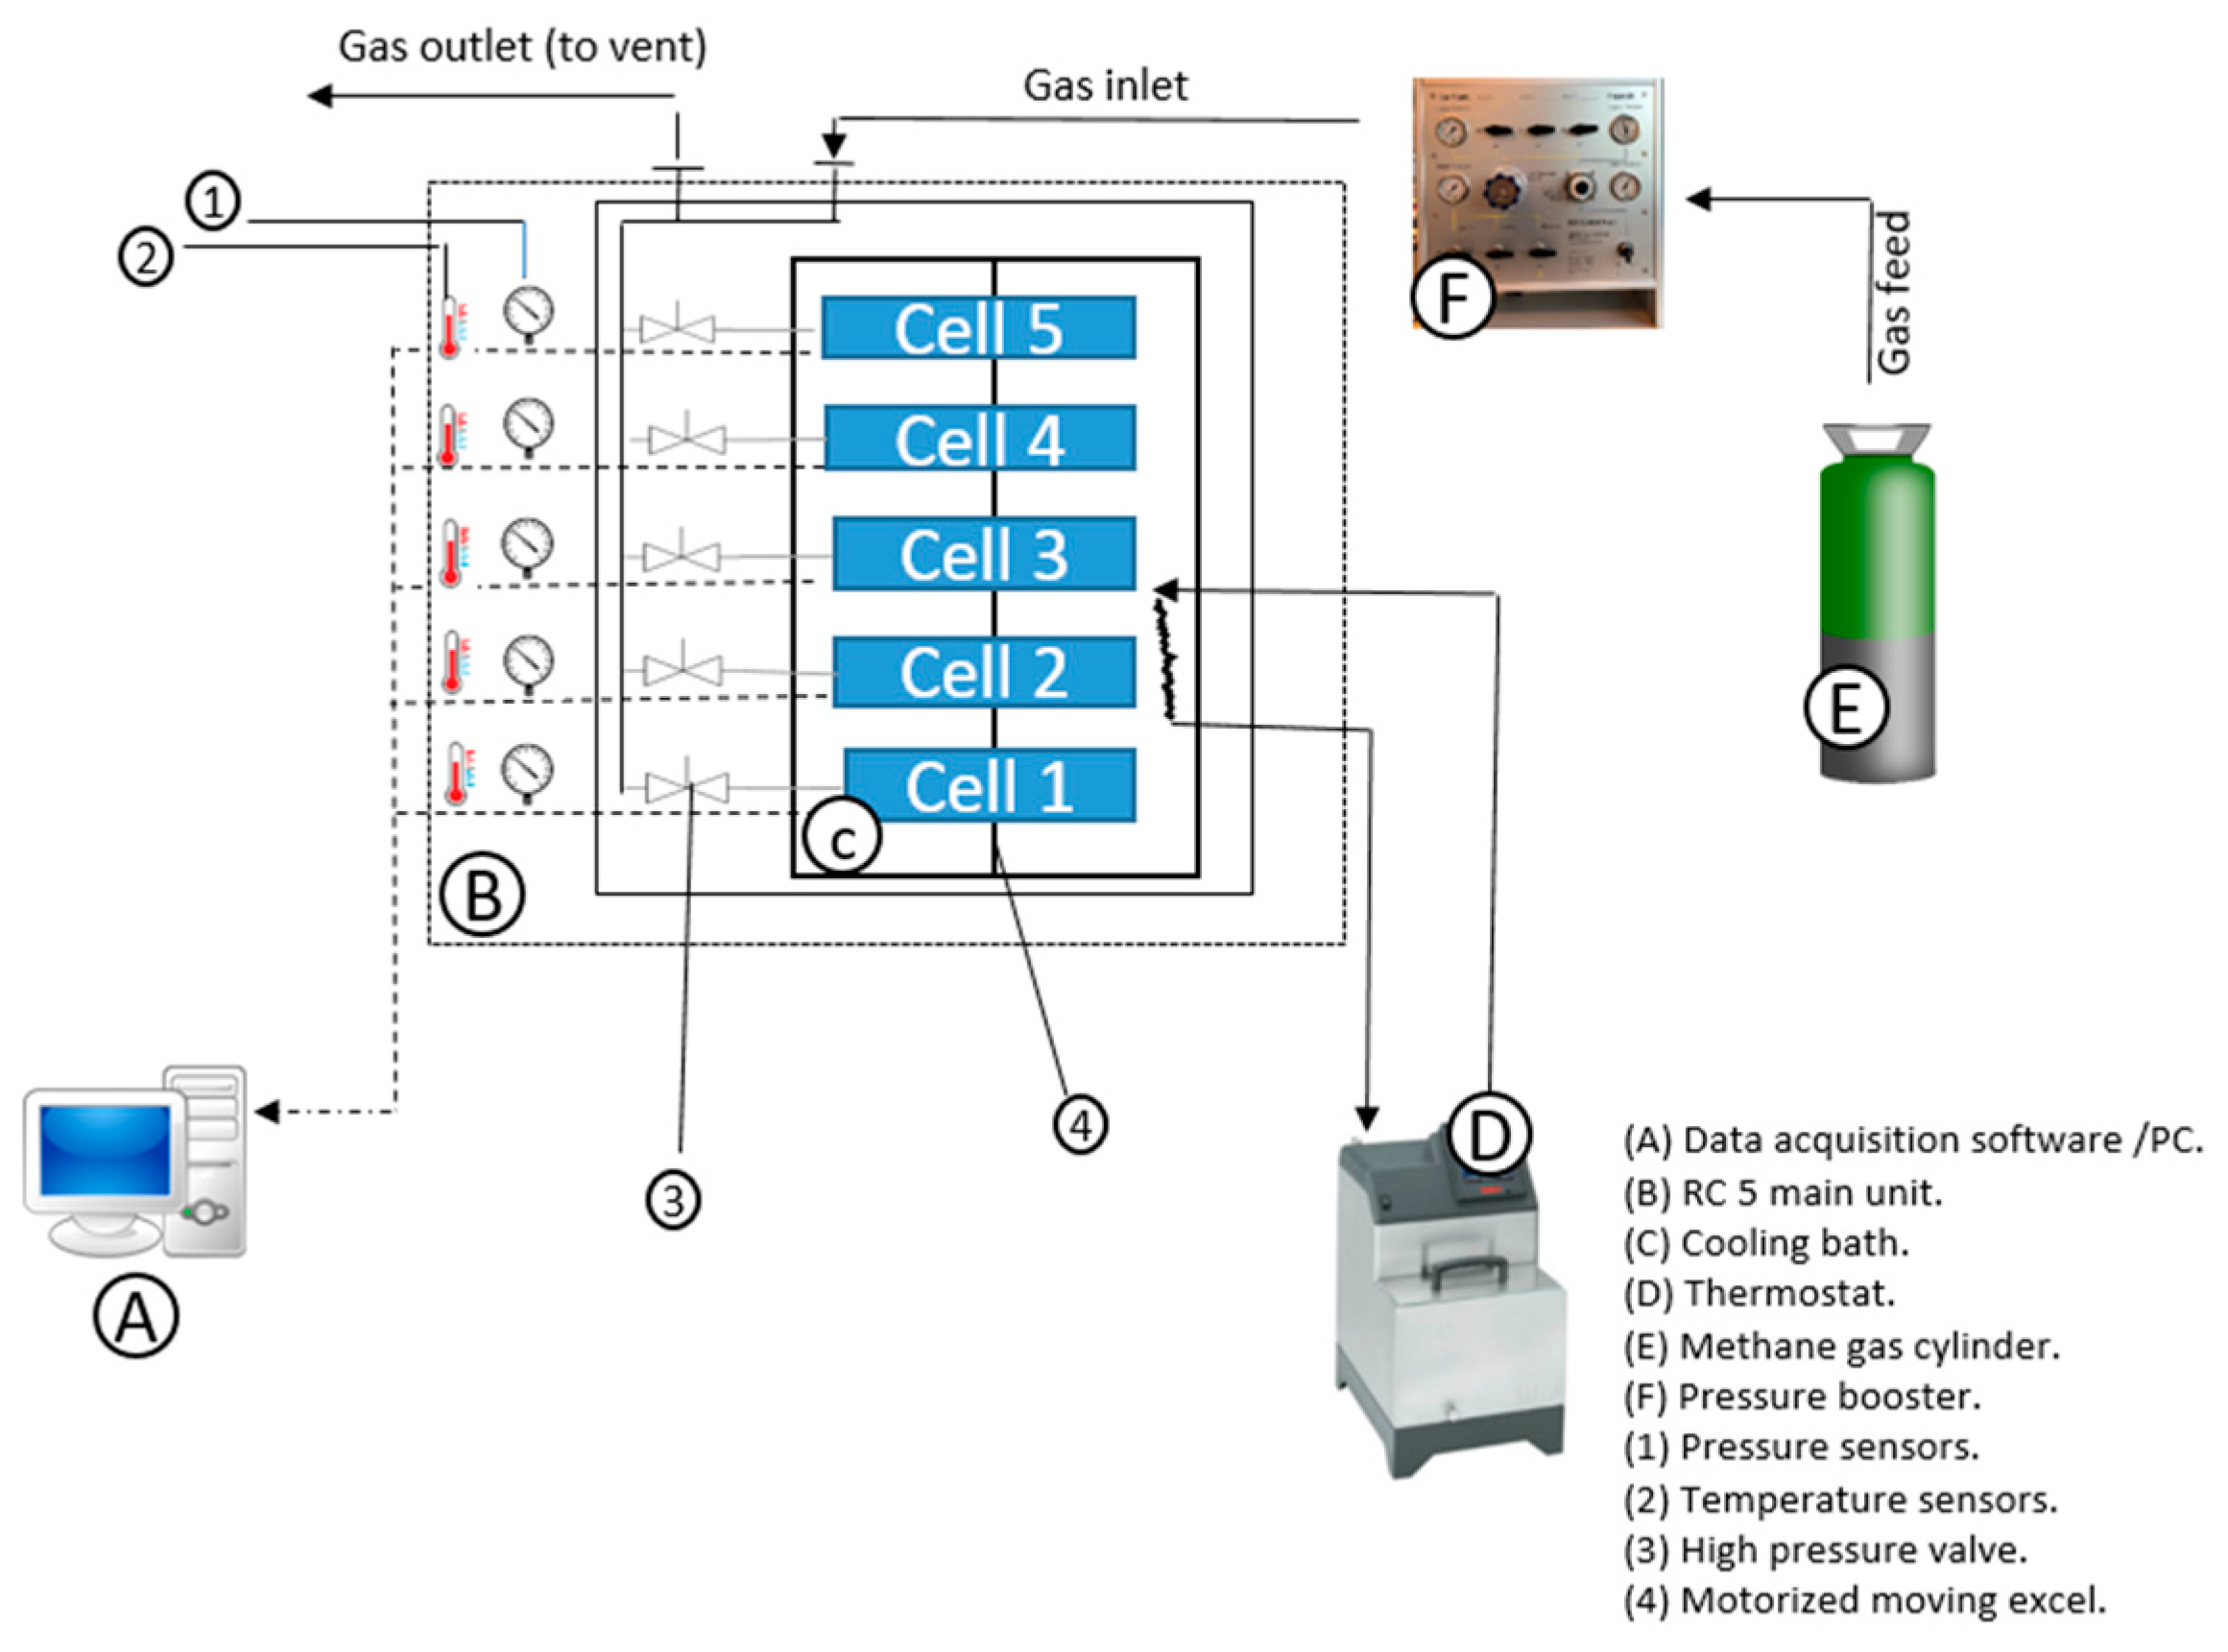
2.1. Setup and Material

In this work, flue gas hydrate formation is studied using a rocking cell setup presented in Figure 1. An analytical grade of CO2/N2 gas mixture (99.99% purity) with different CO2 (Concentration) is obtained from Air Liquide Company. A toal of 20 and 30 mole% CO2 in CO2/N2 mixture is used as feed gas to study the effect of higher CO2 concentration. The schematic layout of a rocking cell is given in Figure 1, and details can be referred elsewhere [26]. Amino acids are supplied from Sigma Aldrich. Distilled water is used to prepare all the samples to minimize the effect of the impurities in the solution phase. All amino acids used here are of 3000 ppm concentration, while SDS concentration varied from 500 ppm to 3000 ppm. The effect of different parameters using the rocking cell-based investigation is described in detail elsewhere. Most of the studies for hydrate promoters are performed in a stirred reactor and unstirred system, such as a fixed-bed reactor, water spraying reactor, gas inducing agitated reactor, etc. The rocking cell is different from the stirred cell in the agitation method. The rocking cell is a batch system and is capable of handling pressure up to 200 MPa and temperature between −10 °C to 60 °C. Within the rocking cell setup, several rocking cells can be placed in one cooling bath, thus facilitating the parallel experiments in identical pressure & temperature conditions.
According to the classification proposed by Kyte et al. [27], amino acids test into three categories: hydrophobic, polar, and charged. The structure and physical properties of four selected amino acids in the present studied are provided in Table 1.
As in the above table, L-arginine has the most negative hydropathy index (hydrophilic) among four amino acids, while L-valine has the most positive hydropathy index (hydrophobic). Hydrophobicity, acidity, and solubility of amino acid in water is strongly dependent on the side chain property. Further, hydrophobicity of the side chain and charge distribution on the amino acid molecule are considered an essential factor behind the promotion or inhibition role of amino acid during CO2 hydrate formation [28]. Hydrophilic side chains in amino acids tend to form ionized or resonance structures and induce polarization of the amino acids [21]. Understanding of the structure-property relationship is also essential; for instance, L-histidine has an imidazole side chain that can be easily protonated at lightly acidic conditions (relevant for physiology, where it is often referenced), due to a pKa value of about 6 [29]. Below this pH value, one of the lone nitrogens of the imidazole ring is protonated, and the molecule becomes positively charged. Further, it has an uneven distribution of covalent bonds, making it one of the few polar amino acids, and the ring is expected to form weak hydrogen bonding. L-arginine is another such polar molecule, whereby its guanidinium group has a high pKa of 12.48, causing it to be protonated in most situations. However, because it has a relatively extended carbon backbone, which is hydrophobic, this causes it to become somewhat amphiphilic. Thus, L-histidine and L-arginine, are both expected to cause perturbation of the liquid water structure. L-valine, instead, belongs to the larger class of non-polar amino acids, and due to its bulky isopropyl side group, the molecule is fairly hydrophobic. Likewise, L-methionine shares similar properties, albeit due to its S-methyl thioether side group.
SDS shares some features of L-arginine, such as amphiphilicity, although to a much greater extent. It has a “head” comprised of a sulfur atom surrounded by four oxygens, and one of these is negatively charged, which is balanced by a nearby sodium cation. The oxygens of the molecule’s head contribute to its hydrophilic part, while the “tail” of the molecules is a long twelve-carbon backbone, which is attributed to the hydrophobic component. Due to this amphiphilicity, it is known to form micelles [30]. There have been few studies on CO2 hydrate formation in the presence of SDS [31,32,33,34]. SDS-based CO2 hydrate growth at the gas-water interface is capillary-driven and mass transfer-driven [32]. Table 2 shows the acidic behavior of the selected amino acids. From Table 2, it can be said that L-valine and L-methionine are neutral amino acids, while L-histidine and L-arginine are basic.

2.2. Methods

A rocking cell with five identical pressure test cells (RC-5, PSL Systemtechnik, Osterode am Harz, Germany) is used to test the effect of SDS and amino acids on flue gas hydrate formation. Two different temperature programs, constant ramping and isothermal, are applied in this study. The constant ramping method, with initial operating pressure 120 bar and temperature 25 °C, is selected to determine the onset of nucleation temperature (To). Methodology to calculate To is discussed in our previous publication [25].
To calculate the induction time (to), total gas uptake, CO2 recovery, isothermal tests are carried out at constant temperature schemes (1 °C), and initial operating pressure (120 bar). Calculated temperature (To) from constant ramping experiments shows smaller deviations compared to induction time (to) measured via isothermal experiments [26]. Gas chromatography (GC) analysis is carried out at the end of the isothermal experiment to calculate the moles of CO2 and N2 remaining in the gas phase.
The constant ramping test procedure is as follows. (1) Each cell is loaded with 10 mL of solution. (2) Air inside each cell is removed via purging the cell with a 3–5 bar of flue gas. (3) The cell is pressurized with flue gas at desired pressure at 25 °C temperature and rocked at 20 rocks per min with a rocking angle of 35°. (4) The cells are cooled further from 25 °C to 15 °C in 1 h and 15 °C to 1 °C in 14 h at a rate of 1 °C/h at flow conditions. (5) The pressure and temperature of each cell and cooling bath are continuously monitored by a data acquisition (DAQ) system throughout the experiments. Table 3 below summarizes the experimental plan for the constant ramping experiment. We did not observe any hydrate formation during the constant ramping experiment for a 10% CO2/90% N2 gas mixture. Thus, the discussion is focused around 20% and 30% concentration of CO2 in the flue gas. The typical CO2 concentration in the post-combustion gas mixture (CO2/N2 mixture) generated from the power plant is around 15% and includes impurities like H2S and SO2. To study the effect of CO2 concentration on the kinetics of flue gas hydrate formation, CO2/N2 gas mixture with different CO2 concentration is selected. In our experiments, it is noted that amino acids are effective for 20% and 30% CO2 concentration. Information received using 20% and 30% CO2 could be useful to understand the hydrate formation from pure CO2 as well as other gas mixture having higher CO2 concentrations such as fuel gas.
The isothermal test procedure is as follows. (1) Each cell with a 10 mL sample volume is placed inside the bath, and air inside the cell is removed via purging the cell. (2) The temperature of the bath is reduced to an experimental pressure of 1 °C. (3) Once the desired temperature is achieved, cells are pressurized with flue gas at an initial operating pressure of 120 bar. (4) Rocking is started at 20 rocks per minute, and a rotating angle of 35°. (5) at the end of the experiment, to calculate the CO2 and N2 mole% in the remaining gas, the ventilation valve is gently opened to collect to gas sample from each cell for GC analysis. Throughout the experiment, the pressure and temperature of each cell and cooling bath is continuously monitored by DAQ. Table 4 below summarizes the experimental plan for the isothermal experiments.

2.3. Experimental Data Processing

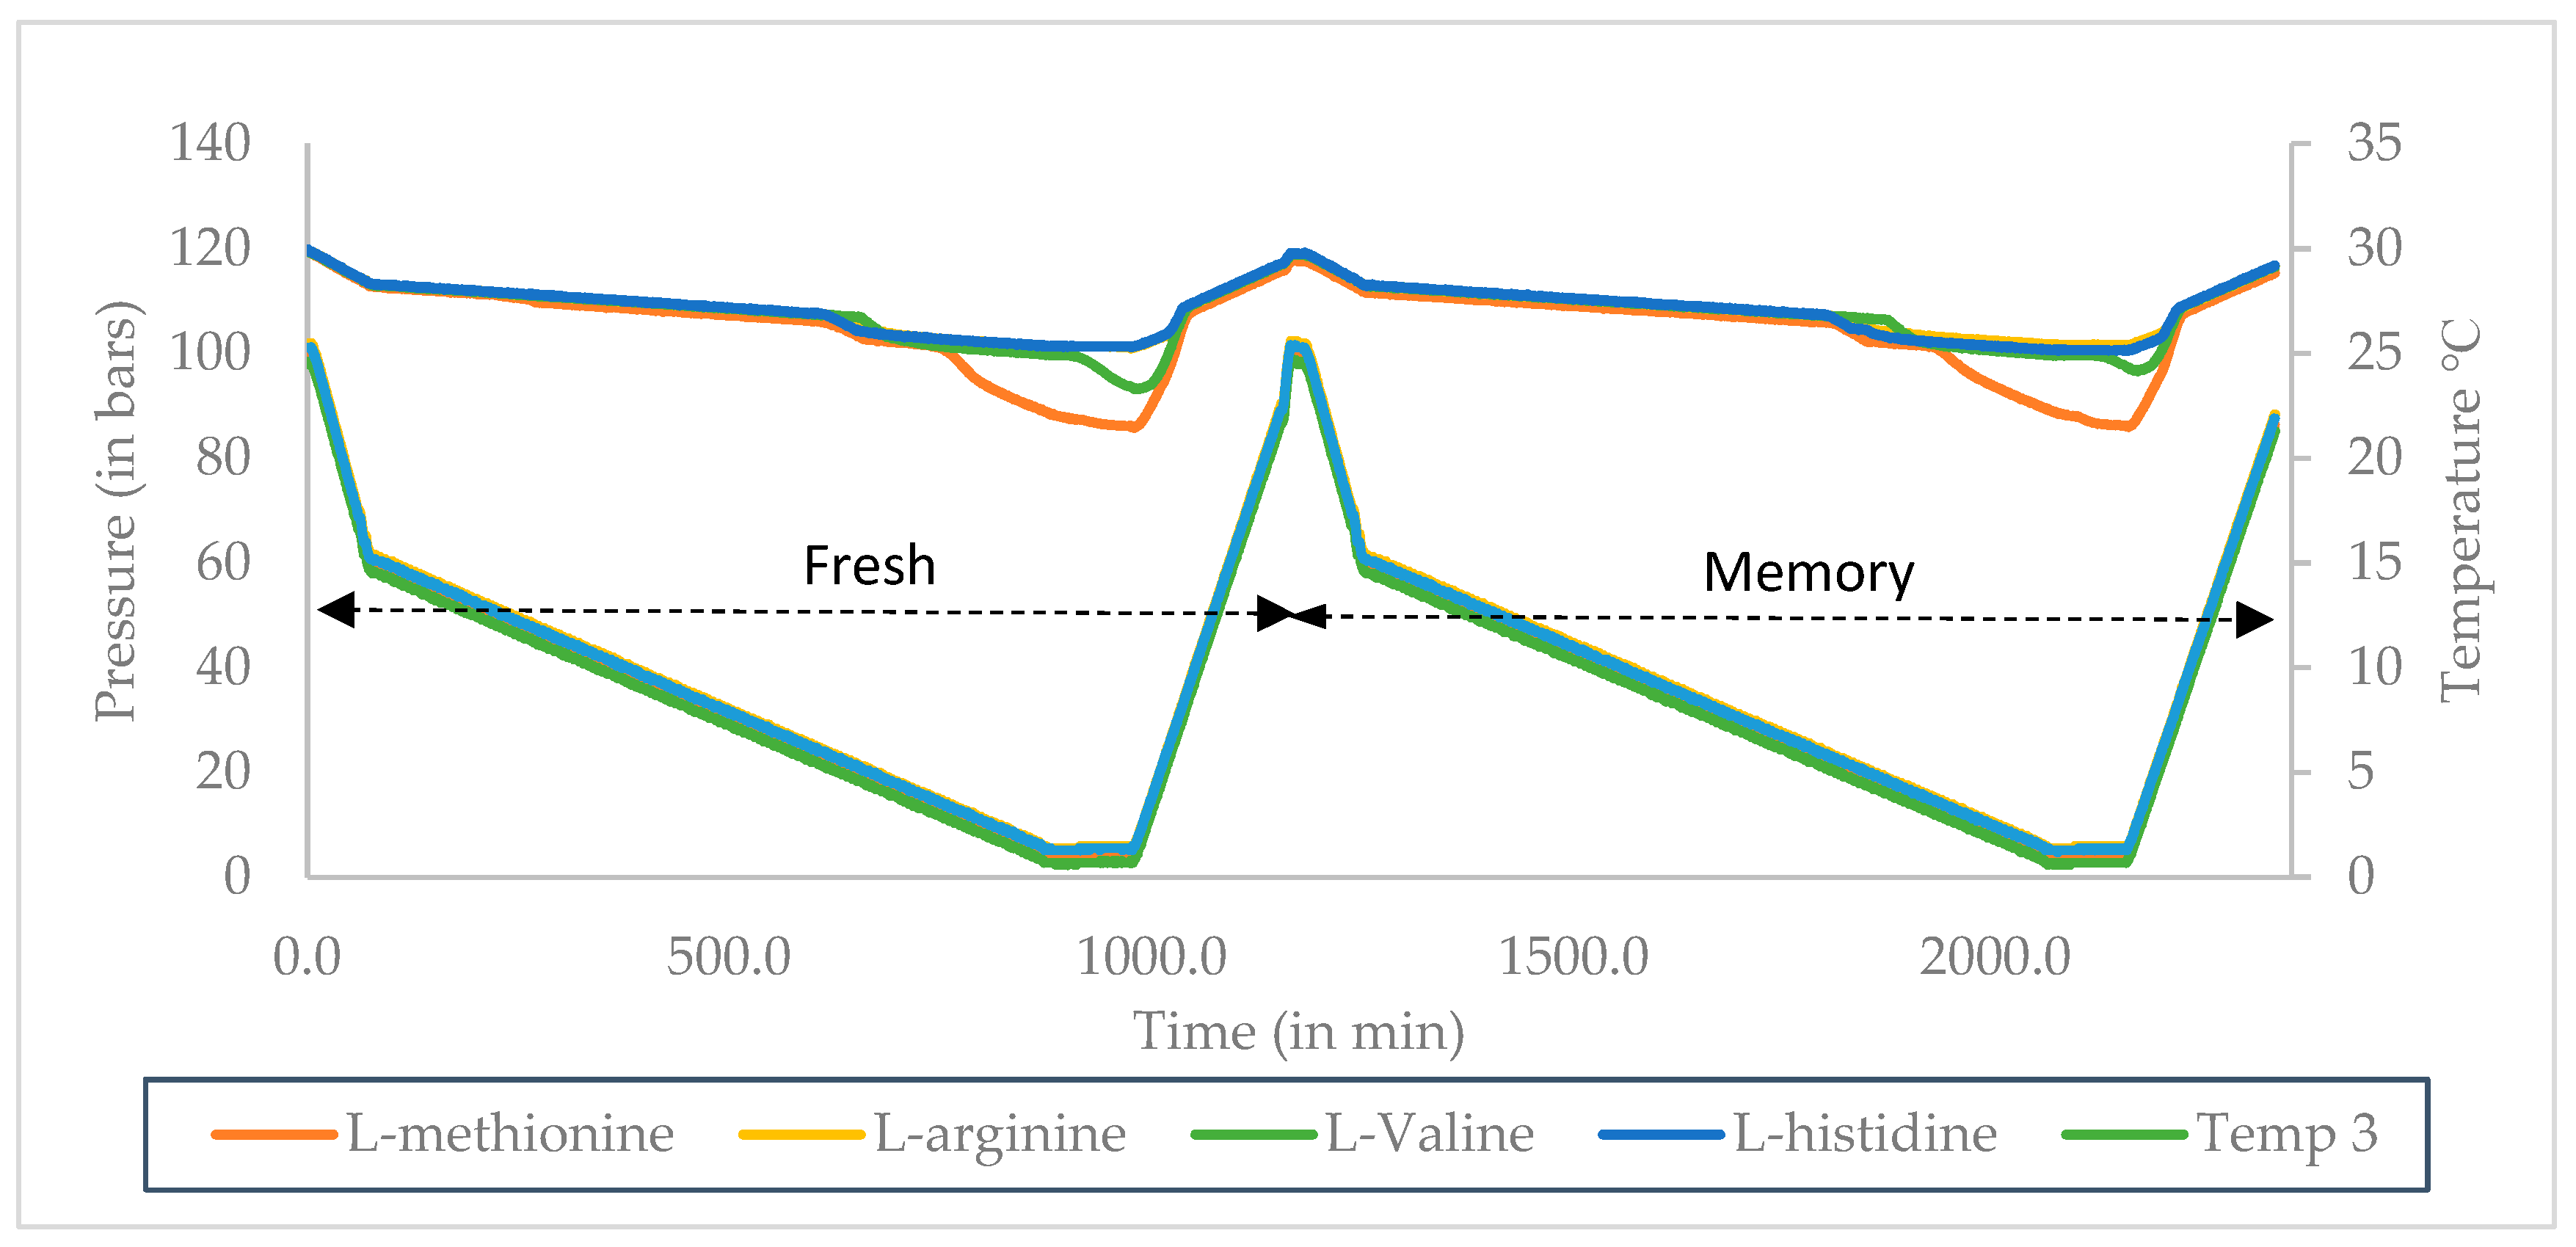
2.3.1. Constant Ramping Experiments

The P-T variation during the constant ramping experiment is shown in Figure 2. The ramping test includes both fresh and memory run. In constant ramping mode, initial pressure reduction is due to thermal contraction and due to gas dissolution into the solution. At the beginning of hydrate nucleation, pressure and temperature follow linear correlation, and the onset of nucleation is observed from the point where a sudden deviation from the linear trend is found. These P-T data are plotted against time to detect the flue gas hydrate formation in the presence of different solutions.
Methodology to calculate the onset nucleation temperature, To, can be referred to other publications [25,26]. The rapid drop in pressure observed after To is the region of high growth where promoter concentration does not play a role. It is observed during the experiments that hydrate promoters increase certainty in the system during the hydrate formation process and reduce the stochastic nature of hydrate formation.
Sub-cooling temperature (ΔTsub) is considered as the driving force behind the hydrate growth curve. It can be expressed as the difference between Teq and operational temperature Top [35]. The Top is the temperature, primarily referred to as the temperature during the isothermal test. In Equation (1), Teq is calculated using CSMGem software for pure water and gas mixture with different molar compositions [36].
Δ T s u b = T e q T o p
In a system containing hydrate promoters, an understanding of sub-cooling can be helpful in understanding the effect of concentration increase on the driving force. The maximum sub-cooling required in terms of the start of hydrate nucleation in case of hydrate promoters can be expressed as
Δ T s u b = T e q T o
where To is assumed to be Top for simplicity in the calculation.
Different sub-cooling with different concentrations in the case of hydrate promoter (HP) would refer to different operational requirements. Higher sub-cooling indicates the additional condition for a more significant temperature drop below the hydrate equilibrium temperature for nucleation to start in case of flue gas hydrate with different CO2 Concentration.
Further, a change in sub-cooling is calculated by computing the difference between the sub-cooling temperature of pure water and sub-cooling temperature at a different concentration of SDS
Δ T s u b . c h a n g e = Δ T s u b ( p u r e w a t e r ) Δ T H P . i
Δ T s u b , c h a n g e = ( T e q T o ) ( p u r e w a t e r ) ( T e q T o ) S D S , i
T e q , w a t e r = T e q , S D S
Δ T s u b , c h a n g e = T o ( S D S , i ) T o ( p u r e w a t e r )
Δ T s u b , c h a n g e < 0
ΔTsub,change < 0 for HP would indicate that the HP-based system needs a higher degree of sub-cooling in comparison to a simple water-based system while forming flue gas hydrate. According to Sloan et al. [37], the difference between ΔTsub and ΔTop provided the contrast of the operating temperature (isothermal tests) and expected onset temperature. The equation below provides a comparison between constant ramping and isothermal experiments.
Δ T s u b Δ T o p = ( T e q T o ) ( T e q T o p ) = T o p T o
Teq is constant by fixing the initial operating pressure for the given gas composition and pure water case. If Top < To, then immediate hydrate formation is expected to occur. For the case when Top > To, a delay in hydrate formation is expected.

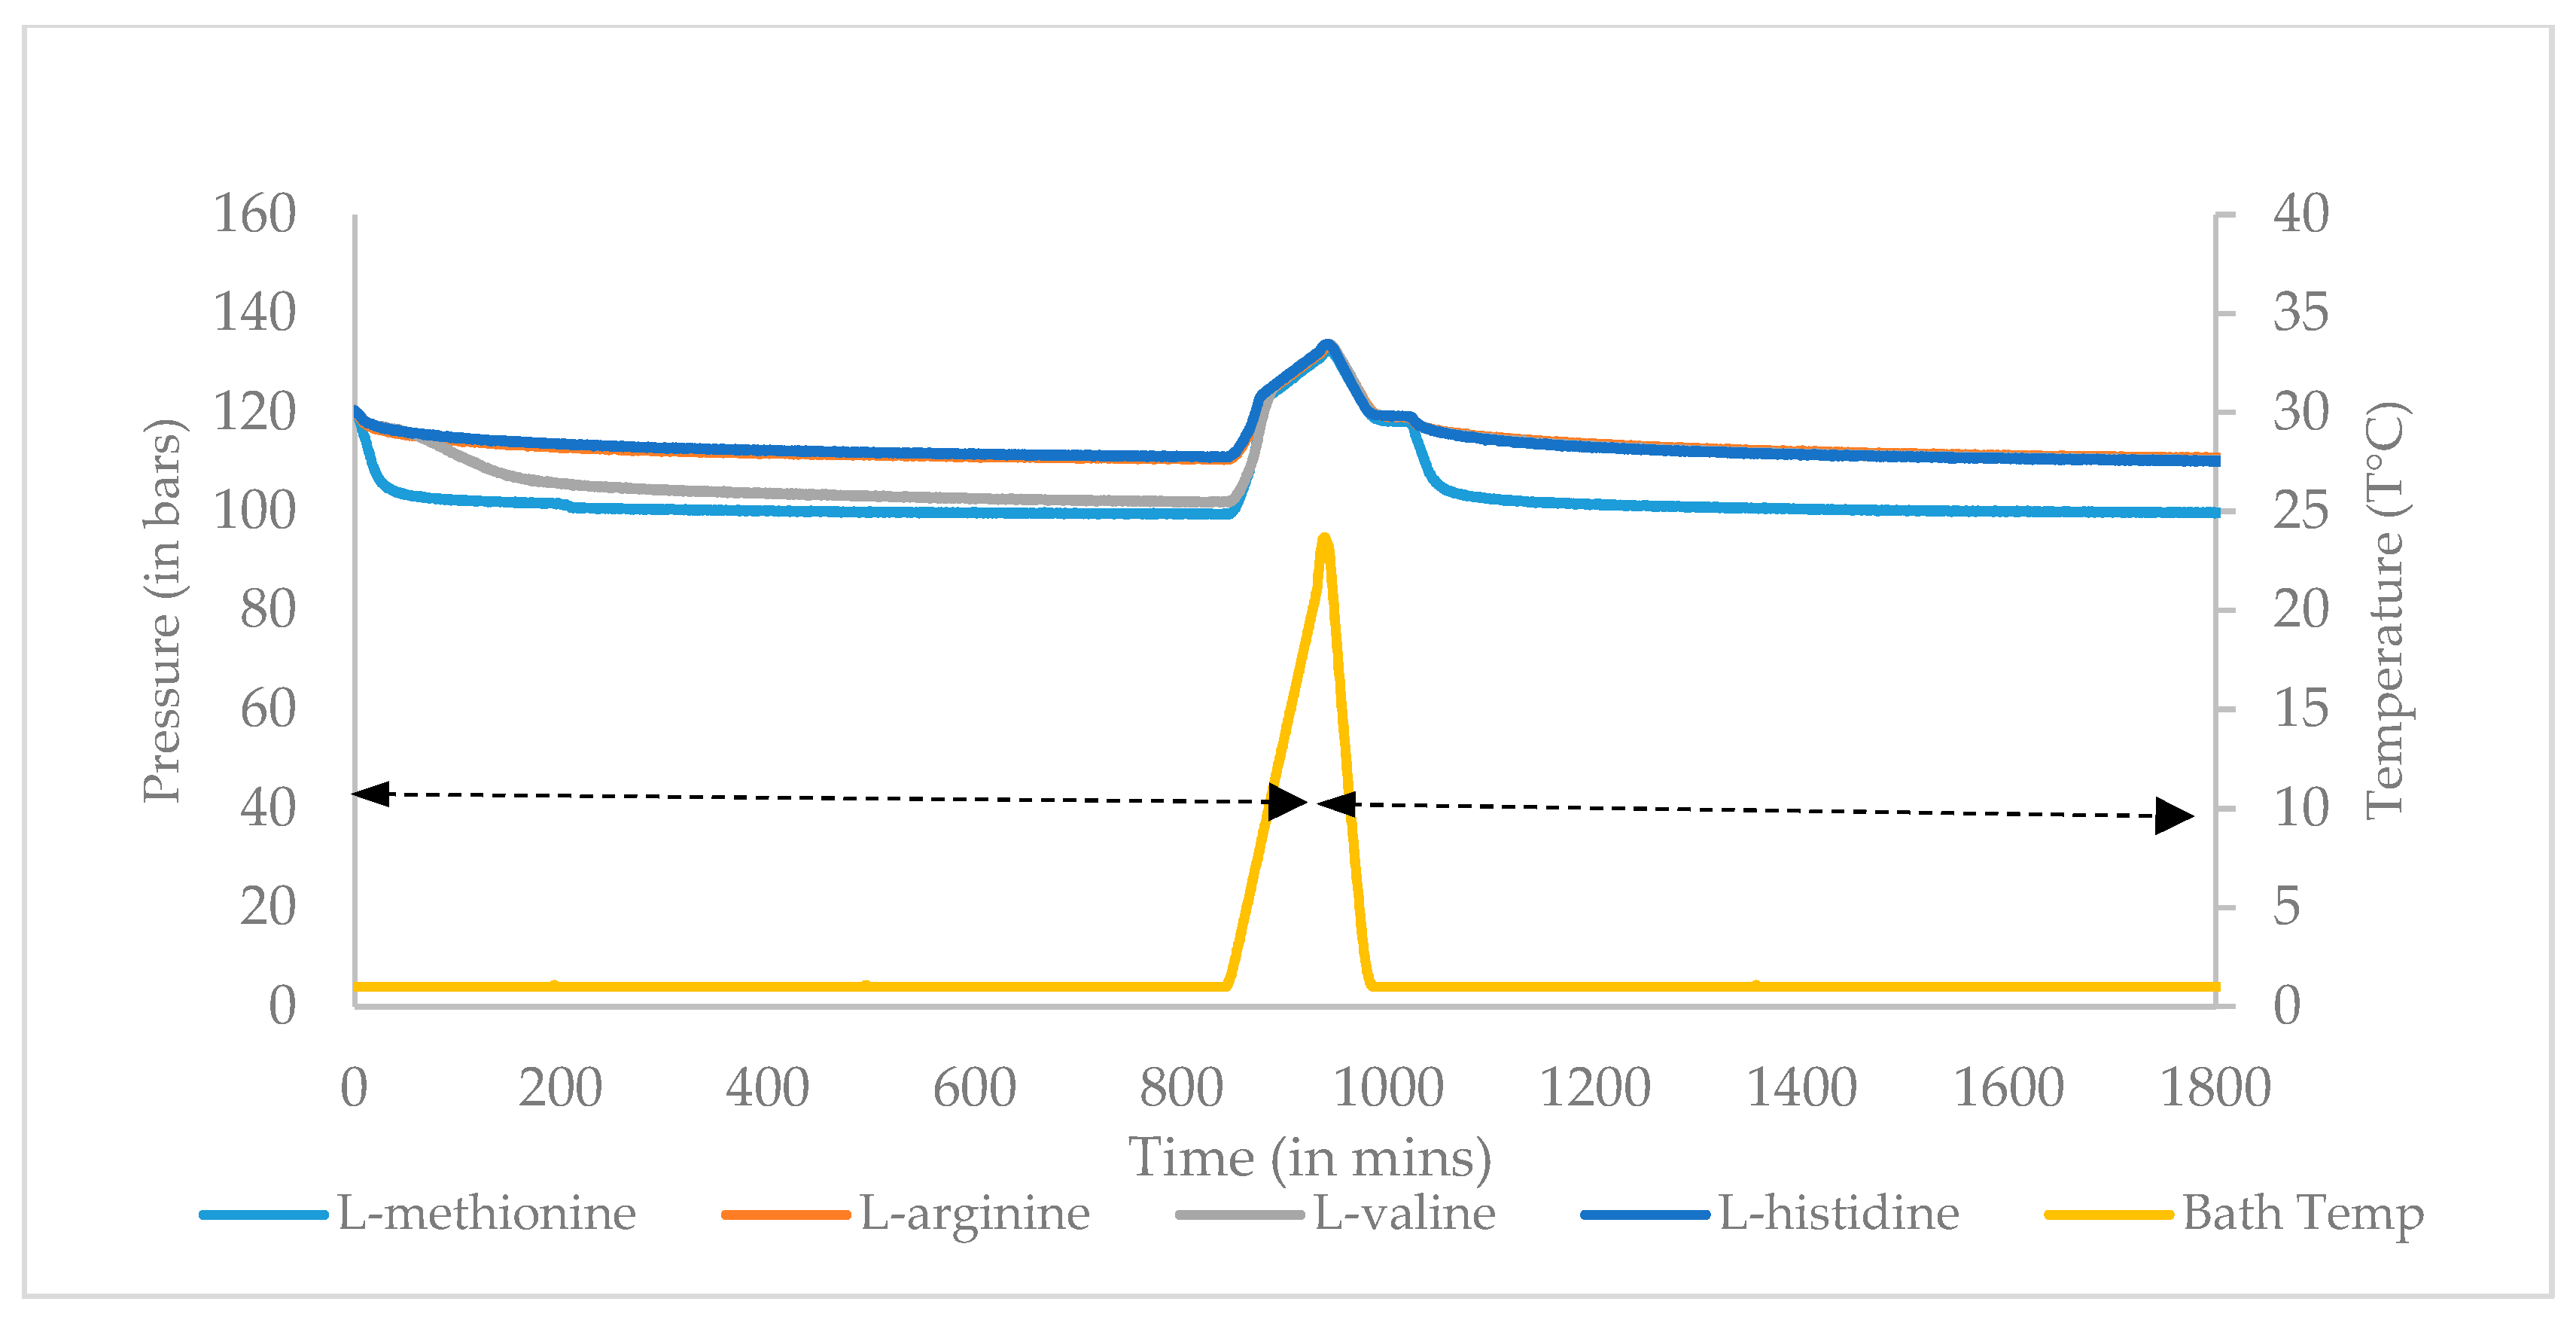
2.3.2. Isothermal Experiment

P-T variation for different amino acids during the isothermal experiment is shown in Figure 3. Under isothermal experiments, induction time, gas uptake, and CO2 recovery are calculated to measure the growth phase of flue gas hydrate formation. Flue gas hydrate formation is a crystallization process involving nucleation, growth, and agglomeration stages. Mass and heat transfer are considered key factors during growth. In current studies of kinetics, we are concerned with the rate of phase transformation and factors affecting the phase transformation. While the rate of nucleation is challenging to measure the induction time, gas uptake can be experimentally measured and describes the kinetics of flue gas hydrate formation in terms of onset of crystallization and rate at which hydrate solution interface advances [13].
All kinetics experiments are carried out in hydrate formation conditions to obtain the finite rate of crystallization. During the isothermal experiments, the difference between initial and stability pressure acts as a driving force behind the hydrate formation. At the end of the isothermal experiment, the residual gas phase composition is determined by GC. P-T data recorded during the experiments are used to measure the induction time, gas uptake, and CO2% recovery. Figure 3 shows the P-T trend during the isothermal experiment, both from fresh and memory run.
Total number of moles of flue gas injected into the pressure cell is calculated as
n i f l u e g a s = P 1 V Z 1 R T
n i C O 2 =   n i f l u e g a s × y i C O 2 n i N 2 =   n i f l u e g a s × y i N 2
P1 is the initial operating pressure after flue gas is injected into the high-pressure cell. Where V(V = VTVL) is the available gas volume in the reactor. VT is the total cell volume and VL is the HP solution volume (equal to 10 mL). T is the temperature of the isothermal test. The compressibility factor Z1 at the initial pressure and temperature for given flue gas composition is calculated using the Benedict-Webb-Rubin-Starling equation of state. R is the universal gas constant, 8.314 J·mol−1·K−1.
Assuming the process is constant volume, available gas volume remains constant after flue gas hydrate formation. Thus, n f f l u e g a s is the number moles of flue gas hydrate formation in the gas phase after flue gas hydrate formation, and it is given by the following equation:
n f f l u e g a s = P 2 V Z 2 R T
where P2 is the pressure at the end of the isothermal experiment, and Z2 is the compressibility factor corresponding to P2. T is isothermal bath temperature. Z2 is measured for a given gas vapor composition at the end of the experiment. The gas composition is measured using GC analysis. The moles of carbon dioxide and nitrogen in the equilibrium gas phase are calculated as:
n f C O 2 = n f f l u e g a s y f C O 2 n f N 2 = n f f l u e g a s y f N 2
The change in the total number of moles of flue gas Δ n H f l u e g a s trapped in hydrate formation is given by
Δ n H f l u e g a s = P 1 V Z 1 R T P 2 V Z 2 R T
The total moles of CO2 and N2 stored in the hydrate is thus calculated as given by
n H C O 2 = n f C O 2 n i C O 2 n H N 2 = n f N 2 n i N 2
where n H C O 2 and n H N 2 are moles of CO2 and N2 stored in hydrates.
CO2 recovery % is calculated as
S . F r . = n H C O 2 n i C O 2
where n i C O 2 and n H C O 2 are the number of moles of CO2 in feed and hydrate gas.

3. Results

Using CSMGem, pure CO2 and N2 systems require 14 bar and 178 bar minimum pressure, respectively, to form hydrate at 1 °C. CO2 induces the formation of S-I structure, while N2 induces S-II structure. The final structure of a flue gas hydrate could either be S-I or S-II, which will depend on the individual gas molecule composition in the small and large cavities. It is observed that the CO2/N2 system with more than 10% CO2 will be S-I in nature [38].
In this study, we have analyzed important kinetic parameters, including nucleation and growth kinetics, as well as CO2 recovery in the presence of sodium dodecyl sulfate (SDS) and selected amino acids (L-valine, L-methionine, L-histidine, and L-arginine) using rocking cell. Flue gas with 20 and 30 CO2 mole% is used during the studies. Experimental results are divided into different subsections, and a discussion is followed.

3.1. Onset Temperature (T0) and Sub Cooling (ΔTsub) for Surfactant and Amino Acid

Nucleation kinetics are studied to observe the onset of nucleation temperature (To). Hydrate nucleation depends on many factors, including subcooling temperature, the composition of the gas, agitation, and geometry of pressure cells [36]. Therefore, to study nucleation in the laboratory, the number of variables need to be monitored and controlled. Due to the standardization of the rocking cell, it is possible to control most of the parameters while calculating the nucleation temperature. Measurement of nucleation temperature is preferred due to lower deviation observed; therefore, subcooling temperature measurement is reported in place of induction time to evaluate the nucleation kinetics, including promotion and inhibition of different solutions. The effect of change in CO2 concentration in flue gas is studied for different SDS concentrations and different amino acids at 3000 ppm concentration. Nucleation temperature is recorded for both fresh and memory samples. The initial solution volume used is 10 mL, and the initial operating pressure is 120 bar. ΔTsub for all the solutions is calculated as ΔTsub = TeqTo, and for simplicity, Teq is calculated using CSMGem for pure water and flue gas with 20 and 30 mole% CO2 at 120 bar pressure.
Results including To and ΔTsub are summarized in Table 5 below. Results include data from fresh and memory run for both 20 mole% and 30 mole% CO2 with pure water, SDS (500–3000 ppm), and amino acids (3000 ppm). Results indicate that the subcooling requirement for a lower concentration of SDS and hydrophilic amino acids is higher than water, while the subcooling requirement of SDS (2000, 3000 ppm) at higher concentration and hydrophobic amino acids is found to be lower than water. A higher subcooling requirement indicates a delay in nucleation with respect to water. Higher subcooling requirements for individual amino acids reflect the perturbation of liquid water structure correlated with hydrophobicity [39]. L-histidine was found to be more effective in inhibition due to the presence of charge at the side change. On the other hand, L-valine and L-methionine were able to improve the water structure, thus reducing the subcooling requirement. An increase in CO2 mole% leads to an increase in nucleation temperature recorded for all solutions, including water; however, it was observed that at higher CO2 mole%, the subcooling requirement for all solutions was higher compared to 20 mole% CO2. Overall, variation in To trend can be correlated with their hydropathy index.
During the memory run, different concentrations of SDS in solution are shown to eliminate the memory effect, reflected by lower To values observed during the memory run at different CO2 concentrations. SDS has shown similar behavior during the methane hydrate formation in the presence of SDS [25]. It is likely that a surfactant-based hydrate promoter eliminates memory effect during the nucleation, independent of the host molecule.
To values of hydrophobic amino acids are distinctively different from hydrophilic amino acids at 20% mole CO2. An increase in CO2 concentration to 30 mole% in flue gas leads to nearly a similar To values for all four amino acids as CO2% increases, To increases for all solutions. This is because the CO2 concentration increase leads to a higher driving force due to Teq moving from 6.3 to 8.32 °C; thus, nucleation initiates at a higher temperature. For SDS, the nucleation temperature is lower and close to water nucleation temperature between 500 ppm to 1000 ppm concentrations. This reflects that at a lower concentration, SDS delays the nucleation. Further, as SDS concentration increases from 500 ppm to 2000 ppm, nucleation temperature increases until 2000 ppm and decreases after 2000 ppm. A similar trend is observed for methane hydrate formation in Pandey et al. [25]. Change in To between 2000 to 3000 ppm reflects the presence of the critical micelle concentration (CMC) of SDS, which is also supported by Roosta et al. [31]. Based on the observations in this paper and a previous study by Pandey et al. [25] for methane hydrate formation in the presence of SDS, it is likely that the CMC of hydrate-promoting surfactant is independent of the guest molecule, while the dependent on surfactant type.
In the case of amino acids, for flue gas with 20 and 30% mole CO2, To, for all amino acids is found to be higher or closer to the pure water case, except in L-histidine case, where To is recorded as 3.9 °C and 5.9 °C. This indicates L-histidine functions as an inhibitor, thus delaying the nucleation compared to water. This could be because of a charge present on the side chain in L-histidine that leads to perturbation of water structure around the side chain and reduces the hydrogen bonding capability of the water molecule. L-valine and L-methionine, which are hydrophobic amino acids, showed a higher To compared to the hydrophilic amino acids. As CO2 concentration increases in flue gas from 20% to 30%, the memory effect becomes weaker in the case of amino acids, and the deviation between To values in fresh and memory cases reduces. It can, therefore, infer that the concentration of CO2 in flue gas plays an important role behind hydrate nucleation temperatures.
Figure 4 shows a graphical representation of the subcooling temperature for different combinations. The surfactant and amino acids are seen to eliminate the memory effect as subcooling requirements in memory runs are higher than in the fresh run. SDS at lower concentrations (500 and 1000 ppm) behaves as an inhibitor compares to pure water case, as suggested by higher subcooling requirements. At higher concentration, (2000 and 3000 ppm) subcooling requirement is lower than water. It can be concluded that SDS show promotion effect at higher concentration during flue gas hydrate formation. An increase in CO2 concentration in flue gas leads to higher nucleation temperature as well as higher subcooling requirements, as shown in Figure 4b. It is likely that an increase in CO2 concentration in flue gas would play a role in inhibition. Figure 4c discusses the subcooling requirement of amino acids. Hydrophobic amino acids have lower subcooling requirements compare to hydrophilic and pure water; therefore, hydrophobic amino acids are considered as a promoter during flue gas hydrate formation. Hydrophobic and hydrophilic amino acids do not show a strong memory effect, as suggested by higher subcooling value in memory run in Figure 4c. An increase in CO2 concentration leads to an increase in subcooling requirement for all amino acids, as shown in Figure 4d.

3.2. Induction Time Measurement for Surfactant and Amino Acids

Due to low formation rates and excessive energy consumption, hydrate-based CO2 capture, separation, and storage are uneconomical. Understanding of induction times and growth rates during the flue gas hydrate formation plays an essential factor in the selection of appropriate promoters. The measurement of induction time is summarized in Table 6. At 120 bar and 274.15 K for the pure water case, no rapid hydrate formation was observed both in fresh and memory runs using 20 and 30 mole% CO2. Memory refers to the case when the sample used in the experiment has previously experienced the hydrate formation. It is the general observation that memory sample has lower induction time compare to fresh sample [40]. It is observed that SDS and amino acids do not eliminate memory effects during the growth phase, as shown by lower induction time recorded in memory runs.
Induction time is also influenced by the driving force (Pinj-Peq), such that, as driving force increases, induction time decreases. The driving force can be influenced by incoming CO2/N2 feed gas pressure (Pinj) or hydrate equilibrium pressure (Peq) dependent on CO2 concentration in the CO2/N2 feed gas. As CO2 concentration increase from 20% to 30%, the driving force increase due to the lowering of Peq, which decreases the induction time. Thus, promotion increases both amino acids and SDS solutions.
For the SDS solution, it is observed that as the concentration increases from 500 ppm to 3000 ppm, induction time decreases. In our previous publication using the same setup and same experiment parameters (rocking rate, rocking angle, and solution volume), a similar trend is observed for methane hydrate formation in the presence of SDS [25]. Thus, it is likely that liquid phase properties in the presence of promoters are essential in understanding the induction time variation.
These experimental results confirm that the performance of amino acids correlated with their hydrophobicity. Hydrophilic acids L-histidine and L-arginine tend to delay hydrate formation, and no rapid formation is observed. This is also confirmed by visual inspection of L-histidine and L-arginine based hydrate. This is likely because of the perturbation of liquid water structure caused by the charged side branch of hydrophilic amino acids, which reduced the hydrogen bonding capacity of water molecules. This is also confirmed by previous studies by Sa et al. [21].
Hydrophobic amino acids have a lower induction time compared with water and hydrophilic amino acids. Memory run in case of 20 mole% CO2, suggests that SDS and hydrophobic amino acids, display strong memory effect reflected by lower induction time during memory run. When CO2 mol% increase from 20% to 30%, it is observed that the rise in CO2 mole% leads to a decrease in induction time, which suggests promotion capability improves both for SDS and Amino acids. However, no induction time is observed for hydrophilic amino acids. Highlight the induction time in the presence of SDS. Linga et al. [13] had reported the induction time for 16.9% CO2 mixture at 0.6 °C, and 11.0 MPa, 10 MPa as 14/19 min (in two trials) and 10.3/16.3 min (in two trials), respectively in pure water system and concluded that decrease in pressure reduces the induction time for CO2/N2 system. This is due to the fact that higher pressure, more N2 go into the hydrate reflected by an increase in N2 uptake in the hydrate. N2 has higher hydrate formation pressure, thus influencing the induction time of the CO2/N2 system. We did not observe any sharp growth phase of the CO2/N2 system at 12 MPa using rocking cells. Thus, it can be said that there is a range of pressures at a given temperature (273 K–275 K) when flue gas hydrate can be formed in pure water cases. Their research also shows memory effect reflected by lower induction time recorded by memory run. Partoon et al. [41] has discussed the pure CO2 hydrate formation in the presence of SDS and concluded that an increase in concentration decreases the induction time from 100 ppm to 1500 ppm at 35 bar and 273.65 K. The decrease in induction time in the presence of SDS is due to an increase in CO2 solubility in water and lowering the surface tension [42].
Hydrophilic amino acids show a decrease in induction time due to an increase in driving force caused by lower Peq at higher CO2 mole%. For SDS, a significant decline in induction time is noted between 1000 ppm and 2000 ppm for both 20 and 30 mole% CO2. In the case of 20 and 30% CO2, induction time for L-methionine and SDS at 3000 ppm are comparable.

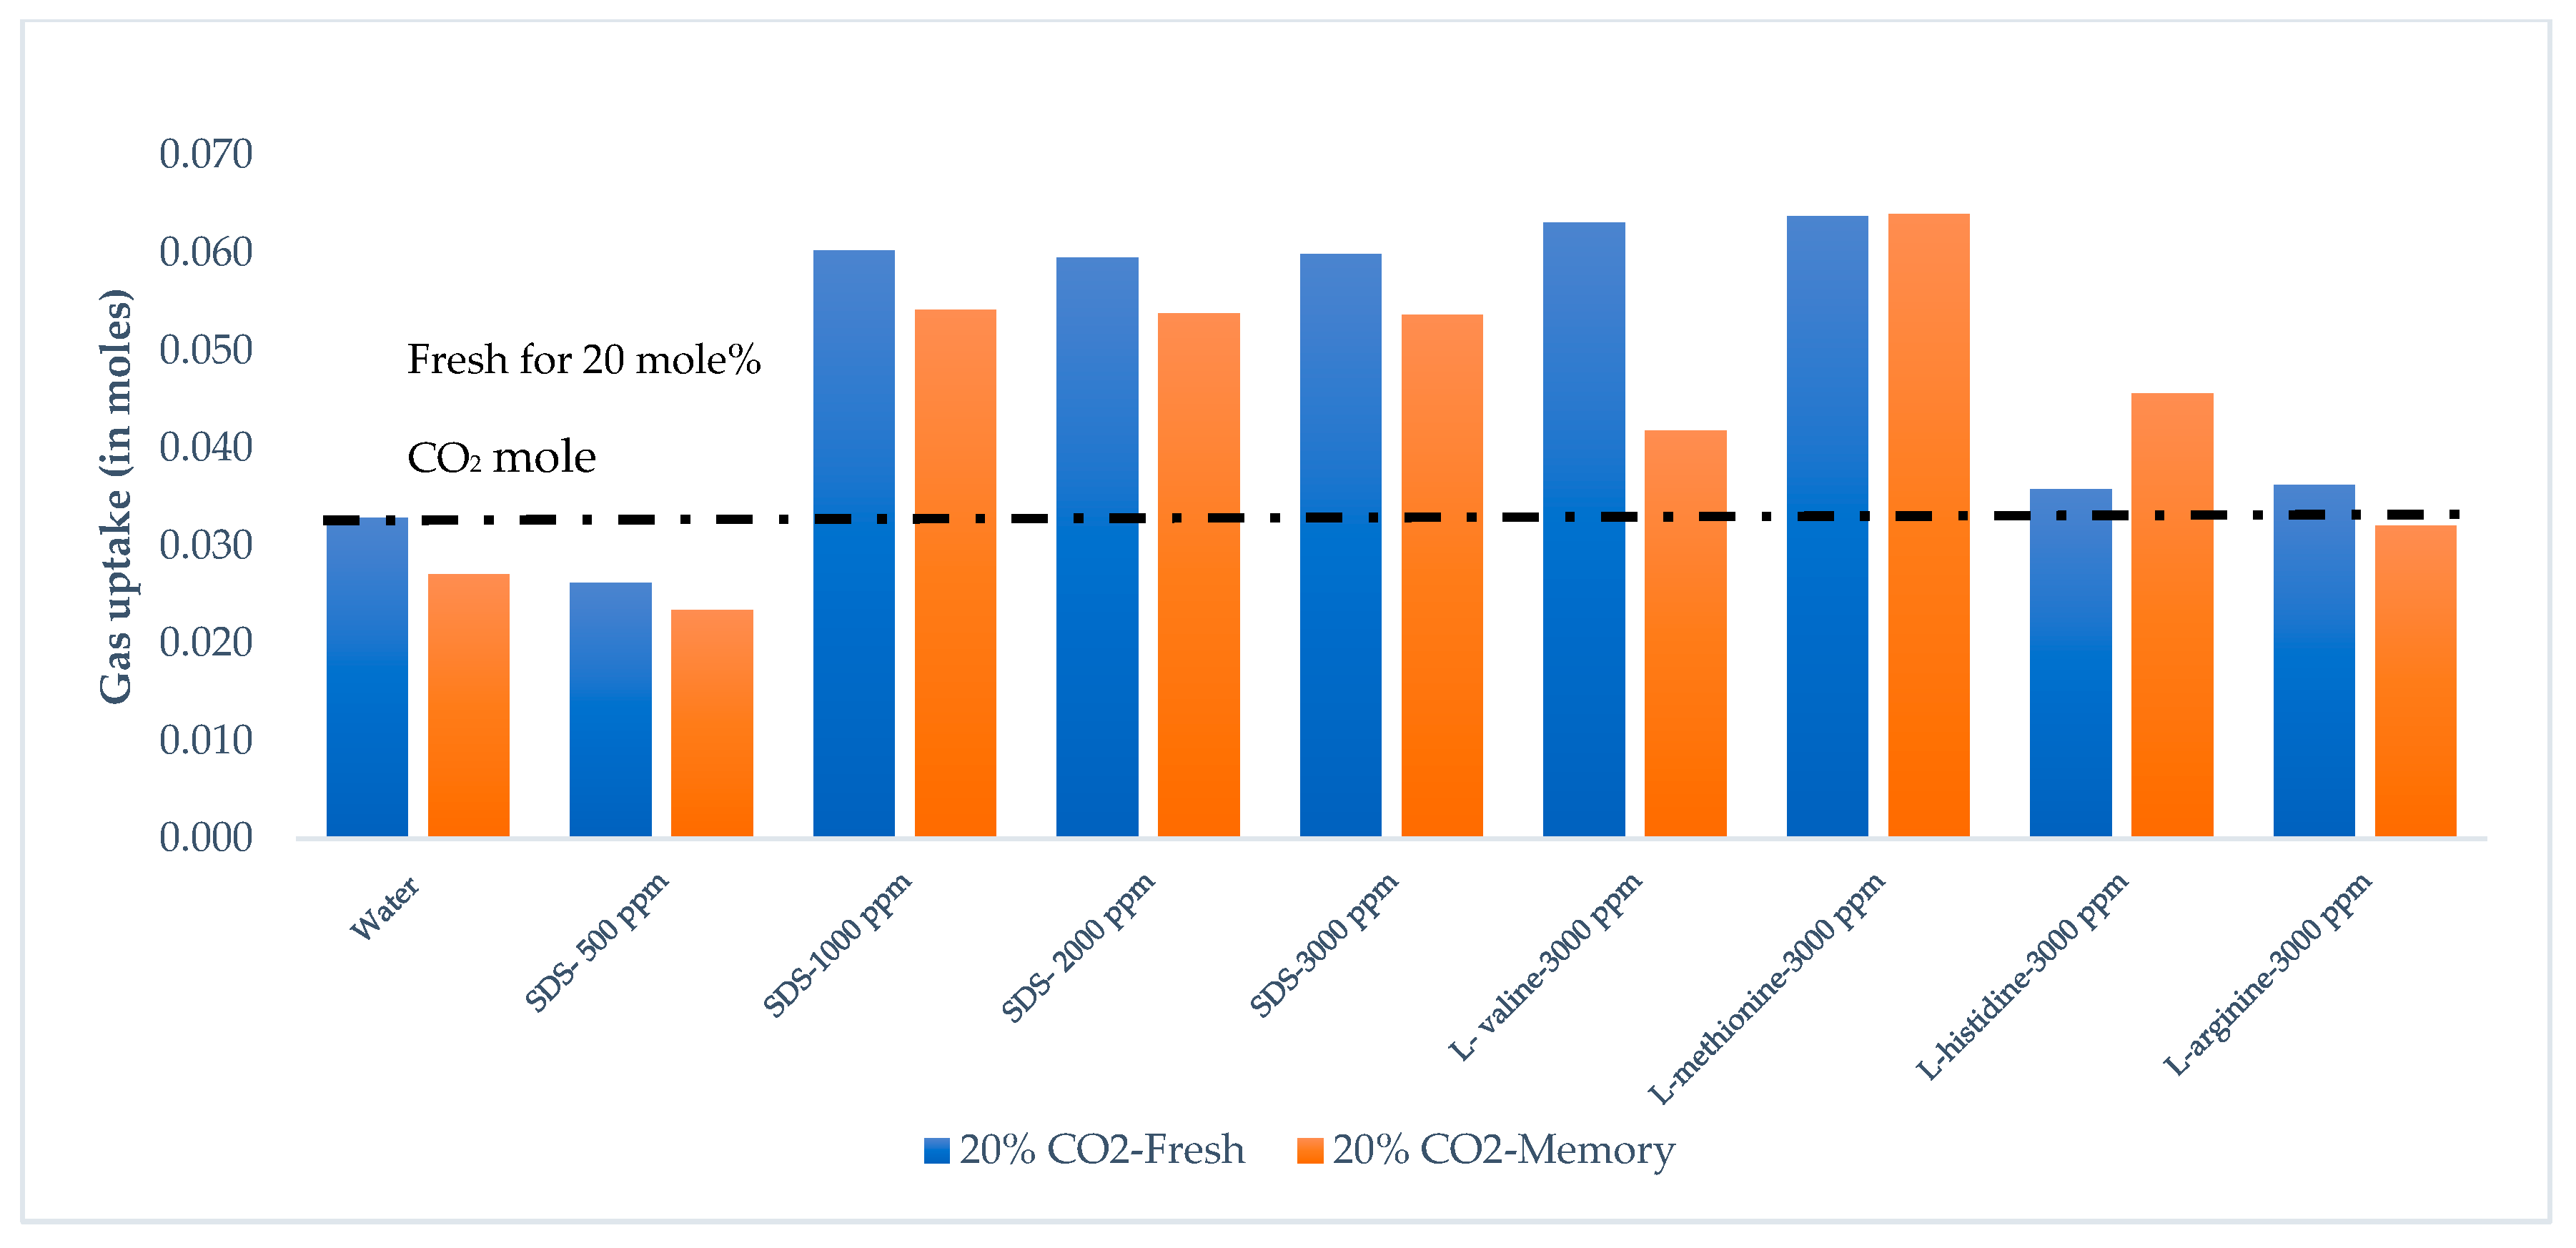
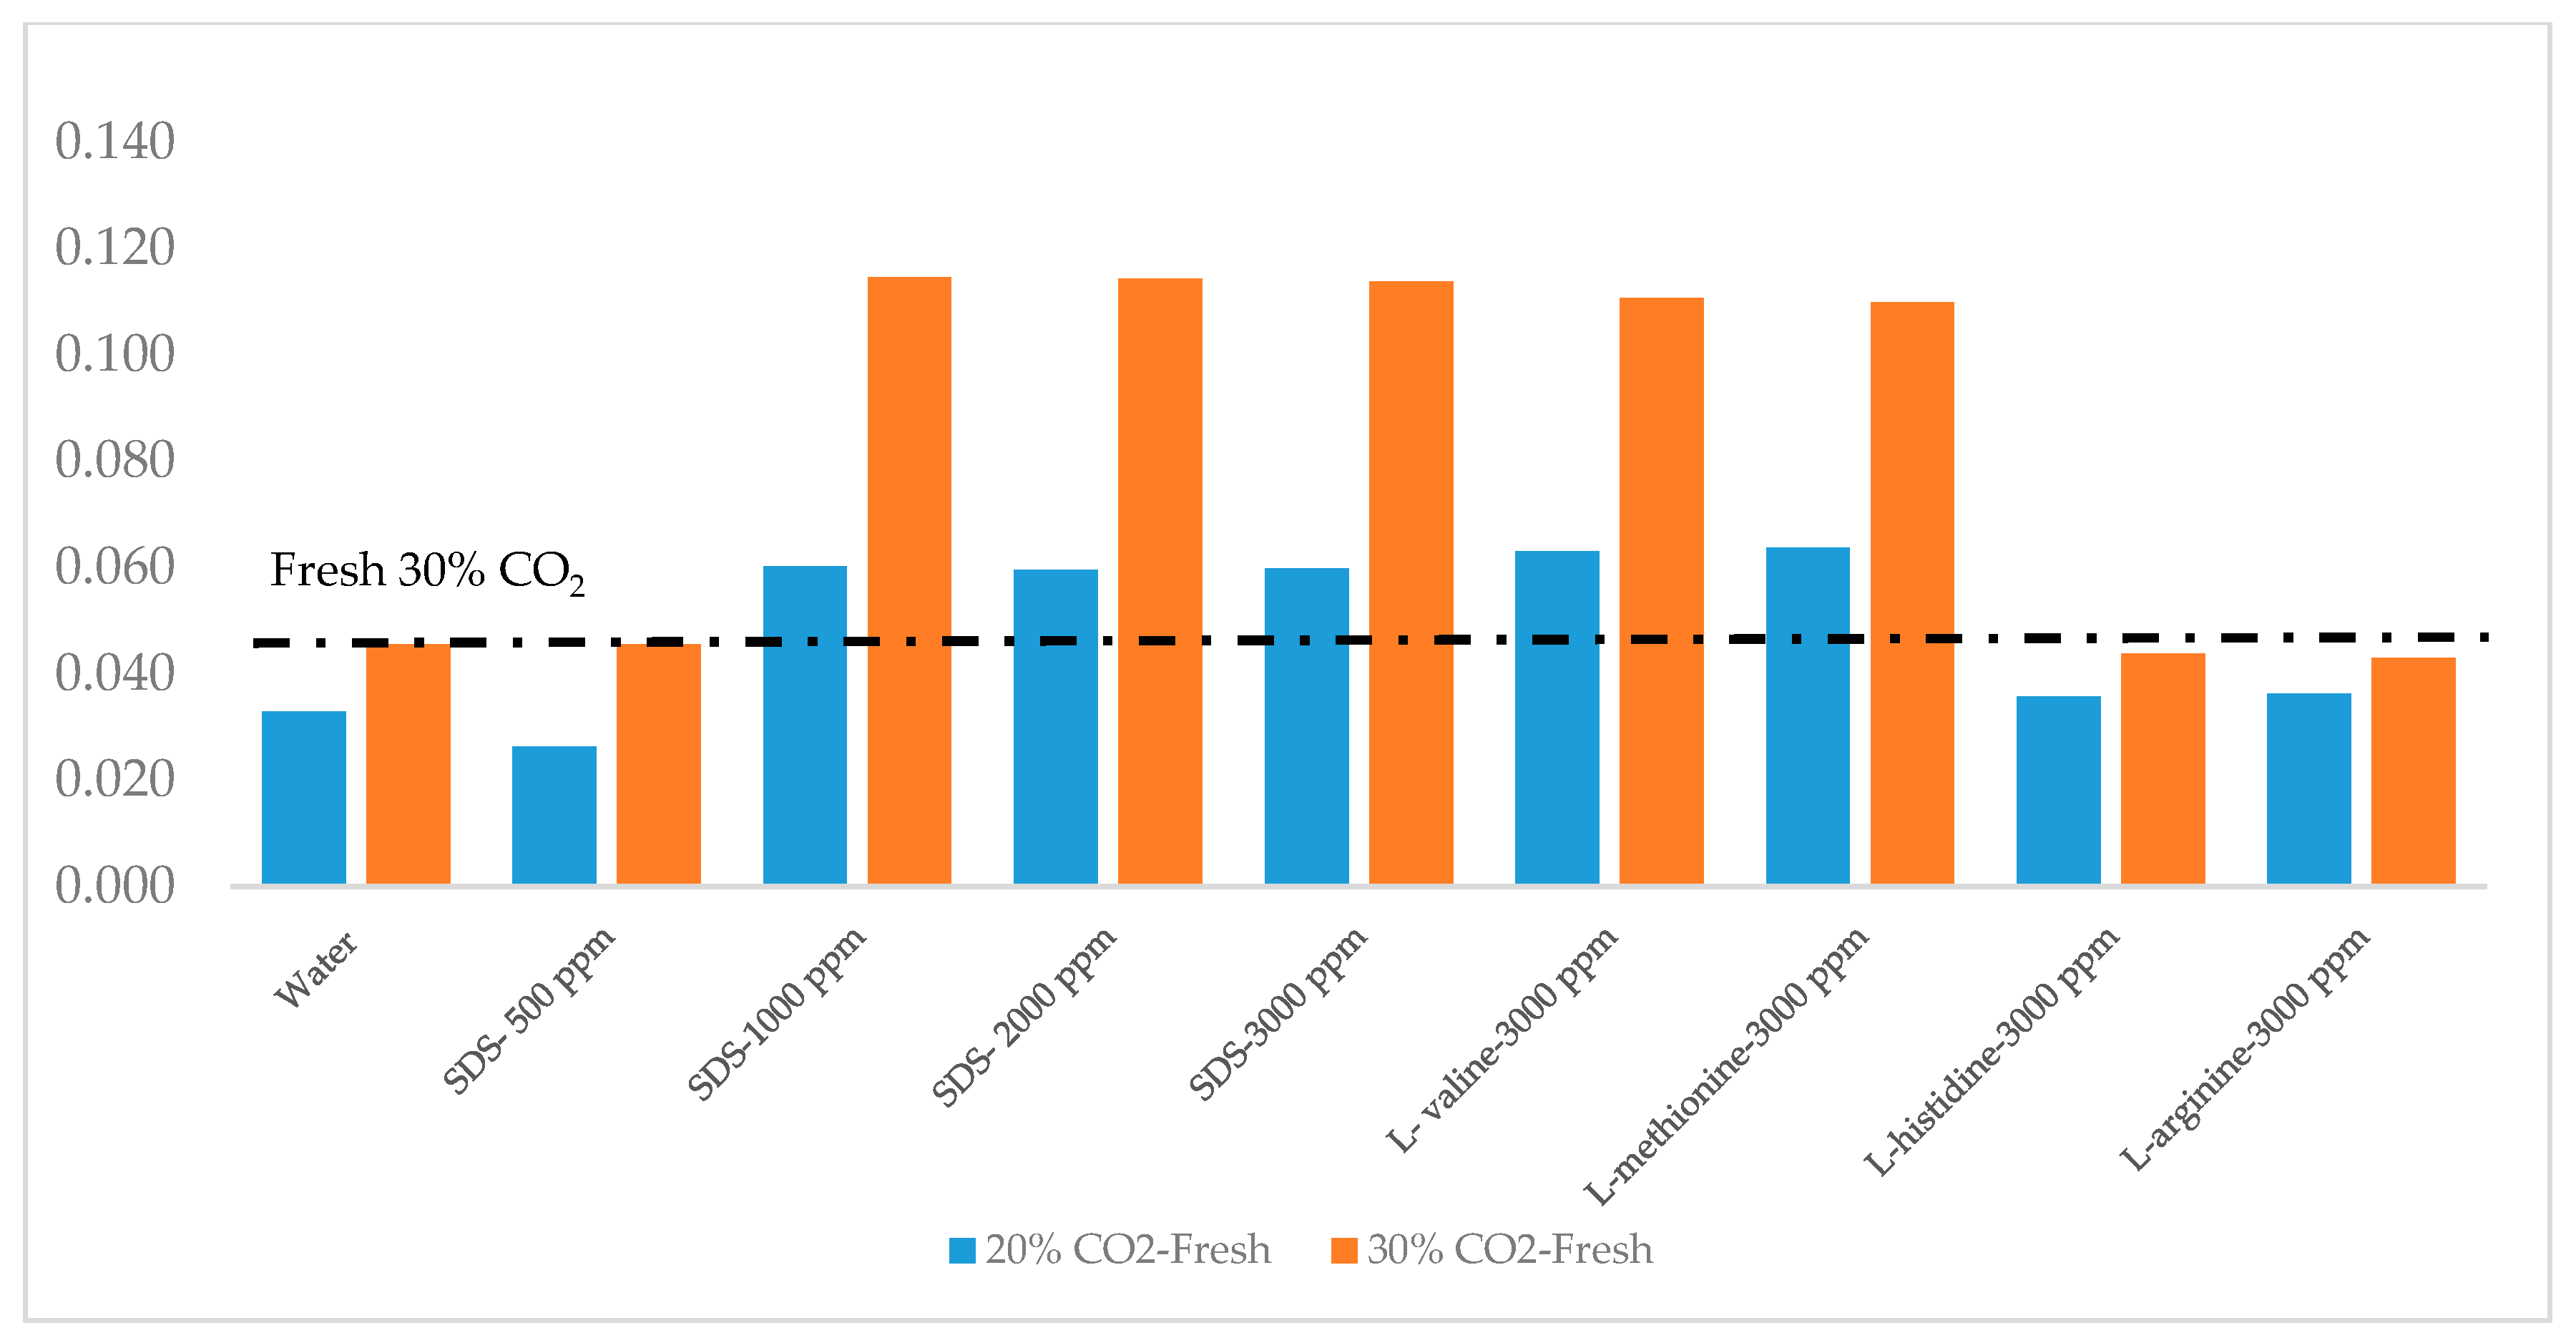
3.3. Gas Uptake and Growth Profile
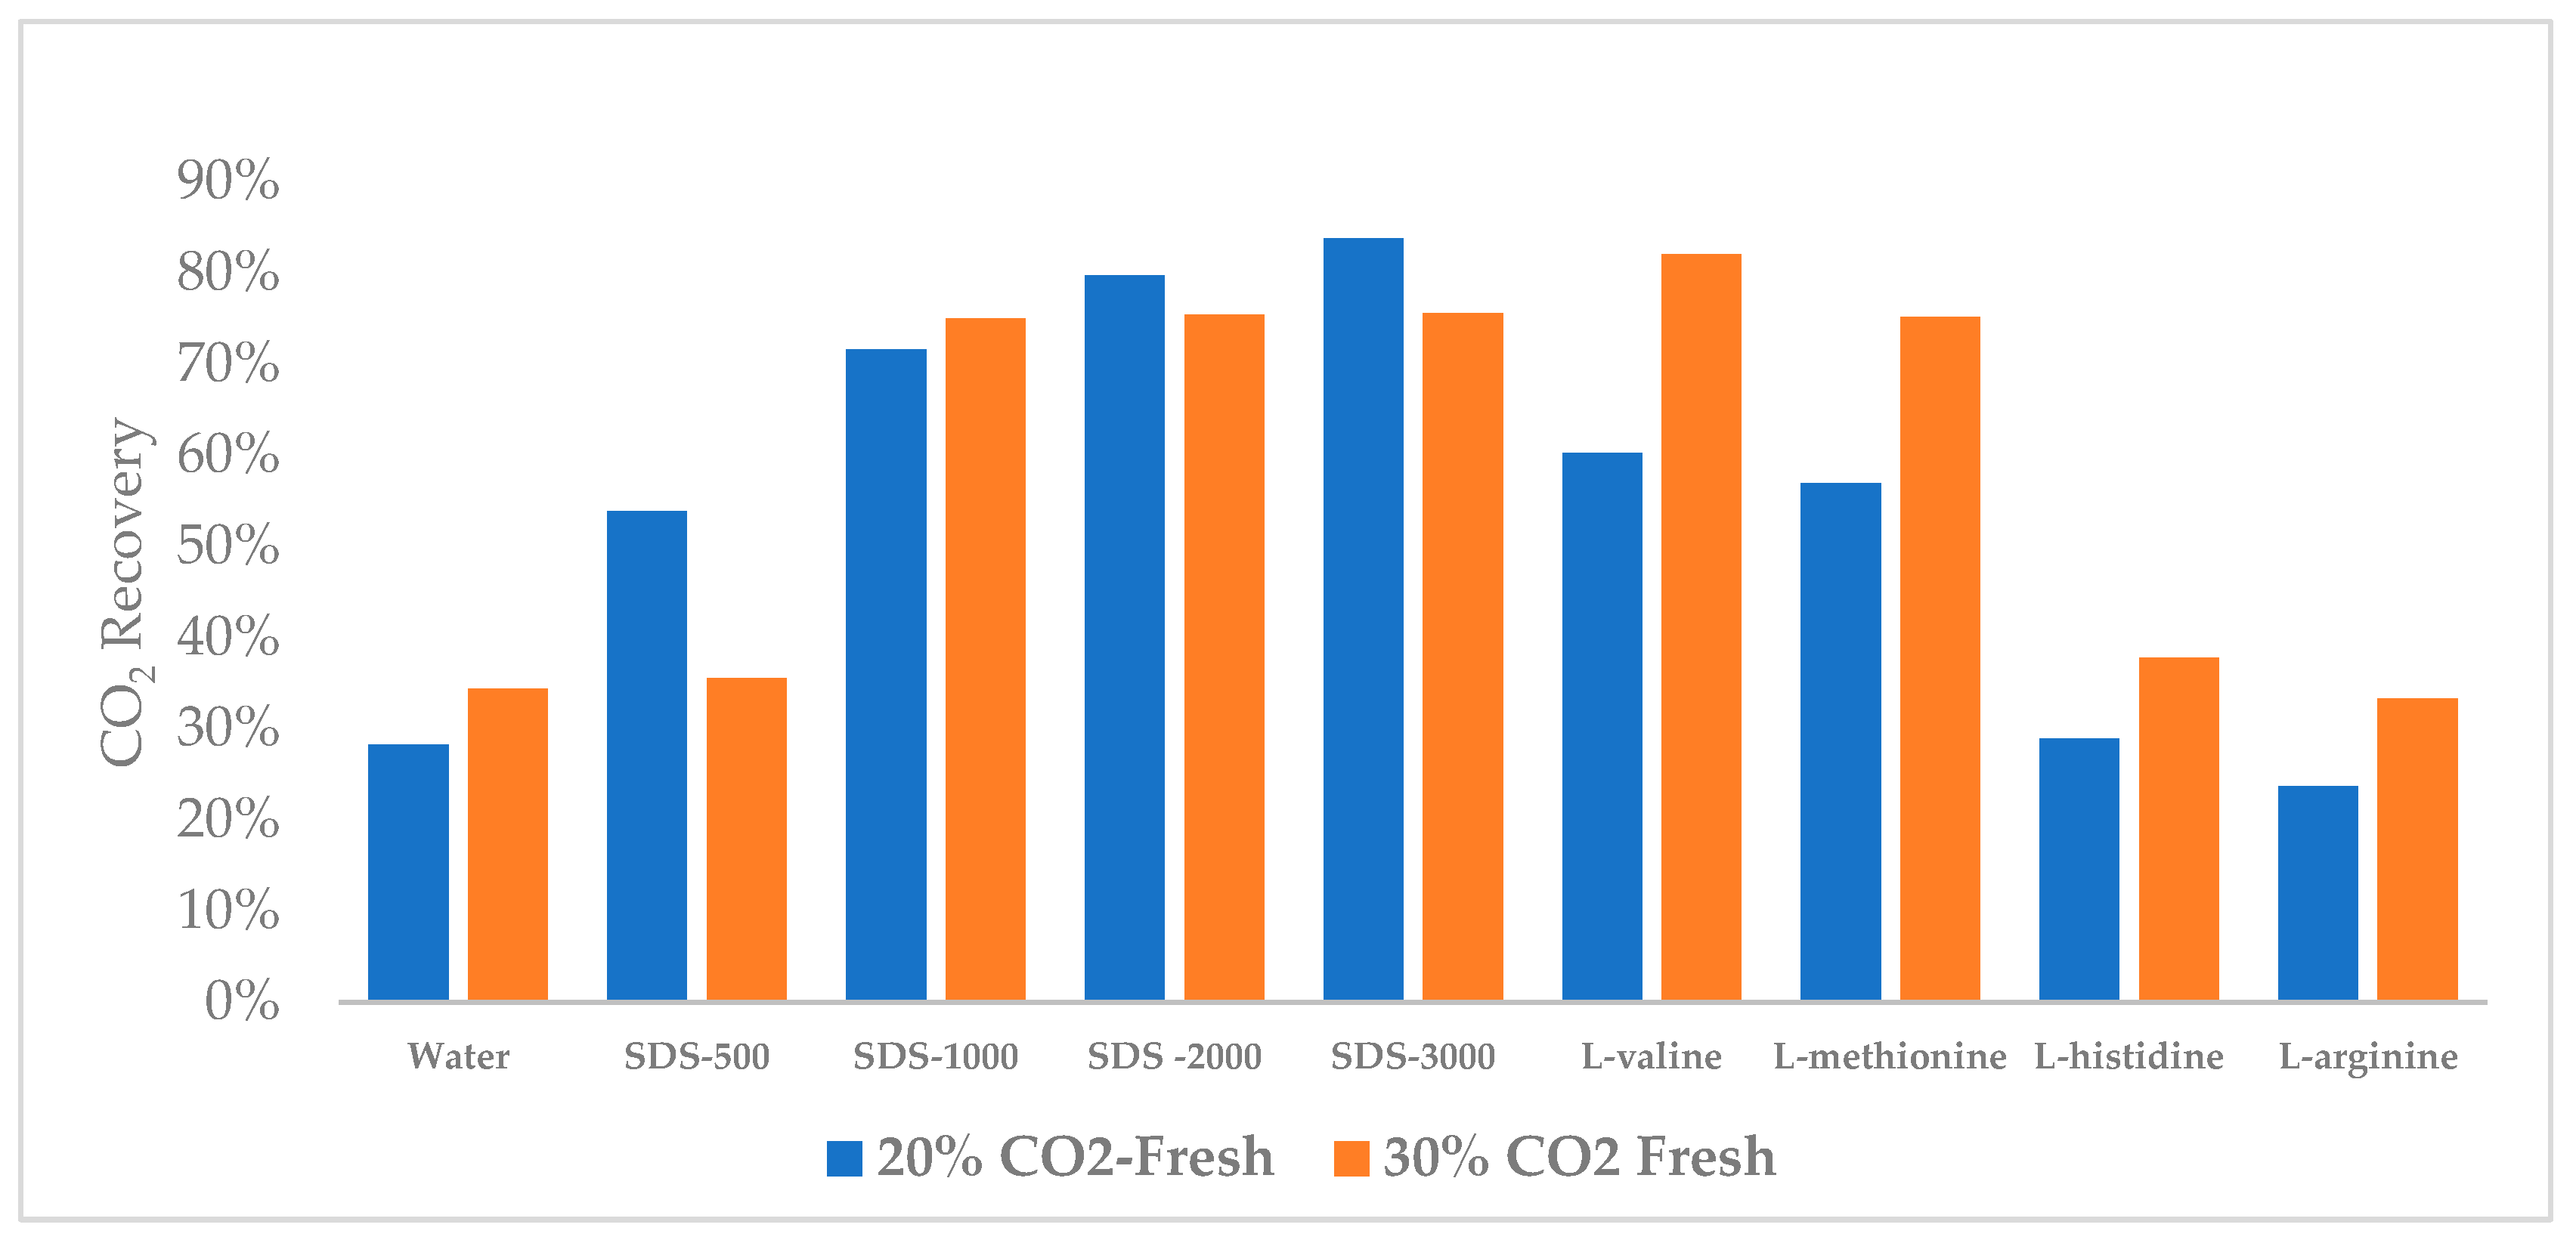
Normalized gas uptake calculations are based on isothermal experiments at T = 1 °C and Pinj = 120 bar. Gas samples are collected for GC analysis at the end of fresh runs and combined fresh, and memory runs to study the gas composition of unused gas. Table 7 below summaries the gas uptake calculations for fresh and memory runs at 20 mole% concentration CO2 in CO2/N2 mixture. Figure 5 graphically represents the results. For SDS, as the concentration increases, gas uptake increases; however, at 1000 ppm and above, an increase in gas uptake is marginal. Gas uptake for memory runs is lower than for fresh runs at all concentrations.
Gas uptake kinetics are controlled by heat and mass transfer; however, parameters affecting nucleation kinetics also play a role. It is clear from Figure 5 and Table 7 that surfactant and amino acids eliminate the memory effect for gas uptake calculations reflected by lower gas uptake value during the memory run.
The gas uptake behavior of the surfactant for fresh runs shows that as the SDS concentration increases, gas uptake increases and then remains constant, not varying significantly. From the experiments, it is also evident that gas uptake of SDS at higher concentrations is similar to hydrophobic amino acids. Gas uptakes for SDS at higher concentration and hydrophobic amino acids show distinctively higher value compare to water and hydrophilic amino acids. However, gas uptake drastically decreases for L-valine compared to L-methionine during memory runs. This is subject to further investigation.
There is similarly found in nucleation temperature and growth kinetics, reflected in the case of amino acids. It suggests that hydrophilic amino acids with charged side chains inhibit CO2 nucleation and growth kinetics due to the perturbation of liquid water molecules. It is known that kinetic hydrate inhibitors display different trends for nucleation kinetics and growth kinetics due to different surface phenomena [43]. However, in our research, it shows that the distinction between hydrophobic and hydrophilic behavior remains the same during nucleation and growth phases, thus confirm that hydrate formation capability of amino acids is independent of surface properties of the hydrate and connected with perturbation of the amino acids. Sa et al. have supported this conclusion previously in the case of hydrophilic amino acids with charged side chains [21].
Table 8 summarizes the gas uptake calculation for 20 and 30% CO2 in flue gas for a fresh run. Figure 6 represents the change in gas uptake due to the change in CO2 concentration in the CO2/N2 mixture. From the results, it is clear that the increase in CO2 concentration increases the gas uptake for all the solutions, including surfactant and amino acids. Final gas uptake is almost identical both for 20 and 30% CO2 flue gas for L-histidine and L-arginine, which confirms the inhibition effect of hydrophilic amino acids and their impact on gas uptake. The performance of hydrophobic amino acids remains similar to SDS at a higher percentage, irrespective of CO2 concentration in the flue gas. SDS under a large driving force and with a concentration between 1000 ppm to 3000 ppm is not able to show improvement in gas uptake. This could be due to the high solubility of SDS at large driving force (Pinj-Peq) and gas hydrate growth towards bulk liquid interfering with the hydrate growth by the capillary mechanisms [32].
Increasing the CO2 concentration from 20% to 30% does not improve the gas uptake values of hydrophilic amino acids, and, for 30 mole% CO2, normalized gas uptake remains below or equal to the pure water case.
To understand the growth profile difference between the surfactant and hydrophobic amino acids, pressure variation is plotted against time for SDS and amino acids for 120 min, as shown in Figure 7. Hydrate kinetics after nucleation is a function of heat and mass transfer. The large contact area between liquid and gas and quick heat dissipation is necessary to accelerate hydrate growth. At this stage, extensive hydrate formation and crystal agglomeration at the gas/water interface occurs. We have seen the rapid formation in the case of surfactant and hydrophobic amino acids but did not observe a similar rapid formation in the case of hydrophilic amino acids. Figure 7 confirms that L-methionine shows pressure variation that is very similar to SDS at 3000 ppm concentration. As the CO2 concentration increases, deviation in growth profile decreases. It is also visible through Figure 7 that within 120 min of the start of the experiment, the pressure is stabilized, and hydrate formation is saturated. L-valine has a lower hydrate formation rate compared to L-methionine, due to higher hydrophobicity of uncharged side chains in L-valine. Roosta et al. [28] have suggested that the CO2 hydrate formation rate decreases as the hydrophobicity of the uncharged side chain increases.

3.4. CO2 Recovery

CO2 recovery from flue gas in the form of gas hydrate can be quantified in terms of CO2 recovery, which is calculated and presented in Table 9 and Figure 8. Gas uptake and CO2 recovery rates are correlated, which suggests that amino acids assist the CO2 molecule in occupying the gas hydrate cages. It is also visible from the CO2 recovery that an increase in gas uptake results from an increase in CO2 recovery captured via hydrate formation. It is evident from the table that the increase in CO2 concentration leads to a decrease in CO2 recovery for SDS. This could be due to no effect of SDS on CO2 hydrate formation at the large driving force present due to high SDS concentration as well as higher CO2 concentration in flue gas [32]. On the contrary, an increase in CO2 concentration in CO2/N2 mixture lead to an increase in CO2 recovery hydrophobic and hydrophilic amino acids. Thus referring to the advantage of using amino acids over surfactant SDS for higher CO2 concentration gas stream such as CO2/H2.
By comparing the gas uptake and CO2 recovery analysis, due to the increase in CO2 concentration in flue gas, it is likely that an increase in gas uptake is contributed by the increase in CO2 recovery; however, overall CO2 recovery % reduces. Kumar et al. [15] have also suggested in the presence of surfactant, CO2 recovery, and separation not necessarily improve. In another study, Kumar et al. [7] have suggested that an increase in driving force leads to a decrease in CO2 recovery.

3.5. Review of the Role of Amino Acids during CO2 Hydrate Formation

In this study, amino acids have been selected based on the difference in their structure, polarity, and the difference in hydropathy indices. A literature review concerning the role of selected amino acids in CO2 hydrate formation is summarized in Table 10. To understand the role of an amino acid as a hydrate promoter or inhibitor, an important consideration is to understand the underlying mechanisms. It is proposed that amino acids do not interact with hydrate surface, reflected by similar nucleation and growth kinetics during flue gas hydrate formation in this study. The role of amino acids during the hydrate formation is explained by their ability to perturb liquid water structure. Sa et al. [21] have observed the perturbation of water structure in the presence of amino acids experimentally, and they studied the correlation of perturbation with CO2 hydrate nucleation temperature and gas uptake. With the help of Raman spectroscopic experiments, they have confirmed that strongly hydrophobic amino acids tend to strengthen the water structure while hydrophilic amino acids tend to cause perturbations in the water structure, weakening the hydrogen bonds of water molecules. This observation is also supported by another study where the extent of perturbation is found to be strongly correlated with hydrophobicity [39]. It has been previously found that water structures around charged side chain become less ice-like [44], and the hydrogen-bonding network around hydrophilic amino acids is disrupted, while around hydrophobic alkyl chains, it is strengthened.
Our experimental results also suggest that L-methionine is a more effective hydrate promoter and shows rapid hydrate growth compared to L-valine during the flue gas hydrate formation. The difference between L-valine and L-methionine is the hydrophobicity based on the hydropathy index. Both amino acids are nonpolar in nature; however, L-valine has higher hydrophobicity compare to L-methionine. Roosta et al. [28] have demonstrated that the inhibition effect of uncharged amino acid tends to increase with the increasing length of side chains; therefore, L-methionine is expected to be better CO2 hydrate promoter compared to L-valine due to lower hydrophobicity of the side chain. Cai et al. [45] have tested CO2 hydrate kinetics in the presence of L-methionine and found CO2 hydrate formation kinetics and hydrate storage capacity to be dramatically improved. The effect of different concentrations on the formation rate and storage capacity was studied, and it was found that 0.2 wt% of L-methionine gave the optimal performance. A key driver behind L-methionine promotion is due to optimal hydrophobic chain length and higher synergy between hydrophobic and carboxyl groups.
L-histidine has shown an inhibition effect during flue gas hydrate formation. The inhibition effect can be explained due to the presence of a high net charge on L-histidine (1.0005 at pH = 3.77, 2851.5 K, and 30 bar) [28]. Due to this net charge on the side chain, L-histidine interacts strongly with water molecules at the hydrate surface. It is also possible that water molecules around charged L-histidine or charged side chains are less likely to form a hydrate. Therefore, the nucleation and growth of CO2 hydrate are decreased [28].
Bavoh et al. [46] have studied L-arginine as an inhibitor for CO2 hydrate formation and modeled the CO2 hydrate phase boundaries. It was observed that the phase diagram shifted to higher pressure and lower temperature in the presence of L-arginine, and it is classified as a thermodynamic inhibitor. By calculating CO2 hydrate dissociation enthalpy, they have concluded that the amino acid does not participate in cage occupation or structure during the hydrate formation.

4. Conclusions

Experiments were conducted in two temperature scheme to compare the hydrate formation capabilities of four selected amino acids with water and surfactant SDS during flue gas hydrate formation. Hydrophobic amino acids perform better than pure water and hydrophilic amino acids. This difference is due to their different perturbation effects on the water structure around the side chain. As CO2 concentration is increased, the hydrate promotion effect in all solutions improved. SDS performance at lower concentrations (500–1000 ppm) was observed to be weak and similar to water; however, at higher concentrations, the performance is improved reflected by lower induction time. At higher concentration (from 1000 ppm–3000 ppm), increase in CO2 concentration in flue gas, do not increase gas uptake for SDS. At 3000 ppm concentration, L-methionine showed the best promotion ability among hydrophobic amino acids and very similar to SDS (1000–3000ppm) in terms of nucleation and growth kinetics. All tested solutions show a strong memory effect during induction time measurements, but they eliminated the memory effect for gas uptake and nucleation kinetics. The results highlight the potential of hydrophobic amino acids as environmentally friendly alternatives to SDS for CO2 capture, as amino acids are green in nature, being cheap, non-toxic, and biodegradable. Pressure requirements to form flue gas hydrate are very high to be adopted at commercial scale; therefore, hydrophobic amino acids with thermodynamic promoters could provide the more eco-friendly solution for CO2 capture by forming flue gas hydrates at moderate operational requirements and faster formation kinetics. The results also highlight the role of L-histidine and L-arginine as an inhibitor and could be of interest as a potential hydrate inhibitor in the oil and gas industry. The application of the rocking cell provides standardization during the experimental investigation. Overall, the results would help in understanding the role of amino acids and surfactants for flue gas hydrate formation to increase efficiency and reduce the costs.

Author Contributions

Conceptualization, methodology, investigation, writing—original draft preparation, and review and editing: J.S.P.; formal analysis, investigation, and editing: Y.J.D.; review and editing, supervision, project administration, and funding acquisition: N.v.S. All authors have read and agreed to the published version of the manuscript.

Funding

This research is funded by The Danish Council for Independent Research.

Conflicts of Interest

The authors declare no conflict of interest.

References

  1. Boot-Handford, M.E.; Abanades, J.C.; Anthony, E.J.; Blunt, M.J.; Brandani, S.; Mac Dowell, N.; Fernández, J.R.; Ferrari, M.C.; Gross, R.; Hallett, J.P.; et al. Carbon capture and storage update. Energy Environ. Sci. 2014, 7, 130–189. [Google Scholar] [CrossRef]
  2. Parrenin, F.; Masson-Delmotte, V.; Köhler, P.; Raynaud, D.; Paillard, D.; Schwander, J.; Barbante, C.; Landais, A.; Wegner, A.; Jouzel, J. Synchronous change of atmospheric CO2and antarctic temperature during the last deglacial warming. Science 2013, 339, 1060–1063. [Google Scholar] [CrossRef]
  3. Dashti, H.; Yew, L.Z.; Lou, X. Recent advances in gas hydrate-based CO2 capture.pdf. J. Nat. Gas Sci. Eng. 2015, 23, 195–207. [Google Scholar] [CrossRef] [Green Version]
  4. Babu, P.; Linga, P.; Kumar, R.; Englezos, P. A review of the hydrate based gas separation (HBGS) process for carbon dioxide pre-combustion capture. Energy 2015, 85, 261–279. [Google Scholar] [CrossRef]
  5. Aaron, D.; Tsouris, C. Separation of CO2 from flue gas: A review. Sep. Sci. Technol. 2005, 40, 321–348. [Google Scholar] [CrossRef]
  6. Linga, P.; Kumar, R.; Englezos, P. The clathrate hydrate process for post and pre-combustion capture of carbon dioxide. J. Hazard. Mater. 2007, 149, 625–629. [Google Scholar] [CrossRef]
  7. Kumar, R.; Linga, P.; Englezos, P. Pre and post combustion capture of carbon dioxide via hydrate formation. In Proceedings of the 2006 IEEE EIC Climate Change Conference, Ottawa, ON, Canada, 10–12 May 2006; pp. 1–7. [Google Scholar]
  8. Kang, S.P.; Lee, H. Recovery of CO2 from flue gas using gas hydrate: Thermodynamic verification through phase equilibrium measurements. Environ. Sci. Technol. 2000, 34, 4397–4400. [Google Scholar] [CrossRef]
  9. Ho, L.C.; Babu, P.; Kumar, R.; Linga, P. HBGS (hydrate based gas separation) process for carbon dioxide capture employing an unstirred reactor with cyclopentane. Energy 2013, 63, 252–259. [Google Scholar] [CrossRef]
  10. Tang, J.; Zeng, D.; Wang, C.; Chen, Y.; He, L.; Cai, N. Study on the influence of SDS and THF on hydrate-based gas separation performance. Chem. Eng. Res. Des. 2013, 91, 1777–1782. [Google Scholar] [CrossRef]
  11. Lee, W.; Kim, Y.S.; Kang, S.P. Semiclathrate-based CO2capture from fuel gas in the presence of tetra-n-butyl ammonium bromide and silica gel pore structure. Chem. Eng. J. 2018, 331, 1–7. [Google Scholar] [CrossRef]
  12. He, Y.; Sun, M.-T.; Chen, C.; Zhang, G.-D.; Chao, K.; Lin, Y.; Wang, F. Surfactant-based promotion to gas hydrate formation for energy storage. J. Mater. Chem. A 2019, 7, 21634–21661. [Google Scholar] [CrossRef]
  13. Linga, P.; Kumar, R.; Englezos, P. Gas hydrate formation from hydrogen/carbon dioxide and nitrogen/carbon dioxide gas mixtures. Chem. Eng. Sci. 2007, 62, 4268–4276. [Google Scholar] [CrossRef]
  14. Daraboina, N.; Ripmeester, J.; Englezos, P. The impact of SO2 on post combustion carbon dioxide capture in bed of silica sand through hydrate formation. Int. J. Greenh. Gas Control 2013, 15, 97–103. [Google Scholar] [CrossRef]
  15. Kumar, A.; Sakpal, T.; Linga, P.; Kumar, R. Impact of fly ash impurity on the hydrate-based gas separation process for carbon dioxide capture from a flue gas mixture. Ind. Eng. Chem. Res. 2014, 53, 9849–9859. [Google Scholar] [CrossRef]
  16. Pandey, J.S.; Solms, N. von Hydrate Stability and Methane Recovery from Gas Hydrate through CH4–CO2 Replacement in Different Mass Transfer Scenarios. Energies 2019, 12, 2309. [Google Scholar] [CrossRef] [Green Version]
  17. Scott, M.J.; Jones, M.N. The biodegradation of surfactants in the environment. Biochim. Biophys. Acta Biomembr. 2000, 1508, 235–251. [Google Scholar] [CrossRef] [Green Version]
  18. Sa, J.H.; Lee, B.R.; Park, D.H.; Han, K.; Chun, H.D.; Lee, K.H. Amino acids as natural inhibitors for hydrate formation in CO2 sequestration. Environ. Sci. Technol. 2011, 45, 5885–5891. [Google Scholar] [CrossRef]
  19. Sa, J.H.; Kwak, G.H.; Lee, B.R.; Park, D.H.; Han, K.; Lee, K.H. Hydrophobic amino acids as a new class of kinetic inhibitors for gas hydrate formation. Sci. Rep. 2013, 3, 1–7. [Google Scholar] [CrossRef]
  20. Sa, J.H.; Kwak, G.H.; Lee, B.R.; Ahn, D.; Lee, K.H. Abnormal incorporation of amino acids into the gas hydrate crystal lattice. Phys. Chem. Chem. Phys. 2014, 16, 26730–26734. [Google Scholar] [CrossRef] [Green Version]
  21. Sa, J.H.; Kwak, G.H.; Han, K.; Ahn, D.; Lee, K.H. Gas hydrate inhibition by perturbation of liquid water structure. Sci. Rep. 2015, 5, 1–9. [Google Scholar] [CrossRef] [Green Version]
  22. Alireza Bagherzadeh, S.; Alavi, S.; Ripmeester, J.A.; Englezos, P. Why ice-binding type i antifreeze protein acts as a gas hydrate crystal inhibitor. Phys. Chem. Chem. Phys. 2015, 17, 9984–9990. [Google Scholar] [CrossRef]
  23. Prasad, P.S.R.; Kiran, B.S. Are the amino acids thermodynamic inhibitors or kinetic promoters for carbon dioxide hydrates? J. Nat. Gas Sci. Eng. 2018, 52, 461–466. [Google Scholar] [CrossRef]
  24. Lal, B.; Mukhtar, H.; Bavoh, C.B.; Osei, H.; Sabil, K.M. A Review on the Role of Amino Acids in Gas Hydrate Inhibition, CO2 Capture and Sequestration, and Natural Gas Storage. J. Nat. Gas Sci. Eng. 2019, 64, 52–71. [Google Scholar]
  25. Pandey, J.S.; Daas, Y.J.; Solms, N. Von Insights into Kinetics of Methane Hydrate Formation in the Presence of Surfactants. Processes 2019, 7, 598. [Google Scholar] [CrossRef] [Green Version]
  26. Lone, A.; Kelland, M.A. Exploring kinetic hydrate inhibitor test methods and conditions using a multicell steel rocker rig. Energy Fuels 2013, 27, 2536–2547. [Google Scholar] [CrossRef]
  27. Kyte, J.; Doolittle, R.F. A simple method for displaying the hydropathic character of a protein. J. Mol. Biol. 1982, 157, 105–132. [Google Scholar] [CrossRef] [Green Version]
  28. Roosta, H.; Dashti, A.; Mazloumi, S.H.; Varaminian, F. Inhibition properties of new amino acids for prevention of hydrate formation in carbon dioxide-water system: Experimental and modeling investigations. J. Mol. Liq. 2016, 215, 656–663. [Google Scholar] [CrossRef]
  29. Betts, M.J.; Russell, R.B. Amino Acid Properties and Consequences of Substitutions. In Bioinformatics for Geneticists; John Wiley & Sons, Ltd.: Hoboken, NJ, USA, 2003; pp. 289–316. ISBN 9780470867303. [Google Scholar]
  30. Mukerjee, P.; Mysels, K.J. Critical micelle concentrations of aqueous surfactant systems. J. Pharm. Sci. 1972, 61, 319. [Google Scholar]
  31. Roosta, H.; Varaminian, F.; Khosharay, S. Experimental study of CO2 hydrate formation kinetics with and without kinetic and thermodynamic promoters. Sci. Iran. 2014, 21, 753–762. [Google Scholar]
  32. Molokitina, N.S.; Nesterov, A.N.; Podenko, L.S.; Reshetnikov, A.M. Carbon dioxide hydrate formation with SDS: Further insights into mechanism of gas hydrate growth in the presence of surfactant. Fuel 2019, 235, 1400–1411. [Google Scholar] [CrossRef]
  33. Kang, S.; Lee, J. Kinetic behaviors of CO 2 hydrates in porous media and effect of kinetic promoter on the formation kinetics. Chem. Eng. Sci. 2010, 65, 1840–1845. [Google Scholar] [CrossRef]
  34. Jiang, L.L.; Li, A.R.; Xu, J.F.; Liu, Y.J. Effects of SDS and SDBS on CO2Hydrate Formation, Induction Time, Storage Capacity and Stability at 274.15 K and 5.0 MPa. ChemistrySelect 2016, 1, 6111–6114. [Google Scholar] [CrossRef]
  35. Kelland, M.A. History of the development of low dosage hydrate inhibitors. Energy Fuels 2006, 20, 825–847. [Google Scholar] [CrossRef]
  36. Sloan, E.D.; Koh, C.A.; Koh, C. Clathrate Hydrates of Natural Gases, 3rd ed.; CRC Press: Boca Raton, FL, USA, 2007. [Google Scholar]
  37. Sloan, E.D.; Subramanian, S.; Matthews, P.N.; Lederhos, J.P.; Khokhar, A.A. Quantifying hydrate formation and kinetic inhibition. Ind. Eng. Chem. Res. 1998, 37, 3124–3132. [Google Scholar] [CrossRef]
  38. Seo, Y.T.; Moudrakovski, I.L.; Ripmeester, J.A.; Lee, J.W.; Lee, H. Efficient recovery of CO2 from flue gas by clathrate hydrate formation in porous silica gels. Environ. Sci. Technol. 2005, 39, 2315–2319. [Google Scholar] [CrossRef] [Green Version]
  39. Ide, M.; Maeda, Y.; Kitano, H. Effect of hydrophobicity of amino acids on the structure of water. J. Phys. Chem. B 1997, 101, 7022–7026. [Google Scholar] [CrossRef]
  40. Uchida, T.; Hirano, T.; Ebinuma, T.; Narita, H.; Gohara, K.; Mae, S.; Matsumoto, R. Raman spectroscopic determination of hydration number of methane hydrates. AIChE J. 1999, 45, 2641–2645. [Google Scholar] [CrossRef]
  41. Partoon, B.; Malik, S.N.A.; Azemi, M.H.; Phase, K.M.S. Experimental investigations on the potential of SDS as low-dosage promoter for carbon dioxide hydrate formation. ASIA-PACIFIC J. Chem. Eng. 2013, 8, 916–921. [Google Scholar] [CrossRef]
  42. Kumar, A.; Bhattacharjee, G.; Kulkarni, B.D.; Kumar, R. Role of Surfactants in Promoting Gas Hydrate Formation. Ind. Eng. Chem. Res. 2015, 54, 12217–12232. [Google Scholar] [CrossRef]
  43. Ohno, H.; Susilo, R.; Gordienko, R.; Ripmeester, J.; Walker, V.K. Interaction of antifreeze proteins with hydrocarbon hydrates. Chem. A Eur. J. 2010, 16, 10409–10417. [Google Scholar] [CrossRef]
  44. Sharp, K.A.; Madan, B. Hydrophobic effect, water structure, and heat capacity changes. J. Phys. Chem. B 1997, 101, 4343–4348. [Google Scholar] [CrossRef]
  45. Cai, Y.; Chen, Y.; Li, Q.; Li, L.; Huang, H.; Wang, S.; Wang, W. CO2 Hydrate Formation Promoted by a Natural Amino Acid l-Methionine for Possible Application to CO2 Capture and Storage. Energy Technol. 2017, 5, 1195–1199. [Google Scholar] [CrossRef]
  46. Bavoh, C.B.; Partoon, B.; Lal, B.; Gonfa, G.; Foo Khor, S.; Sharif, A.M. Inhibition effect of amino acids on carbon dioxide hydrate. Chem. Eng. Sci. 2017, 171, 331–339. [Google Scholar] [CrossRef]
  47. Prasad, P.S.R.; Sai Kiran, B. Clathrate Hydrates of Greenhouse Gases in the Presence of Natural Amino Acids: Storage, Transportation and Separation Applications. Sci. Rep. 2018, 8, 1–10. [Google Scholar] [CrossRef] [PubMed]
Figure 1. Schematic diagram of the rocking cell-5 apparatus.
Processes 08 00124 g001
Figure 2. Flue gas (30 mole% CO2) hydrate formation in the presence of amino acids: P-T variation during constant ramping scheme for selected amino acid during flue gas hydrate formation with 30% CO2.
Processes 08 00124 g002
Figure 3. Flue gas (20 mole% CO2) hydrate formation in the presence of amino acids at 1 °C: P-T variation during isothermal experiments for selected amino acid during flue gas hydrate formation.
Processes 08 00124 g003
Figure 4. Subcooling kinetics in presence of amino acids and surfactant. Subcooling temperatures at the onset of the flue gas hydrate formation with amino acids and surfactant. (a) Subcooling temperature for 20% mole CO2 for sodium dodecyl sulfate (SDS) at different concentration (fresh and memory). (b) Subcooling temperature for 20 and 30 mole% CO2 for SDS at different concentration (fresh). (c) Subcooling temperature for 20% mole CO2 for amino acids at different concentration (fresh and memory). (d) Subcooling temperature for 20 and 30 mole% CO2 for amino acids at different concentration (fresh).
Processes 08 00124 g004
Figure 5. Gas uptake (Fresh and Memory)-20% CO2: Gas uptake analysis for 20% CO2 and effect of surfactant and different amino acids on the gas uptake for flue gas hydrate formation (20% CO2) measured during an isothermal experiment conducted at 120 bar and 1 °C recorded both for fresh and memory samples.
Processes 08 00124 g005
Figure 6. Gas uptake for fresh run (20% CO2 and 30% CO2). Gas uptake during fresh runs for 20 and 30 mole% CO2 with SDS and amino acid.
Processes 08 00124 g006
Figure 7. Pressure vs. time variation surfactant and amino acid at isothermal temp 1 °C. (a) Pressure vs. time curve surfactant (SDS 3000 ppm and SDS 1000 ppm) and amino acid (L-valine and L-methionine) for 20 mole% CO2 at pressure 120 bar and 1 °C. (b) Pressure vs time curve surfactant (SDS 3000 ppm and SDS 1000 ppm) and amino acid (L-valine and L-methionine) for 30 mole% CO2 at pressure 120 bar and 1 °C.
Processes 08 00124 g007
Figure 8. Effect on CO2 recovery % due to the change in CO2 concentration in the Flue gas. Change in CO2 recovery % for surfactant and selected amino acids due to change in CO2 mole % in the feed gas, measured during an isothermal experiment conducted at 120 bar, 1 °C.
Processes 08 00124 g008
Table 1. Classification of selected amino acids and their chemical formula.
#NameSide Chain PolaritySide ChainMolecular FormulaMWeight (g/mol)Hydropathy Index Kyte et al. [27]
1L-valineNon-polar-CH(CH3)2C5H11NO2117.154.2
2L methionineNon-polar-CH3-S-(CH2)2C5H11NO2S149.211.9
3L-histidineBasic polar. aromatic side chain-CH2C3H3N2C6H9N3O2155.16−3.2
4L-arginineBasic polar. aliphatic side chainHN=C(NH2)-NH(-CH2)3C6H14N4O2174.20−4.5
Table 2. Selected amino acids and their chemical properties.
NameWater Solubility (g/L)Acidity (pH)Pka Alpha CarboxyPka Alpha AminoPka Side ChainpHIsoelectric Point
L-valine58.5Neutral2.329.62 6.625.96
L-methionine56.6Neutral2.289.21 6.765.74
L-histidine45.6Basic (weak)1.829.176.047.647.59
L-arginine182Basic (strong)2.179.0412.4810.3111.15
Table 3. Experimental plans for constant ramping.
Promoters10% CO2/90% N220% CO2/80% N230% CO2/70% N2
TrialsTrialsTrials
Water-44
SDS121
Amino Acid121
Table 4. Experimental plans for isothermal experiments.
20% CO2/80% N230% CO2/70% N2
Concentration (ppm)Fresh RunsFresh + Memory RunFresh RunsFresh + Memory Run
Water0 44-
SDS500211-
1000
2000
3000
Amino Acid L-valine211-
L-methionine
L-histidine
L-arginine
Table 5. Effect of change in CO2 concentration on onset temperature (To) during fresh (Fr) and memory (Me) run for 10 mL solution at initial pressure 120 bar in constant ramping temperature scheme.
Onset Nucleation Temperature and Sucooling (ΔTo) in °C
20% CO2/80% N230% CO2/70% N2
FrMeFrMeFrMeFrMe
Teq 6.34 8.32
Concentration (ppm) ΔTsub,frΔTsub,me ΔTsub,frΔTsub,me
water04.104.102.242.245.805.702.522.62
SDS5003.853.652.492.694.904.803.423.52
10004.053.802.292.545.905.502.422.82
20005.805.200.541.146.005.702.322.62
30004.253.802.092.545.004.903.323.42
Amino AcidL-valine5.405.300.941.045.805.702.522.62
L-methionine4.604.651.741.695.705.402.622.92
L-histidine3.904.052.442.295.905.802.422.52
L-arginine4.254.252.092.095.805.702.522.62
Table 6. Effect of CO2% on induction time measurement. Induction time is measured for SDS and amino acids during fresh and memory run. Initial pressure and temperature conditions are 120 bar and 1 °C.
Induction Time (to) (in mins)
20% CO2/80% N230% CO2/70% N2
FreshMemoryFreshMemory
Concentration (ppm)
Water0No hydraeNo hydrateNo hydrate-
SDS500No hydraeNo hydrateNo hydrate-
100072.57027-
2000144.513.5-
3000412-
Amino AcidL-valine443035-
L-methionine4.522-
L-histidineNo hydrae35No hydrate-
L-arginineNo hydrae35.5No hydrate-
Table 7. Gas uptake calculations for 20% CO2 in CO2/N2 mixture for both fresh and memory runs. Starting conditions are Pi = 120 bar and Top = 1 °C. Gas chromatography (GC) analysis is carried out after fresh and memory run to measure the moles of CO2 and N2 left in the gas phase after hydrate formed. Peq for 20% CO2 at 1 °C is calculated as 56.85 bar for pure water using CSMGem.
20 % CO2/80 % N2
Fresh RunMemory Run
nFluegasPf (bar)Pi-Pf (bar)Δnfluegas (mole/mole)Pf (bar)Pi-Pf (bar)Δnfluegas (mole/mole)
Pinj120
Peq (20% CO2)56.85
Pi-Peq63.16
Concentration (ppm)
110.319.690.03110.479.530.03
Water00.18110.189.820.03109.9510.050.02
SDS5000.1898.2921.710.0698.3221.680.05
10000.1898.7821.220.0698.5921.410.05
20000.1898.7121.290.0698.8121.190.05
30000.18104.1515.850.07110.169.840.04
Amino acidL-valine0.18102.9417.060.0799.7520.250.06
L-methioine0.18108.3911.610.04110.129.880.05
L-histidine0.18109.0610.940.03110.639.370.03
L-arginine0.18110.319.690.03110.479.530.03
Table 8. Gas uptake calculations for 20% CO2/80% N2 and 30% CO2/70% N2 for fresh runs. Starting conditions are Pi = 120 bar and Top = 1 °C. GC analysis is carried out after a fresh run to measure the moles of CO2 and N2 left in the gas phase after hydrate formed. Peq for 20% CO2/80% N2 at 1 °C is calculated as 56.85 bar for pure water using CSMGem.
20% CO2/80% N2 (Fresh)30% CO2/70% N2 (Fresh)
nFluegasPf (bar)Pi-Pf (bar)Δnfluegas (mole/mole)Pf (bar)Pi-Pf (bar)Δnfluegas (mole/mole)
Pinj (bar)120
Peq (20% CO2)56.84
Peq (30% CO2)41.45
Pi-Peq (20% CO2)63.16
Pi-Peq (30% CO2)78.55
Concentration (ppm)
Water00.18110.319.690.03110.509.500.05
SDS5000.19110.189.820.03110.789.220.05
10000.1998.2921.710.0690.4029.600.11
20000.1998.7821.220.0690.6829.320.11
30000.1998.7121.290.0690.3129.690.11
Amino AcidL-valine0.18104.1515.850.0792.5227.480.11
L-methionine0.18102.9417.060.0791.7428.260.11
L-histidine0.18108.3911.610.04111.968.040.04
L-arginine0.18109.0610.940.03110.689.320.04
Table 9. CO2 recovery rate calculated in the presence of different solution including SDS and selected amino acids.
CO2 20%/80% N2 (Fresh)CO2 30%/70% N2 (Fresh)
Concentration (ppm)Moles of CO2 InjectedMole of CO2 Remain in GasCO2 RecoveryMoles of CO2 InjectedA Mole of CO2 Remain in GasCO2 Recovery
Water00.040.0328%0.060.0434%
SDS5000.040.0254%0.060.0436%
10000.030.0172%0.060.0175%
20000.030.0180%0.060.0175%
30000.030.0184%0.060.0176%
Amino AcidL-valine0.040.0160%0.060.0182%
L-methionine0.040.0257%0.060.0175%
L-histidine0.040.0329%0.060.0438%
L-arginine0.040.0324%0.060.0433%
Table 10. Literature review of selected amino acids for CO2 hydrate formation.
#Amino AcidGas TestedTest TypeConcentrationPressure & TemperatureReferenceRemarks
1.1L-valineCO2THI0.1–0.5 mole %273.05–281.45 K, 14.1–35.2 bar[18]Phase equilibrium conditions reported,
The shift in CO2 hydrate phase equilibrium to higher pressure and lower temperature is recorded
L-valine solubility equal to 0.884 at 298.15 K and 0.763 at 273.15 K.
Amino acid solubility in water affects the inhibition capability.
THI function by lowering the water activity by associating with water molecules via hydrogen bonding.
Increase in inhibiting effect increase with the increase in the size of the alkyl chain
1.2L-valineCO2KHI0.1 mole %36 bar, 284.05 K Isothermal 273.45 K[19]Inhibition is two types, absorption-based and perturbation inhibition
Most of the amino acids are zwitterions during CO2 and interact with water due to strong electrostatic interaction generated by an electric charge on these molecules. The water structure around the electric charge becomes less ice-like.
Less significant inhibition impacts due to the longer hydrophobic chain, thus increase hydrate promotion.
1.3L-valineCO2KHP0. 5 wt%33 bar, 298 K[23]The ability to inhibit the hydrate crystals decrease at higher mole fraction and at higher hydropathy index, reduction of THI capability observed.
At higher concentrations, it is found that amino acids tend to crystallize.
L-valine show 20% higher gas uptake than pure CO2 system under stirred conditions.
2.1L-methionineCO2KHP + XRD0.5 wt%53 bar, 275 K[23,47]Gas uptake 20% more than pure CO2 system.
90% of gas consumption in less than 45 min
L-valine gas consumption takes double the time of the methionine system. L-methionine show highest gas uptake
Near identical gas uptake in the stirred and unstirred system for L-methionine
2.2L-methionineCO2KHP0.02–1 wt%33 bar, 273.2 K[45]The presence of salt decreases the hydrate formation capability.
Impurities in CO2 could have an impact on the CO2 hydrate formation.
Significantly promote hydrate formation uptake without stirring
Induction time equal to 15 min for 90% if gas consumption
The amphiphilic molecule acts as a dispersant to prevent hydrate particle agglomeration, and the overall formation mechanism consists of hydrate film development at gas-liquid interface, nucleation at gas-liquid interface, growth of hydrate crystal as porous structure, and capillary action to promote growth.
3.1L-histidineCO2KHI+ Polarised Raman Spectroscopy0.1 mol %35 bar, 283.15 K[21]Experimental studies were carried out to study the perturbation of water in the presence of water. L-histidine display high hydrate inhibition effect caused by the perturbation of water structure. Perturbation is directly correlated with hydrophobicity.
3.2L-histidineCO2KHI + Spectroscopy0.5–2 wt%30 bar, 275.15 K[28]L-histidine show higher inhibition effect than glycine.
The inhibition effect of the charged side chain is more than an uncharged side chain with a polar or non-polar group.
Inhibition could be due to oxygen atom on carbonyl group forming a hydrogen bond with water or charged side chain forming van der Waal interaction/electrostatic with crystal surface and therefore interrupting nucleation/disrupt growth.
The chemical affinity model is used to quantify the kinetic parameter.
L-histidine based CO2 hydrate formation rate decrease with increasing concentration. Concentration range dependent on the amino acids.
CO2 hydrate formation rate decrease with increasing hydrophobicity of un charge side chain in amino acids.
4.1L-arginineCO2THI10 wt%25.3–40 bar, 278.32–281.57 K[46]COSMO RS is used; the heat of dissociation is calculated to be 60.28 KJ/mole
Inhibit CO2 hydrate formation, and inhibition effect is independent of the guest molecule and due to intermolecular forces. A higher alkyl chain in L-arginine leads to lower inhibition effect compare to glycine.

