Abstract
The objective of this paper was to develop a prediction tool for the burden distribution in a charging process of a bell-less-type blast furnace using the discrete element method (DEM). The particle behavior on the rotating chute and on the burden surface was modeled, and the burden distribution was analyzed. Furthermore, the measurements of the burden distribution in a 1/3-scale experimental blast furnace were performed to validate the simulated results. Particle size segregation occurred during conveying to the experimental blast furnace. The smaller particles were initially discharged followed by the larger ones later. This result was used as an input in the simulation. The burden profile simulated using DEM was similar to the experimental one. The terrace was found at the burden surface subsequent to ore-charging, and its simulated position simulated agreed with that of the experimental result. The surface angle of the ore layer was mostly similar. The simulated ore to coke mass ratio (O/C) distribution in the radial direction and the mean particle diameter distribution correlated with the experimental results very well. It can be concluded that this method of particle simulation of the bell-less charging process is highly reliable in the prediction of the burden distribution in a blast furnace.
1. Introduction
A blast furnace is a reactor with approximately 5000 m3 of volume to produce pig iron from ore particles. Iron ore (sinter, lump, and pellet) and coke particles are alternately stacked at the topmost layer of the blast furnace, and the hot gas is blown from tuyeres at the bottom of the furnace. Iron ore particles are reduced during the descent, and numerous physical changes and chemical reactions occur between each phase over this period. Thus, it is an extremely complicated system, resulting in the possibility of unfavorable phenomena or serious problems occurring. To avoid these problems, controlling and stabilizing the gas flow in the furnace is of utmost importance because the gas plays a key role for the reduction and the heat source. Thus, keeping the gas flow in the steady state leads to an efficient and low RAR (reducing agent ratio) operations. Therefore, controlling a void fraction in the stacked layer, i.e., the burden distribution at the top of the blast furnace, is the most effective operation for stabilizing the gas flow. Much research has been experimentally conducted and some mathematical models have been proposed to estimate and control the burden distribution [1,2,3,4,5]. These models can give useful information in the daily operation. However, many kinds of particles are usually mixed in ore charging to help the reduction; therefore, it is necessary to analyze the individual solid particles’ behavior in the blast furnace for an in-depth analysis of several phenomena that were previously mentioned. The discrete element method (DEM) [6] is one of the most reliable simulation methods for analysis of the solid particle behavior, and an approach using the computational simulation based on DEM is extremely useful to grasp the phenomena found in the charging process of the blast furnace. Some studies on the modeling of solid flow in a blast furnace have been previously reported, for example, the raceway [7,8], solid flow in the blast furnace [9,10,11], gas–solid flow [12], hopper flow [13,14], and particle trajectory from the rotating chute [15], and authors have developed burden distribution simulators using DEM [16,17,18,19,20]. Validations of the particle trajectory discharged from the rotating chute were studied, and they showed good correlations [19,20]. This simulator still remains a key issue to validate the simulated burden distribution with experimental results in detail.
In this paper, charging tests were performed using a 1/3-scale experimental burden distribution simulator of the blast furnace to validate the simulated results, and the particle size segregation and ore to coke mass ratio (O/C) were investigated. Furthermore, the particle flow during charging into the experimental blast furnace was modeled using DEM, and the results were compared with the experimental ones.
2. Experimental
A 1/3-scale experimental burden distribution simulator, which is shown in Figure 1, was used herein. It is a bell-less-type blast furnace and it has approximately a 3.7-m throat diameter and approximately a 10-m height. Furthermore, it has a surge hopper, parallel hoppers, and a discharging funnel. A horseshoe-shaped rotating chute with a length of 1.7 m is installed at the top of the furnace. A blower and a discharging unit are installed at the bottom of the furnace to assess the effects of the gas flow and the burden descending. Figure 2 shows the detailed schematic illustration of the experimental apparatus.
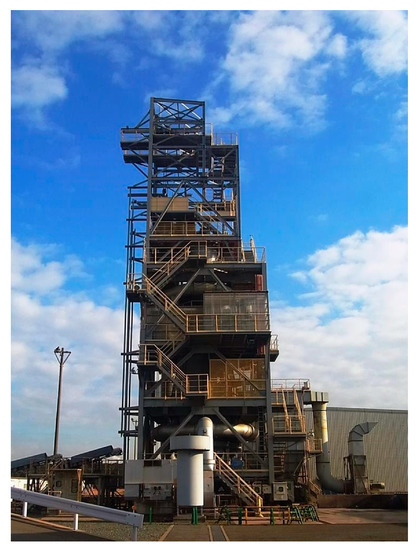
Figure 1.
Picture of the 1/3-scale experimental burden distribution simulator.
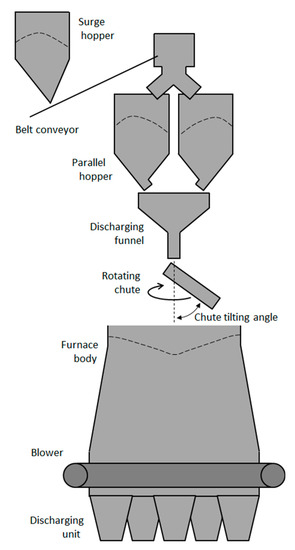
Figure 2.
Schematic illustration of the 1/3-scele experimental burden distribution simulator.
Sinter particles were conveyed to the top of the experimental blast furnace via a surge hopper, one of the parallel hoppers, and a discharging funnel, as shown in Figure 2. The sinter, which were sieved in the range 5–20 mm (d50 = 11.4 mm), were used in this charging test. The particle size distribution is shown in Figure 3. In total, 5500 kg of sinter was charged into the experimental blast furnace during 15 rotations at 13.4 rpm. Table 1 shows a charging pattern of coke and ore dumps. The gas was not blown in this experiment to simplify the phenomena.
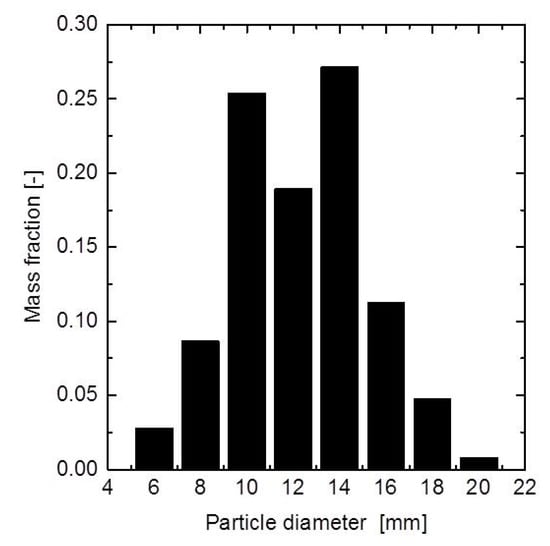
Figure 3.
Distribution of the particle diameter of the sinter.

Table 1.
Charging conditions for the rotating chute.
Subsequent to charging, a burden surface profile was measured with a laser distance meter. Moreover, the burden was dug up using a vacuum cleaner to obtain the ore to coke mass ratio (O/C) and the particle size distribution. The area that was dug up was rectangular (200 mm × 262 mm) from the furnace wall to its center for seven divisions, and the digging-up depth was every 50 mm, as shown in Figure 4. This was carefully performed to avoid breaking the particle-packing structure. The burden was removed by a large vacuum cleaner, except for the sampling area, before digging up. That is to say, the sampling area became the highest in the burden. The digging up was carried out from the highest position, thus collapse did not occur. Subsequently, the particles were sieved and weighed. The sinter particles, which were discharged from the funnel, were also sampled to check the particle size segregation during conveying to the top of the furnace. This gave the time evolution of the particle size distribution that was used as input of the DEM calculation.
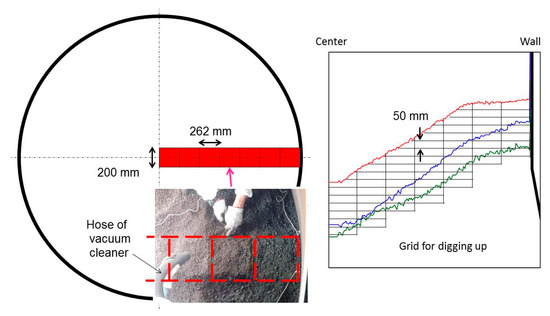
Figure 4.
Schematic illustration of the digging-up operation.
3. Simulation
3.1. Discrete Element Method
DEM is one of the most popular and reliable simulation methods for the numerical analysis of particle behavior. This simulation method comprises an idea for determining the kinematic force to each finite-sized particle. The key calculation of DEM comprises three steps; i.e., (1) contact detection, (2) calculation of forces, and (3) updating the trajectories, and these processes are looped until t = tmax. The contact between two particles is given using Voigt model, which consists of a spring dashpot and a slider for the friction in the tangential component. The contact forces, Fn and Ft, are calculated using:
where K and η are the spring and damping coefficients, ∆u and ∆φ are the relative translational displacement of the gravitational center between two particles and the relative displacement at the contact point caused by the particle rotation, μ is the frictional coefficient, and nij and tij denote the unit vector from i-th particle to the j-th one in the normal and the tangential components. The subscript “n” and “t” denote the normal and the tangential components. The translational and rotational motions of each particle are updated using:
where v is the vector of a particle velocity, F is the contact force acting on a particle, m and g are the mass of a particle and the gravitational acceleration, ω is the vector of the angular velocity, and M and I are the moment caused by the tangential force and the moment of inertia.
The shape of granular material in DEM is usually assumed to be spherical to simplify the contact detection and the calculation of the contact force, although the shape of the sinter particle is not spherical. The best solution for considering the particle shape in DEM is to model the exact particle shape using polyhedra. However, this calculation is extremely laborious, and it is unsuitable for the simulation of particle flow in the ironmaking process where the number of particles could be in the billions. Thus, the effect of the particle shape on the motion was considered by setting a proper rolling friction for the particle, and it is given by:
where b is the radius of the contact area and αi is the coefficient of the rolling friction. Every particle has different αi, because the shapes of the sinter are totally different from each other. Its distribution is related with the rollability of the particle [16], and it is shown in Figure 5. The method of having different rolling friction provides a significant agreement with the experimental results [16]; therefore, this method was applied here.
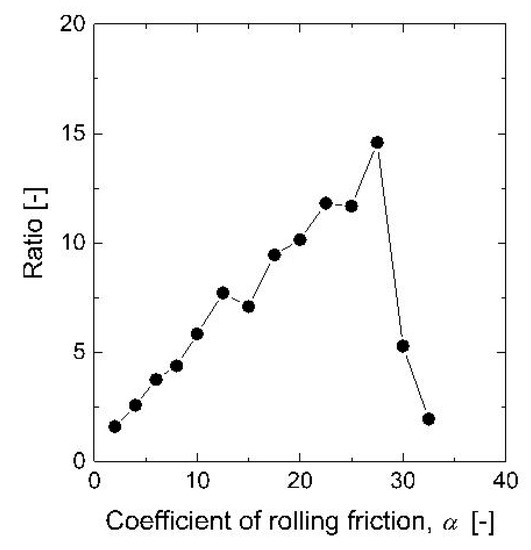
Figure 5.
Distribution of the coefficient of the rolling friction [16].
3.2. Simulation Conditions
The particle behavior during charging into the experimental blast furnace was simulated using DEM, and the burden distribution was compared with the experimental results to validate the simulation results. The geometry of the rotating chute and the throat of the furnace were identical to those of the experimental results, and 5500 kg of sinter particles, with a particle density of 3300 kg/m3, were charged into the furnace. The size of sinter particle was 6 to 20 mm, and its particle size distribution corresponded to Figure 3. The total number of sinter particles was 2,545,086, and the detailed particle condition is tabulated in Table 2. Young’s modulus and Poisson’s ratio were assumed to be 3.5 GPa and 0.25, respectively. Only the ore-charging process was executed in the simulation, i.e., the coke layer prior to ore charging was arranged at the top of the furnace corresponding to the surface profile subsequent to coke charging in the experimental test. The particle diameter of coke is 7.5 to 30 mm; its density, Young’s modulus, and Poisson’s ratio are 1050 kg/m3, 0.54 GPa, and 0.22, respectively; and the number of coke particles is 1,049,686. Table 3 shows the detailed conditions for the coke particles. The input sinter particles were generated at the outlet of the discharging funnel, i.e., the particle behavior from the parallel hopper and the discharging funnel was not simulated to reduce the computing time. The time changes in the mass ratio for each particle of the input sinter corresponded to the sampled results in the experimental work, which was described above, to consider the particle size segregation during conveying to the furnace. The input particles have 5.5 m/s of vertical velocity, which was also measured using high speed video camera [20]. Every particle has a different rolling friction coefficient, which was obtained by generating a random number at the beginning of the simulation. The distribution of the rolling friction coefficient is shown in Figure 5. The charging pattern of the chute tilting angle was the same as that of the experimental one, as shown in Table 1, and the rotational speed was 13.4 rpm. The discrete time was 1.5 μs and the total number of calculation steps was 50 million. The calculation was parallelized using OpenMP.
Table 2.
Condition for sinter particle in DEM.
Table 3.
Condition for coke particle in DEM.
4. Results and Discussions
Figure 6 shows the relation between the normalized discharging time and the mass fraction of each size range of the sinter particles that were discharged from the funnel. It is confirmed that the smaller particles were discharged during the initial period, whereas the larger ones were discharged later. The particle size segregation occurred during charging and discharging at the storages (the surge hopper and the parallel hoppers); therefore, the larger particles tend to be discharged later. This phenomenon affects the radial particle size distribution of the burden. This result of the time change of the particle size during discharging was used as the input particle condition of DEM.
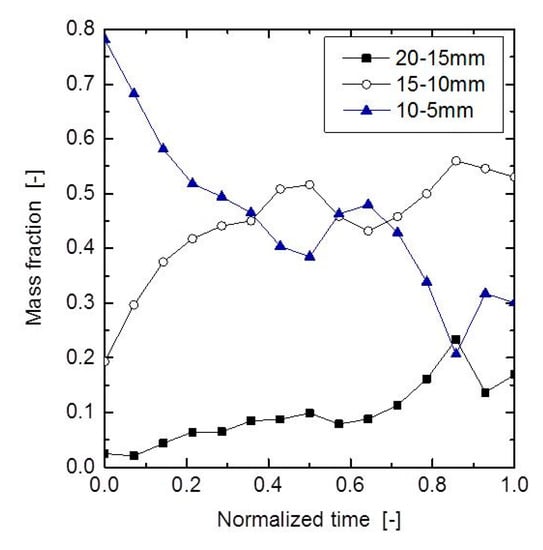
Figure 6.
Relation between the mass fraction of each size range of the sinter particles and the normalized discharging time.
Figure 7 shows pictures during ore charging in the experimental test. The black particles in the furnace are coke, and the dark brown ones, which are charged from the rotating chute, are sinter. The sinter particles are stacked near the wall at the beginning of charging, and subsequently, the particles flow toward the center. The sinter covers the coke layer after the 11 rotations. Figure 8 shows the surface profile of the burden after charging. The surface angle of the ore layer is approximately 32.1°. A terrace is found around 1185 mm from the center, and the angle of the terrace is 13.7°. The surface angle of the coke layer is also found to be 36.7°. This value is larger than that of the sinter layer because of the particle shape and the size distribution.
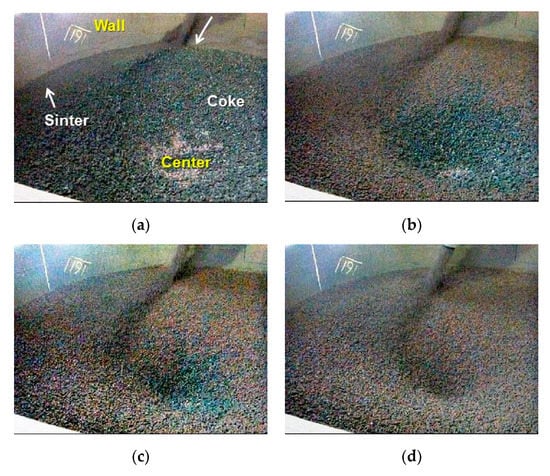
Figure 7.
Pictures during ore-charging in the experimental work. (a) 1st rotation; (b) 4th rotation; (c) 7th rotation; (d) 11th rotation.
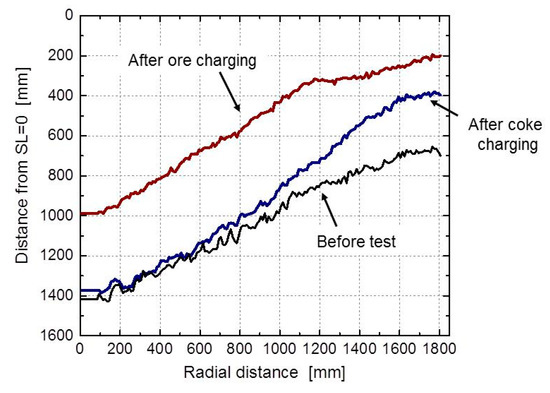
Figure 8.
Surface profile of the burden after the charging test.
Figure 9 shows the contour map for the sinter volume fraction in the burden, which was obtained by digging up the burden. The surface profiles subsequent to charging are also drawn in the contour. Most coke particles are situated near the wall, and the thickness of the coke layer around the center is extremely thin. Therefore, it is suggested that a collapse of the coke layer during ore-charging was not significant in this charging condition.
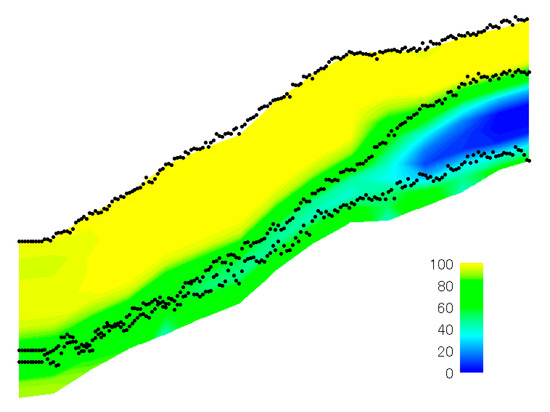
Figure 9.
Contour map for the sinter volume fraction in the burden.
Figure 10 shows snapshots of the charging behavior simulated by DEM. The brown particles denote sinter and the blue ones are coke. The sinter particles are charged around the wall toward the center, and they reach the center in approximately 11 chute rotations. Their behavior is found to be very similar to that of the experimental ones, which are shown in Figure 7. Figure 11 shows a cross-section of the burden simulated using DEM. The surface angle is 33.6°, and the position of the terrace is approximately 1250 mm from the center. The terrace angle is approximately 14.2°. Although the profile and the thickness near the center are slightly different, the simulated burden layer is quite similar to the experimental one, especially the shape of the terrace.
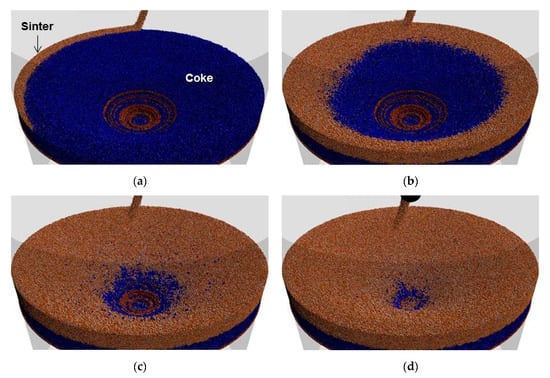
Figure 10.
Snapshots of ore charging simulated by DEM. (a) 1st rotation; (b) 4th rotation; (c) 7th rotation; (d) 11th rotation.
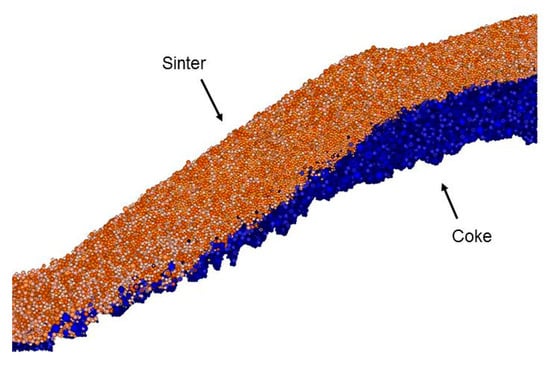
Figure 11.
Cross-section of the burden simulated by DEM.
Figure 12 shows the relation between the ore to coke mass ratio (O/C) and the radial distance. The experimental results were obtained by digging up the burden. The value of O/C around the center is enormous because the thickness of the coke layer is thin, and it decreases with the increase in the radial distance because the coke layer becomes thicker. Trends of the O/C for both the experiment and the simulation are excellently correlated. Figure 13 shows the relation between the normalized mean particle diameter of the sinter and the radial distance. The particle diameter at each position was normalized using the mean value of all particles because the mean particle diameter in the experimental work became smaller than that of the initial condition. Some sinter particles had fragmented during the continuous charging into hoppers and discharging. The particle diameter at the terrace is smaller, and it increases while approaching the center due to the particle size segregation during the flow toward the center. A good agreement between the experimental results and the simulated ones was obtained. Therefore, the burden distribution simulated in this work was validated, and it has a high potential to predict the particle behavior during charging. In the simulation, the burden layer formation can be clarified. Figure 14 shows the cross-section of the ore layer, which is color-coded by the chute tilting angle. It is found that the thickness of each layer is thin, and it reaches the center. This is good information for considering the mixing particles in the ore layer. The vertical layer structure for each ring is clarified. Therefore, the discussion of the vertical position of mixed particles is possible. For example, if some particles should be mixed in the purple layer, they should be charged in the blast furnace during the rotation of 39°. It should be noted that this simulation did not consider the effect of the mixing particle and gas flow, but they will be investigated in the future work.
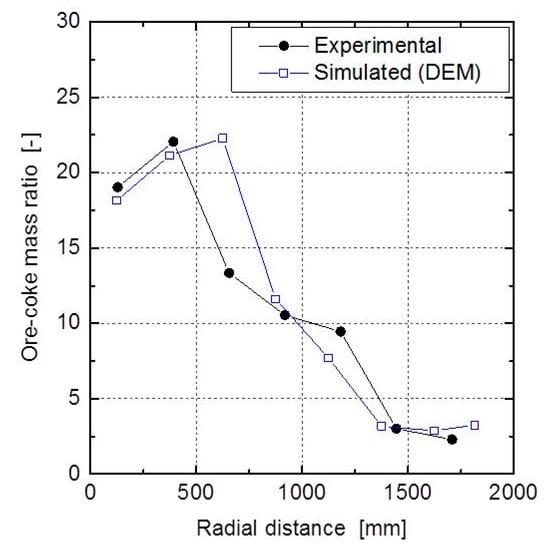
Figure 12.
Relation between the ore-coke mass ratio (O/C) and the radial distance.
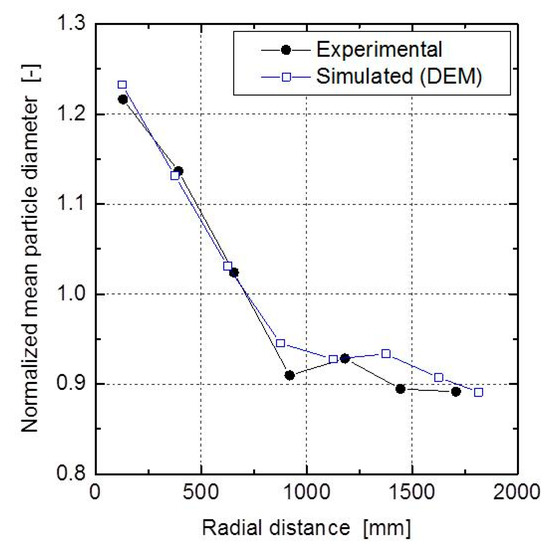
Figure 13.
Relation between the normalized mean particle diameter of sinter and the radial distance.
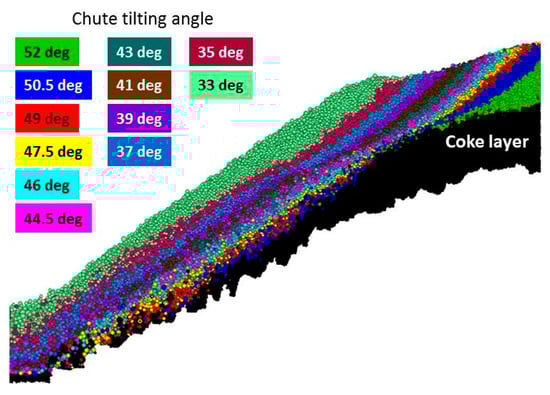
Figure 14.
Cross section of the ore layer, which is color-coded by the chute tilting angle.
5. Conclusions
A particle simulation model of the charging process of the bell-less-type blast furnace was developed using DEM. The ore to coke mass ratio (O/C) and the mean particle diameter of the radial direction were compared with the experimental results, which were obtained in the 1/3-scale experimental burden distribution simulator. The following is a summary of this study:
- (1)
- The particle size segregation occurred during conveying to the experimental blast furnace. The smaller particles were initially discharged, whereas the larger ones were discharged later.
- (2)
- The burden profile, which was simulated using DEM, was similar to the experimental one. A terrace was found at the burden surface subsequent to ore charging, and its simulated position agreed with that of the experimental result. The surface angle was mostly similar between them.
- (3)
- The simulated O/C distribution in the radial direction and the mean particle diameter distribution showed excellent correlation with the experimental results.
- (4)
- It can be concluded that this method of particle simulation of the bell-less charging process is highly reliable in the prediction of the burden distribution in the blast furnace.
Author Contributions
Data curation, H.M.; Formal analysis, H.M. and Y.N.; Investigation, H.M.; Supervision, K.N. and S.N.; Validation, H.M.; Writing—original draft, H.M. All authors have read and agreed to the published version of the manuscript.
Funding
This research receive no external funding.
Conflicts of Interest
The authors declare no conflicts of interest.
References
- Okuno, Y.; Matsuzaki, S.; Kunitomo, K.; Isoyama, M.; Kusano, Y. Development of a mathematical model to estimate burden distribution in bell-less type charging for blast furnace. Tetsu-to-Hagané 1987, 73, 91–98. [Google Scholar] [CrossRef]
- Sawada, T.; Uetani, T.; Taniyoshi, S.; Miyagawa, M.; Sugawara, H.; Yamazaki, M. Blast furnace operation and burden distribution control with bell-less top of the 3 parallel bunker type. Tetsu-to-Hagané 1992, 78, 1337–1344. [Google Scholar] [CrossRef][Green Version]
- Hattori, M.; Iino, B.; Shimomura, A.; Tsukiji, H.; Ariyama, T. Development of burden distribution simulation model for the bell-less top in a large blast furnace and its application. Tetsu-to-Hagané 1992, 78, 1345–1352. [Google Scholar] [CrossRef]
- Mitra, T.; Saxén, H. Model for fast evaluation of charging programs in the blast furnace. Metall. Mater. Trans. B 2014, 45, 2382–2394. [Google Scholar] [CrossRef]
- Fu, D.; Chen, Y.; Zhou, C.Q. Mathematical modeling of blast furnace burden distribution with non-uniform descending speed. Appl. Math. Model. 2015, 39, 7554–7567. [Google Scholar] [CrossRef]
- Cundall, P.A.; Strack, O.D.L. Discrete numerical model for granular assemblies. Geotechnique 1979, 29, 47–65. [Google Scholar] [CrossRef]
- Nogami, H.; Yamaoka, H.; Takatani, K. Raceway design for the innovative blast furnace. ISIJ Int. 2004, 44, 2150–2158. [Google Scholar] [CrossRef]
- Yuu, S.; Umekage, T.; Miyahara, T. Prediction of stable and unstable flows in blast furnace raceway using numerical simulation methods for gas and particles. ISIJ Int. 2005, 45, 1406–1415. [Google Scholar] [CrossRef]
- Nouchi, T.; Sato, T.; Sato, M.; Takeda, K.; Ariyama, T. Stress field and solid flow analysis of coke packed bed in blast furnace based on DEM. ISIJ Int. 2005, 45, 1426–1431. [Google Scholar] [CrossRef]
- Zhou, Z.; Zhu, H.; Yu, A.; Wright, B.; Pinson, D.; Zulli, P. Discrete particle simulation of solid flow in a model blast furnace. ISIJ Int. 2005, 45, 1828–1837. [Google Scholar] [CrossRef]
- Mio, H.; Yamamoto, K.; Shimosaka, A.; Shirakawa, Y.; Hidaka, J. Modeling of solid particle flow in blast furnace considering actual operation by large-scale Discrete Element Method. ISIJ Int. 2007, 47, 1745–1752. [Google Scholar] [CrossRef]
- Natsui, S.; Nogami, H.; Ueda, S.; Kano, J.; Inoue, R.; Ariyama, T. Simultaneous three-dimensional analysis of gas–solid flow in blast furnace by combining Discrete Element Method and Computational Fluid Dynamics. ISIJ Int. 2011, 51, 51–58. [Google Scholar] [CrossRef]
- Wu, S.; Kou, M.; Xu, J.; Guo, X.; Du, K.; Shen, W.; Sun, J. DEM simulation of particle size segregation behavior during charging into and discharging from a Paul-Wurth type hopper. Chem. Eng. Sci. 2013, 99, 314–323. [Google Scholar] [CrossRef]
- Yu, Y.; Saxén, H. Segregation behavior of particles in a top hopper of a blast furnace. Powder Technol. 2014, 262, 233–241. [Google Scholar] [CrossRef]
- Liu, S.; Zhou, Z.; Dong, K.; Yu, A.; Pinson, D.; Tsalapatis, J. Numerical investigation of burden distribution in a blast furnace. Steel Res. Int. 2015, 86, 651–661. [Google Scholar] [CrossRef]
- Mio, H.; Komatsuki, S.; Akashi, M.; Shimosaka, A.; Shirakawa, Y.; Hidaka, J.; Kadowaki, M.; Matsuzaki, S.; Kunitomo, K. Validation of particle size segregation of sintered ore during flowing through laboratory-scale chute by Discrete Element Method. ISIJ Int. 2008, 48, 1696–1703. [Google Scholar] [CrossRef]
- Mio, H.; Komatsuki, S.; Akashi, M.; Shimosaka, A.; Shirakawa, Y.; Hidaka, J.; Kadowaki, M.; Matsuzaki, S.; Kunitomo, K. Effect of chute angle on charging behavior of sintered ore particles at bell-less type charging system of blast furnace by Discrete Element Method. ISIJ Int. 2009, 49, 479–486. [Google Scholar] [CrossRef]
- Mio, H.; Kadowaki, M.; Matsuzaki, S.; Kunitomo, K. Development of particle flow simulator in charging process of blast furnace by discrete element method. Miner. Eng. 2012, 33, 27–33. [Google Scholar] [CrossRef]
- Mio, H.; Nakauchi, T.; Kawaguchi, Y.; Enaka, T.; Narita, Y.; Inayoshi, A.; Matsuzaki, S.; Orimoto, T.; Nomura, S. High-speed video recording of particle trajectory via rotating chute of Nagoya No.3 blast furnace and its comparison with simulated behavior using DEM. ISIJ Int. 2017, 57, 272–278. [Google Scholar] [CrossRef]
- Mio, H.; Narita, Y.; Matsuzaki, S.; Nishioka, K.; Nomura, S. Measurement of particle charging trajectory via rotating chute of 1/3-scale blast furnace and its comparing with numerical analysis using Discrete Element Method. Powder Technol. 2019, 344, 797–803. [Google Scholar] [CrossRef]


© 2019 by the authors. Licensee MDPI, Basel, Switzerland. This article is an open access article distributed under the terms and conditions of the Creative Commons Attribution (CC BY) license (http://creativecommons.org/licenses/by/4.0/).