Article

Effect of Ionic Strength and Coexisting Ions on the Biosorption of Divalent Nickel by the Acorn Shell of the Oak Quercus crassipes Humb. & Bonpl.

by
Erick Aranda-García
1,
Griselda Ma. Chávez-Camarillo
2 and
Eliseo Cristiani-Urbina
1,*
1
Departamento de Ingeniería Bioquímica, Escuela Nacional de Ciencias Biológicas, Instituto Politécnico Nacional, Ciudad de México 07738, Mexico
2
Departamento de Microbiología, Escuela Nacional de Ciencias Biológicas, Instituto Politécnico Nacional, Ciudad de México 11340, Mexico
*
Author to whom correspondence should be addressed.
Processes 2020, 8(10), 1229; https://doi.org/10.3390/pr8101229
Submission received: 19 August 2020 / Revised: 20 September 2020 / Accepted: 28 September 2020 / Published: 1 October 2020
(This article belongs to the Special Issue Applications of Biosorption in Wastewater Treatment)

Abstract

:
This study investigated the effect of ionic strength and background electrolytes on the biosorption of Ni2+ from aqueous solutions by the acorn shell of Quercus crassipes Humb. & Bonpl. (QCS). A NaCl ionic strength of 0.2 mM was established to have no effect on the Ni2+ biosorption and the biosorption capacity of the heavy metal decreased as the ionic strength increased from 2 to 2000 mM. The background electrolytes (KCl, NaNO3, Na2SO4, CaCl2, MgSO4, and MgCl2) had no adverse effects on the biosorption of Ni2+ at a concentration of 0.2 mM. However, at background electrolyte concentrations of 2 and 20 mM, divalent cations (Ca2+ and Mg2+) had greater negative effects on the biosorption of Ni2+ compared to the monovalent cations (Na+ and K+). Additionally, the SO42− and Cl anions affected the biosorption of Ni2+. The fractional power, Elovich, and pseudo-second order models represented the kinetic processes of the biosorption of Ni2+ adequately. The results show that QCS can be a promising and low-cost biosorbent for removing Ni2+ ions from aqueous solutions containing various types of impurities with different concentrations.

Graphical Abstract

1. Introduction

Currently, environmental pollution by toxic heavy metals is one of the most alarming problems of modern society [1,2,3]. Since heavy metals are non-biodegradable and highly toxic, their presence in water resources poses a great risk to the balance of the natural environment and the health of living beings [4,5].
The divalent Ni2+ is one of the most toxic heavy metals found in wastewater discharges owing to various anthropogenic activities, such as the manufacture of metal alloys, stainless steel, super-alloys, accumulators, batteries, electrical and electronic products and components, pigments, paints, coins, and ceramics, mineral processing, steel casting, nickel mining and refining, metallurgy, electroplating, leather tanning, and porcelain enameling [3,6,7]. Notably, it is evident that Ni2+ is widely used in several industrial sectors, including transportation, construction, electronics, aeronautics, automotive, and telecommunications [8].
Exposure to high levels of Ni2+ causes a range of harmful effects on human health, such as endocrine disorders, gastrointestinal distress, allergies, headache, anemia, dizziness, chest tightness, pulmonary fibrosis, cyanosis, rapid breathing, and encephalopathy, as well as damage to the kidneys, central nervous system, and lungs [1,4,9,10,11]. Moreover, Ni2+ exhibits carcinogenic, embryotoxic, and teratogenic properties [9,10]. Therefore, to protect the public health from the harmful effects of Ni2+, the World Health Organization (WHO) established a reference value of 0.07 mg/L to control the concentration of nickel in drinking water [12].
The conventional methods used to remediate industrial wastewater contaminated with Ni2+, such as chemical coagulation and precipitation, adsorption onto activated carbon, ion exchange, and various electrochemical and membrane technologies [8,13] have several disadvantages. These disadvantages include high cost, inefficient or ineffective treatment of wastewater with low Ni2+ concentrations, production of toxic chemical sludge that requires additional treatment, and/or they are highly sensitive to the operating parameters [9,14]. These disadvantages together with the increasing implementation of stricter environmental regulations have prompted the search for new treatment technologies [13]. Biosorption is a cost-effective, flexible, and efficient technology for removing heavy metals from aqueous solutions, which uses plant, animal, and microbial biomass or their derived products as biosorbents [15,16,17]. Agricultural and forestry residues and by-products, which are mainly composed of cellulose, hemicellulose, and lignin, are abundant in nature, renewable, economical, and environmental friendly. Additionally, they are highly efficient and effective for removing organic and inorganic contaminants from aqueous solutions via biosorption. Therefore, they are a viable option for bioremediation of industrial effluents contaminated with heavy metals [2,8,13,18,19].
Our previous studies established that the acorn shell of Quercus crassipes Humb. and Bonpl. (QCS) is a versatile and effective novel biosorbent for removing anionic and cationic heavy metals from aqueous solutions. QCS has a remarkable ability to remove hexavalent chromium (anionic heavy metal in aqueous solution) and to biosorb total chromium from aqueous solutions, both in batch [20,21] and continuous [22] systems.
Furthermore, so far, QCS is one of the best biosorbents reported for the biosorption of Ni2+ (cationic heavy metal) from aqueous solutions. Therefore, it was established that the QCS performance in the biosorption of Ni2+ ions is affected by the contact time, pH of the solution, initial Ni2+ concentration, and temperature. The optimal pH for the biosorption of Ni2+ by QCS is 8.0, whereas its point of zero charge is 5.4. The kinetic and equilibrium biosorption processes of Ni2+ are significantly represented using the pseudo-second order and Freundlich models, respectively. Moreover, it was established that the biosorption of Ni2+ by QCS is an endothermic process, non-spontaneous, and of chemical nature, in which the carboxyl, carbonyl, and hydroxyl functional groups play a major role in the removal of the heavy metal [9].
One of the critical parameters to be considered in the scaling up and large-scale application of biosorption processes is the presence of co-ions in the wastewater to be treated [20,23]. Therefore, it is important to note that most studies on biosorption of toxic heavy metals have been carried out using synthetic solutions that contain the metal of interest only. However, real industrial effluents are usually complex mixtures containing different types of background electrolytes, such as monovalent and divalent cations and anions at different concentrations [24]. The background electrolytes and their concentrations can affect the biosorption of the heavy metal of interest since they can: (1) compete with the heavy metal of interest for the available biosorption active sites, (2) decrease the specificity of the biosorbent by binding to sites to which the metal ion of interest does not bind, and/or (3) form chemical complexes or precipitates with the heavy metal of interest [20,23,24].
In spite of their great importance and relevance for the biosorption processes of toxic heavy metals, there is practically no information in the specialized literature about the effects of ionic strength and competing ions on the biosorptive removal of heavy metals from aqueous solutions [25]. This information is crucial for analyzing, interpreting, understanding and designing biosorption processes for heavy metal removal from aqueous solutions, meaning there is a clear need for investigation concerning the inhibitory effects of ionic strength and competing ions on the biosorption of the heavy metal of interest.
Therefore, the aims of the current investigation are to assess the influences of background cations, background anions, and NaCl ionic strength, on both the biosorption of Ni2+ ions onto QCS in aqueous solution, and the kinetic modeling of the Ni2+ biosorption process.

2. Materials and Methods

2.1. Biosorbent

The acorns of the oak Quercus crassipes Humb. and Bonpl. were collected from the town of El Durazno de Cuauhtémoc, located in the municipality of Jilotepec de Molina Enríquez, in the state of Mexico, Mexico. The acorns were washed under running water, rinsed with distilled deionized water, and then dried in an oven at 60 °C for 24 h. Thereafter, the shells were separated from the acorns and grounded in a Glen Creston® laboratory mill (Glen Creston, Ltd., London, England, UK). The resulting powder was sieved using American Society for Testing and Materials (ASTM) sieves (ASTM International, West Conshohocken, PA, USA), and the fraction with particle sizes ranging between 180–212 µm was used in all the experiments carried out in this study.

2.2. Stock and Test Solutions

Stock solutions of NiSO4, KCl, NaNO3, Na2SO4, CaCl2, MgSO4, and MgCl2 with a concentration of 20 mM and 2000 mM NaCl were prepared by dissolving a precisely weighed amount of chemical compounds in 1 L distilled deionized water. All reagents were of analytical grade (JT Baker®, Monterrey, Mexico). The test solutions were prepared by diluting the stock solutions with distilled deionized water.

2.3. Biosorption Experiments

The kinetic experiments were carried out using batch systems to assess the influence of ionic strength and background electrolytes on the biosorption of Ni2+ from aqueous solutions by the acorn shell of Quercus crassipes Humb. & Bonpl. (QCS). The biosorption studies were performed in 500 mL Erlenmeyer flasks containing 110 mL Ni2+ solution at an initial concentration of 1.97 mM and a QCS biomass at a concentration of 1 g/L. The flasks were shaken at a constant speed of 120 rpm in a Cole-Parmer® linear shaking water bath (Cole-Parmer®, Vernon Hills, IL, USA) for 120 h at 25 ± 1 °C. The pH of each test solution was measured regularly over the course of the experiments and then adjusted to 8.0 ± 0.1 using 0.1 M NaOH and/or HCl solutions when necessary.
Ni2+ solutions containing some of the anions and cations that have been frequently found in industrial effluents were used to assess the influence of ionic strength and background electrolytes on the biosorption of Ni2+ by QCS [24]. The effect of ionic strength was tested using NaCl as the background electrolyte at concentrations ranging from 0.2 to 2000 mM. To assess the effect of background electrolytes, chemical compounds (KCl, NaNO3, Na2SO4, CaCl2, MgSO4, and MgCl2) consisting of monovalent and divalent anions and cations were used at concentrations of 0.2, 2, and 20 mM. Control experiments that only contained QCS biomass at a concentration of 1 g/L and Ni2+ solution at an initial concentration of 1.97 mM with no background electrolytes were conducted simultaneously.
Additionally, control experiments with no QCS biomass were performed using the same operating conditions of the Ni2+ biosorption experiments to determine whether there was loss of Ni2+ because of precipitation or adsorption onto the glass. Statistically, there were no significant differences between the Ni2+ concentrations in the control experiments with no QCS biomass at different experimental times. Thus, the decrease in the Ni2+ concentration observed in the experiments with QCS biomass was caused by QCS.
Samples were taken at different experimentation times, and then they were filtered through a Whatman® grade 42 filter paper (Whatman®, St. Louis, MI, USA). The collected filtrates were analyzed to determine their residual Ni2+ concentration.
The Ni2+ biosorption capacity (qt, mmol/g) at any time t was calculated using Equation (1):
q t = ( C i C t ) C b
where Ci (mmol/L) is the initial concentration of Ni2+ at time t = 0 h, Ct (mmol/L) is the residual concentration of Ni2+ at time t = t, and Cb is the concentration of the QCS biosorbent (g/L).
The effect of background electrolytes and ionic strength on the biosorption of Ni2+ by QCS was quantitatively assessed using the global performance index of the Ni2+ biosorption (ξ, %), which was calculated using Equation (2) [26]:
ξ = 100 ( t = 0 t = t f q t dt ) problem ( t = 0 t = t f q t dt ) control ( t = 0 t = t f q t dt ) control
where (qtdt)problem and (qtdt)control are the time courses of the Ni2+ biosorption capacity in the experiments carried out with (test experiments) and without (control experiments) background electrolytes, respectively, and tf is the total contact time between the Ni2+ solution and the QCS biomass (120 h).
Integration of the (qtdt)problem and (qtdt)control functions from t = 0 to t = t was performed using Mathematica version 7.0 (Wolfram Research, Champaign, IL, USA). The biosorption of Ni2+ by QCS is not affected by the ionic strength or background electrolytes if ξ = 0%. There is an improvement in the biosorption of Ni2+ compared to the control if ξ > 0%, thus, the ionic strength or background electrolytes have a positive or synergistic effect on the metal biosorption. Finally, if ξ < 0%, the biosorption of Ni2+ is decreased compared to the control, thus, the ionic strength or background electrolytes have a negative or antagonistic effect on the metal biosorption [26].

2.4. Determination of the Ni2+ Concentration

The Ni2+ concentration in the liquid phase was determined using the dimethylglyoxime method [27]. The absorbance of the chemical complex with a color ranging from red wine to brown that is formed during the reaction of Ni2+ ions with dimethylglyoxime was measured in a Thermo Scientific™ Evolution 201 spectrophotometer (Thermo Fisher Scientific, Whaltman, MA, USA) at a wavelength of 465 nm.

2.5. Biosorption Kinetic Modeling

The biosorption kinetics describes the rate of biosorption of the adsorbate and, therefore, controls the time required to reach dynamic equilibrium [28]. This study used the pseudo-first order, pseudo-second order, Elovich, intraparticle diffusion, and fractional power models to analyze the kinetics of the Ni2+ biosorption process.
The pseudo-first order and pseudo-second order models can be described using Equations (3) and (4), respectively [29]:
q t = q e 1   ( 1 e k 1   t )
q t = t 1 k 2 q e 2 2 + t q e 2
where qe1 and qe2 are the equilibrium biosorption capacities (mmol/g) predicted by the pseudo-first order and pseudo-second order models, respectively, qt is the biosorption capacity (mmol/g) at time t = t (h), and k1 (1/h) and k2 (g/mmol·h) are the rate constants of the pseudo-first order and pseudo-second order models, respectively.
The Elovich kinetic model is given by Equation (5) [30]:
q t = 1 B e ln ( 1 + A e B e t )
where Ae (mmol/g·h) and Be (g/mmol) are the initial biosorption rate and the desorption constant, respectively.
The fractional power kinetic model is given by Equation (6) [31]:
q t = k fp   t v
where kfp (mmol/g) is the fractional power model constant and v (1/h) is the rate constant of the fractional power model. The product of these constants (kfp⋅v, mmol/g·h) is known as the specific biosorption rate at unit time, that is, when t = 1.
The intraparticle diffusion model can be described by Equation (7) [32]:
q t = k id   t 0.5 + c
where c (mmol/g) is the intercept of the model that is related to the thickness of the boundary layer and kid (mmol/g·h0.5) is the intraparticle diffusion rate constant.

2.6. Determination of the Parameters of the Kinetic Models and Statistical Analysis

All the experiments of the study were carried out at least twice and the results reported herein are the average values ± mean standard deviation. Statistical analysis of the Ni2+ biosorption data and estimation of the parameters of the tested kinetic models were performed using the GraphPad Prism version 8.0 (GraphPad Software, Inc., San Diego, CA, USA).
The analysis of variance (ANOVA) was performed using the Tukey’s test for group comparisons to determine whether there were statistically significant differences in the Ni2+ biosorption data. A significance level (α) of 0.05 was used. Probability values (p) lower than α indicate that the evaluated groups differ significantly.
The kinetic models parameters were obtained via non-linear regression analysis of the experimental data. Various error functions, such as root mean squared error (RMSE), sum of squared error (SSE), Akaike information criterion (AIC), coefficient of determination (r2), and 95% confidence intervals were used to determine the accuracy and adequacy of the tested kinetic models fit. Small RMSE, SSE, and AIC values, r2 values close to one, and narrow 95% confidence intervals indicate that the models describe the experimental Ni2+ biosorption data more accurately [22].

3. Results and Discussion

3.1. Influence of Ionic Strength on the Biosorption of Ni2+ by Acorn Shell of Quercus Crassipes Humb. & Bonpl. (QCS)

The ionic strength of an aqueous solution is an environmental parameter that significantly affects the biosorption of heavy metal ions at the interface between the solid biosorbent and the liquid phase [24]. Thus, this study investigated its effect on the kinetics of biosorption of Ni2+ by QCS.
Figure 1 shows the variation in Ni2+ biosorption capacity as a function of the biosorption time at NaCl ionic strengths ranging from 0.2 to 2000 mM. The kinetic profile of the Ni2+ biosorption at an ionic strength of 0.2 mM is similar to that of the control experiment (0 mM NaCl). There were no significant differences between the Ni2+ biosorption capacities (p > 0.05) for the control experiment and at an ionic strength of 0.2 mM at different experimental times, which indicates that the Ni2+ biosorption is not affected by a NaCl ionic strength of 0.2 mM.
In contrary, the Ni2+ biosorption capacity decreased gradually as the ionic strength increased from 0.2 to 200 mM (p < 0.05). However, the Ni2+ biosorption capacities were very similar and there were no significant differences between them (p > 0.05) at different biosorption times and at very high ionic strengths of 200 and 2000 mM. These results indicate that the biosorption of Ni2+ is negatively affected by NaCl ionic strengths equal to or greater than 2 mM.
The global performance indexes for the biosorption of Ni2+ at the different ionic strengths are summarized in Table 1.
The global performance index revealed that a NaCl ionic strength of 0.2 mM had a negligible negative effect on the biosorption of the metal (ξ = −4%). However, as the ionic strength increased from 2 to 200 mM, the global performance index decreased from −17 to −55%, which indicates that the adverse effect of the ionic strength on the biosorption of Ni2+ increases with an increase in ionic strength (p < 0.05). Moreover, the global performance index for the biosorption of Ni2+ at NaCl ionic strengths of 200 and 2000 mM were similar, thus, the adverse effects on the biosorption of the metal were similar under these conditions (p > 0.05). These results are in agreement with the negative effects observed in the kinetic studies of the Ni2+ biosorption.
The decrease in Ni2+ biosorption with increasing NaCl ionic strengths from 0.2 to 2000 mM can be attributed to the fact that the aqueous solution contain more positively charged Na+ ions, which competed with the Ni2+ cations for the available biosorption active sites on the QCS surface [24,33]. Moreover, changes in the ionic strength of a solution can make the reactive functional groups on the surface of the biosorbent less accessible to Ni2+ ions [20,34]. Furthermore, Na+ ions can reduce the concentration of other electrostatically bound counterions that balance the negative charge of the biomass, thus, Na+ ions affect the intraparticle ion concentration and the binding of other ions, such as the Ni2+ ions [33]. Additionally, it has been reported that high Cl ion concentrations (present in NaCl) favor the formation of the nickel chloride (NiCl) complex, thus decreasing the number of free Ni2+ ions in the aqueous solution, which results in a lower number of interactions between Ni2+ ions and biosorption active sites and consequently, a decrease in the heavy metal biosorption capacity [35].
Additionally, it has been reported that the NaCl ionic strength negatively affects the biosorption of Ni2+ by grape stalks wastes [35], filamentous fungi such as Rhizopus sp., Mucor sp., and Penicillium sp. [36], and barley straw [37]. Moreover, the NaCl ionic strength decreased the sorption capacity of other heavy metals, such as Cu2+ by HNO3-pretreated newspaper scraps, HNO3-pretreated-maize spatha [38], and by an exopolysaccharide of Wangia profunda [39]; also Cd2+ by an exopolysaccharide of Wangia profunda [39] and by magnetic graphene oxide-supported sulfanilic acid [24], Pb2+ by Sargassum filipendula [40], and Cr6+ by lignin [28]. Likewise, the increase of NaCl ionic strength inhibited the biosorption of organic adsorbates, such as Methylene Blue and Rhodamine B dyes by Phellinus igniarius and Fomes fomentarius [41], and benzene and toluene by Macrocystis pyrifera [42].
Analysis of the kinetic model for biosorption study is crucial for understanding dynamics, mechanism, and reaction pathway of the biosorption process. It also helps in determining mass transfer, rate-controlling steps, and physicochemical interaction in the biosorption process. Additionally, knowledge about kinetics of metal biosorption is useful for determining optimum conditions for biosorption processes [43]. In the present work, the experimental kinetic data of the biosorption of Ni2+ by QCS at different ionic strengths were analyzed using the pseudo-first order, pseudo-second order, Elovich, fractional power, and intraparticle diffusion models. These models have been used previously to analyze and understand biosorption kinetics of Ni2+ ions in single metal systems by different biosorbents [7,11,26,44] but to the best knowledge of the authors, the kinetic process of Ni2+ biosorption from aqueous solutions containing NaCl or other background electrolytes has not been mathematically modeled. The parameters of the kinetic models are presented in Table 2.
The highest r2 values and the lowest SSE, RMSE, and AIC values were obtained using the pseudo-second order, Elovich, and fractional power models. Therefore, these models represent the kinetic profiles of the biosorption of Ni2+ by QCS most adequately under the studied conditions.
The equilibrium Ni2+ biosorption capacities obtained using the pseudo-second order model (qe2) were similar to those obtained experimentally (qe exp). Furthermore, as the NaCl ionic strength increased from 0 to 2000 mM, the rate constant of the pseudo-second order model (k2) decreased from 0.166 to 0.133 g/mmol·h. A similar behavior was observed in the studies of the biosorption of total chromium by QCS at different ionic strengths [20]. A previous study that analyzed the kinetics of the biosorption of Ni2+ by QCS at different pH conditions, initial metal concentrations, and temperatures using the pseudo-first order and pseudo-second order models established that the pseudo-second order model described the biosorption kinetics of the heavy metal more satisfactorily than the pseudo-first order model [9]. The present study demonstrates that the pseudo-second order model can also describe the kinetics of the biosorption of Ni2+ by QCS at different ionic strengths.
Furthermore, it was observed that higher ionic strengths lead to higher rate constants of the fractional power model (v) and lower initial biosorption rates (Ae), as predicted by the Elovich model, as well as lower constants (kFP) and specific biosorption rates (kFP⋅v) of the fractional power model. The decrease in k2, Ae, and kFP⋅v with increasing ionic strengths indicates that the interactions between the QCS biomass and the Ni2+ cations decrease with increasing NaCl ionic strengths, which prevents the binding of Ni2+ ions to biosorption active sites and decreases the heavy metal biosorption capacity.
Notably, even though NaCl ionic strengths equal to and greater than 200 mM significantly affected the biosorption of Ni2+ by QCS, this can be ignored in the present study since the ionic strength of industrial wastewater is lower than 100 mM [45].

3.2. Influence of Coexisting Ionic Species on the Biosorption of Ni2+ by Acorn Shell of Quercus Crassipes Humb. & Bonpl. (QCS)

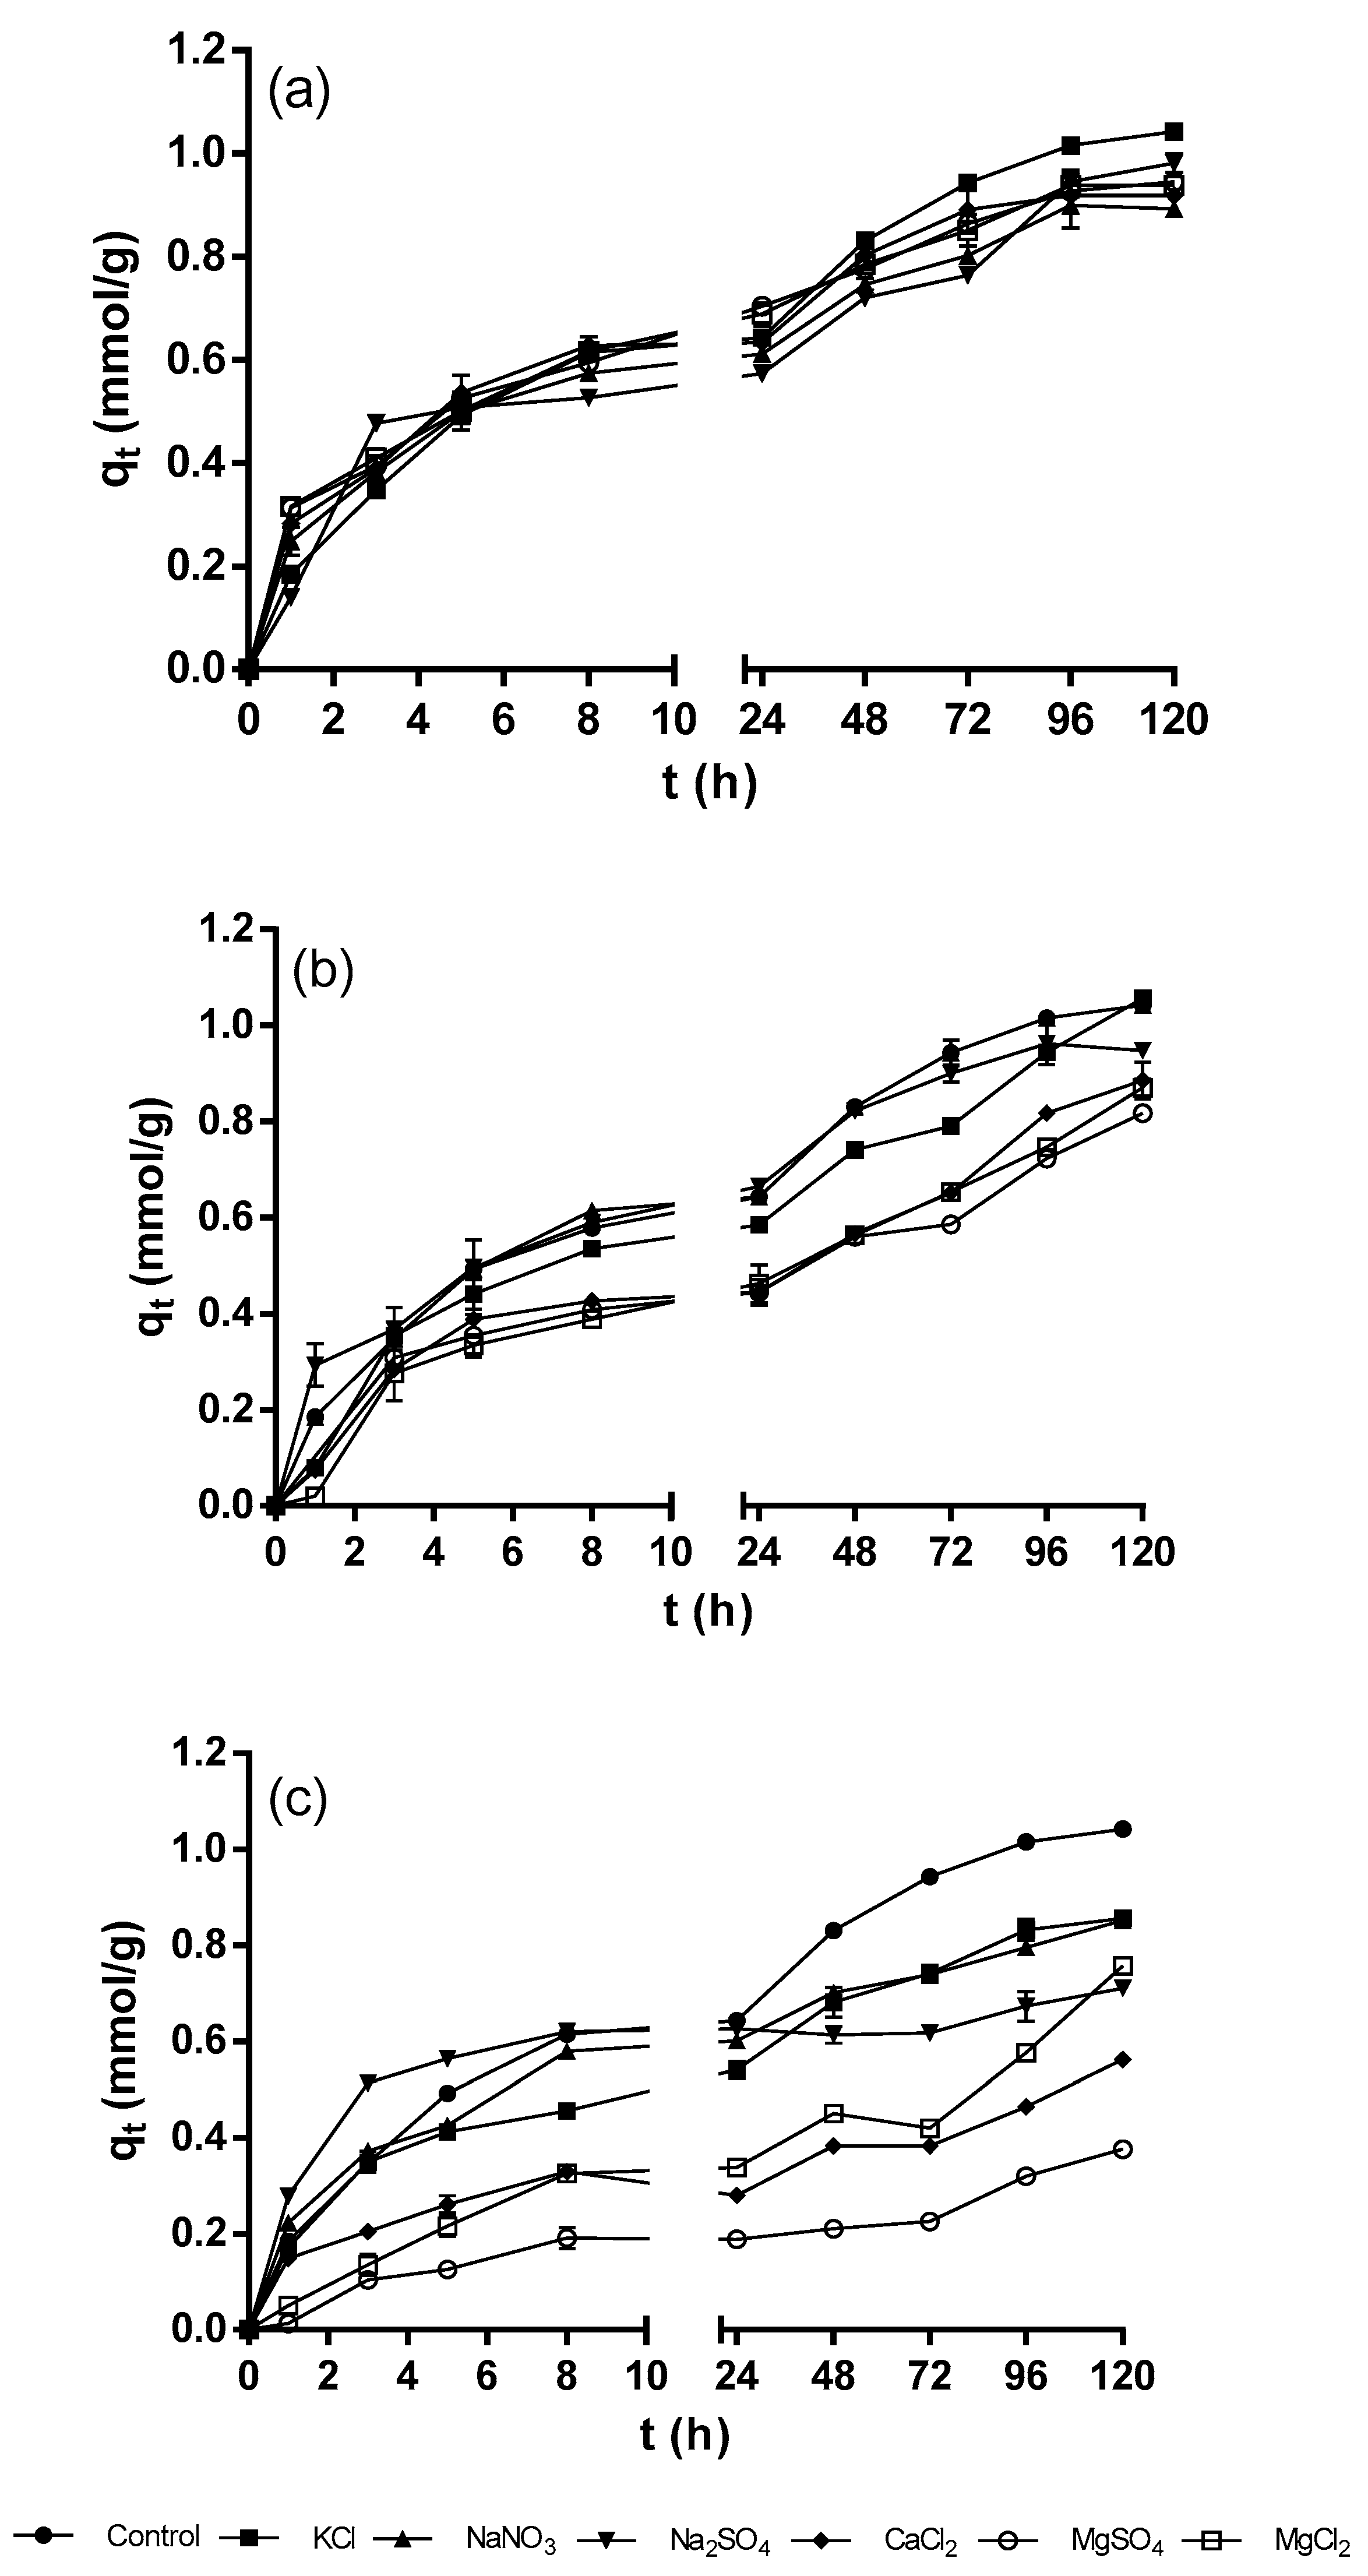
Generally, there are various types of background electrolytes in industrial wastewater at varying concentrations, which can affect the biosorption of the heavy metal of interest. This study investigated the effect of coexisting ionic species on the biosorption of Ni2+ by QCS using different cations and anions at three different concentrations, namely 0.2, 2.0, and 20 mM.
Figure 2 shows the kinetic profiles of the biosorption of Ni2+ by QCS at the different concentrations of background electrolytes. There was a small variation in the Ni2+ biosorption capacity over the course of the experiments for background electrolyte concentration of 0.2 mM compared to the control experiment (with no background electrolytes) (Figure 2a). However, there were no statistically significant differences in all cases (p > 0.05), thus, it is concluded that a background electrolyte concentration of 0.2 mM has no negative effect on the biosorption of Ni2+. Moreover, the global performance indexes for the biosorption of Ni2+ at a background electrolyte concentration of 0.2 mM were small and ranged from −7 to −5% (Table 3), which confirms that background electrolytes at a concentration of 0.2 mM have a negligible effect on the biosorption of Ni2+.
Increasing the concentration of background electrolytes to 2 mM led to a further decrease in the Ni2+ biosorption capacity. However, as shown in Figure 2b, the different background electrolytes influenced the biosorption of Ni2+ at varying degrees. The decreases in Ni2+ biosorption capacity were more significant in the presence of salts with divalent cations (CaCl2, MgSO4, and MgCl2) and, to a lesser extent, with monovalent cations (KCl, NaNO3, and Na2SO4). The statistical analysis revealed that there were significant differences in Ni2+ biosorption capacities between the control and the experiments carried out in the presence of compounds with divalent cations (p < 0.05). However, there were no statistically significant differences in the maximum Ni2+ biosorption capacities between the control and the experiments performed with monovalent cation salts (KCl, NaNO3, and Na2SO4) (p > 0.05). The global performance indexes corroborated that the compounds containing divalent cations (CaCl2, MgSO4 and MgCl2) affected the biosorption of Ni2+ more negatively (from −24% to −20%) compared to the compounds containing monovalent cations (KCl, NaNO3 and Na2SO4) (from −12% to −8%).
The background electrolytes at a concentration of 20 mM caused an even greater decrease in the Ni2+ biosorption capacity compared to that obtained at 2 mM (Figure 2c). The statistical analysis revealed that the differences between the Ni2+ biosorption capacities of the control and the experiments carried out with all the background electrolytes were statistically significant (p < 0.05). For all the experiments, the lowest Ni2+ biosorption capacities were obtained when MgSO4, CaCl2, and MgCl2 salts were present in the aqueous solutions (Figure 2c). Additionally, the global performance indexes showed that the biosorption of Ni2+ was more negatively affected at the highest concentration (20 mM) of background electrolytes and that the negative effect of the background electrolytes followed the order: MgSO4 > CaCl2 > MgCl2 > Na2SO4 > NaNO3 ≈ KCl.
These results clearly show that the Mg2+ and Ca2+ cations have a more pronounced effect on the biosorption of Ni2+ from aqueous solutions by QCS compared to the Na+ and K+ cations. This could be attributed to the following reasons: First, the divalent Mg2+ and Ca2+ cations competed more efficiently with the Ni2+ ions for the biosorption active sites present on the QCS surface compared to the monovalent Na+ and K+ cations. Second, the divalent Mg2+ and Ca2+ cations biosorb more easily on the QCS surface compared to the monovalent Na+ and K+ cations because of the higher electrostatic attraction. Finally, a Na+ or K+ ion biosorbed on the QCS surface occupies only one biosorption active site, whereas a Mg2+ or Ca2+ ion could occupy two sites, thus resulting in a greater decrease in the biosorption of Ni2+ in the presence of MgCl2, MgSO4, and CaCl2 [24,35,46]. These reasons indicate that the biosorption active sites present on the surface of the QCS are not specific to Ni2+ ions.
Additionally, the decrease in Ni2+ biosorption can be owing to the presence of the Cl- and SO42- ions, which could increase the formation of nickel chloride and nickel sulfate complexes, respectively, thus decreasing the free Ni2+ ions in solution [46]. It was observed that the SO42− ion had a more negative effect on the biosorption of Ni2+ by QCS compared to the Cl- and NO3 ions.
Okoronkwo et al. [46] reported that the Ca2+ and Mg2+ cations and the SO42− anion cause a decrease in the ability of the Mexican sunflower (Tithonia diversifolia) stems to bind the Ni2+ ions in aqueous solutions. Ca2+ and Mg2+ cations also decreased the biosorption capacity of Phellinus igniarius and Fomes fomentarius for Methylene Blue and Rhodamine B dyes [41]. Moreover, Mn2+ and Ag+ ions decreased the Cu2+ removal efficiency of granular activated carbon [47]. Likewise, an important decrease in biosorption capacity of Macrocystis pyrifera for benzene and toluene was observed, when an artificial seawater solution (Instant Ocean®, Blacksburg, VA, USA) was used, probably because this solution contains different ions [42].
Table 4 presents the equilibrium Ni2+ biosorption capacity (qe exp) for the control experiment (without background electrolytes) and at the different concentrations of background electrolytes. From Table 4, it is evident that the highest biosorption capacity was obtained in the absence of background electrolytes. Moreover, the heavy metal biosorption capacity decreased as the concentration of background electrolytes increased, and the lowest equilibrium Ni2+ biosorption capacities were obtained in the presence of MgSO4, CaCl2, and MgCl2 at a concentration of 20 mM. The Elovich, fractional power, and pseudo-second order kinetic models described the kinetic profiles of the biosorption of Ni2+ at the three different concentrations of background electrolytes more adequately, as evidenced by the lower SSE, RMSE, and AIC values and the higher r2 values (Table 4, Table 5 and Table 6).
The equilibrium Ni2+ biosorption capacities predicted by the pseudo-second order model were close to the values obtained experimentally, and they decreased as the concentration of the background electrolytes increased. It is also evident that background electrolytes affected the parameters of all the tested kinetic models, and this occurred to a greater extent at a concentration of 20 mM. Among the observed changes, the decrease in the specific biosorption rate of the fractional power model with increasing concentrations of background electrolytes should be noted.
The goodness of fit between Ni2+ biosorption kinetics and pseudo-second order, Elovich, and fractional power models suggests that the biosorption process of Ni2+ by QCS from aqueous solutions, containing different types and concentrations of background electrolytes, has a chemical process (chemisorption) as the rate-limiting step of the overall rate of heavy metal biosorption [18,29].
To our knowledge, the effect of ionic strength and background electrolytes on the parameters of kinetic models of the biosorption of Ni2+ has not been previously reported.
The results obtained in the present study clearly demonstrate the remarkable capacity of QCS to biosorb Ni2+ from aqueous solutions containing various types of impurities with different concentrations.
Additionally, the results of this study show that the impurities in the water greatly affect the performance of the biosorption of heavy metals. Furthermore, this study provides valuable information on the effect of ionic strength, the type, and concentration of background electrolytes on the biosorption of Ni2+, which is of great importance for the application of biosorption technology in the treatment of industrial wastewater contaminated with Ni2+.

4. Conclusions

The results obtained in this study demonstrated that QCS is a useful biosorbent for the bioremediation of aqueous solutions contaminated with Ni2+ and containing inorganic impurities. The effect of background electrolytes varied depending on the type and concentration of the electrolyte. The biosorption of Ni2+ was not affected by a NaCl ionic strength of 0.2 mM but was affected by higher ionic strengths. In addition, the background electrolytes (KCl, NaNO3, Na2SO4, CaCl2, MgSO4, and MgCl2) had no effect on the biosorption of the heavy metal at a concentration of 0.2 mM. However, at concentrations of 2 and 20 mM, the divalent Ca2+ and Mg2+ cations affected the biosorption of Ni2+ significantly, whereas the monovalent Na+ and K+ cations affected the biosorption of Ni2+ only slightly. The kinetic experimental data were well represented using the Elovich, fractional power, and pseudo-second order models. In order to determine the full potential of QCS as a commercial biosorbent, Ni2+ biosorption from industrial wastewater will be evaluated in a future research study.

Author Contributions

Conceptualization, E.C.-U.; methodology, E.A.-G., G.M.C.-C., E.C.-U.; software, E.A.-G.; validation, E.A.-G.; formal analysis, E.A.-G., G.M.C.-C., E.C.-U.; investigation, E.A.-G.; resources, E.C.-U.; writing—original draft preparation, E.A.-G., G.M.C.-C., E.C.-U.; writing—review and editing, E.A.-G., G.M.C.-C., E.C.-U.; visualization, E.A.-G.; supervision, E.C.-U.; project administration, E.C.-U.; funding acquisition, E.C.-U. All authors have read and agreed to the published version of the manuscript.

Funding

This research was funded by the Instituto Politécnico Nacional, Secretaría de Investigación y Posgrado, project number: SIP20201439.

Acknowledgments

E.C.-U. and G.M.C.-C. hold grants from EDI-IPN, COFAA-IPN, and SNI-CONACYT. E.A.-G. holds a grant from SNI-CONACYT.

Conflicts of Interest

The authors declare no conflict of interest.

References

  1. Barquilha, C.E.; Cossich, E.S.; Tavares, C.R.; Da Silva, E.A. Biosorption of nickel and copper ions from synthetic solution and electroplating effluent using fixed bed column of immobilized brown algae. J. Water Process. Eng. 2019, 32, 100904. [Google Scholar] [CrossRef]
  2. Lopez-Nuñez, P.V.; Aranda-Garcia, E.; Cristiani-Urbina, M.D.C.; Morales-Barrera, L.; Cristiani-Urbina, E. Removal of hexavalent and total chromium from aqueous solutions by Plum (P. domestica L.) tree bark. Environ. Eng. Manag. J. 2014, 13, 1927–1938. [Google Scholar] [CrossRef]
  3. Sharma, R.; Singh, B. Removal of Ni (II) ions from aqueous solutions using modified rice straw in a fixed bed column. Bioresour. Technol. 2013, 146, 519–524. [Google Scholar] [CrossRef] [PubMed]
  4. Altino, H.O.N.; Costa, B.E.; Da Cunha, R.N. Biosorption optimization of Ni(II) ions on Macauba (Acrocomia aculeata) oil extraction residue using fixed-bed column. J. Environ. Chem. Eng. 2017, 5, 4895–4905. [Google Scholar] [CrossRef]
  5. Orhan, Y.; Hrenovič, J.; Büyükgüngör, H. Biosorption of heavy metals from wastewater by biosolids. Eng. Life Sci. 2006, 6, 399–402. [Google Scholar] [CrossRef]
  6. Coman, V.; Robotin, B.; Ilea, P. Nickel recovery/removal from industrial wastes: A review. Resour. Conserv. Recycl. 2013, 73, 229–238. [Google Scholar] [CrossRef]
  7. Flores-Garnica, J.G.; Morales-Barrera, L.; Pineda-Camacho, G.; Cristiani-Urbina, E. Biosorption of Ni(II) from aqueous solutions by Litchi chinensis seeds. Bioresour. Technol. 2013, 136, 635–643. [Google Scholar] [CrossRef]
  8. Bobadilla, M.C.; Lostado-Lorza, R.; Gómez, F.S.; Escribano-Garcia, R. Adsorptive of Nickel in wastewater by olive stone waste: Optimization through multi-response surface methodology using desirability functions. Water 2020, 12, 1320. [Google Scholar] [CrossRef]
  9. Aranda-García, E.; Cristiani-Urbina, E. Kinetic, equilibrium, and thermodynamic analyses of Ni(II) biosorption from aqueous solution by acorn shell of Quercus crassipes. Water Air Soil Pollut. 2018, 229, 119. [Google Scholar] [CrossRef]
  10. Pandey, P.K.; Choubey, S.; Verma, Y.; Pandey, M.; Kamal, S.S.K.; Chandrashekhar, K. Biosorptive removal of Ni(II) from wastewater and industral effluent. Int. J. Environ. Res. Public Health 2007, 4, 332–339. [Google Scholar] [CrossRef] [Green Version]
  11. Suazo-Madrid, A.; Morales-Barrera, L.; Aranda-García, E.; Cristiani-Urbina, E. Ni(II) biosorption by Rhodotorula glutinis. J. Ind. Microbiol. Biotechnol. 2011, 38, 51–64. [Google Scholar] [CrossRef] [PubMed]
  12. World Health Organization. Guidelines for Drinking-Water Quality, 4th ed.; WHO: Geneva, Switzerland, 2017. [Google Scholar]
  13. Villen-Guzman, M.; Gutierrez-Pinilla, D.; Gomez-Lahoz, C.; Vereda-Alonso, C.; Rodriguez-Maroto, J.; Arhoun, B. Optimization of Ni (II) biosorption from aqueous solution on modified lemon peel. Environ. Res. 2019, 179, 108849. [Google Scholar] [CrossRef]
  14. Beni, A.A.; Esmaeili, A. Biosorption, an efficient method for removing heavy metals from industrial effluents: A review. Environ. Technol. Innov. 2020, 17, 100503. [Google Scholar] [CrossRef]
  15. Ali, I.H.; Al Mesfer, M.K.; Khan, M.I.; Danish, M.; Alghamdi, M.M. Exploring adsorption process of Lead (II) and Chromium (VI) ions from aqueous solutions on acid activated carbon prepared from Juniperus procera leaves. Processes 2019, 7, 217. [Google Scholar] [CrossRef] [Green Version]
  16. Fomina, M.; Gadd, G.M. Biosorption: Current perspectives on concept, definition and application. Bioresour. Technol. 2014, 160, 3–14. [Google Scholar] [CrossRef]
  17. Kumar, N.S.; Asif, M.; Poulose, A.M.; Suguna, M.; Al-Hazza, M.I. Equilibrium and kinetic studies of biosorptive removal of 2,4,6-trichlorophenol from aqueous solutions using untreated agro-waste pine cone biomass. Processes 2019, 7, 757. [Google Scholar] [CrossRef] [Green Version]
  18. Aranda-García, E.; Cristiani-Urbina, E. Effect of pH on hexavalent and total chromium removal from aqueous solutions by avocado shell using batch and continuous systems. Environ. Sci. Pollut. Res. 2017, 26, 3157–3173. [Google Scholar] [CrossRef]
  19. Netzahuatl-Muñoz, A.R.; Cristiani-Urbina, M.D.C.; Cristiani-Urbina, E. Chromium biosorption from Cr(VI) aqueous solutions by Cupressus lusitanica bark: Kinetics, equilibrium and thermodynamic studies. PLoS ONE 2015, 10, e0137086. [Google Scholar] [CrossRef] [Green Version]
  20. Aranda-García, E.; Morales-Barrera, L.; Pineda-Camacho, G.; Cristiani-Urbina, E. Effect of pH, ionic strength, and background electrolytes on Cr(VI) and total chromium removal by acorn shell of Quercus crassipes Humb. & Bonpl. Environ. Monit. Assess. 2014, 186, 6207–6221. [Google Scholar] [CrossRef]
  21. Aranda-García, E.; Netzahuatl-Muñoz, A.R.; Cristiani-Urbina, M.; Morales-Barrera, L.; Pineda-Camacho, G.; Cristiani-Urbina, E. Bioreduction of Cr(VI) and chromium biosorption by acorn shell of Quercus crassipes Humb. & Bonpl. J. Biotechnol. 2010, 150, 228. [Google Scholar] [CrossRef]
  22. Aranda-García, E.; Cristiani-Urbina, E. Hexavalent chromium removal and total chromium biosorption from aqueous solution by Quercus crassipes acorn shell in a continuous up-flow fixed-bed column: Influencing parameters, kinetics, and mechanism. PLoS ONE 2020, 15, e0227953. [Google Scholar] [CrossRef] [Green Version]
  23. Mack, C.; Wilhelmi, B.; Duncan, J.; Burgess, J. Biosorption of precious metals. Biotechnol. Adv. 2007, 25, 264–271. [Google Scholar] [CrossRef]
  24. Hu, X.-J.; Liu, Y.; Zeng, G.-M.; You, S.-H.; Wang, H.; Hu, X.; Guo, Y.-M.; Tan, X.; Guo, F.-Y. Effects of background electrolytes and ionic strength on enrichment of Cd(II) ions with magnetic graphene oxide–supported sulfanilic acid. J. Colloid Interface Sci. 2014, 435, 138–144. [Google Scholar] [CrossRef] [PubMed]
  25. Kidgell, J.T.; De Nys, R.; Hu, Y.; Paul, N.A.; Roberts, D.A. Bioremediation of a complex industrial effluent by biosorbents derived from freshwater macroalgae. PLoS ONE 2014, 9, e94706. [Google Scholar] [CrossRef] [Green Version]
  26. Hernández-Estévez, A.; Cristiani-Urbina, E. Nickel(II) biosorption from aqueous solutions by shrimp head biomass. Environ. Monit. Assess. 2014, 186, 7987–7998. [Google Scholar] [CrossRef]
  27. Mitchell, A.; Mellon, M. Colorimetric determination of nickel with dimethylglyoxime. Ind. Eng. Chem. Anal. Ed. 1945, 17, 380–382. [Google Scholar] [CrossRef]
  28. Albadarin, A.B.; Al-Muhtaseb, A.H.; Al-Laqtah, N.A.; Walker, G.; Allen, S.; Ahmad, M.N. Biosorption of toxic chromium from aqueous phase by lignin: Mechanism, effect of other metal ions and salts. Chem. Eng. J. 2011, 169, 20–30. [Google Scholar] [CrossRef]
  29. Febrianto, J.; Kosasih, A.N.; Sunarso, J.; Ju, Y.-H.; Indraswati, N.; Ismadji, S. Equilibrium and kinetic studies in adsorption of heavy metals using biosorbent: A summary of recent studies. J. Hazard. Mater. 2009, 162, 616–645. [Google Scholar] [CrossRef]
  30. Plazinski, W.; Rudzinski, W.; Plazinska, A. Theoretical models of sorption kinetics including a surface reaction mechanism: A review. Adv. Colloid Interface Sci. 2009, 152, 2–13. [Google Scholar] [CrossRef]
  31. Basha, S.; Murthy, Z. Kinetic and equilibrium models for biosorption of Cr(VI) on chemically modified seaweed, Cystoseira indica. Process Biochem. 2007, 42, 1521–1529. [Google Scholar] [CrossRef]
  32. Subbaiah, M.V.; Vijaya, Y.; Kumar, N.S.; Reddy, A.S.; Abburi, K. Biosorption of nickel from aqueous solutions by Acacia leucocephala bark: Kinetics and equilibrium studies. Colloids Surfaces B Biointerfaces 2009, 74, 260–265. [Google Scholar] [CrossRef] [PubMed]
  33. Schiewer, S.; Volesky, B. Ionic strength and electrostatic effects in biosorption of divalent metal ions and protons. Environ. Sci. Technol. 1997, 31, 2478–2485. [Google Scholar] [CrossRef]
  34. Barnie, S.; Zhang, J.; Wang, H.; Yin, H.; Chen, H. The influence of pH, co-existing ions, ionic strength, and temperature on the adsorption and reduction of hexavalent chromium by undissolved humic acid. Chemosphere 2018, 212, 209–218. [Google Scholar] [CrossRef] [PubMed]
  35. Villaescusa, I.; Fiol, N.; Martínez, M.; Miralles, N.; Poch, J.; Serarols, J. Removal of copper and nickel ions from aqueous solutions by grape stalks wastes. Water Res. 2004, 38, 992–1002. [Google Scholar] [CrossRef]
  36. Mogollón, L.; Rodriguez, R.; Larrota, W.; Ramírez, N.; Torres, R. Biosorption of nickel using filamentous fungi. Appl. Biochem. Biotechnol. 1998, 70–72, 593–601. [Google Scholar] [CrossRef]
  37. Thevannan, A.; Mungroo, R.; Niu, C.H. Biosorption of nickel with barley straw. Bioresour. Technol. 2010, 101, 1776–1780. [Google Scholar] [CrossRef] [Green Version]
  38. Djemmoe, L.G.; Njanja, T.E.; Deussi, M.C.N.; Tonle, K.I. Assessment of copper(II) biosorption from aqueous solution by agricultural and industrial residues. Comptes Rendus Chim. 2016, 19, 841–849. [Google Scholar] [CrossRef]
  39. Zhou, W.; Wang, J.; Shen, B.; Hou, W.; Zhang, Y. Biosorption of copper(II) and cadmium(II) by a novel exopolysaccharide secreted from deep-sea mesophilic bacterium. Colloids Surf. B Biointerfaces 2009, 72, 295–302. [Google Scholar] [CrossRef]
  40. Verma, A.; Kumar, S.; Kumar, S. Biosorption of lead ions from the aqueous solution by Sargassum filipendula: Equilibrium and kinetic studies. J. Environ. Chem. Eng. 2016, 4, 4587–4599. [Google Scholar] [CrossRef]
  41. Maurya, N.S.; Mittal, A.K.; Cornel, P.; Rother, E. Biosorption of dyes using dead macro fungi: Effect of dye structure, ionic strength and pH. Bioresour. Technol. 2006, 97, 512–521. [Google Scholar] [CrossRef]
  42. Flores-Chaparro, C.E.; Ruiz, L.F.C.; De La Torre, M.C.A.; Huerta-Diaz, M.A.; Rangel-Mendez, J.R. Biosorption removal of benzene and toluene by three dried macroalgae at different ionic strength and temperatures: Algae biochemical composition and kinetics. J. Environ. Manag. 2017, 193, 126–135. [Google Scholar] [CrossRef] [PubMed]
  43. Agarwal, A.; Upadhyay, U.; Sreedhar, I.; Singh, S.A.; Patel, C.M. A review on valorization of biomass in heavy metal removal from wastewater. J. Water Process. Eng. 2020, 38, 101602. [Google Scholar] [CrossRef]
  44. Vázquez-Palma, D.E.; Netzahuatl-Muñoz, A.R.; Pineda-Camacho, G.; Cristiani-Urbina, E. Biosorptive removal of nickel(II) ions from aqueous solutions by Hass avocado (Persea americana Mill. var. Hass) shell as an effective and low-cost biosorbent. Fresenius Environ. Bull. 2017, 26, 3501–3513. [Google Scholar]
  45. Park, D.; Yun, Y.S.; Jo, J.H.; Park, J.M. Effects of ionic strength, background electrolytes, heavy metals, and redox-active species on the reduction of hexavalent chromium by Ecklonia biomass. J. Microbiol. Biotechnol. 2005, 15, 780–786. [Google Scholar]
  46. Okoronkwo, A.E.; Aiyesanmi, A.F.; Olasehinde, E.F. Biosorption of nickel from aqueous solution by Tithonia diversifolia. Desalin. Water Treat. 2009, 12, 352–359. [Google Scholar] [CrossRef] [Green Version]
  47. Almohammadi, S.; Mirzaei, M. Removal of copper (II) from aqueous solutions by adsorption onto granular activated carbon in the presence of competitor ions. Adv. Environ. Technol. 2016, 2, 85–94. [Google Scholar]
Figure 1. Effect of the NaCl ionic strength on the biosorption of Ni2+ by acorn shell of Quercus crassipes Humb. & Bonpl. (QCS).
Processes 08 01229 g001
Figure 2. Effect of background electrolytes at a concentration of (a) 0.2 mM, (b) 2 mM, and (c) 20 mM on the biosorption of Ni2+ by QCS.
Processes 08 01229 g002
Table 1. Effect of the NaCl ionic strength on the global performance index of the biosorption of Ni2+ by acorn shell of Quercus crassipes (QCS).
Ionic Strength (mM)ξ (%)
0.2−4
2−17
20−26
200−55
2000−58
Table 2. Effect of the NaCl ionic strength on the parameters of different kinetic models for the biosorption of Ni2+ by QCS.
Pseudo-First Order Model Pseudo-Second Order Model
Ionic Strength (mM)qe exp (mmol/g)k1 (1/h)qe1 (mmol/g)r2SSERMSEAICk2 (g/mmol·h)qe2 (mmol/g)r2SSERMSEAIC
Control1.0780.127 ± 0.0411.029 ± 0.0570.96010.07100.0769−65.60.166 ± 0.0541.118 ± 0.0480.98720.02340.0441−81.1
0.21.0300.127 ± 0.0350.998 ± 0.0490.97710.03830.0619−60.00.158 ± 0.0551.079 ± 0.0480.98920.01810.0426−69.0
20.9100.102 ± 0.0380.863 ± 0.0610.94220.07510.0791−64.80.148 ± 0.0610.953 ± 0.0590.97750.02920.0494−78.0
200.7980.103 ± 0.0250.776 ± 0.0380.97720.02490.0476−72.70.142 ± 0.0350.860 ± 0.0340.99160.00920.0289−85.6
2000.5100.044 ± 0.0210.512 ± 0.0590.92290.03720.0557−74.60.138 ± 0.1040.565 ± 0.0730.95210.02310.0439−81.3
20000.4910.070 ± 0.0370.467 ± 0.0470.92110.03390.0556−68.70.133 ± 0.0840.547 ± 0.0630.92750.01830.0408−76.7
ElovichIntraparticle Diffusion
Ae (mmol/g·h)Be (g/mmol)r2SSERMSEAICkid (mmol/g·h0.5)c (mmol/g)r2SSERMSEAIC
Control 1.885 ± 1.0956.577 ± 0.7070.99640.00660.0234−98.850.090 ± 0.0260.259 ± 0.1900.82270.32310.1641−44.37
0.2 1.003 ± 0.5316.216 ± 0.6760.99690.00520.0229−83.860.090 ± 0.0230.184 ± 0.1730.88570.19100.1382−40.68
2 0.671 ± 0.3966.728 ± 0.8920.99310.00900.0273−94.560.078 ± 0.0190.188 ± 0.1390.86790.17140.1195−53.24
20 0.274 ± 0.0726.391 ± 0.4700.99720.00310.0167−99.940.072 ± 0.0140.127 ± 0.0990.92480.08240.0866−57.13
200 0.142 ± 0.0889.761 ± 1.7690.98410.00760.0253−96.770.047 ± 0.0060.061 ± 0.0470.95490.02170.0426−82.15
2000 0.071 ± 0.0408.420 ± 1.7290.97950.00880.0283−86.190.046 ± 0.0050.046 ± 0.0390.96970.01300.0344−81.10
Fractional Power
kFP (mmol/g)v (1/h)kFPv (mmol/g·h)r2SSERMSEAIC
Control 0.503 ± 0.0400.168 ± 0.0190.08420.99630.00670.0237−98.58
0.2 0.427 ± 0.0380.193 ± 0.0210.08260.99750.00420.0206−86.41
2 0.360 ± 0.0360.202 ± 0.0240.07290.99480.00680.0238−98.39
20 0.251 ± 0.0280.256 ± 0.0270.06410.99510.00540.0222−92.55
200 0.131 ± 0.0200.299 ± 0.0350.03900.99260.00360.0172−107.5
2000 0.102 ± 0.0220.342 ± 0.0490.03500.98900.00480.0208−94.22
Table 3. Effect of background electrolytes at concentrations of 0.2, 2, and 20 mM on the global performance index of the biosorption of Ni2+ by QCS.
Background Electrolyteξ (%)
0.2 mM2 mM20 mM
KCl−6−8−21
NaNO3−6−12−20
Na2SO4−5−10−27
CaCl2−6−20−54
MgSO4−7−23−77
MgCl2−7−24−42
Table 4. Parameters of the pseudo-first order and pseudo-second order models for the biosorption of Ni2+ by QCS at 0.2, 2, and 20 mM of background electrolytes.
Pseudo-First Order Model Pseudo-Second Order Model
Concentration (mM)Background Electrolyteqe exp (mmol/g)k1 (1/h)qe1 (mmol/g)r2SSERMSEAICk2 (g/mmol·h)qe2 (mmol/g)r2SSERMSEAIC
Control1.0000.142 ± 0.0260.957 ± 0.0470.97240.06330.0629−94.00.170 ± 0.0351.034 ± 0.0410.98700.02990.0433−107.5
0.2KCl0.9290.180 ± 0.0440.887 ± 0.0580.94310.09830.0784−86.10.280 ± 0.0770.936 ± 0.0470.97340.04590.0536−99.8
NaNO30.9430.135 ± 0.0420.901 ± 0.0500.92740.14520.0953−91.60.176 ± 0.0790.975 ± 0.0410.95740.08520.0730−104.6
Na2SO40.9370.163 ± 0.0380.902 ± 0.0570.94930.09290.0762−87.10.239 ± 0.0680.957 ± 0.0510.97240.05060.0562−98.0
CaCl20.9090.193 ± 0.0380.876 ± 0.0460.96280.06240.0624−94.30.308 ± 0.0680.922 ± 0.0360.98360.02760.0415−108.9
MgSO40.9120.190 ± 0.0490.869 ± 0.0600.93550.10540.0812−84.80.309 ± 0.0940.914 ± 0.0510.96720.05370.0579−97.0
MgCl20.9090.192 ± 0.0490.870 ± 0.0590.93710.10250.0800−85.30.315 ± 0.0950.914 ± 0.0500.96790.05230.0572−97.4
2KCl0.9310.133 ± 0.0400.882 ± 0.0700.93550.13970.0935−79.70.159 ± 0.0650.967 ± 0.0770.95530.09680.0778−86.4
NaNO30.8650.187 ± 0.0400.829 ± 0.0720.95290.07230.0672−79.10.308 ± 0.0660.875 ± 0.0700.97710.03520.0469−88.6
Na2SO40.8970.181 ± 0.0600.844 ± 0.0750.90930.16250.1008−77.00.272 ± 0.1210.899 ± 0.0740.93830.11050.0831−84.0
CaCl20.7850.121 ± 0.0350.782 ± 0.0660.94540.07320.0750−71.70.174 ± 0.0710.845 ± 0.0710.96020.05330.0641−76.4
MgSO40.7090.119 ± 0.0290.765 ± 0.0620.96440.03160.0562−62.20.192 ± 0.0590.812 ± 0.0570.97950.01810.0426−68.9
MgCl20.7570.108 ± 0.0330.755 ± 0.0650.94650.06960.0732−72.40.153 ± 0.0650.824 ± 0.0730.96020.05170.0631−76.9
20KCl0.8100.152 ± 0.0520.737 ± 0.0630.89680.14900.0910−90.50.230 ± 0.0880.811 ± 0.0580.94990.07240.0634−104.9
NaNO30.7950.204 ± 0.0540.737 ± 0.0480.93090.09210.0715−100.10.350 ± 0.1040.793 ± 0.0410.96660.04450.0497−114.6
Na2SO40.6670.524 ± 0.0900.642 ± 0.0200.97790.01900.0325−131.71.325 ± 0.3550.671 ± 0.0230.97660.02010.0334−130.5
CaCl20.4700.212 ± 0.0720.427 ± 0.0400.90310.03830.0505−95.80.698 ± 0.3350.451 ± 0.0400.92870.02820.0433−101.0
MgSO40.3070.211 ± 0.0540.211 ± 0.0160.95760.00400.0175−115.41.158 ± 0.5720.233 ± 0.0230.94860.00480.0192−112.5
MgCl20.5840.047 ± 0.0240.627 ± 0.0980.86530.13350.0913−80.60.089 ± 0.0630.715 ± 0.1170.91170.08750.0739−88.1
Table 5. Parameters of the Elovich and intraparticle diffusion models for the biosorption of Ni2+ by QCS at 0.2, 2, and 20 mM of background electrolytes.
Elovich Intraparticle Diffusion
Concentration (mM)Background ElectrolyteAe (mmol/g·h)Be (g/mmol)r2SSERMSEAICkid (mmol/g·h0.5)c (mmol/g)r2SSERMSEAIC
Control0.418 ± 0.1105.369 ± 0.4180.99160.01930.0348−115.30.087 ± 0.0140.183 ± 0.0890.91260.20060.1120−73.22
0.2KCl0.918 ± 0.1966.937 ± 0.3570.99600.00690.0208−133.90.074 ± 0.0140.236 ± 0.0910.88030.20670.1137−72.69
NaNO30.856 ± 0.3047.391 ± 0.6320.98910.01680.0324−117.90.069 ± 0.0150.222 ± 0.0910.86410.20880.1142−72.51
Na2SO40.738 ± 0.2486.552 ± 0.5600.98900.02010.0354−114.70.077 ± 0.0150.224 ± 0.0920.88400.21240.1152−72.20
CaCl21.051 ± 0.3927.210 ± 0.6250.98880.01880.0343−115.80.072 ± 0.0160.245 ± 0.1020.84370.26230.1280−68.40
MgSO41.078 ± 0.3317.306 ± 0.5180.99250.01230.0278−123.40.072 ± 0.0150.243 ± 0.0920.86900.21410.1157−72.06
MgCl21.128 ± 0.3557.362 ± 0.5290.99220.01260.0281−123.00.071 ± 0.0150.247 ± 0.0940.86430.22110.1175−71.48
2KCl0.284 ± 0.1395.350 ± 0.8450.96890.06740.0649−92.850.085 ± 0.0130.135 ± 0.0840.91870.17600.1049−75.58
NaNO30.409 ± 0.1375.765 ± 0.5680.98630.02750.0414−109.00.082 ± 0.0110.172 ± 0.0710.93720.12570.0886−81.65
Na2SO40.600 ± 0.4076.655 ± 1.1900.95480.08100.0712−89.550.075 ± 0.0160.197 ± 0.0980.86530.24120.1228−69.21
CaCl20.257 ± 0.1356.352 ± 1.0610.97150.03820.0542−81.420.070 ± 0.0120.125 ± 0.0770.92230.10410.0895−66.38
MgSO40.342 ± 0.1177.261 ± 0.7400.99200.00710.0266−80.220.062 ± 0.0140.151 ± 0.0840.91260.07740.0880−51.52
MgCl20.191 ± 0.0986.178 ± 1.0740.97090.03790.0540−81.550.069 ± 0.0110.100 ± 0.0710.93290.08720.0819−69.02
20KCl0.399 ± 0.1286.997 ± 0.4180.98650.01960.0330−131.10.069 ± 0.0100.167 ± 0.0640.91420.12380.0830−94.19
NaNO30.815 ± 0.3348.064 ± 0.6390.98390.02140.0345−129.30.064 ± 0.0140.217 ± 0.0830.84400.20770.1074−83.84
Na2SO40.425 ± 0.58715.69 ± 0.7900.92190.06750.0612−106.30.041 ± 0.0190.323 ± 0.1160.53240.40250.1495−70.61
CaCl20.576 ± 0.47914.73 ± 1.6650.95050.01950.0361−107.20.037 ± 0.0090.120 ± 0.0540.83150.06650.0666−86.41
MgSO40.163 ± 0.17024.01 ± 7.8750.91130.00820.0253−104.30.024 ± 0.0090.050 ± 0.0390.74430.02390.0429−88.45
MgCl20.074 ± 0.0416.100 ± 1.5190.94530.05420.0582−96.780.062 ± 0.0090.040 ± 0.0420.94860.05090.0564−97.91
Table 6. Parameters of the fractional power model for the biosorption of Ni2+ by QCS at 0.2, 2, and 20 mM of background electrolytes.
Fractional Power
Concentration (mM)Background ElectrolytekFP (mmol/g) v (1/h)kFPv (mmol/g·h)r2SSERMSEAIC
Control0.289 ± 0.0430.275 ± 0.0360.07930.97680.05340.0578−97.02
0.2KCl0.340 ± 0.0250.221 ± 0.0180.07530.99060.01620.0318−118.6
NaNO30.320 ± 0.0360.220 ± 0.0280.07050.97860.03290.0453−105.8
Na2SO40.327 ± 0.0350.233 ± 0.0270.07610.98250.03210.0448−106.2
CaCl20.352 ± 0.0410.210 ± 0.0290.07410.97550.04110.0507−101.8
MgSO40.347 ± 0.0270.213 ± 0.0200.07380.98870.01850.0340−116.1
MgCl20.351 ± 0.0280.210 ± 0.0200.07380.98790.01970.0351−115.0
2KCl0.232 ± 0.0530.308 ± 0.0550.07140.95790.09110.0755−87.43
NaNO30.269 ± 0.0280.278 ± 0.0260.07470.98810.02370.0385−111.6
Na2SO40.295 ± 0.0610.246 ± 0.0510.07240.94420.09990.0790−85.77
CaCl20.209 ± 0.0470.294 ± 0.0530.06140.96590.04570.0593−78.71
MgSO40.236 ± 0.0210.254 ± 0.0220.05980.99420.00510.0226−84.11
MgCl20.179 ± 0.0450.319 ± 0.0590.05720.96460.04610.0595−78.6
20KCl0.245 ± 0.0250.264 ± 0.0260.06450.98450.02240.0351−128.4
NaNO30.301 ± 0.0350.216 ± 0.0300.06520.97190.03740.0456−118.1
Na2SO40.423 ± 0.0590.107 ± 0.0380.04510.90780.07940.0664−103.1
CaCl20.175 ± 0.0310.213 ± 0.0450.03720.94720.02080.0373−106.1
MgSO40.085 ± 0.0270.239 ± 0.0930.02040.87460.01170.0300−99.14
MgCl20.101 ± 0.0290.404 ± 0.0690.04060.95640.04320.0520−100.9

