Abstract
In this study, we investigate how drugs systemically affect genes via pathways by integrating information from interactions between chemical compounds and molecular expression datasets, and from pathway information such as gene sets using mathematical models. First, we adopt drug-induced gene expression datasets; then, employ gene set enrichment analysis tools for selecting candidate enrichment pathways; and lastly, implement the inverse algorithm package for identifying gene–gene regulatory networks in a pathway. We tested LY294002-induced datasets of the MCF7 breast cancer cell lines, and found a CELL CYCLE pathway with 101 genes, ERBB signaling pathway consisting of 82 genes, and MTOR pathway consisting of 45 genes. We consider two interactions: quantity strength depending on number of interactions, and quality strength depending on weight of interaction as positive (+) and negative (−) interactions. Our methods revealed ANAPC1-CDK6 (−0.412) and ORC2L- CHEK1(0.951) for the CELL CYCLE pathway; INS-RPS6 (−3.125) and PRKAA2-PRKAA2 (+1.319) for the MTOR pathway; and CBLB-RPS6KB1 (−0.141), RPS6KB1-CBLC (+0.238) for the ERBB signaling pathway to be top quality interactions. Top quantity interactions discovered include 12; the CDC (−,+) gene family for the CELL CYCLE pathway, 20; PIK3 (−), 23; PIK3CG (+) for the MTOR pathway, 11; PAK (−), 10; PIK3 (+) for the ERBB signaling pathway.
1. Introduction
Even with the enormous annual expense (~1.8 billion US dollars) associated with drug development [1] and the time-consuming 10–15-year process required to bring a novel drug to market [2,3], the new drug approval rating averaged only 2.01% between 2000 and 2008 [4,5]. To mitigate the time lag, drug repositioning, in which existing approved drugs are recycled for new diseases by integrating targets using computational methods, has been suggested as a pharmaceutical alternative [1]. Target genes of a drug are traditionally identified by chemical similarity [6]. The advantages of using gene expression response of cell lines after treatment include the ability to identify systematic drug influence and the fact that no prior information is required [7,8].
Computational drug studies are based on the similarity of chemical components, physical binding of proteins, and the kernel diffusion method, which integrates gene expression and network data [9,10,11]. A recent study developed a local radiality method for identifying drug–target interactions by integrating topological and differentially expressed gene information [12]. In particular, the study demonstrated a downstream method by identifying the affected pathway from drug-target and gene–gene connections [12]. A recent study [13] reported an approach for the systemic negative feedback gene network by inducing a drug for colorectal cancer. The advantages of the data-driven drug target network model are revealing potential drug targets and being excluded considering potential affect to side effects [14]. Consequently, the computational approach of repositioning drugs results in advantages of substantially reduced time, cost, and risk development. Additionally, potential insights of the systemic regulatory networks of drug-targets would be provided [3,5,7,10]. Functional gene sets, referred to as pathways, work together to control cell processes and/or inform molecular interaction, and are provided from many web sources such as the Kyoto Encyclopedia of Gene and Genomes (KEGG) [15], BioCarta et al. [16]. Since abnormally activated genes in the pathway lead to disease, finding genes via pathways from drug induced datasets may suggest promising candidate drug target genes for treatment of a disease [2,17] and a drug target network [18]. In addition, the relationships among those drug target genes provide systemic insights. Kuhn [19] introduced a search tool for interactions of chemicals (STITCH) for network information including 2200 drugs, 1.5 million genes, and 68,000 chemicals. The chemical interactions propose that the inhibition or activation of the individual components could imply direct efficacy from chemical component to the molecular level, as well as illuminating the relation of molecular mechanism [19,20,21]. In this study, we are interested in the latter molecular mechanism through gene–gene relations from affected gene sets.
The inverse problem package has been used for identifying parameters in many fields such as parameters in constitutive equations in engineering [22] or gene regulatory networks in systems biology [23]. The inverse algorithm is a parameter searching tool including the optimization method, line search method for searching new parameters, direct code for generating synthetic datasets with noise, and error function for calculating differences when comparing real datasets to artificial datasets. We used and norm for error functions as follows, , and where R is real datasets and C is synthetic datasets. Here, we employed the inverse algorithm package for identifying the relationship of genes in the drug enrichment pathway.
Breast cancer is the leading cancer in women and the second common cancer overall. The total direct medical costs including diagnosis, treatment, and follow up associated with breast cancer are very expensive [24]. Despite all efforts over several decades, breast cancer is the leading cause of death and malignancy in females, and will be expected to reach 16 million by 2025 [25]. Here, we employed the MCF7 breast cancer cell line which has been proved to be a suitable model for breast cancer investigation [26]. We believe that the approach presented here can help the treatment of the cancer as well as reduce the burden of the expense and its side effects.
The novelty of our study is the downstream approach that consists in first identifying systemically affected pathways (gene sets), and then finding gene networks using an inverse problem algorithm which can be used to explore systemic drug efficacy.
2. Materials
We downloaded the 2017 version of the MCF7 breast cancer cell line dataset, which induced 182 drugs (GPL3921), from the Gene Expression Omnibus (GEO). The MCF7 dataset consisted of 22,268 probes and 218 samples divided into 182 cancer cell lines and 36 control samples using Affymetrix HT human genome U133A array platform by Lamb [27]. We downloaded platform information from BioMart to match probe to gene names, which concluded 13,236 unique genes. The number of unique drugs is 87 out of 182. Among them, we extracted eight samples induced by LY294002. We also downloaded 186 KEGG pathways gene sets in 2019 for molecular path information, and a gene set enrichment analysis (GSEA) tool (to identify enrichment on those gene sets. Additionally, we used web-based open source STITCH (search tool for interactions of chemicals), which shows networks between drugs, pathways, and genes [23].
3. Methods
The existing gene set enrichment analysis (GSEA) tool was employed to find drug associated enrichment pathways by calculating the enrichment score of gene expression level based on the Kolmogorov–Smirnov statistical test [28]. In addition, we used open source analysis STITCH, which offers networks between 1.5 million genes, 2200 drugs, and 68,000 chemicals. To identify enrichment pathways, we compared cancer datasets to normal datasets; to identify relationships between genes in the selected pathways, we used only cancer datasets. In Figure 1, blue boxes represent input datasets, orange boxes represent input pathway information and the gray box identifies gene–gene networks.
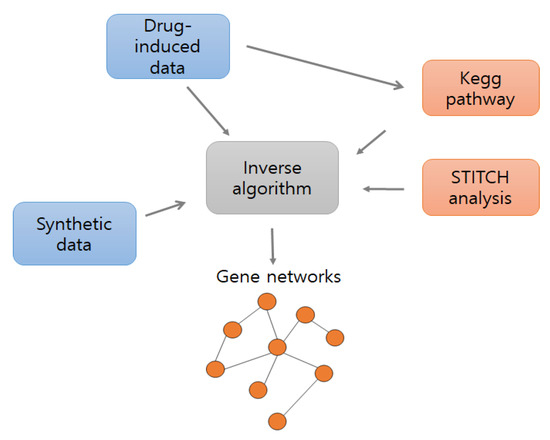
Figure 1.
Overall flowchart of the model. Blue boxes represent datasets, orange boxes represent pathway information, and the gray box represents inverse algorithm.
The inverse algorithm consists of two parts: one for searching parameters and the other for generating synthetic datasets. The main elements of parameter searching include the optimization method, line search, and error function. For the optimization method, we used the Broyden–Fletcher–Goldfarb–Shanno-algorithm [29] as it is computationally efficient, being constructed of an inverse Hessian matrix to determine the values of next step iteration. The error function was used to find the global minimum by integrating the difference between real and synthetic datasets and provides a stop condition for iteration. Here, we used norm below.
To analyze the influence of the drug to cancer genes, the following linear combination was employed: [30], where represent clinical and synthetic datasets, respectively.
Each element represents .
The element of matrix W represents the influence of the th gene on th gene which we refer to as interaction weight. represents logarithm base 2 of the expression level of MCF7 breast cancer datasets downloaded from Gene Expression Omnibus (GEO). represents the synthetic datasets generated based on a clinical dataset with white noise using Gaussian distribution such as . The flowchart of the proposed scheme is shown below (Figure 2). The algorithm iterates until the stop criteria in the blue dotted-line box are satisfied to infer parameters .
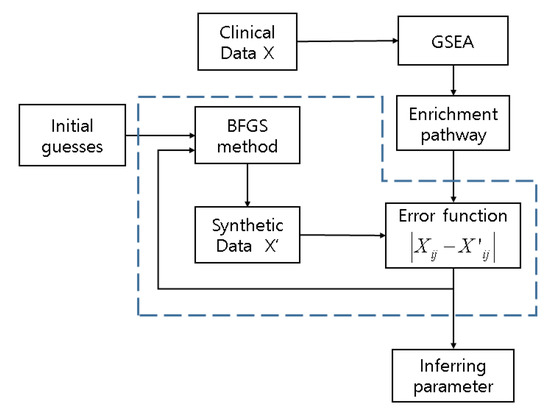
Figure 2.
A flowchart of the proposed computational model scheme. Diagram in dots represents inverse algorithm. Synthetic data X’ are generated based on discovered genes from enrichment pathway by GSEA. Clinical data X are MCF7 breast cancer cell lines induced by LY294002. is used for error function.
4. Results
We extracted enrichment pathways based on enrichment score from Gene Set Enrichment Analysis (GSEA) by comparing cancer gene expression datasets (eight samples) induced by LY294002 to normal datasets (36 samples), in parallel, matched with putative pathways suggested by STITCH. We obtained the CELL CYCLE pathway for the most differentially expressed pathway from GSEA as ordered by the normalized enriched score (NES), ERBB signaling pathway for the least false discovery rate from STITCH, and the MTOR pathway generated from both GSEA and STITCH ordered within the top five. We then calculated the interaction weight between 101 genes of the CELL CYCLE pathway, 82 genes of the ERBB signaling pathway, and 45 genes of the MTOR pathway. The direct code for performing inverse problem is generated from synthetic datasets by adding white noise where is to cancer datasets. We obtained a total of 10,201 relationships in the CELL CYCLE pathway, 6724 relationships in ERBB pathways, and 2025 relationships in the MTOR pathway. In the results, we considered quantity interaction depending on the number of connections and quality interaction depending on computed weight. The computed interaction weights from inverse problem differed in independent pathways; therefore, weight cutoffs were different for each pathway. We selected the top 100 interactions. Analysis from STITICH presents 10 genes affected by LY294002 including FOXO3, RPS6KB1, PIK3C (A, B, D, G) GSK3B, AKT1, PTGS2, and MTOR. After we refined the datasets with KEGG pathway information, the ERBB signaling pathway included 82 genes and the MTOR pathway included 45 genes. Eight of 10 genes were regulated in the ERBB signaling pathway (consisting of 82 KEGG genes), and seven genes were regulated in MTOR genes (consisting of 45 KEGG genes). We presented the gene name where appropriate; otherwise, we presented gene families for the quantity strength.
5. CELL CYCLE Pathway
We obtained the CELL CYCLE pathway including 101 genes as the most enriched pathway from GSEA performance with 42 core genes, while this pathway was not indicated in STITCH. Since interaction weights vary depending on the pathway, we selected the top 100 interactions for each positive and negative. The CELL CYCLE pathway demonstrated the top five negative quality strengths (−) in Table 1: ANAPC1-CDK5, CDKN2D-YWHAB, CCNA1-CDKN2A, CCNH-RB1, PTTG1-MCM7. Additionally, the top five quantity strengths include the CDC, CCN, CDK, MCM, and ORC family. Table 1 shows the top five positive quality strengths: ORC2L-CHEK1, PTTG1-SFN, CDC16-PTTG2, YWKAB-PKMYT1, and BUB3-PRKDC. Furthermore, the top 5 quantity strengths show that CDC families are activated by 12 genes, CCN (A, B, D, E, H) are activated by 10 genes, the MCM family including MCM (2, 3, 4, 5, 6, 7) is activated by seven, and the ORC family including ORC (1L, 2L, 3L, 4L, 5L, 6L) is activated by seven.

Table 1.
Gene–gene interaction in the CELL CYCLE pathway. (A) Top five negative interactions and (B) top five positive interactions. Strain genes are affected by stress genes, and weight is interaction strength computed by inverse problem.
As a stress gene, minichromosome maintenance deficient 7 (MCM7) is also overexpressed in esophageal squamous tumor with poor survival time [31]. The result of CCNA1 is also supported that CCNA1 was suggested as inhibitor in cell cycle by using DNA methylation and gene expression levels in MCF7 cell line [32]. In the case of CDK6, there is no evidence of association of SNPs in breast cancer [33]; however, other studies suggested profoundly related with ER+ breast cancer [34,35]. Therefore, our results may help the predictive target genes of specific drug and systemic insight of the mechanism.
6. MTOR Pathway
The MTOR pathway including 45 genes was selected from GSEA with nine core statistically computed genes: AKT3, PIK3CG, AKT2, RPS6KA6, PIK3CA, ULK2, PGF, VEGFC, and ULK1. The MTOR pathway was connected with seven genes in the STITCH with a 1.11 × 10¹⁴ false discovery rate. We implemented the inverse algorithm with 45 genes of KEGG pathway information, and presented the results in (Table 2) for negative and (B) for positive quality interactions and meaningful quantity interaction from the top 100 selected from each of negative and positive interactions. In the results of negative quantity interactions, we demonstrate stress genes and their frequency from seven unique genes—shown in (Table 2). Especially, PIK3CG and AKT1 are indicated from STITCH to bind LY294002 in the MTOR pathway. In the positive interaction, specific genes instead of gene families are targeted by stress genes.
Table 2.
Gene–gene interaction in MTOR pathway. (A) Top five negative interactions. (B) Top five positive interactions. Target genes are affected by trigger genes, and weight is interaction strength computed by inverse problem.
We provide selected validation for our findings. For example, ribosomal protein S6 (RPS6) was associated with breast cancer by targeting miR-129-5p [36] and regulating PIK3CA [37]. Recent work suggested that PIK3CG was a targeted therapy for claudin-low breast cancer; we also found the quantitative target gene of the given drug [38]. The diagram shown in Figure 3 illustrates an aggregation of both negative and positive quality interactions presented in Table 2.
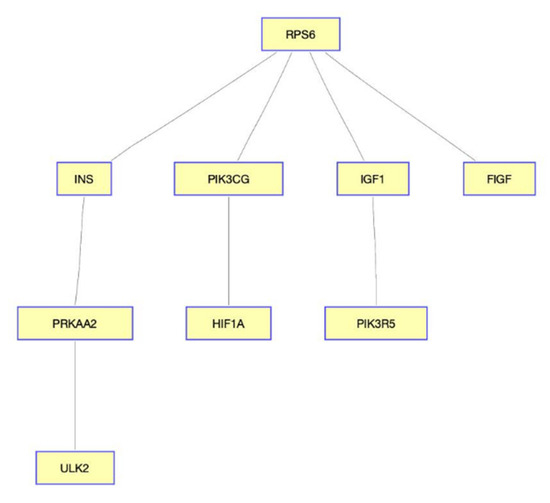
Figure 3.
Diagram of the gene interaction network in MTOR signaling pathway. RPS6 plays an important role in MTOR signaling pathway, implying the possibility of the drug-targeted genes.
7. ERBB Signaling Pathway
The ERBB signaling pathway was selected from STITCH with 1.17 × 10¹⁵ FDR, not from GSEA. Using the inverse algorithm, 100 interactions were obtained with negative and positive weights. Results in Table 3 present stress genes that are identical for each negative (RPS6KB1) and positive weight (CBLC). Note that the number of unique negative and positive stress genes was, respectively, only two (RPS6KB1, MYC) and four (CBLC, CAMK2D, EREG, and SHC3). The most quantified target genes were PAK and PIK3.
Table 3.
Gene–gene interaction in ERBB signaling pathway. (A) Top five negative interactions. (B) top five positive interactions. Response genes are affected by target genes, and weight is interaction strength computed by inverse problem.
The selected validation of our results are presented as follows: p21-activated kinase 2 (PAK2) is known to play a critical role in breast cancer cell invasion [39], and p21-activated kinase 7 (PAK7) is another known oncogene [40]. Our method shows that PAK2 and PAK7 are inhibited by RPS6KB1 which responds to LY294002. However, RPS6KB1 is overexpressed in various cancers, implying the likelihood of poor prognosis [41,42,43]. In the previous experiment study, Cbl proto-oncogene C (CBLC) was identified as regulating PARP in breast cancer [44]. Discrimination of the presented method from previous works is to discover interaction genes rather than individual markers. As an example, the gene interaction within the pathway presented in Table 3 is schematically illustrated in Figure 4, which may help understanding systemic drug efficacy.
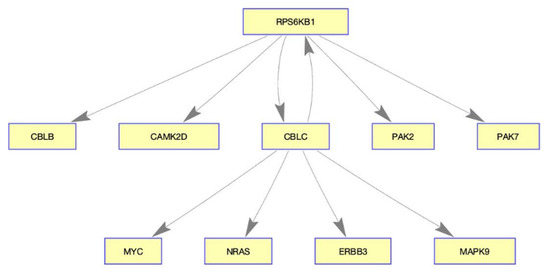
Figure 4.
Diagram of the gene interaction in ERBB signaling pathway. RPS6KB1 and CBLC play important roles in this network, implying the possibility of the drug-targeted genes.
8. Discussion
In this study, we identified LY-294002 drug induced gene–gene networks in the enrichment pathways obtained from GSEA and/or web-based analysis tool STITCH. We selected three pathways: the CELL CYCLE pathway from GSEA, the ERBB signaling pathway from STITCH, and the MTOR pathway from GSEA and STITCH. To compute the interaction weight between genes in the selected pathways, we employed the inverse problem package. The inverse algorithm, which is a well-known parameter searching algorithm, includes three major parts: an optimization method for searching parameters, direct code for generating synthetic datasets, error function for computing least squares minimization. The advantages of this proposed study are that no prior knowledge requirement exists, and that systemic drug influence insights can be freely explored. In the results, we presented quantity and quality interactions with weight. Some meaningful interactions of the part of oncogene networks were discovered: PTTG1-MCM7 from the CELL CYCLE pathway [45,46] and PIK3CG-RPS6 from the MTOR pathway [36,37]. In addition, PTTG1 was validated as a biomarker of tumor cells including breast cancer in in vivo and in vitro experiments [45]. Especially, CDK6 in the cell cycle and PIK3CG (not PIK3CA) in the MTOR pathway are recently focused in breast cancer [33,37]. The interaction of RPS6KB1-PAK2(7) from the ERBB signaling pathway was supported with a recent study carried out by Zhang [47], in which PAK2 was the strongest resistance inducer of tamoxifen in breast cancer. Those genes were identified individually, while our findings are gene interactions with activation (positive) or inhibition (negative) of which systemic drug efficacy can be understood. Even though we provided meaningful validation for our results, the computational approaches always have been faced with the limitation of application to the real clinical medicine. Therefore, this network needs to confirm laboratory experiments in the future. In addition, as the preliminary study presented here, a single drug and limited pathways are tested. For generalizability of this approach, we need to test various drugs and pathway information based on breast cancer.
Funding
This work was supported by the Korean Research Foundation (NRF-2017R1A2B4010684).
Conflicts of Interest
The author declares that there is no conflict of interest.
References
- Wang, W.; Yang, S.; Zhang, X.; Li, J. Drug repositioning by integrating target information through a heterogeneous network model. Bioinformatics 2014, 30, 2923–2930. [Google Scholar] [CrossRef] [PubMed]
- Kim, S. Pathway Interactions Based on Drug-Induced Datasets. Cancer Inform. 2019, 18. [Google Scholar] [CrossRef] [PubMed]
- Ashburn, T.T.; Thor, K.B. Drug repositioning: Identifying and developing new uses for existing drugs. Nat. Rev. Drug Discov. 2004, 3, 673–683. [Google Scholar] [CrossRef] [PubMed]
- Pammolli, F.; Magazzini, L.; Riccaboni, M. The productivity crisis in pharmaceutical R&D. Nat. Rev. Drug Discov. 2011, 10, 428–438. [Google Scholar] [CrossRef] [PubMed]
- Yeu, Y.; Yoon, Y.; Park, S. Protein localization vector propagation: A method for improving the accuracy of drug repositioning. Mol. BioSyst. 2015, 11, 2096–2102. [Google Scholar] [CrossRef]
- Imming, P.; Sinning, C.; Meyer, A. Drugs, their targets and the nature and number of drug targets. Nat. Rev. Drug Discov. 2006, 5, 821–834. [Google Scholar] [CrossRef]
- Kim, I.-W.; Jang, H.; Kim, J.H.; Kim, M.G.; Kim, S.; Oh, J.M. Computational Drug Repositioning for Gastric Cancer using Reversal Gene Expression Profiles. Sci. Rep. 2019, 9, 2660. [Google Scholar] [CrossRef]
- Sirota, M.; Dudley, J.T.; Kim, J.; Chiang, A.P.; Morgan, A.A.; Sweet-Cordero, A.; Sage, J.; Butte, A.J. Discovery and Preclinical Validation of Drug Indications Using Compendia of Public Gene Expression Data. Sci. Transl. Med. 2011, 3, 96ra77. [Google Scholar] [CrossRef]
- Napolitano, F.; Carrella, D.; Mandriani, B.; Vaquero, S.P.; Sirci, F.; Medina, D.L.; Brunetti-Pierri, N.; Di Bernardo, D. gene2drug: A computational tool for pathway-based rational drug repositioning. Bioinformatics 2018, 34, 1498–1505. [Google Scholar] [CrossRef]
- Napolitano, F.; Zhao, Y.; Moreira, V.M.; Tagliaferri, R.; Kere, J.; D’Amato, M.; Greco, D. Drug repositioning: A machine-learning approach through data integration. J. Cheminform. 2013, 5, 30. [Google Scholar] [CrossRef]
- Laenen, G.; Thorrez, L.; Börnigen, D.; Moreau, Y. Finding the targets of a drug by integration of gene expression data with a protein interaction network. Mol. BioSyst. 2013, 9, 1676. [Google Scholar] [CrossRef] [PubMed]
- Işik, Z.; Baldow, C.; Cannistraci, C.V.; Schroeder, M. Drug target prioritization by perturbed gene expression and network information. Sci. Rep. 2015, 5, 17417. [Google Scholar] [CrossRef] [PubMed]
- Park, S.-M.; Hwang, C.Y.; Choi, J.; Joung, C.Y.; Cho, K.-H. Feedback analysis identifies a combination target for overcoming adaptive resistance to targeted cancer therapy. Oncogene 2020, 39, 3803–3820. [Google Scholar] [CrossRef] [PubMed]
- Shahreza, M.L.; Ghadiri, N.; Mousavi, S.R.; Varshosaz, J.; Green, J.R. A review of network-based approaches to drug repositioning. Brief. Bioinform. 2017, 19, 878–892. [Google Scholar] [CrossRef] [PubMed]
- Kanehisa, M.; Goto, S. KEGG: Kyoto Encyclopedia of Genes and Genomes. Nucleic Acids Res. 2000, 28, 27–30. [Google Scholar] [CrossRef]
- Nishimura, D. BioCarta. Biotech Software & Internet Report. Comput. Softw. J. Sci. 2001, 2, 117–120. [Google Scholar]
- Kim, S. Identifying dynamic pathway interactions based on clinical information. Comput. Biol. Chem. 2017, 68, 260–265. [Google Scholar] [CrossRef]
- Luo, Y.; Zhao, X.; Zhou, J.; Yang, J.; Zhang, Y.; Kuang, W.; Peng, J.; Chen, L.; Zeng, J. A network integration approach for drug-target interaction prediction and computational drug repositioning from heterogeneous information. Nat. Commun. 2017, 8, 573. [Google Scholar] [CrossRef]
- Kuhn, M.; Von Mering, C.; Campillos, M.; Jensen, L.J.; Bork, P. STITCH: Interaction networks of chemicals and proteins. Nucleic Acids Res. 2007, 36, D684–D688. [Google Scholar] [CrossRef]
- Huang, R.; Wallqvist, A.; Thanki, N.; Covell, D.G. Linking pathway gene expressions to the growth inhibition response from the National Cancer Institute’s anticancer screen and drug mechanism of action. Pharm. J. 2005, 5, 381–399. [Google Scholar] [CrossRef][Green Version]
- Rabow, A.A.; Shoemaker, R.H.; Sausville, E.A.; Covell, D.G. Mining the National Cancer Institute’s tumor-screening database: Identification of compounds with similar cellular activities. J. Med. Chem. 2002, 45, 818–840. [Google Scholar] [CrossRef] [PubMed]
- Kim, S.; Kreider, K. Parameter identification for nonlinear elastic and viscoelastic plates. Appl. Numer. Math. 2006, 56, 1538–1554. [Google Scholar] [CrossRef]
- Kim, S.; Kim, J.; Cho, K.-H. Inferring gene regulatory networks from temporal expression profiles under time-delay and noise. Comput. Biol. Chem. 2007, 31, 239–245. [Google Scholar] [CrossRef]
- Capri, S.; Russo, A.G. Cost of breast cancer based on real-world data: A cancer registry study in Italy. BMC Health Serv. Res. 2017, 17, 84. [Google Scholar] [CrossRef] [PubMed]
- Sanad, M.F.; Shalan, A.E.; Bazid, S.M.; Abu Serea, E.S.; Hashem, E.M.; Nabih, S.; Ahsan, A. A graphene gold nanocomposite-based 5-FU drug and the enhancement of the MCF-7 cell line treatment. RSC Adv. 2019, 9, 31021–31029. [Google Scholar] [CrossRef]
- Comşa, Ş.; Cimpean, A.M.; Raica, M. The Story of MCF-7 Breast Cancer Cell Line: 40 years of Experience in Research. Anticancer Res. 2015, 35, 3147–3154. [Google Scholar]
- Lamb, J.; Crawford, E.D.; Peck, D.; Modell, J.W.; Blat, I.C.; Wrobel, M.J.; Lerner, J.; Brunet, J.-P.; Subramanian, A.; Ross, K.N.; et al. The Connectivity Map: Using Gene-Expression Signatures to Connect Small Molecules, Genes, and Disease. Science 2006, 313, 1929–1935. [Google Scholar] [CrossRef]
- Subramanian, A.; Tamayo, P.; Mootha, V.K.; Mukherjee, S.; Ebert, B.L.; Gillette, M.A.; Paulovich, A.; Pomeroy, S.L.; Golub, T.R.; Lander, E.S.; et al. Gene set enrichment analysis: A knowledge-based approach for interpreting genome-wide expression profiles. Proc. Natl. Acad. Sci. USA 2005, 102, 15545–15550. [Google Scholar] [CrossRef]
- Press, W.H. Numerical Recipes in C: The Art of Scientific Computing, 2nd ed.; Cambridge University Press: Cambridge, UK, 1992. [Google Scholar]
- Kim, S.; Choi, M.; Cho, K.H. Identifying the target mRNAs of microRNAs in colorectal cancer. Comput. Biol. Chem. 2009, 33, 94–99. [Google Scholar] [CrossRef]
- Zhong, X.; Chen, X.; Guan, X.; Zhang, H.; Ma, Y.; Zhang, S.; Wang, E.; Zhang, L.; Han, Y. Overexpression of G9a and MCM7 in oesophageal squamous cell carcinoma is associated with poor prognosis. Histopathology 2014, 66, 192–200. [Google Scholar] [CrossRef]
- Hamadneh, L.; Al-Majawleh, M.; Jarrar, Y.B.; Shraim, S.; Hasan, M.; Abu-Irmaileh, B. Culturing conditions highly affect DNA methylation and gene expression levels in MCF7 breast cancer cell line. Vitr. Cell. Dev. Biol.-Anim. 2018, 54, 331–334. [Google Scholar] [CrossRef] [PubMed]
- Driver, K.E.; Song, H.; Lesueur, F.; Ahmed, S.; Barbosa-Morais, N.; Tyrer, J.P.; Ponder, B.A.; Easton, D.F.; Pharoah, P.D.; Dunning, A.M.; et al. Association of single-nucleotide polymorphisms in the cell cycle genes with breast cancer in the British population. Carcinogenesis 2008, 29, 333–341. [Google Scholar] [CrossRef] [PubMed]
- Lanceta, L.; O’Neill, C.; Lypova, N.; Li, X.; Rouchka, E.; Waigel, S.; Gomez-Gutierrez, J.G.; Chesney, J.; Imbert-Fernandez, Y. Transcriptomic Profiling Identifies Differentially Expressed Genes in Palbociclib-Resistant ER+ MCF7 Breast Cancer Cells. Genes 2020, 11, 467. [Google Scholar] [CrossRef] [PubMed]
- Rossi, L.; McCartney, A.; Risi, E.; De Santo, I.; Migliaccio, I.; Malorni, L.; Biganzoli, L.; Di Leo, A. Cyclin-Dependent Kinase 4/6 Inhibitors in Neoadjuvant Endocrine Therapy of Hormone Receptor-Positive Breast Cancer. Clin. Breast Cancer 2019, 19, 392–398. [Google Scholar] [CrossRef] [PubMed]
- Lu, X.; Ma, J.; Chu, J.; Shao, Q.; Zhang, Y.; Lu, G.; Li, J.; Huang, X.; Li, W.; Li, Y.; et al. MiR-129-5p Sensitizes the Response of Her-2 Positive Breast Cancer to Trastuzumab by Reducing Rps6. Cell. Physiol. Biochem. 2017, 44, 2346–2356. [Google Scholar] [CrossRef]
- Ge, S.; Wang, D.; Kong, Q.; Gao, W.; Sun, J. Function of miR-152 as a Tumor Suppressor in Human Breast Cancer by Targeting PIK3CA. Oncol. Res. Featur. Preclin. Clin. Cancer Ther. 2017, 25, 1363–1371. [Google Scholar] [CrossRef]
- Chang, J.; Hong, L.; Liu, Y.; Pan, Y.; Yang, H.; Ye, W.; Xu, K.; Li, Z.; Zhang, S. Targeting PIK3CG in Combination with Paclitaxel as a Potential Therapeutic Regimen in Claudin-Low Breast Cancer. Cancer Manag. Res. 2020, 12, 2641. [Google Scholar] [CrossRef]
- Coniglio, S.J.; Zavarella, S.; Symons, M. Pak1 and Pak2 Mediate Tumor Cell Invasion through Distinct Signaling Mechanisms. Mol. Cell. Boil. 2008, 28, 4162–4172. [Google Scholar] [CrossRef]
- Han, K.; Zhou, Y.; Gan, Z.-H.; Qi, W.-X.; Zhang, J.-J.; Fen, T.; Meng, W.; Jiang, L.; Shen, Z.; Min, D.-L. p21-activated kinase 7 is an oncogene in human osteosarcoma. Cell Biol. Int. 2014, 38, 1394–1402. [Google Scholar] [CrossRef]
- Zhang, Y.; Ni, H.J.; Cheng, D.Y. Prognostic value of phosphorylated mTOR/RPS6KB1 in non-small cell lung cancer. Asian Pac. J. Cancer Prev. 2013, 14, 3725–3728. [Google Scholar] [CrossRef]
- Cai, C.; Chen, Q.B.; Han, Z.D.; Zhang, Y.Q.; He, H.C.; Chen, J.H.; Chen, Y.R.; Yang, S.B.; Wu, Y.D.; Zeng, Y.R.; et al. miR-195 Inhibits Tumor Progression by Targeting RPS6KB1 in Human Prostate Cancer. Clin. Cancer Res. 2015, 21, 4922–4934. [Google Scholar] [CrossRef] [PubMed]
- Li, P.D.; Zhang, W.J.; Zhang, M.Y.; Yuan, L.J.; Cha, Y.L.; Ying, X.F.; Wu, G.; Wang, H.Y. Overexpression of RPS6KB1 predicts worse prognosis in primary HCC patients. Med. Oncol. 2012, 29, 3070–3076. [Google Scholar] [CrossRef] [PubMed]
- Frankum, J.; Moudry, P.; Brough, R.; Hodný, Z.; Ashworth, A.; Bartek, J.; Lord, C.J. Complementary genetic screens identify the E3 ubiquitin ligase CBLC, as a modifier of PARP inhibitor sensitivity. Oncotarget 2015, 6, 10746–10758. [Google Scholar] [CrossRef] [PubMed]
- Zhang, G.; Zhao, Q.; Yu, S.; Lin, R.; Yi, X. Retracted Article: Pttg1 inhibits TGFβ signaling in breast cancer cells to promote their growth. Tumor Biol. 2015, 36, 199–203. [Google Scholar] [CrossRef] [PubMed]
- Liang, Z.; Li, W.; Liu, J.; Li, J.; He, F.; Jiang, Y.; Yang, L.; Li, P.; Wang, B.; Wang, Y.; et al. Simvastatin suppresses the DNA replication licensing factor MCM7 and inhibits the growth of tamoxifen-resistant breast cancer cells. Sci. Rep. 2017, 7, 41776. [Google Scholar] [CrossRef] [PubMed]
- Zhang, Y.; Wester, L.; He, J.; Geiger, T.; Moerkens, M.; Siddappa, R.; Helmijr, J.A.; Timmermans, M.M.; Look, M.P.; van Deurzen, C.H.M.; et al. IGF1R signaling drives antiestrogen resistance through PAK2/PIX activation in luminal breast cancer. Oncogene 2018, 37, 1869–1884. [Google Scholar] [CrossRef]


© 2020 by the author. Licensee MDPI, Basel, Switzerland. This article is an open access article distributed under the terms and conditions of the Creative Commons Attribution (CC BY) license (http://creativecommons.org/licenses/by/4.0/).