Abstract
Real-time monitoring of product titers during process development and production of biotherapeutics facilitate implementation of quality-by-design principles and enable rapid bioprocess decision and optimization of the production process. Conventional analytical methods are generally performed offline/at-line and, therefore, are not capable of generating real-time data. In this study, a novel fiber optical nanoplasmonic sensor technology was explored for rapid IgG titer measurements. The sensor combines localized surface plasmon resonance transduction and robust single use Protein A-modified sensor chips, housed in a flexible flow cell, for specific IgG detection. The sensor requires small sample volumes (1–150 µL) and shows a reproducibility and sensitivity comparable to Protein G high performance liquid chromatography-ultraviolet (HPLC-UV). The dynamic range of the sensor system can be tuned by varying the sample volume, which enables quantification of IgG samples ranging from 0.0015 to 10 mg/mL, without need for sample dilution. The sensor shows limited interference from the sample matrix and negligible unspecific protein binding. IgG titers can be rapidly determined in samples from filtered unpurified Chinese hamster ovary (CHO) cell cultures and show good correlation with enzyme-linked immunosorbent assay (ELISA).
1. Introduction
Efficient and cost-effective production of biologics requires the ability to accurately monitor and control the production process. Guidelines concerning process analytical technologies (PATs) released by the U.S. Food and Drug Administration (FDA) in 2004 [1] initiated a large interest in development and implementation of technologies for near real-time or real-time monitoring of key performance indicators (KPIs) and critical quality attributes (CQAs) in bioproduction [2,3,4].
Therapeutic antibodies are currently the largest group of biopharmaceuticals. Until 2019, a total of 79 therapeutic immunoglobulin G (IgG) monoclonal antibodies (mAbs) had been approved by the U.S. FDA [5,6]. Techniques for process development and production of mAbs using mammalian cell cultures have been evolving rapidly, resulting in product titers ranging from about 1 to 10 mg/mL using CHO cell cultures [7,8,9,10]. Possibilities to monitor IgG titers are central for optimizing process conditions and to achieve high yields as well as consistent and high product quality. The IgG titer is thus naturally an important KPI in production of mAbs. There are several techniques that can be used for measuring IgG titers, such as enzyme-linked immunosorbent assay (ELISA) [11], protein A/G high performance liquid chromatography-ultraviolet (Protein A/G-HPLC-UV) [12,13], surface plasmon resonance (SPR) [14,15], biolayer interferometry (BLI) [16] and capillary electrophoresis-mass spectrometry (CE-MS) [17]. Among these, protein A/G-HPLC-UV has been the most widely used method for bioprocess monitoring and validation due to its high selectivity, robustness and reliable results. However, these methods typically require multiple sample preparation steps and are difficult to automize and implement as on-line/in-line techniques and are, therefore, generally performed at-line or off-line. Possibilities to acquire specific near real-time or real-time data of IgG titers are thus limited. With the increasing demand for applying PAT tools in bioprocessing, efforts have been made to reduce the turn-around time of available analytical methods. Pedersen et al. introduced a method using flow-induced dispersion analysis that could quantify IgG in cell culture broth in less than 15 min [18]. Swartz et al. developed a quick and cost-effective antibody-nanocage turbidity assay for rapid measurements of IgG in cell culture samples [19]. These methodologies were, however, not possible to integrate for on-line measurements. An on-line/at-line system using a portable ultraperformance liquid chromatography (UPLC) system interfaced with an UPLC−process sample manager was recently developed by Letha et al., indicating the potential for more rapid IgG titer measurements [20]. The technique, however, requires complex equipment and sample handling, including purification, which complicates implementation in bioproduction. Despite large efforts to improve the speed of IgG quantification methods, there is still a lack of robust cost-effective sensor systems that allow for specific on-line real-time titer measurements.
Localized surface plasmon resonance (LSPR)-based sensors, or nanoplasmonic sensors, have emerged as versatile techniques for label-free biomolecular interaction analysis [21,22,23]. LSPR is an optical phenomenon caused by coherent electron oscillations in metal nanostructures. The resonance conditions are sensitive to changes in refractive index in the immediate vicinity of the nanostructures, which enable detection of analyte binding to immobilized ligands. In comparison to benchtop surface plasmon resonance (SPR) sensor systems, LSPR sensors require significantly less complex optical setups and are less sensitive to temperature fluctuations and changes in the sample background. However, SPR can enable label-free at-line and off-line monitoring of IgG titers in samples from upstream process steps but, due to the narrow and low dynamic range, with reported values spanning from 13–30 µg/mL [24], 0.019–9.6 µg/mL [15] to 2–200 µg/mL [14], extensive sample dilution is required.
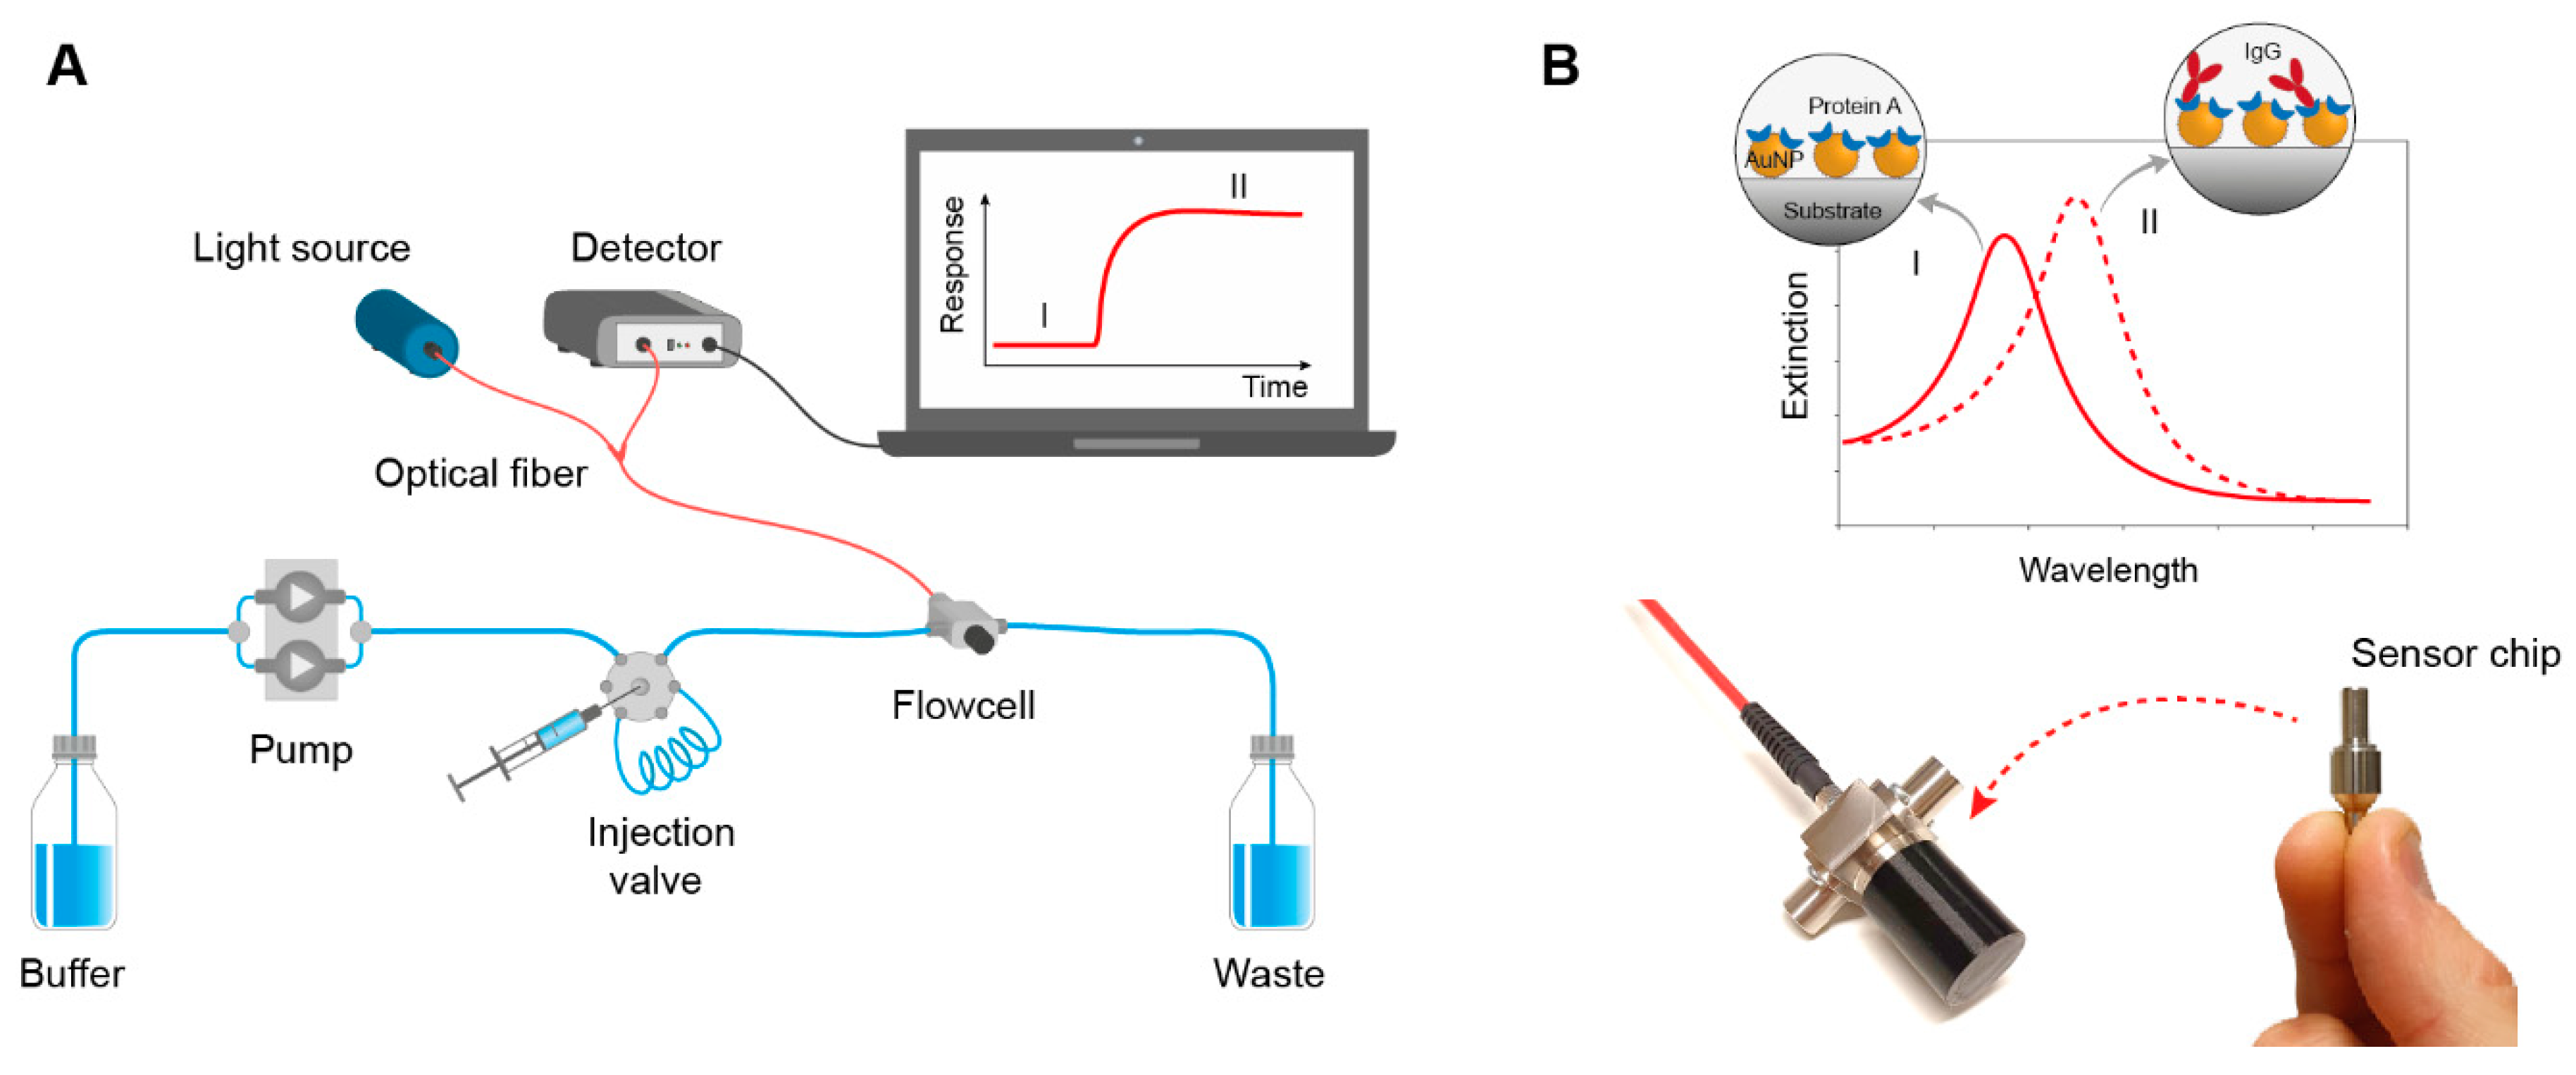
Here, we explore a novel LSPR-based sensor technology that combines nanoplasmonic sensing with fiber optics that is possible to integrate for specific on-line/in-line biodetection in real-time. The sensor technology, schematically described in Figure 1, was developed in close collaboration with ArgusEye AB (Linköping, Sweden) with the purpose of enabling more efficient bioprocess monitoring. To our knowledge this is the first LSPR-based sensor system designed for on-line/in-line bioprocess monitoring. The analytical performance of the sensor system for detection of IgG in complex samples was evaluated using samples from both upstream and downstream process steps, and data was in good agreement with results from ELISA and protein G-HPLC-UV. The sensor has a short response time (seconds to minutes) and a large and tunable dynamic range (from 0.0015 mg/mL to about 30 mg/mL) and was capable of rapid IgG quantification in cell-free samples directly without any need for sample pretreatment. Successful integration of this novel sensor technology in bioproduction and process development could improve process understanding, facilitate implementation of quality by design (QbD) and development of strategies for continuous processing.

Figure 1.
(A) Schematic illustration of the sensor system setup. Samples with IgG were injected into the flow cell containing the sensor chip. (B) Nanoplasmonic sensor chips were functionalized with Protein A for specific recognition of IgG. Binding of IgG to the sensor chip results in a concentration-dependent redshift of the LSPR peak maximum. The sensor signal is transmitted to the detector using fiber optics and was monitored in real-time using a dedicated software.
2. Materials and Methods
2.1. Chemicals and Reagents
N-Ethyl-N′-(3-dimethylaminopropyl)carbodiimide (EDC), N-Hydroxysuccinimide (NHS), Bovine serum albumin (BSA), ethanolamine, 4-Morpholineethanesulfonic acid (MES), purified IgG from human serum (5.5 g/L) were obtained from Sigma-Aldrich (St. Louis, MO, USA). Protein A was supplied by Medicago AB (Upsala, Sweden). Hyclone ActiPro Medium, Hyclone Cell boost 7a, Hyclone Cell boost 7b were purchased from GE Healthcare Life Sciences (Logan, UT, USA). Sheep antihuman IgG gamma chain and sheep antihuman IgG gamma chain peroxidase conjugate were purchased from by The Binding Site Group Ltd (Birmingham, UK). TMB (Tetramethylbenzidine) substrate kit, Novex sharp prestained protein standard, Bolt LDS sample buffer, Bolt 4–12% Bis-Tris Plus gels, MOPS (4-Morpholinepropanesulfonic acid) SDS running buffer, SimplyBlue SafeStain solution were purchased from Thermo Fisher Scientific (Rockford, IL, USA). GlutaMAXTM (100×) was from Life Technologies/Gibco (Carlsbad, CA, USA).
2.2. Ligand Immobilization
Ligand immobilization to carboxyl sensor chips (ArgusEye AB, Linköping, Sweden) was carried out using carbodiimide (EDC/NHS) coupling chemistry. A (v/v 1:1) mixture of 20 µL of 0.4 M EDC and 0.1 M NHS was added to the sensor surfaces, and carboxyl groups were activated for 45 min. After rinsing with Milli-Q water (18.2 MΩ cm−1), 20 µL of 0.5 mg/mL ligand solution was added and the coupling reaction was carried out for 2 h. Unreacted carboxyl groups were deactivated by using of 20 µL of 1 M ethanolamine (pH 8.5) for 30 min. The sensor substrates were rinsed and stored in PBS buffer before being inserted into the LSPR system.
2.3. LSPR Measurements
The fiber optical sensor system was provided by ArgusEye AB and includes a flow cell and an optical detection unit comprising a halogen light source and a spectrophotometer. Sensor chips functionalized with Protein A (ProtA) or BSA were inserted into the flow cell and equilibrated with PBS buffer at a flow rate of 1 mL/min using an HPLC pump for about 15 min to ensure stable baseline. Samples were manually injected into the flow cell and the sensor signal was continuously recorded using software developed by ArgusEye. Purified monomeric IgG and filtrated bioreactor samples (provided by BioInvent International AB, Lund, Sweden) were used to validate the analytical performance of the sensor system. The system was run in a normal laboratory setting at room temperature without any additional temperature control.
2.4. CHO Cell Cultivation
A recombinant CHO cell line (CHOK-1 derivate cell line) producing human IgG was provided from Cobra Biologics Ltd. (Newcastle, UK). The CHO cell line was cultured in spinner flasks in fed-batch mode at 37 °C in a humidified atmosphere containing 7.5% CO2. HyClone ActiproTM medium supplemented with 3% GlutaMAXTM (100×) was used as culture media. At day three of culture, a daily feed of 2% HyClone Cell BoostTM 7a and 0.2% HyClone Cell BoostTM 7b of the culture volume was applied. Samples for analysis were withdrawn from the culture daily, centrifuged (200× g, 5 min) and the supernatant was 0.2 µm filtered before storage at −20 °C.
2.5. ELISA IgG Quantification
ELISA assays were performed using a general colorimetric sandwich ELISA procedure. Briefly, Sheep antihuman IgG gamma chain was coated on a Maxisorp Nunc-Immuno well plate (Thermo Fisher Scientific) and incubated overnight at 4 °C. After rinsing, standards (Purified IgG from human serum) and samples were added and incubated for 2 h at 37 °C. Samples were discarded followed by adding sheep antihuman IgG gamma chain peroxidase conjugate and incubated for 1 h at 37 °C. Color development using TMB solution was done at room temperature and the reaction was stopped using H2SO4. Absorbances at 450 nm and 620 nm were measured for quantification.
2.6. SDS-PAGE IgG Quantification
Novex sharp prestained protein standards were used as molecular weight standards. Samples and standards (Purified IgG from human serum) were mixed with Bolt LDS sample buffer and purified water and incubated for 10 min at 70 °C. The samples were loaded on Bolt 4–12% Bis-Tris Plus gels, and electrophoresis was performed at 200 V for between 35 to 45 min using an XCell SureLock electrophoresis cell (Thermo Fisher Scientific, Carlsbad, CA, USA) and a E443 power supply (Consort). Bolt MOPS SDS running buffer was used as running buffer. Gels were stained by using SimplyBlue SafeStain solution with 1 h incubation and destained using purified water for 1 h. The gels were scanned for further evaluation and quantification.
3. Results and Discussion
3.1. LSPR Detection Setup
The LSPR measurements were conducted using a novel fiber optical sensor system comprised of a flow cell designed for real-time on-line and in-line bioproduction monitoring connected to a halogen light source and a detector using fiber optics (Figure 1). The flow cell was produced in medical grade stainless steel to tolerate both cleaning in place and high pressures. Single use sensor chips, modified with gold nanostructures and functionalized with Protein A, were docked into the flow cell to enable specific IgG detection. Analyte binding results in a change in refractive index detected as a shift in the LSPR resonance conditions. The sensor response (in picometer, pm) was recorded in real time and the sensorgrams indicated both analyte concentration and binding kinetics. To simulate on-line conditions, the flow cell was connected to a manual injection valve. An HPLC pump was used to control the flow, and samples were injected into the flow cell using an injection valve with replaceable sample loops with different volumes. In a real on-line detection setup, this would be replaced by an automated system where sample fractions are collected using software-controlled valves.
3.2. Protein A Immobilization
The sensor chips were fabricated in medical grade stainless steel modified with nanoplasmonic gold nanostructures and further functionalized with a robust surface chemistry that enables covalent immobilization of ligands using carbodiimide chemistry. The pH of the coupling buffer influences both the net charge of ProtA (pI (isoeletric point) = 5.1) and the net-charge of the sensor surface, which can affect the electrostatic attraction between the sensor surface and the protein during the coupling reaction. ProtA with a concentration of 0.5 mg/mL prepared in three different buffers, acetate pH 4.0, MES pH 6.0, and phosphate buffer pH 7.0 was used to compare the influence of pH on coupling efficiency (Appendix A, Figure A1). The acidic buffers were found to give only marginally higher IgG binding responses compared to neutral pH, which indicated that the effect of pH in this case was not significant. ProtA immobilization was, therefore, conducted using 10 mM MES pH 6.0 in all further experiments.
3.3. Sensor Evaluation
3.3.1. Unspecific Binding
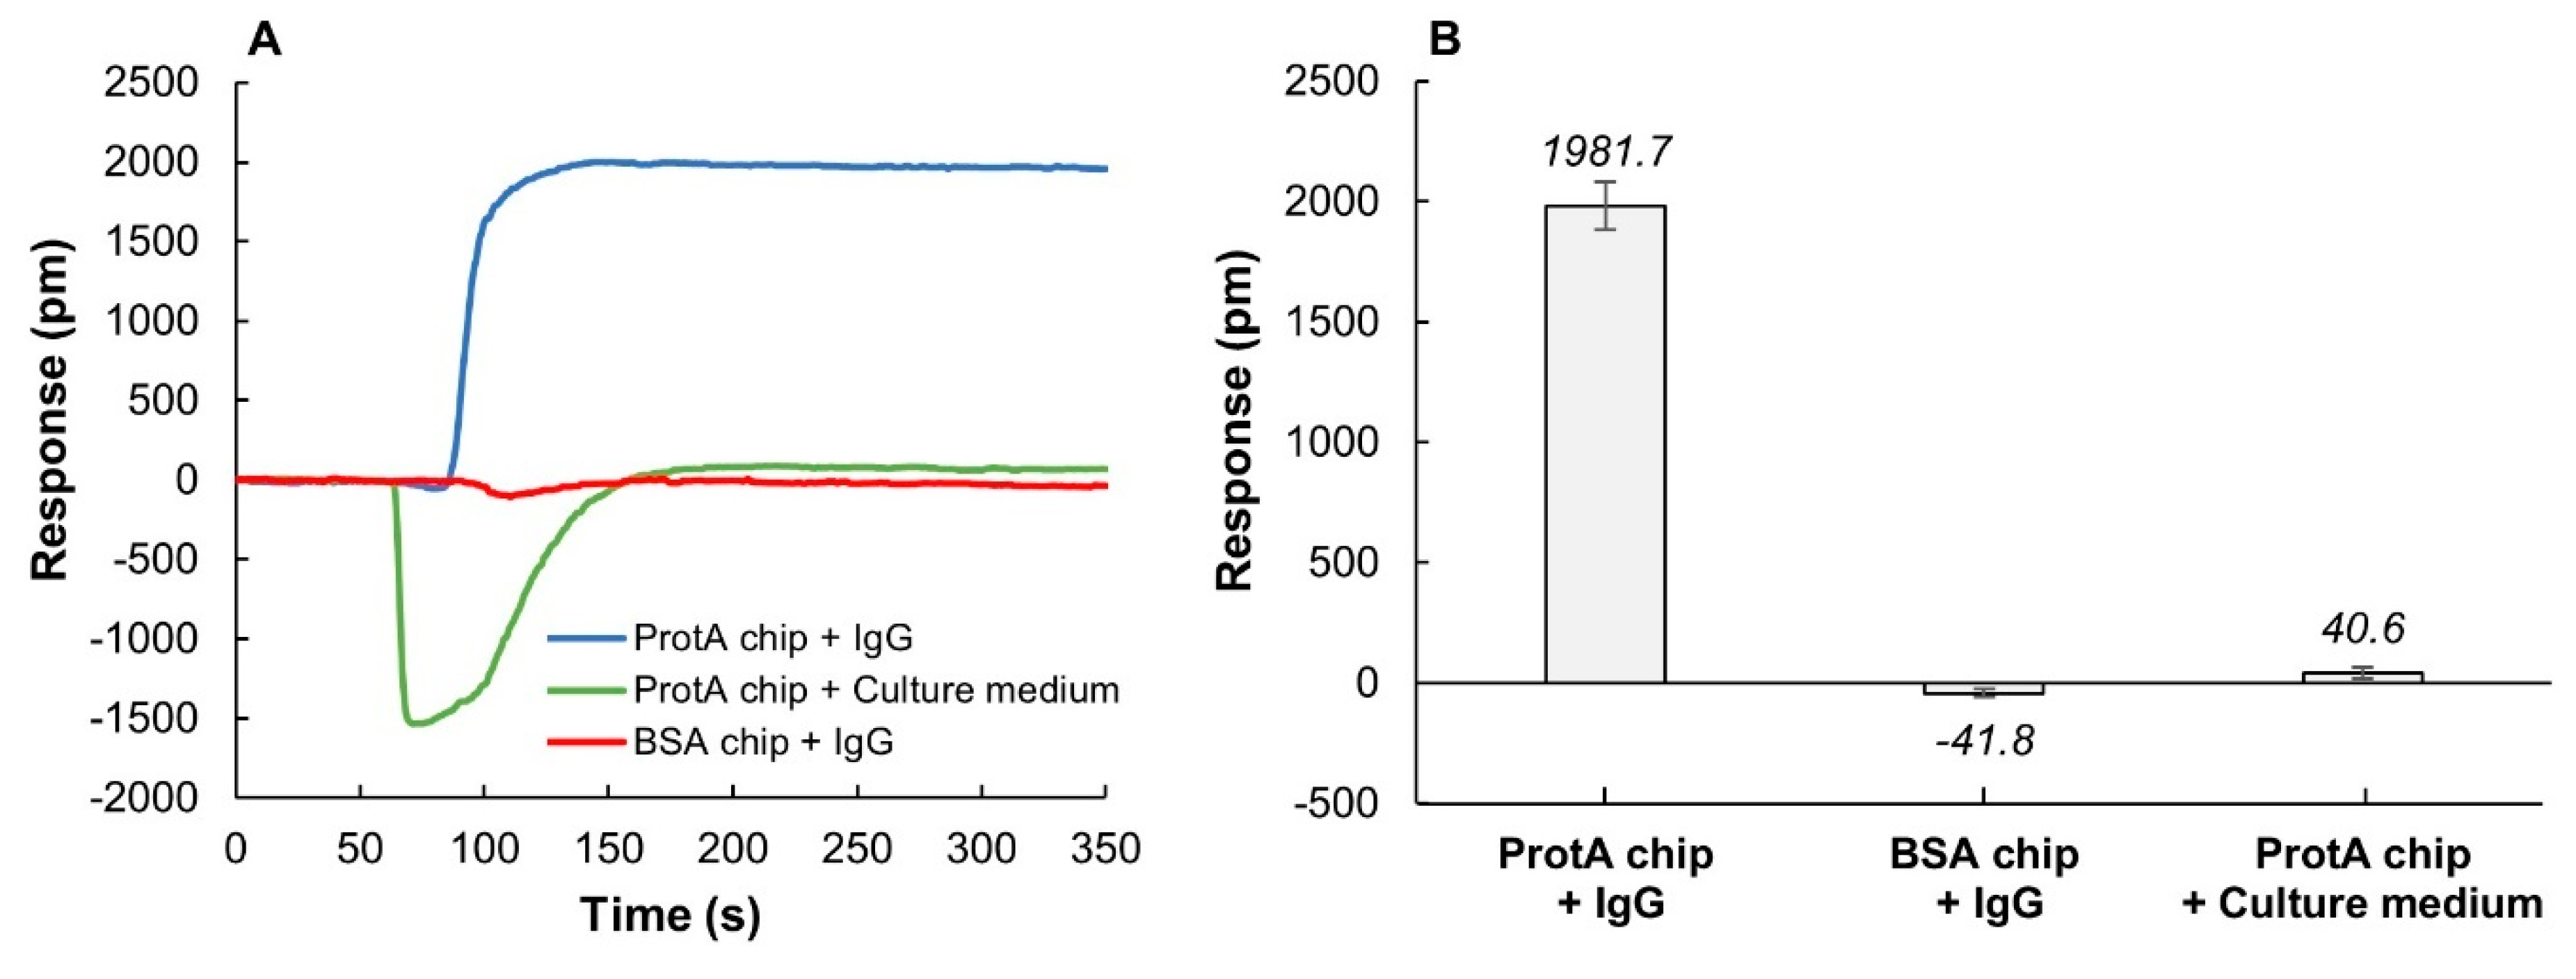
The binding of IgG to the ProtA sensor chips was investigated using a simulated on-line setup where samples were manually injected into the sensor flow system using an HPLC injection port. Injection of IgG (1 mg/mL) resulted in an LSPR response of about 2000 pm (Figure 2A,B). In contrast, when using bovine serum albumin (BSA) as a ligand instead of ProtA, no significant binding could be detected (Figure 2A,B). The contribution from unspecific binding of IgG to the sensor signal was consequently below the detection limit of the sensor. When injecting undiluted cell culture media (1 mL) to a ProtA chip, a negative response was obtained, followed by a very small increase in the baseline, corresponding to only about 2% of the specific IgG binding. The negative shift is a consequence of the yellow color of the cell culture medium that interferes with the baseline. After the injection has passed through the flow cell, the baseline stabilizes and returns to normal. Consequently, the readout of protein binding to sensor surface must, in this case, be assessed after the injection. Here, the responses during the dissociation phase (t > 150 s, 40.6 pm) better reflect the binding and indicate a negligible unspecific interaction between components in the cell culture medium and the ProtA sensor chip (Figure 2B). The negative dip can also, if needed, be subtracted by including a reference cell to the system. In these experiments, the sample volume was 1 mL and was injected into the system at a flow rate of 1 mL/min. With smaller sample volumes, the influence on sample color can be eliminated and effects of unspecific binding further reduced (vide infra).

Figure 2.
Unspecific binding evaluation using bovine serum albumin (BSA) chips and cell culture medium (HyClone ActiProTM + GlutaMax) as negative controls. (A) Representative sensorgrams showing the binding of IgG (1 mg/mL) to a ProtA chip and a BSA chip, and the binding of cell culture medium to a ProtA chip. (B) Comparison of specific and unspecific binding responses. Relative binding responses at t = 250 s were averaged (n = 3 sensor chips), and error bars show standard deviations. Injection volume was 1 mL.
3.3.2. Regeneration Scouting
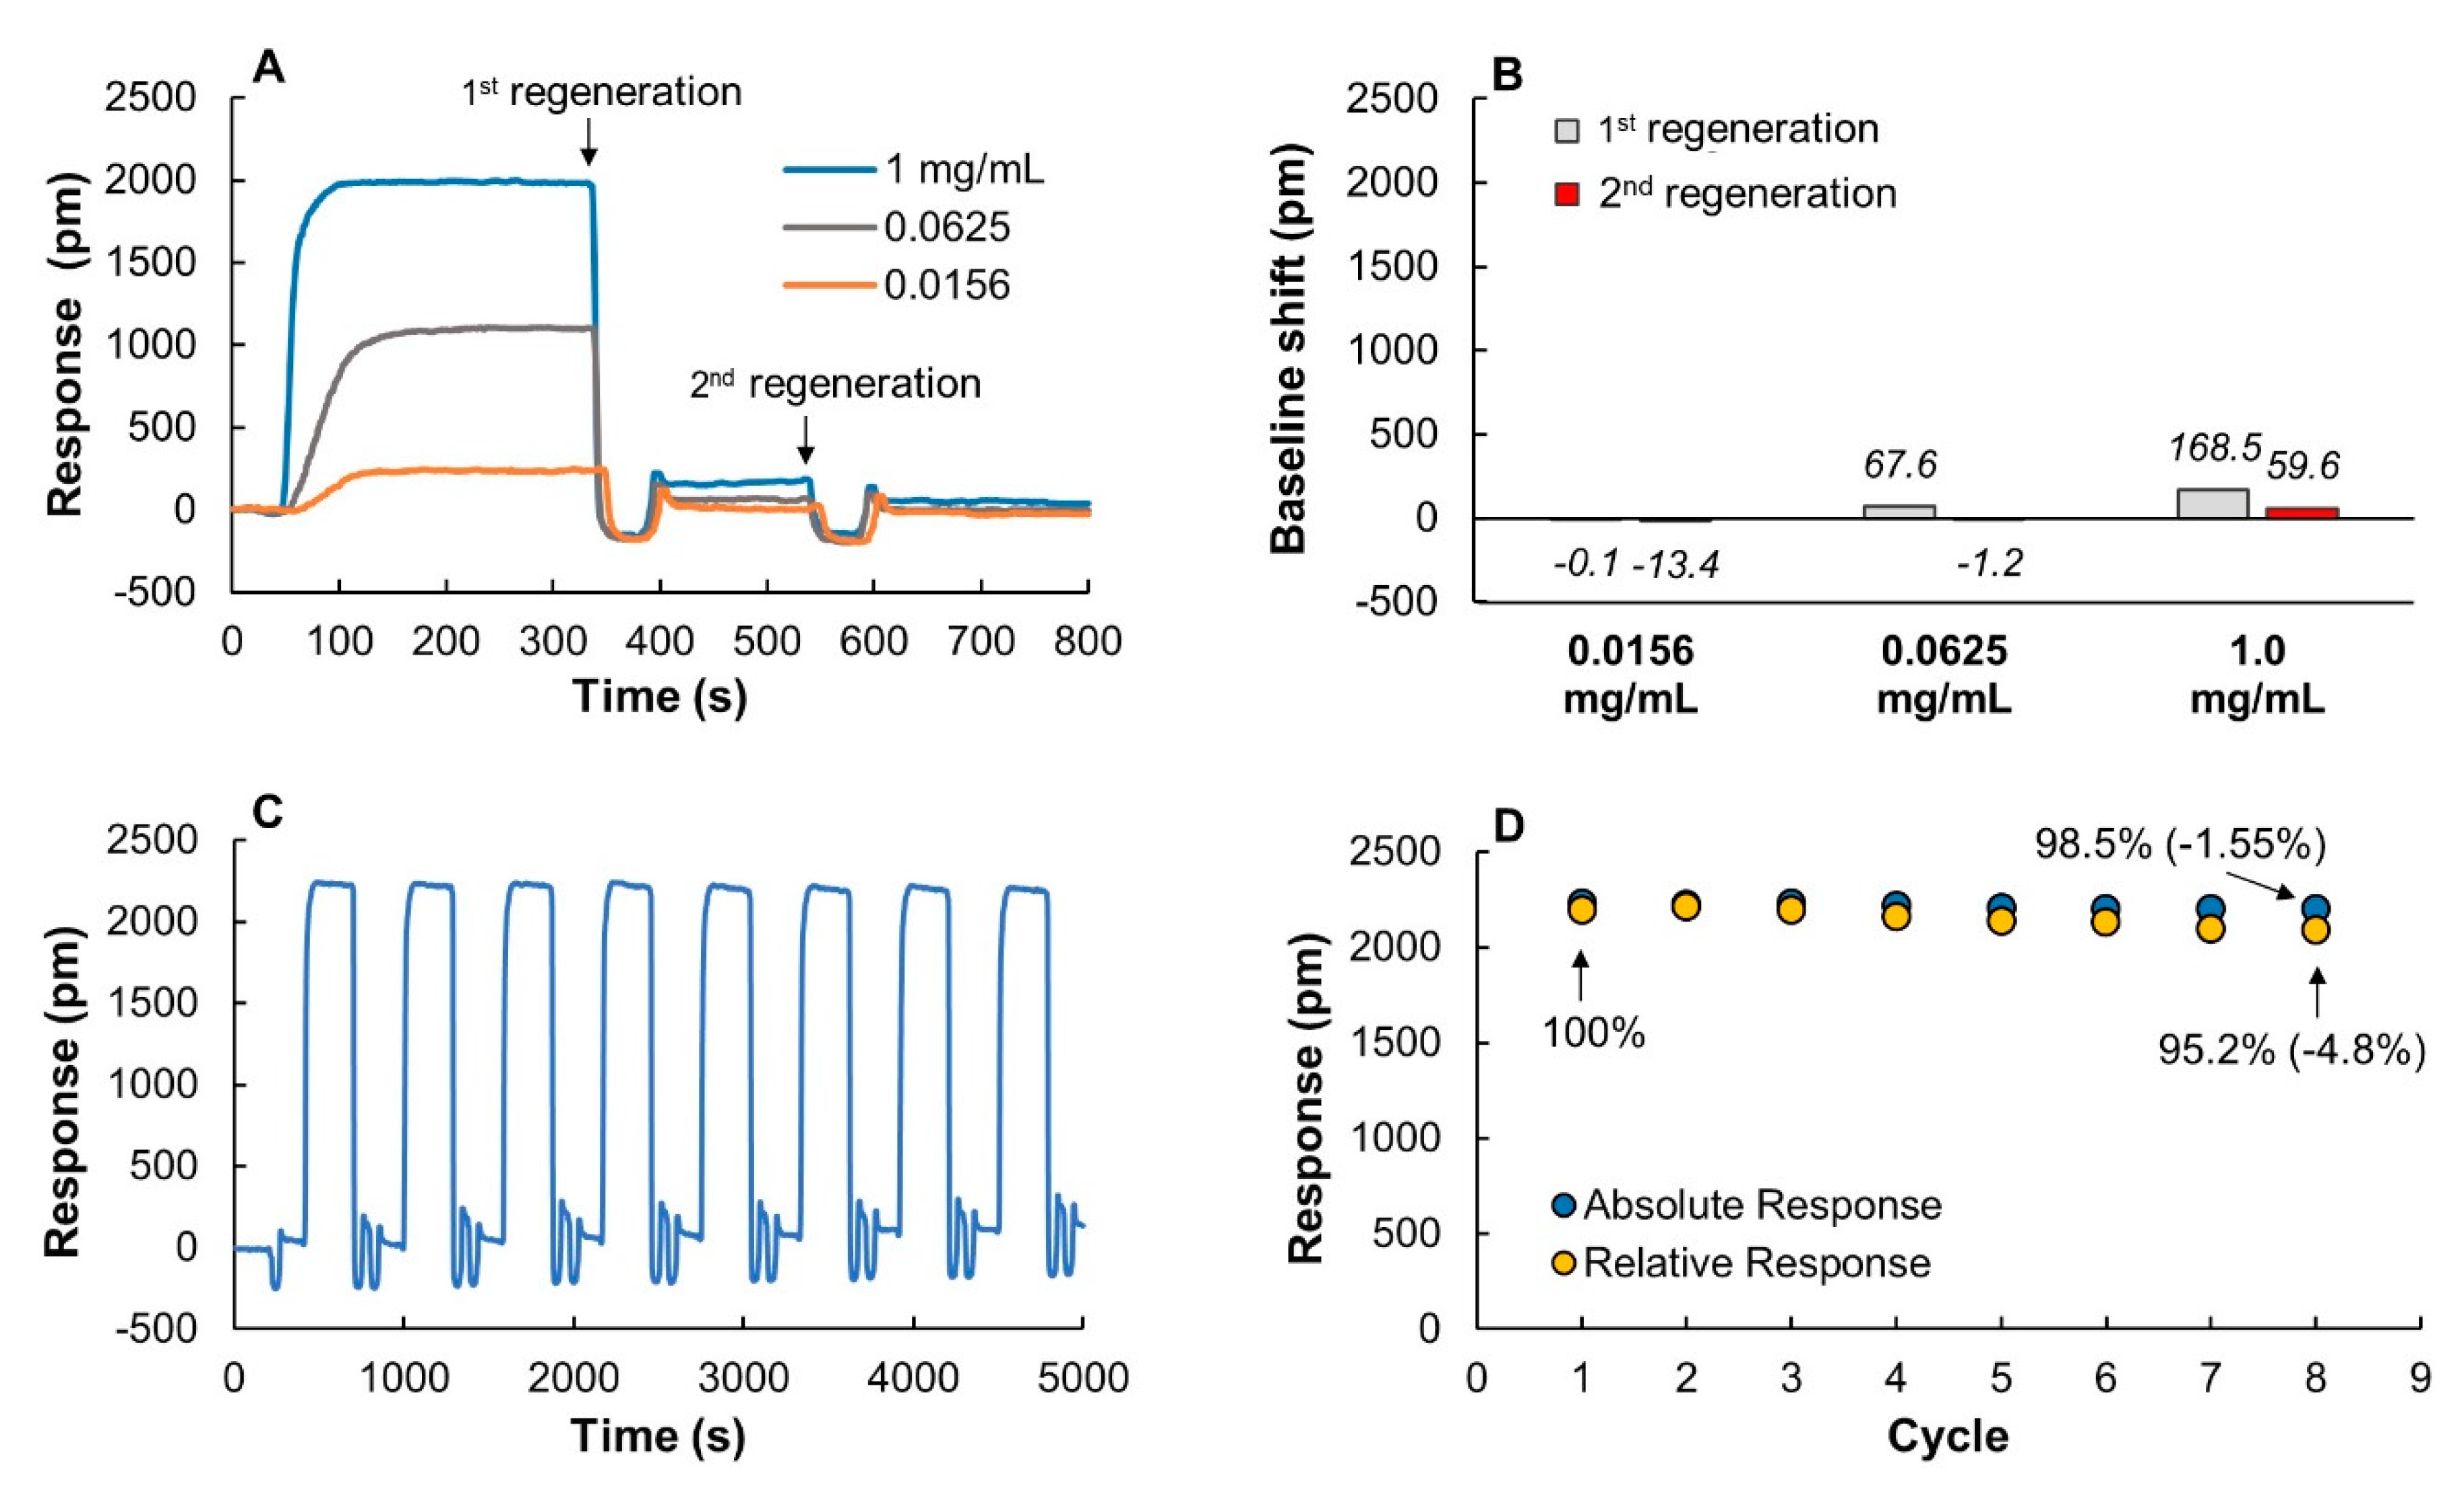
As in most other affinity-based biosensors, the ProtA sensor chips can be regenerated to allow for multiple consecutive measurements. To evaluate the efficiency of the regeneration process, different concentrations of IgG were injected followed by a short (1 min) 10 mM glycine buffer pH 2.5 pulse (Figure 3A). The regeneration buffer efficiently disrupted the interaction between IgG and ProtA and the signal returned to baseline after a single regeneration pulse for the two lower (0.0625 and 0.156 mg/mL) IgG concentrations. After a second regeneration pulse, the chip exposed to 1 mg/mL IgG also returned close to baseline (Figure 3A,B). ProtA is fairly stable under these conditions but to verify the effect of the regeneration buffer on the IgG binding, eight cycles of IgG injections, each followed by two regeneration pulses, were conducted (Figure 3C). Absolute and relative binding responses at the last injection were reduced by only 1.5 and 4.8%, respectively, as compared to the first injection (Figure 3D). The ProtA chips are, consequently, both robust enough to allow for multiple consecutive measurements while efficiently preventing unspecific protein binding, which are important properties for PAT applications.

Figure 3.
(A) Binding and regeneration profiles of IgG to a ProtA chip using three IgG concentrations: 0.0156, 0.0625 and 1 mg/mL. (B) Baseline shift after first and second regeneration pulse. (C) Sensorgrams obtained after eight cycles of IgG injections (1 mg/mL) each followed by two regeneration pulses using 10 mM glycine buffer pH 2.5. (D) Change in absolute and relative binding responses after each binding and regeneration cycle. The relative binding response is the difference between the absolute responses and the baseline before each IgG injection. The sample volume was 1 mL in all experiments.
3.3.3. IgG Binding Reproducibility
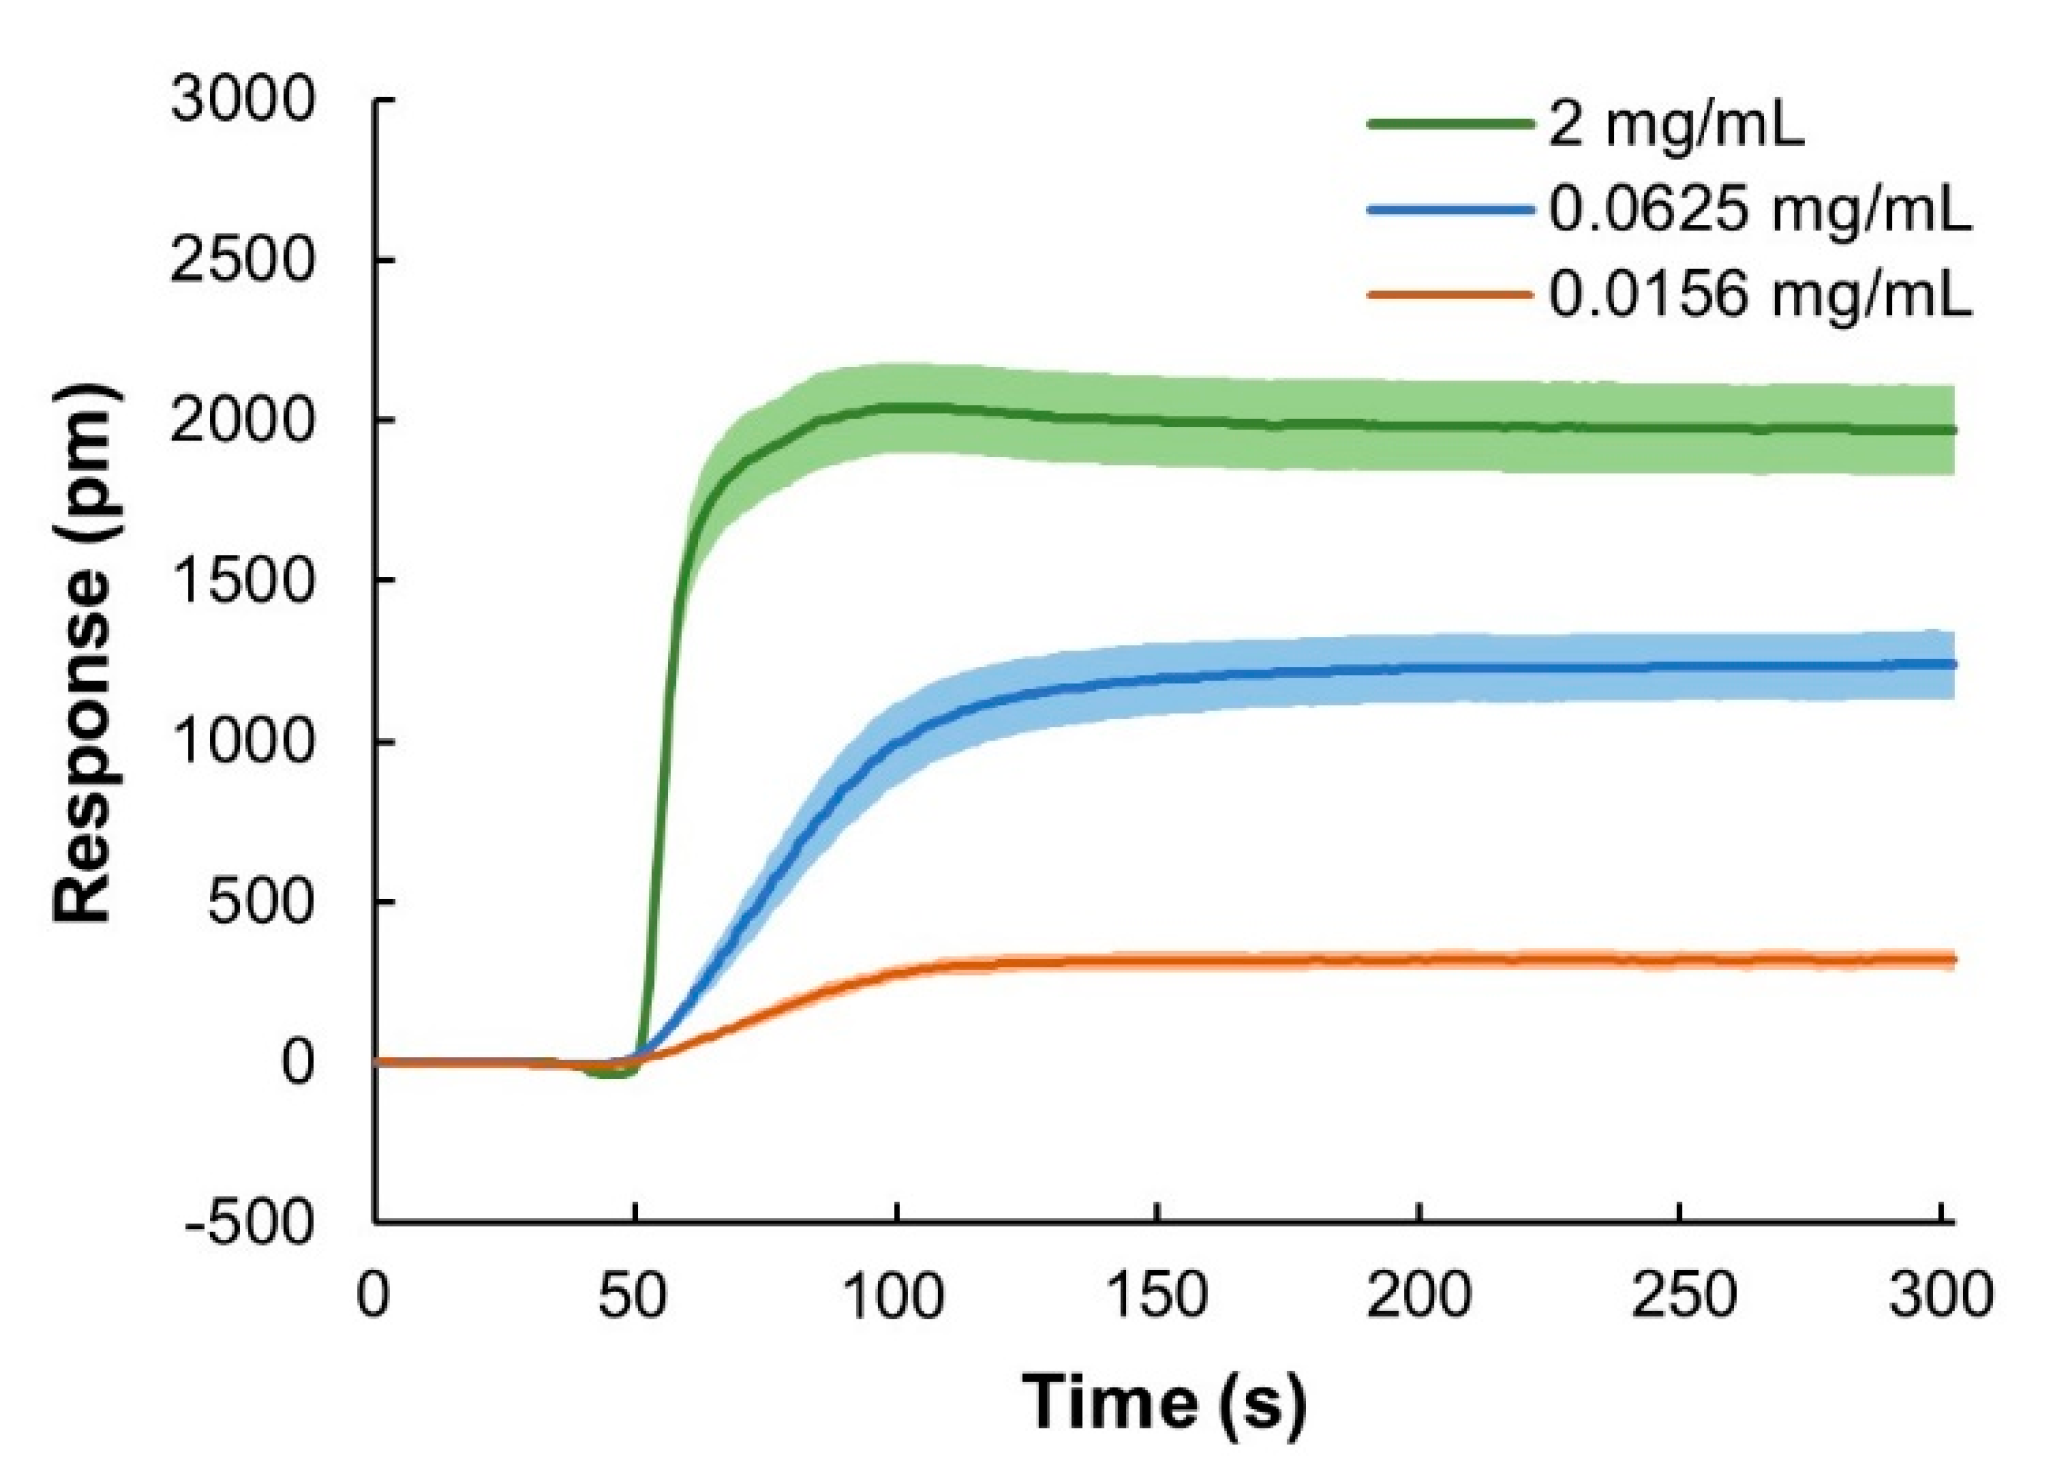
To test the reproducibility and robustness of the sensor system, binding responses from three different sensor chips were compared using IgG samples with different concentrations: 0.0156, 0.0625 and 2 mg/mL (Figure 4). The colored area in the sensorgrams indicate the 95% confidence intervals for three independent sensor chips and two injection replicates per chip. Binding responses at t = 250 s were used to evaluate the variation between sensor chips and within sensor chips. Coefficient of variation (CV) of the binding responses across sensor chips varied from 9.5 to 12.7%, while with the same chip, the variations were only about 3 to 4% (Table 1). These results show that the data generated using the sensor system were highly reproducible, also when using different sensor chips.

Figure 4.
Evaluation of reproducibility of sensor chips. Mean responses from six runs using n = 3 different chips and two injection replicates per chip using three different IgG concentrations, 0.0156, 0.0625 and 2 mg/mL. The data show 95% confidence intervals. Injection volume was 1 mL.

Table 1.
Coefficient of variation (CV) of binding responses at t = 250 s of three IgG concentrations: 0.015, 0.0625 and 2 mg/mL. Between-chip CV was calculated based on the mean responses obtained from three different chips. Within-chip CV was the mean of CV calculated based on binding responses obtained from the same chip.
3.3.4. Dynamic Range
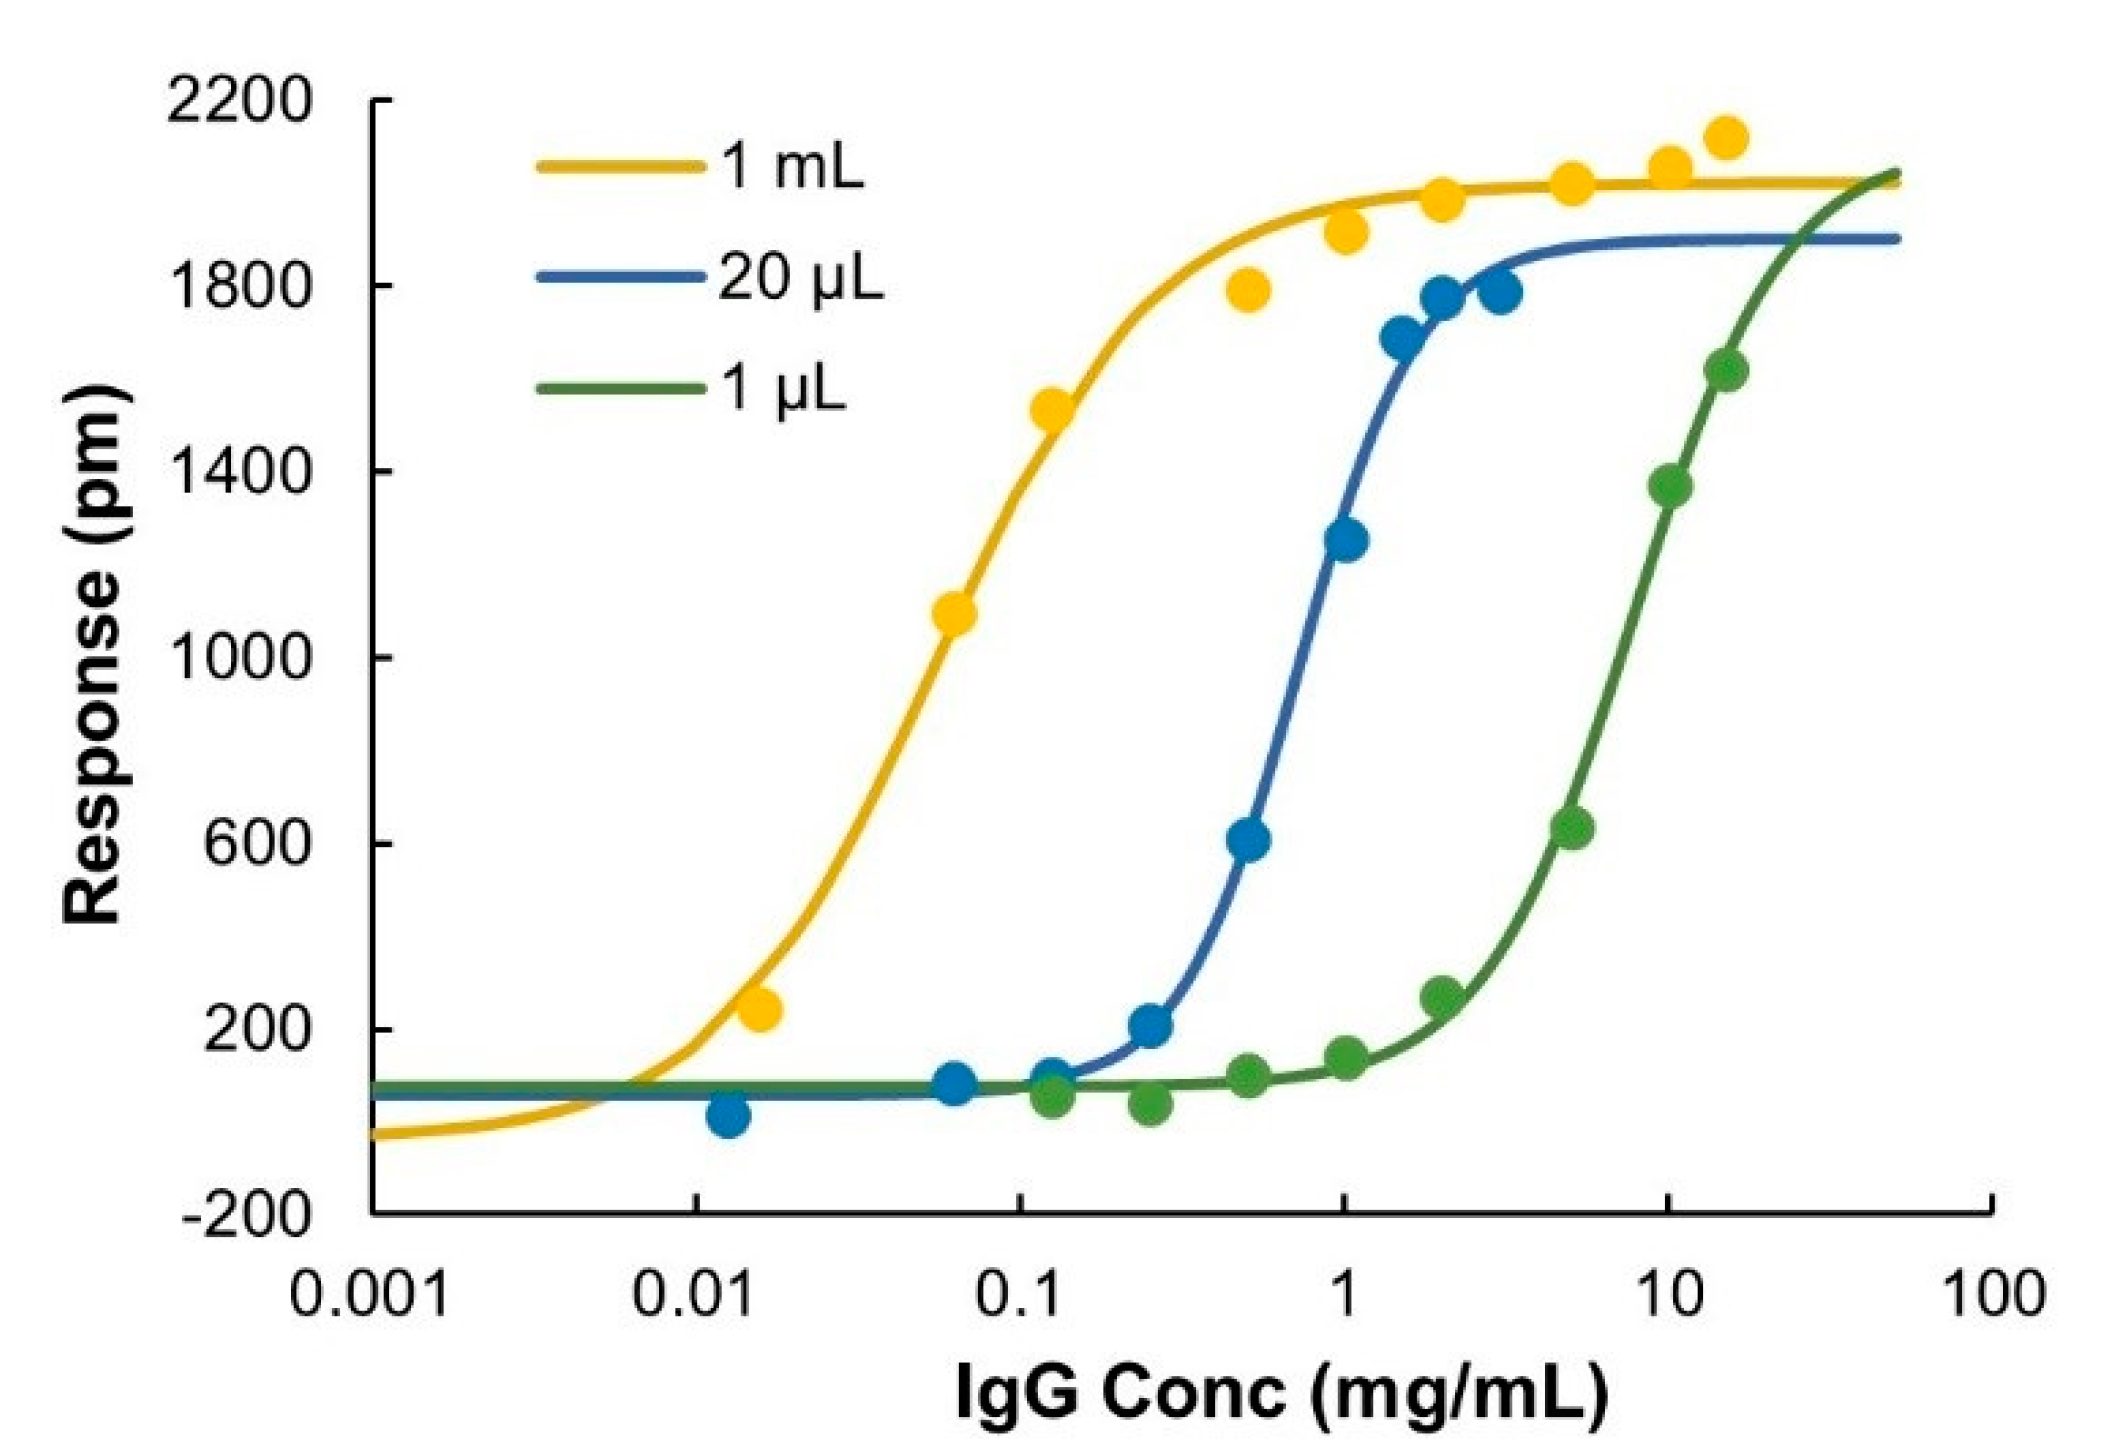
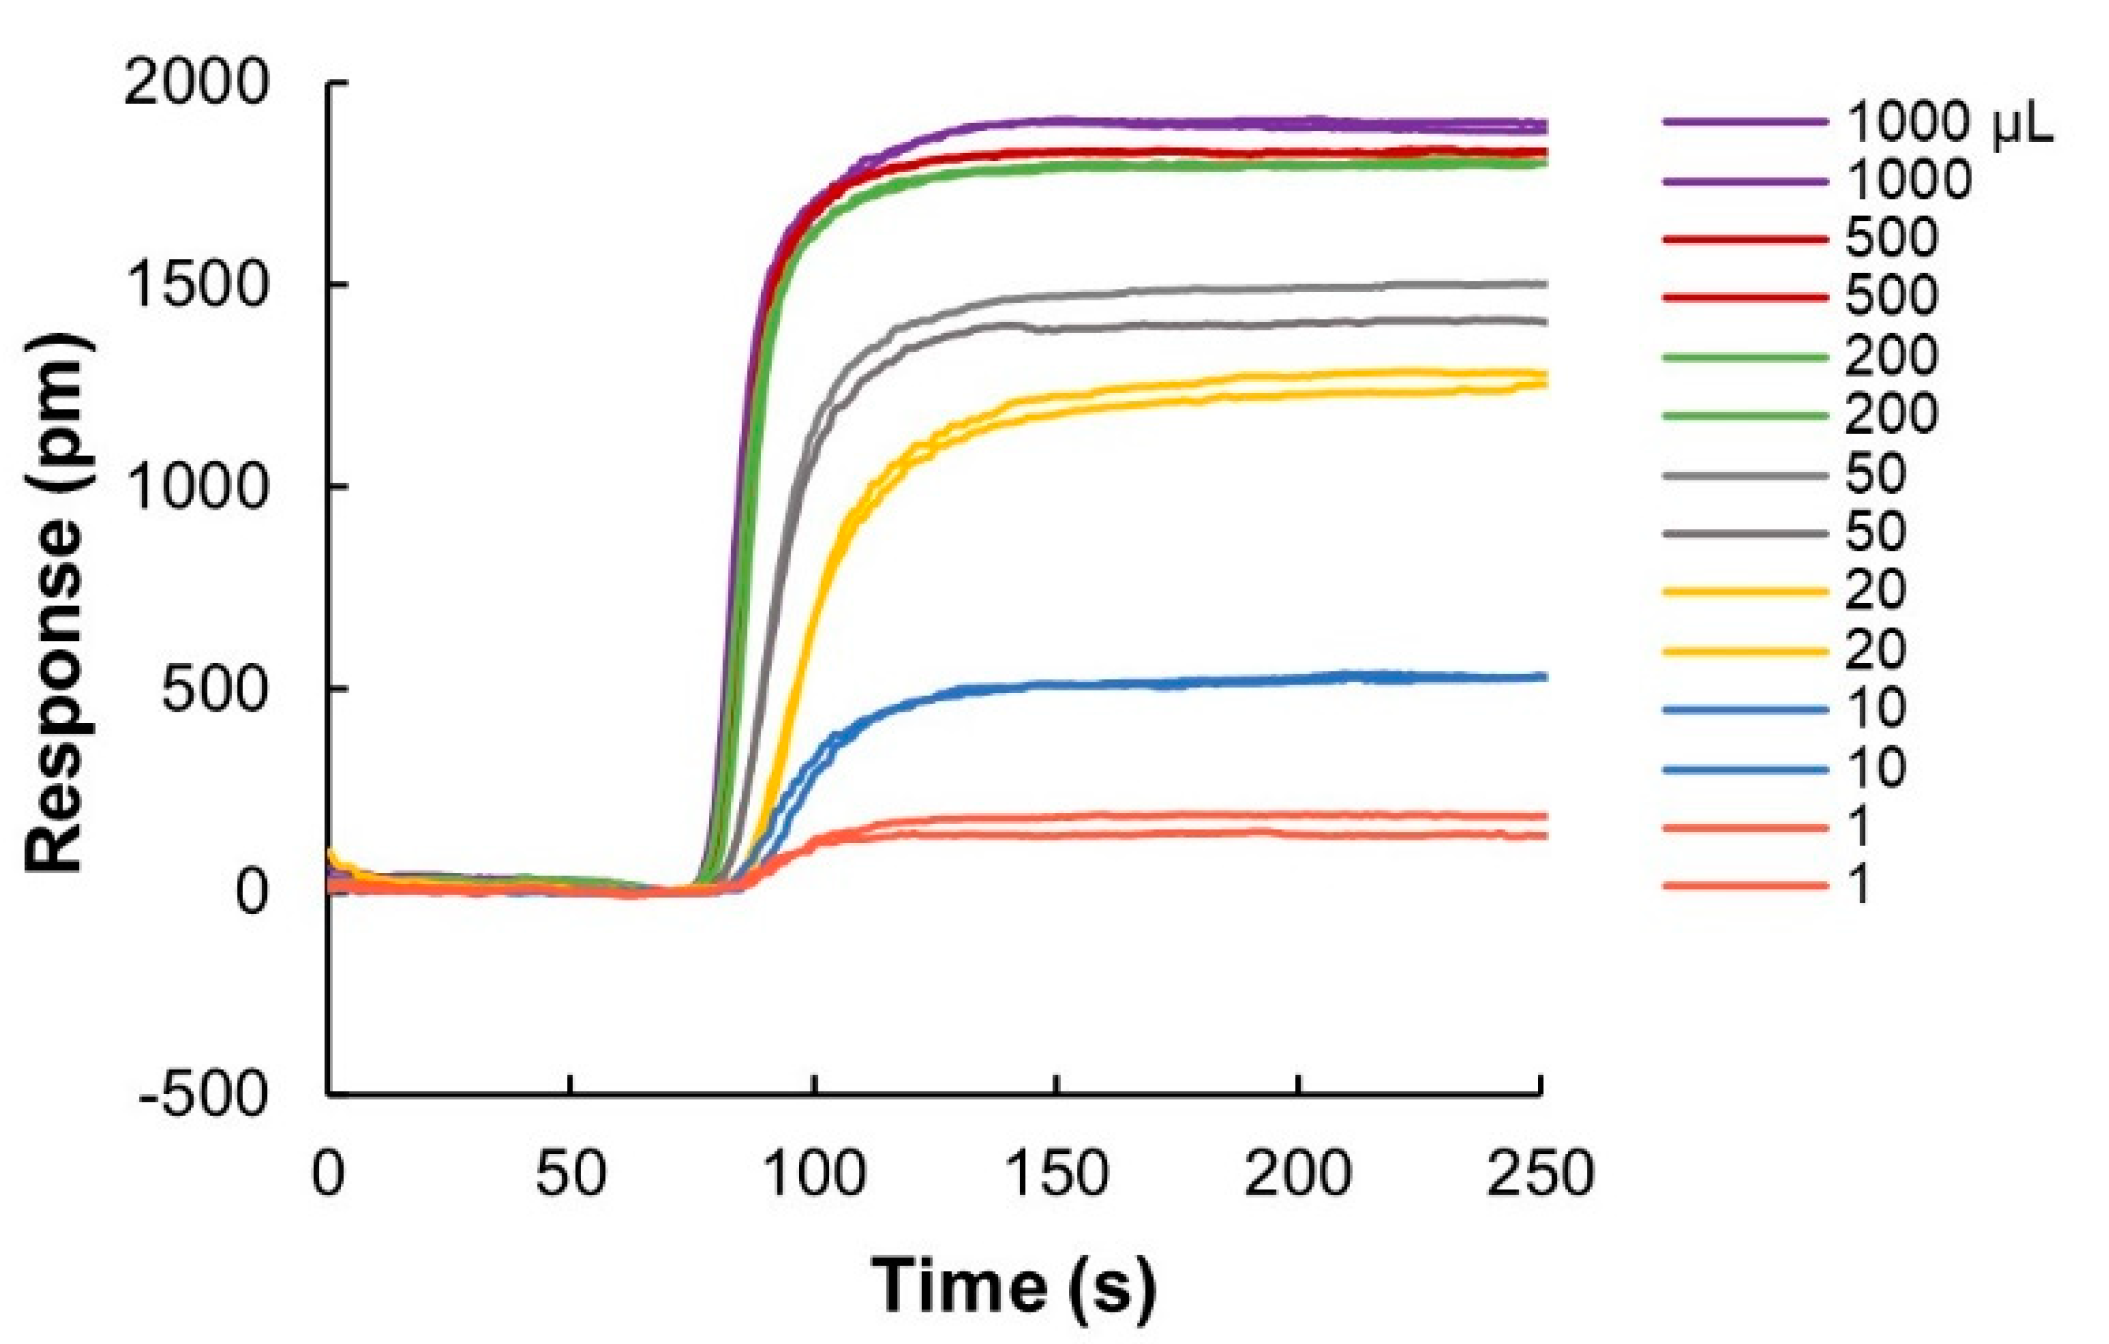
The ProtA sensor chips have a certain number of accessible IgG binding sites that depend on the surface concentration of immobilized ProtA and their relative orientation on the sensor surface and, therefore, show an upper limit in binding capacity. When fully saturated, the sensor response was about 2000 pm. The IgG concentration required to saturate the surface was found to depend on injection volume (Appendix A, Figure A2), which enables flexible tuning of the dynamic range. The dynamic range of the sensor system was investigated using three different injection volumes, 1 mL, 20 µL and 1 µL. The sensor surface was saturated at lower concentrations when increasing the injection volumes (Figure 5). By varying the injection volume in the range of 1 μL to 1 mL, the total dynamic range could be expanded to more than three orders of magnitude, from 0.0015 to about 30 mg/mL. The linear range for quantification was estimated to be 0.0015–0.06, 0.125–1.5, and 0.5–10 mg/mL at 1 mL, 20 μL and 1 μL injection volumes, respectively. Compared to ELISA [25,26], which is normally performed at the μg/mL level, and to a recently developed protein A-HPLC-UV method [27] with an improved linear range of 0.01–5.2 mg/mL, the sensor system used here showed a substantially higher upper limit for quantification. The linear range reported in present work covers the range of normal cell culture titers (5–10 mg/mL) that can be routinely achieved in industrial cell culture processes nowadays [7,8]. Therefore, bioreactor samples can be analyzed without the need of dilution, which simplifies sample handling and facilitates on-line/in-line detection.

Figure 5.
Binding responses at t = 250 s versus IgG concentrations fitted to sigmoidal curves when using various sample injection volumes, 1 μL, 20 μL, and 1 mL.
3.3.5. IgG Quantification in Bioreactor Samples
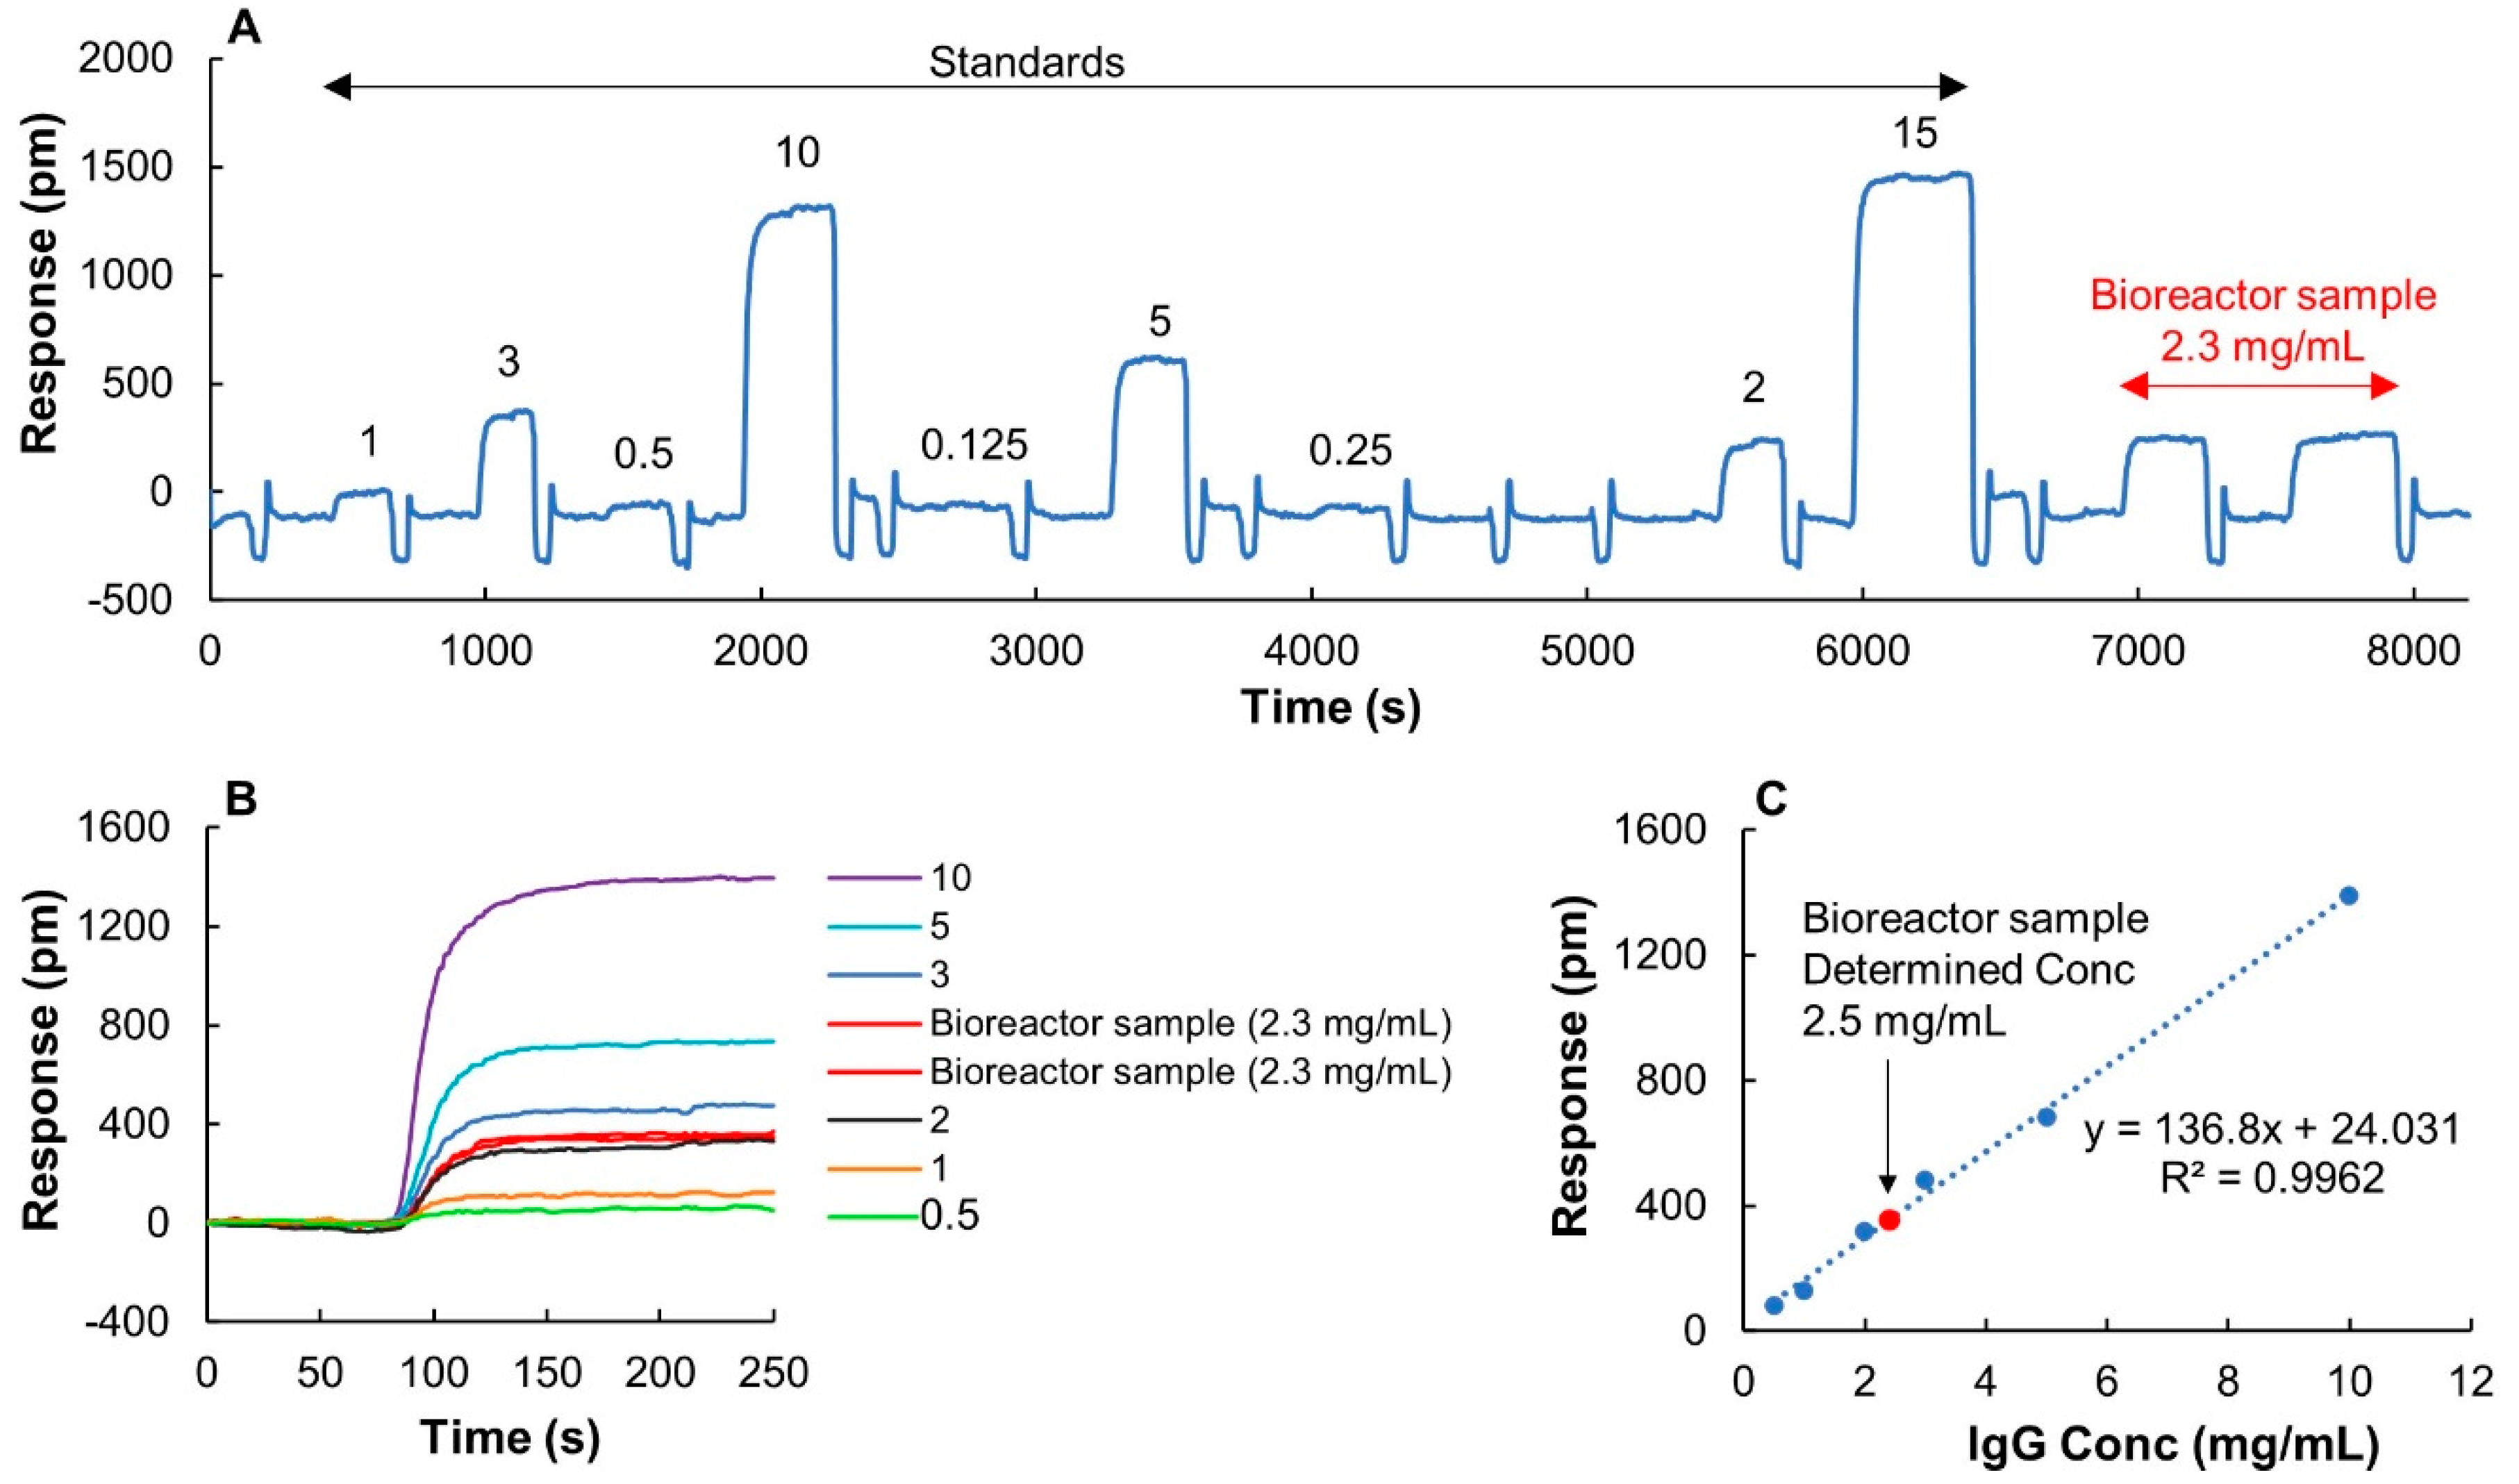
Filtrated crude bioreactor samples, provided from an industrial bioproduction process with a known concentration of 2.3 mg/mL determined by Protein G-HPLC-UV, were used to validate the method for quantification. Nine IgG standards diluted from a monomeric sample of the same IgG were used to calibrate the system, and two injections of sample were used for concentration determination. A full recording of both standards and samples are shown in Figure 6A. Extracted sensorgrams of IgG concentrations, 0.5, 1, 2, 3, 5, and 10 mg/mL defining the linear range are shown in Figure 6B. Interestingly, although the bioreactor samples had a distinct yellow color, the negative dip seen during the association phase when using 1 mL injection volumes (Figure 2A) was not observed here when using a smaller sample volume of 1 µL. The linearity of the standard curve was high with R2 = 0.9962, and the determined concentration of 2.5 mg/mL was in very good agreement with the expected value (Figure 6C).

Figure 6.
Quantification of IgG in filtrated upstream samples from a bioreactor cell culture. The sample has an IgG concentration of 2.3 mg/mL determined by traditional Protein G-HPLC-UV. (A) A full run of nine IgG standards with various concentrations starting from 0.125 to 15 mg/mL and two injections of the bioreactor sample. 1 µL of samples was used for measurements. Concentrations are displayed on top of each individual sensorgram. The sensor chip was regenerated using 10 mM glycine buffer pH 2.5 after each sample injection. (B) Extracted and normalized sensorgrams of the sample and six IgG standards (0.5, 1, 2, 3, 5, 10 mg/mL) used for making the calibration curve. (C) Calibration curve and determined concentration of sample based on two replicates.
3.4. Measurement of IgG Titers during Cell Culture
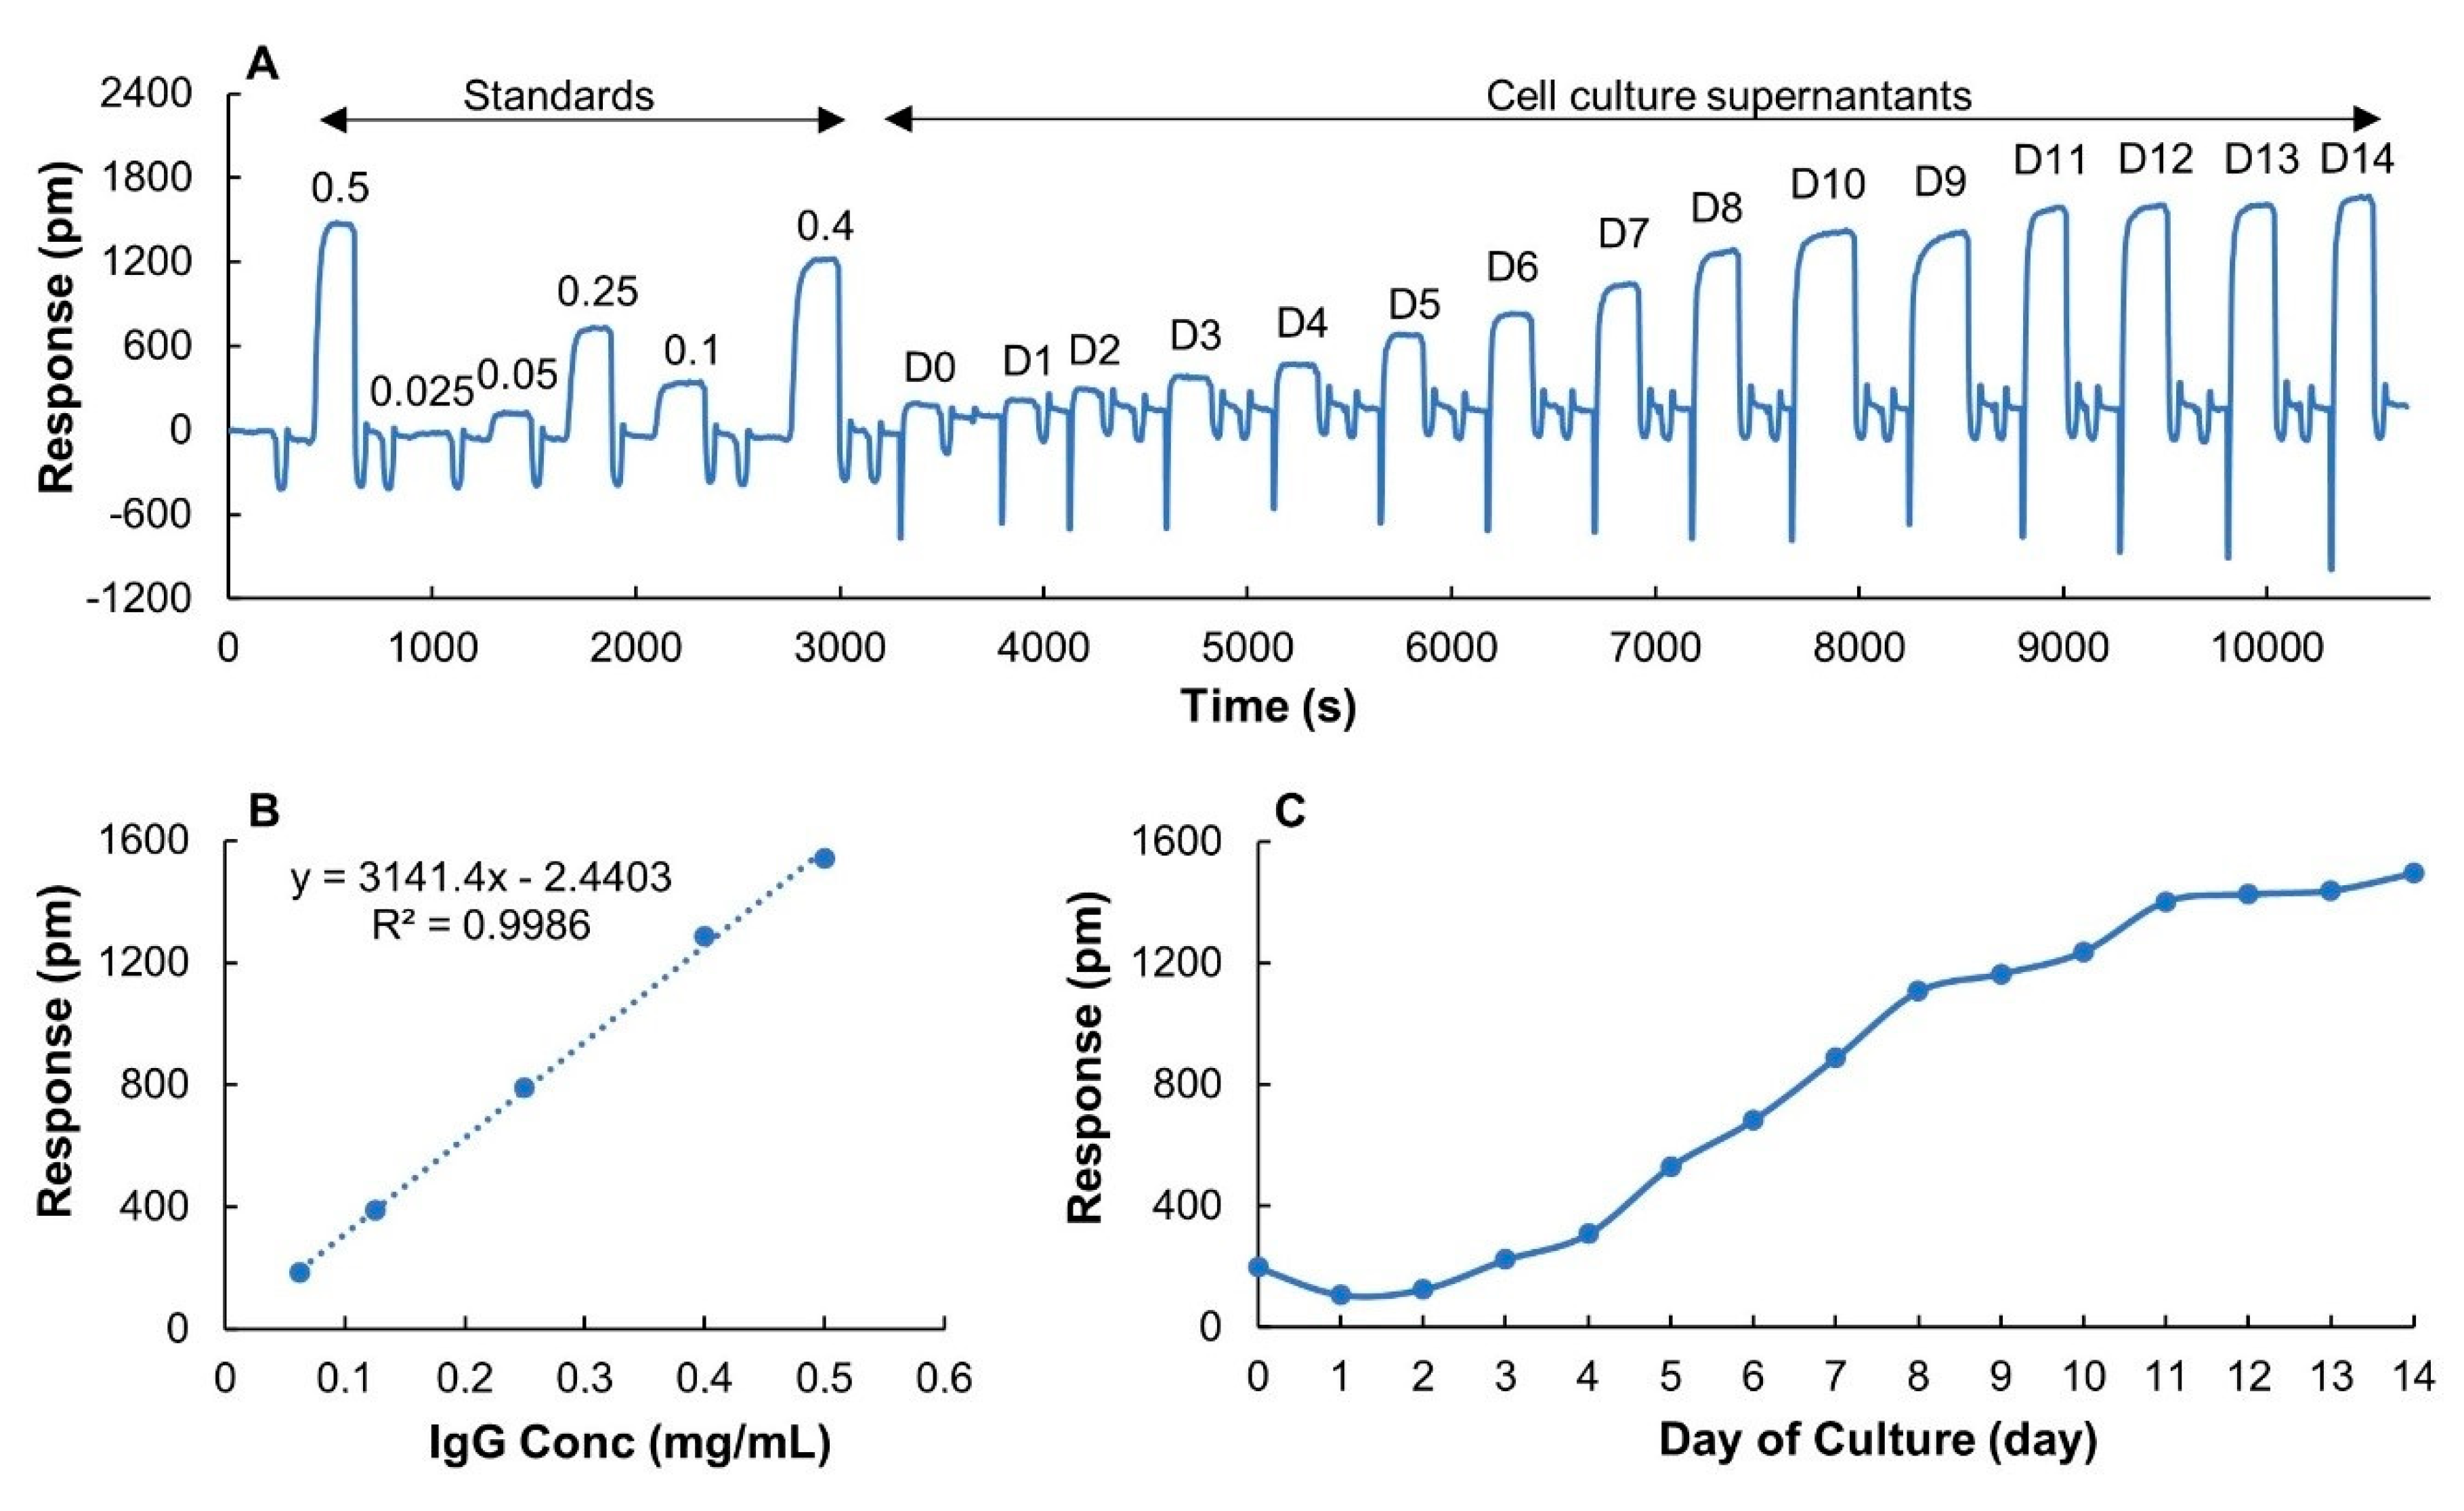
The possibility to rapidly and accurately determine IgG titers over a wide concentration range in an upstream process step was further assessed using a CHO fed-batch culture. Samples collected daily for 15 days from a CHO cell culture were measured using the same sensor chip and IgG titers were determined. A full run, including standards and samples, is shown in Figure 7A. Negative dips in the sensorgrams of samples (D0–D14) were caused by the color of the media but did not interfere with the analysis of the data. Based on the linear range (Figure 7B) and expected concentrations of IgG, a sample volume of 150 µL was used for all the measurements. The binding responses leveled off at day 11 (Figure 7C), indicating that a maximum titer was achieved. Since the binding responses of samples at day 11, 12, 13 and 14 were lower than the maximum binding capacity (2036 ± 120 pm), and were within the linear range of the sensor chip, the sensor surface was never saturated.

Figure 7.
LSPR measurement of filtrated cell culture samples collected daily over two weeks of cultivation. (A) A full run of six IgG standards (diluted from downstream monomeric IgG sample 15 mg/mL) with different concentrations marked on top of each sensorgram and 15 cell culture samples collected from day 0 to day 14 (D0–D14). Injection volume was 150 µL. (B) Calibration curve. (C) Binding responses of samples over cultivation time.
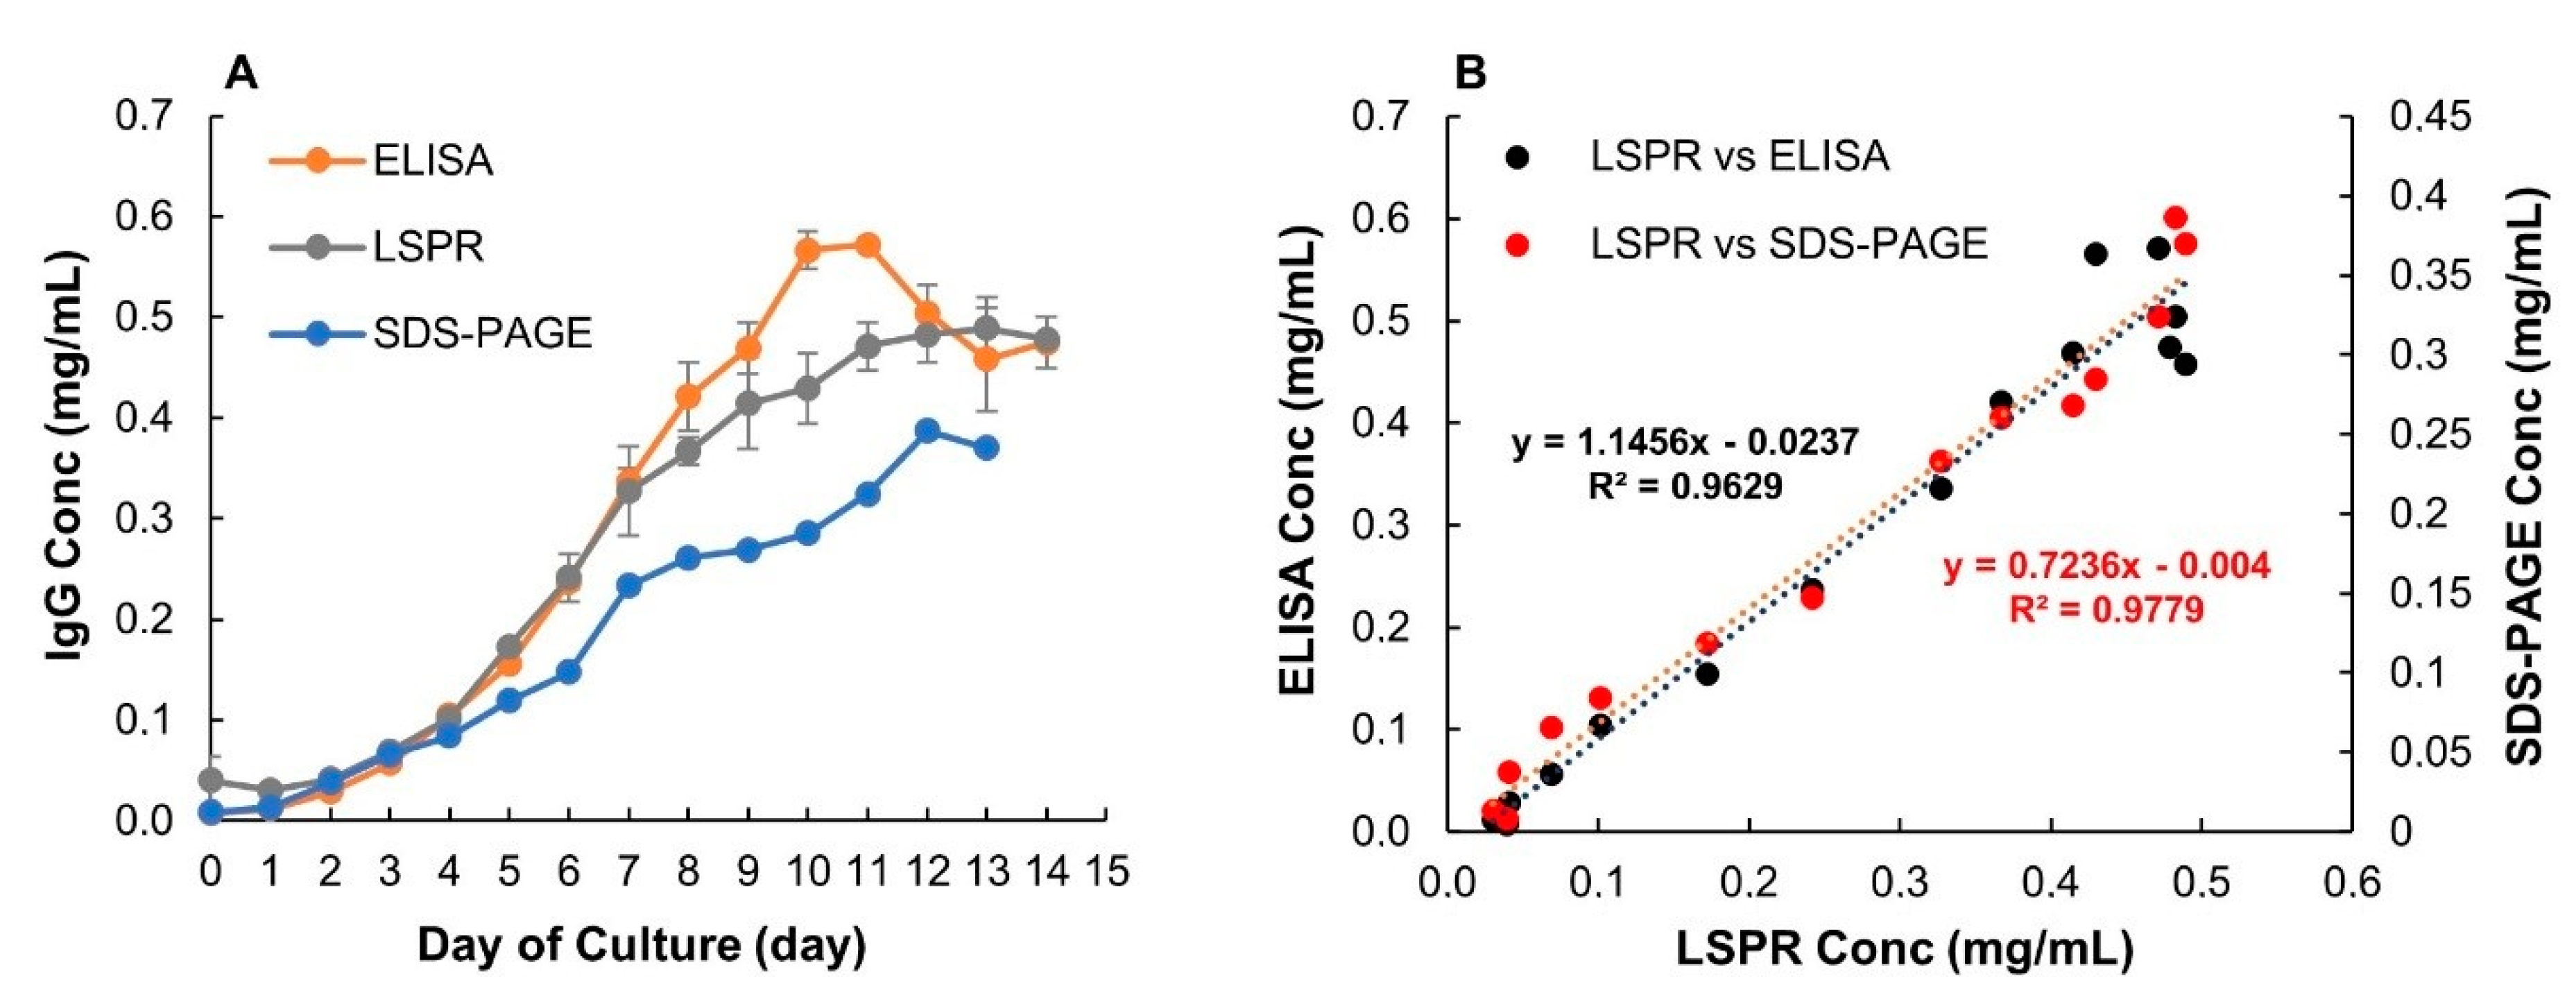
In Figure 8A, the LSPR data are compared to results from ELISA and SDS-PAGE. All methods show a similar trend, that the highest IgG titers were reached at around day 10–11. There was no significant difference between ELISA and LSPR titers for 13 of the 15 measured samples. Titers estimated using ELISA in samples from day 10 and 11 were higher compared to LSPR. For ELISA, there was a drop in IgG titers after day 11. However, such change was not seen in either LSPR or SDS-PAGE. Interestingly, ELISA gave higher IgG titers than LSPR for day 10 and 11 but the same titers as LSPR after that. The ELISA titers were, therefore, likely overestimated for these two samples. Despite this difference, a high degree of correlation (R2 = 0.9629) between these two methods was obtained using linear regression analysis (Figure 8B). The growth curve from LSPR also showed good correlation with SDS-PAGE (sodium dodecyl sulfate-polyacrylamide gel electrophoresis) and a similar correlation coefficient was attained as when comparing LSPR and ELISA. Both ELISA and LSPR use ligand specificity for IgG detection. The small variation in IgG titers between the two methods could be a result of different IgG ligands used for the calibrations. Binding of Human IgG to Anti-human IgG gamma chain and monomeric recombinant IgG to Protein A were used for ELISA and LSPR calibration, respectively. Ideally, for both methods, the sample and the standard should contain the same type of IgG.

Figure 8.
(A) Comparison of IgG titers over cultivation time obtained by ELISA, SDS-PAGE and the developed LSPR sensor. Error bars represent standard deviations (n = 3 and 2 for ELISA and LSPR, respectively. (B) Scatter plot and linear regression analysis for comparison of LSPR versus ELISA and LSPR versus SDS-PAGE.
4. Conclusions
In the present work, a reproducible and reliable nanoplasmonic sensor system for rapid monitoring of IgG titers was evaluated. IgG quantification results from crude cell culture supernatants were highly comparable to conventional protein G-HPLC-UV and ELISA methods. The sample measurement was completed within two minutes by injecting filtrated crude samples directly into the sensor system. The linear dynamic detection range could also be tuned by varying the injection volumes, and samples with concentrations from 0.0015 up to 10 mg/mL could be quantified. The large dynamic range enabled monitoring of titers commonly seen in both upstream and downstream process steps without any sample dilution. While all the measurements in this work were performed under simulated on-line conditions, the flexible sensor design can enable real-time operation on-line when combined with an auto-sampler that diverts or collects and directs cell-free samples from bioreactors into the flow cell. We thus envision that this novel sensor system can be utilized as a versatile technology for on-line real-time IgG monitoring in both process development and bioproduction.
Author Contributions
Conceptualization, D.A., I.L., C.-F.M. and E.M.; methodology, T.T., O.E., E.M., F.M.; software, E.M.; formal analysis, T.T., E.M., D.A.; investigation, T.T., O.E.; writing—original draft preparation, T.T.; writing—review and editing, D.A., T.T., I.L., C.-F.M., E.M., O.E., R.G., R.S., F.M.; supervision, D.A.; funding acquisition, D.A. All authors have read and agreed to the published version of the manuscript.
Funding
This research was funded by the European Union’s Horizon 2020 research and innovation program under the Marie Skłodowska-Curie grant agreement No. 841373 and the Swedish Innovation Agency (VINNOVA), grant numbers 2016-04120 and 2019-00130.
Acknowledgments
Funding from the European Union’s Horizon 2020 research and innovation program under the Marie Skłodowska-Curie grant agreement No. 841373 and the Swedish Innovation Agency (VINNOVA), grant numbers 2016-04120 and 2019-00130, are gratefully acknowledged.
Conflicts of Interest
D.A., E.M., I.L. and C.-F.M. are cofounders of ArgusEye AB.
Appendix A

Figure A1.
pH scouting for surface functionalization using glass sensor chips that have the same surface chemistry as stainless-steel chips. Protein A was immobilized to the sensor surface using 10 mM sodium acetate pH 4.0, 10 mM MES pH 6.0 and 10 mM phosphate buffer pH 7.0.
Figure A1.
pH scouting for surface functionalization using glass sensor chips that have the same surface chemistry as stainless-steel chips. Protein A was immobilized to the sensor surface using 10 mM sodium acetate pH 4.0, 10 mM MES pH 6.0 and 10 mM phosphate buffer pH 7.0.
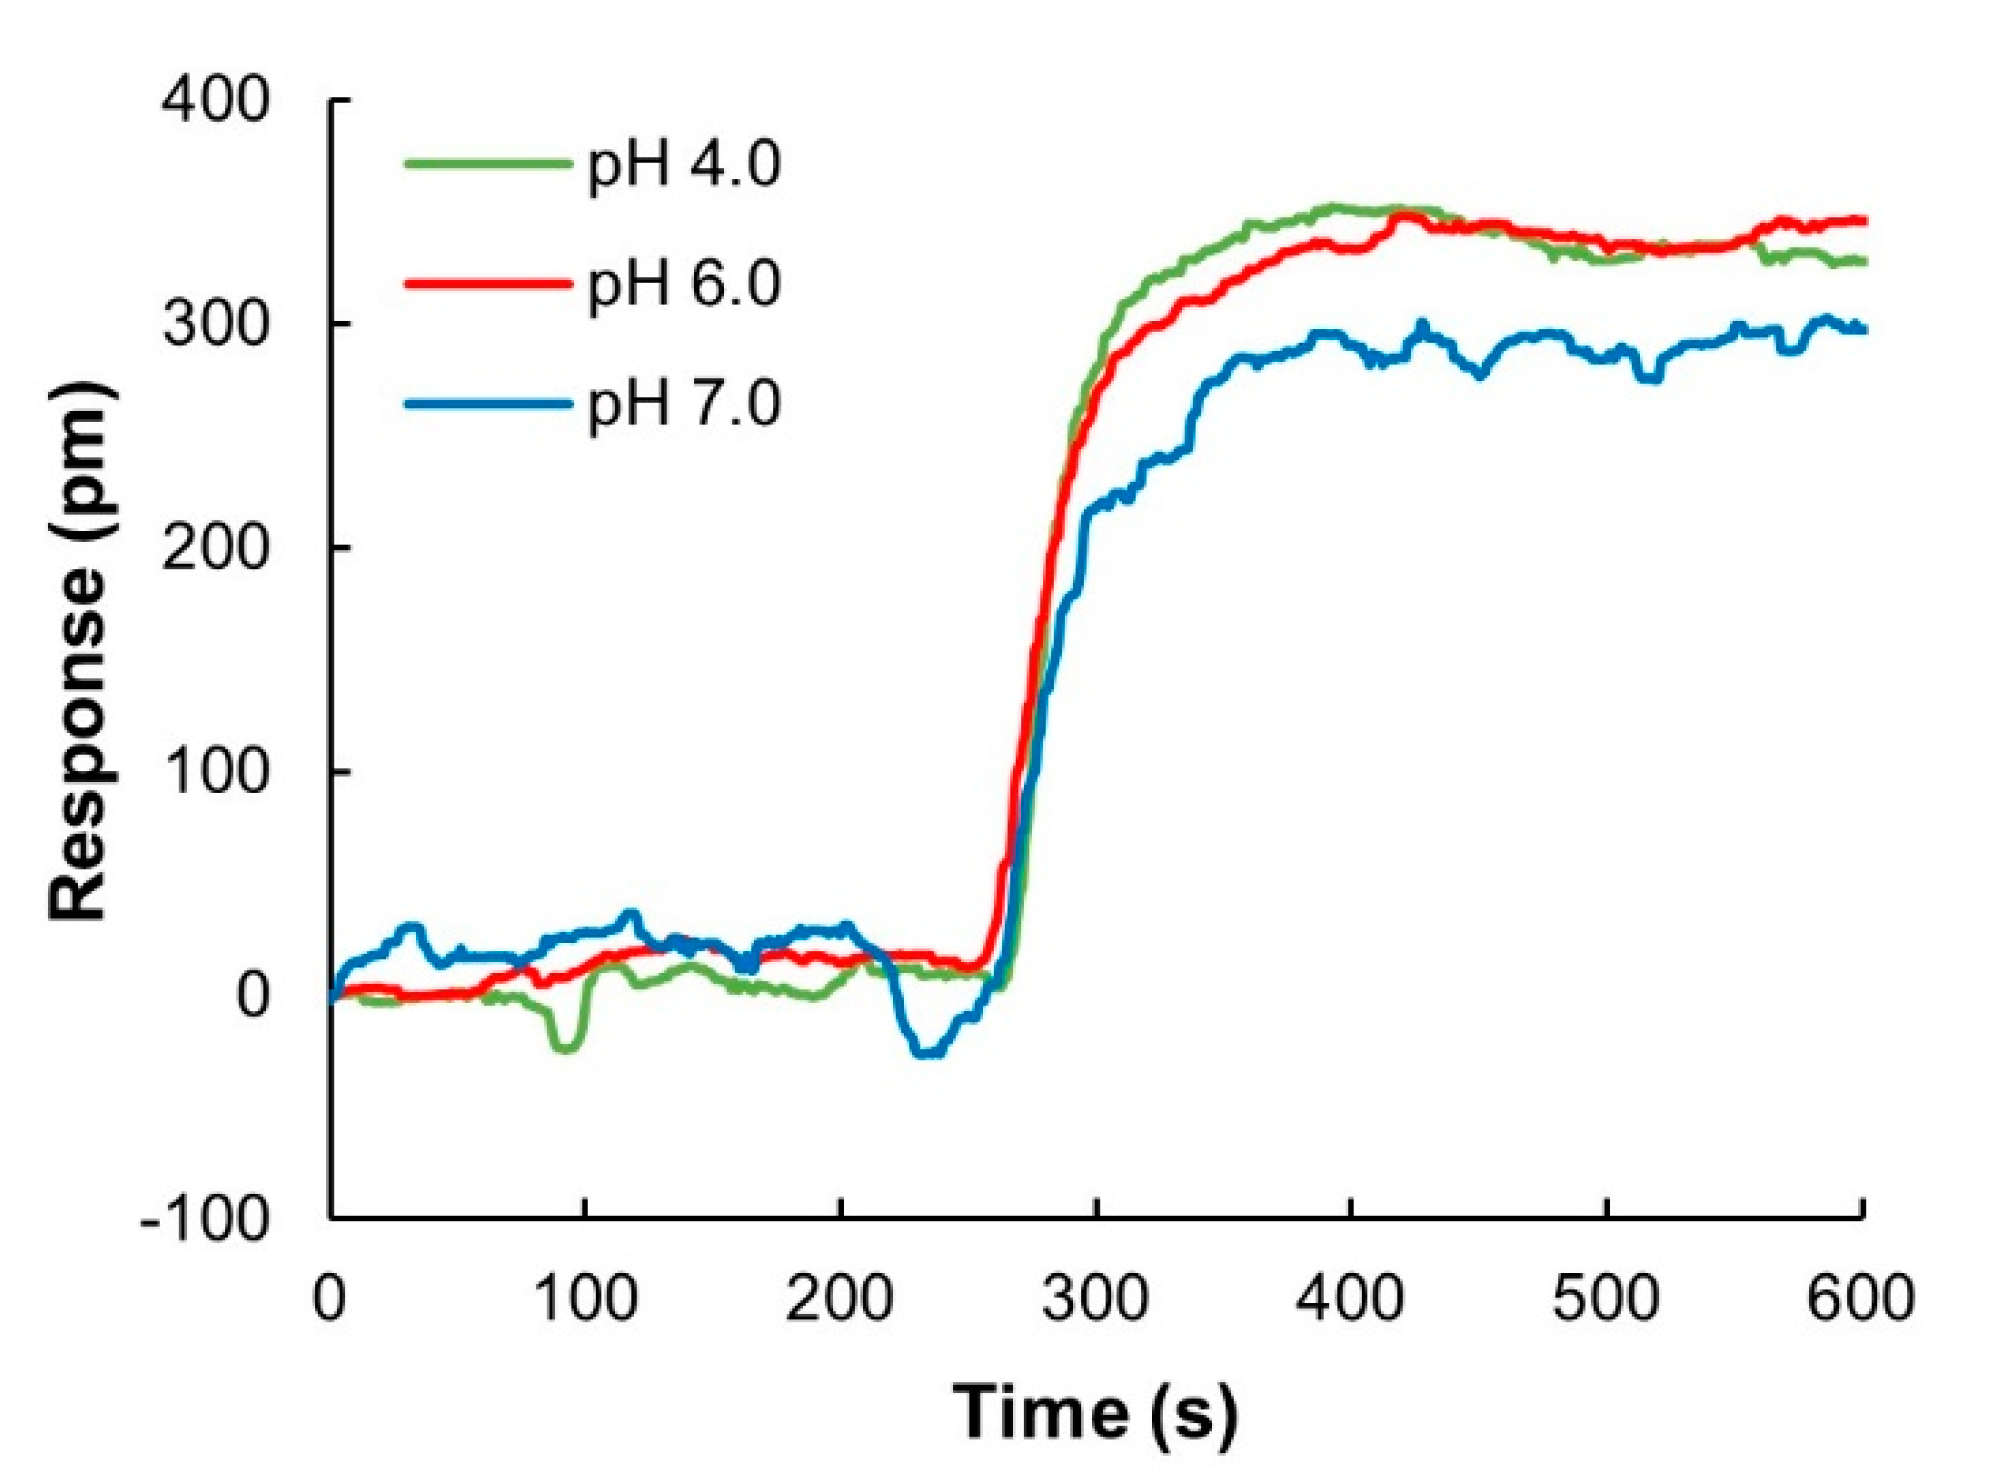

Figure A2.
Binding responses of IgG sample (1 mg/mL) at different injection volumes ranging from 1 μL to 1 mL. For injection volumes > 200 μL, the responses reached maximum binding capacity of the sensor chip. Sensorgrams of two replicates of each injection volumes are depicted with the same color.
Figure A2.
Binding responses of IgG sample (1 mg/mL) at different injection volumes ranging from 1 μL to 1 mL. For injection volumes > 200 μL, the responses reached maximum binding capacity of the sensor chip. Sensorgrams of two replicates of each injection volumes are depicted with the same color.
References
- PAT—A Framework for Innovative Pharmaceutical Development, Manufacturing, and Quality Assurance. 2004. Available online: https://www.fda.gov/media/71012/download (accessed on 29 August 2020).
- Rathore, A.S.; Bhambure, R.; Ghare, V. Process analytical technology (PAT) for biopharmaceutical products. Anal. Bioanal. Chem. 2010, 398, 137–154. [Google Scholar] [CrossRef]
- Glassey, J.; Gernaey, K.V.; Clemens, C.; Schulz, T.W.; Oliveira, R.; Striedner, G.; Mandenius, C.F. Process analytical technology (PAT) for biopharmaceuticals. Biotechnol. J. 2011, 6, 369–377. [Google Scholar] [CrossRef]
- Guerra, A.; Von Stosch, M.; Glassey, J. Toward biotherapeutic product real-time quality monitoring. Crit. Rev. Biotechnol. 2019, 39, 289–305. [Google Scholar] [CrossRef]
- Kesik-Brodacka, M. Progress in biopharmaceutical development. Biotechnol. Appl. Biochem. 2018, 65, 306–322. [Google Scholar] [CrossRef]
- Tsumoto, K.; Isozaki, Y.; Yagami, H.; Tomita, M. Future perspectives of therapeutic monoclonal antibodies. Immunotherapy 2019, 11, 119–127. [Google Scholar] [CrossRef] [PubMed]
- Shukla, A.A.; Wolfe, L.S.; Mostafa, S.S.; Norman, C. Evolving trends in mAb production processes. Bioeng. Transl. Med. 2017, 2, 58–69. [Google Scholar] [CrossRef] [PubMed]
- Kunert, R.; Reinhart, D. Advances in recombinant antibody manufacturing. Appl. Microbiol. Biotechnol. 2016, 100, 3451–3461. [Google Scholar] [CrossRef] [PubMed]
- Huang, Y.-M.; Hu, W.; Rustandi, E.; Chang, K.; Yusuf-Makagiansar, H.; Ryll, T. Maximizing productivity of CHO cell-based fed-batch culture using chemically defined media conditions and typical manufacturing equipment. Biotechnol. Prog. 2010, 26, 1400–1410. [Google Scholar] [CrossRef] [PubMed]
- Reinhart, D.; Damjanovic, L.; Kaisermayer, C.; Kunert, R. Benchmarking of commercially available CHO cell culture media for antibody production. Appl. Microbiol. Biotechnol. 2015, 99, 4645–4657. [Google Scholar] [CrossRef]
- Mushens, R.E.; Guest, A.R.; Scott, M.L. Quantitation of monoclonal antibodies by ELISA: The use of purified mouse IgG and mouse IgM monoclonal antibodies as standards in a quantitative ELISA measuring monoclonal antibodies produced by cell culture. J. Immunol. Methods 1993, 162, 77–83. [Google Scholar] [CrossRef]
- Horak, J.; Ronacher, A.; Lindner, W. Quantification of immunoglobulin G and characterization of process related impurities using coupled Protein A and size exclusion high performance liquid chromatography. J. Chromatogr. A 2010, 1217, 5092–5102. [Google Scholar] [CrossRef] [PubMed]
- Fernández, L.P.; Calvo, L.; Viña, L. Development and Validation of an Affinity Chromatography-Protein G Method for IgG Quantification. Int. Sch. Res. Not. 2014, 2014, 48710. [Google Scholar] [CrossRef]
- Frostell, Å.; Mattsson, A.; Eriksson, Å.; Wallby, E.; Kärnhall, J.; Illarionova, N.B.; Nilsson, C.E. Nine surface plasmon resonance assays for specific protein quantitation during cell culture and process development. Anal. Biochem. 2015, 477, 1–9. [Google Scholar] [CrossRef]
- Zschätzsch, M.; Ritter, P.; Henseleit, A.; Wiehler, K.; Malik, S.; Bley, T.; Walther, T.; Boschke, E. Monitoring bioactive and total antibody concentrations for continuous process control by surface plasmon resonance spectroscopy. Eng. Life Sci. 2019, 19, 681–690. [Google Scholar] [CrossRef]
- Yu, Y.; Mitchell, S.; Lynaugh, H.; Brown, M.; Nobrega, R.P.; Zhi, X.; Sun, T.; Caffry, I.; Cao, Y.; Yang, R.; et al. Understanding ForteBio’s Sensors for High-Throughput Kinetic and Epitope Screening for Purified Antibodies and Yeast Culture Supernatant. J. Biomol. Screen. 2016, 21, 88–95. [Google Scholar] [CrossRef]
- Wang, Y.; Feng, P.; Sosic, Z.; Zang, L. Monitoring Glycosylation Profile and Protein Titer in Cell Culture Samples Using ZipChip CE-MS. J. Anal. Bioanal. Technol. 2017, 8. [Google Scholar] [CrossRef]
- Pedersen, M.E.; Østergaard, J.; Jensen, H. In-Solution IgG Titer Determination in Fermentation Broth Using Affibodies and Flow-Induced Dispersion Analysis. ACS Omega 2020, 5, 10519–10524. [Google Scholar] [CrossRef] [PubMed]
- Swartz, A.R.; Chen, W. Rapid Quantification of Monoclonal Antibody Titer in Cell Culture Harvests by Antibody-Induced Z-ELP-E2 Nanoparticle Cross-Linking. Anal. Chem. 2018, 90, 14447–14452. [Google Scholar] [CrossRef] [PubMed]
- Chemmalil, L.; Prabhakar, T.; Kuang, J.; West, J.; Tan, Z.; Ehamparanathan, V.; Song, Y.; Xu, J.; Ding, J.; Li, Z. Online/at-line measurement, analysis and control of product titer and critical product quality attributes (CQAs) during process development. Biotechnol. Bioeng. 2020. [Google Scholar] [CrossRef]
- Willets, K.A.; Van Duyne, R.P. Localized Surface Plasmon Resonance Spectroscopy and Sensing. Annu. Rev. Phys. Chem. 2007, 58, 267–297. [Google Scholar] [CrossRef]
- Bhagawati, M.; You, C.; Piehler, J. Quantitative Real-Time Imaging of Protein–Protein Interactions by LSPR Detection with Micropatterned Gold Nanoparticles. Anal. Chem. 2013, 85, 9564–9571. [Google Scholar] [CrossRef] [PubMed]
- Liu, Y.; Zhang, N.; Li, P.; Yu, L.; Chen, S.; Zhang, Y.; Jing, Z.; Peng, W. Low-Cost Localized Surface Plasmon Resonance Biosensing Platform with a Response Enhancement for Protein Detection. Nanomaterials 2019, 9, 1019. [Google Scholar] [CrossRef] [PubMed]
- Chavane, N.; Jacquemart, R.; Hoemann, C.D.; Jolicoeur, M.; De Crescenzo, G. At-line quantification of bioactive antibody in bioreactor by surface plasmon resonance using epitope detection. Anal. Biochem. 2008, 378, 158–165. [Google Scholar] [CrossRef] [PubMed]
- Hampson, G.; Ward, T.H.; Cummings, J.; Bayne, M.; Tutt, A.; Cragg, M.S.; Dive, C.; Illidge, T.M. Validation of an ELISA for the determination of rituximab pharmacokinetics in clinical trials subjects. J. Immunol. Methods 2010, 360, 30–38. [Google Scholar] [CrossRef] [PubMed]
- Liu, X.F.; Wang, X.; Weaver, R.J.; Calliste, L.; Xia, C.; He, Y.J.; Chen, L. Validation of a gyrolab™ assay for quantification of rituximab in human serum. J. Pharmacol. Toxicol. Methods 2012, 65, 107–114. [Google Scholar] [CrossRef]
- Satzer, P.; Jungbauer, A. High-capacity protein A affinity chromatography for the fast quantification of antibodies: Two-wavelength detection expands linear range. J. Sep. Sci. 2018, 41, 1791–1797. [Google Scholar] [CrossRef]
Publisher’s Note: MDPI stays neutral with regard to jurisdictional claims in published maps and institutional affiliations. |
© 2020 by the authors. Licensee MDPI, Basel, Switzerland. This article is an open access article distributed under the terms and conditions of the Creative Commons Attribution (CC BY) license (http://creativecommons.org/licenses/by/4.0/).

