1. Introduction
Today, electricity has become a vital commodity for a comfortable life in both urban and rural areas. It is essential in the most critical activities in our everyday life, including entertainment, transportation, education, and healthcare. However, according to the International Energy Agency (IEA), 1.1 billion people, representing 14% of the world’s population, lacked access to electricity in 2016 [
1].
Figure 1, the map of the world’s population without access to electricity, shows that these people live in developing countries, especially in sub-Saharan Africa and South Asia [
2]. Most of these countries show a discrepancy in the electrification rate between rural and urban areas [
3]. That is the case of Nigeria, a sub-Saharan African country, located in the south-east of West Africa and lying between latitudes 4° and 14° N and longitudes 3° and 15° E.
In 2017, the total available grid power of Nigeria was only 5074 MW for a population of over 190 million people with a peak demand of about 17,700 MW [
4]. The national electricity access rate was only 58% with a significant contrast between urban areas (78%) and rural areas (39%) [
5]. The grid extension in rural zones is most often impossible due to rugged terrains, thick jungles, geographical remoteness, high cost of supply, low consumptions, low household incomes, inadequate road infrastructures, and dispersed settlement of consumers [
6]. Consequently, most people in rural areas rely on alternative sources, mostly diesel generators, for electricity supply. This solution has disadvantages of noise pollution, greenhouse gas emission, and above all, requires frequent maintenance with an attendant high cost of fuel [
7,
8].
Furthermore, in the wake of growing environmental concerns, the Nigerian electric power industry is urged to rely on renewable energy (RE) sources for electricity generation [
9]. These sources include wind, solar, biomass, small hydro and geothermal, and have the advantage of being locally available, eco-friendly, free, and inexhaustible [
10].
The main disadvantage of using RE sources for electricity generation is their low reliability due to their intermittent nature. This drawback generally requires oversizing of the system and the use of large capacities of energy storage devices, resulting in significant investment costs [
11]. This is the primary driver of the ongoing popularity of hybrid renewable energy systems (HRESs) as an efficient way to generate electricity in remote areas. An HRES is made up of two or more power plants of different types supplied with corresponding fuels (fossil or renewable). Unlike single-source RE systems, HRESs are more reliable, more efficient, and generate power at lower costs [
12].
Optimal design-related studies dominate the literature on HRESs in developing countries. The main objective of these studies is to determine the appropriate number or size of system components that meet all constraints and minimize or maximize the objective function (s) [
12]. Two main categories of methods have been applied for this task: software tools and optimization techniques. Extensive literature reviews on these works have been carried out in [
13,
14,
15,
16,
17]. For indicative purposes, a few are mentioned below.
Studies that applied optimization techniques for optimal sizing include that of Akbar Maleki and Alireza Askarzadeh [
18] who carried out an analysis on a PV/wind/diesel hybrid system with battery storage for electrification of Rafsanjan, an off-grid remote village of Iran. They used a discrete harmony search-based optimization technique for the optimal sizing of the system and considered the total annual cost of the system as the objective function. Finally, the authors compared the results found with the ones of a discrete simulated annealing algorithm. Weiqiang Dong et al. [
19] proposed an improved ant colony algorithm for the optimal design of a stand-alone hybrid PV/wind/battery/hydrogen system to meet the primary load demand of Zhejiang, a Chinese island. They set two objectives, namely, minimizing the annual cost and maximizing the reliability of the system. Yashwant Sawle et al. [
20] developed a genetic algorithm and particle swarm optimization for the optimal sizing of a stand-alone PV/Wind/Biomass hybrid energy system for the electrification of Barwani district, a remote area of India. They considered the cost of energy as an objective function to be minimized. Singh et al. [
21] applied a swarm-based artificial bee colony algorithm for the optimal sizing of a hybrid PV/Wind/Biomass/battery system to meet the electricity needs of Patiala, a remote village of India. The optimal system obtained included 18 1-kW wind turbines, a PV array of 250-kW capacity, a 40-kW biomass generator, and a 1.4-kah battery for a total net present cost (NPC) of USD 7,230,378 and a cost of energy (COE) of 0.173 USD/kWh. Ma et al. [
22] examined a hybrid PV/Wind system combined with pumped hydro storage (PHS) to satisfy the residential power needs of a hypothetical remote village in Hong Kong. They simulated dozens of component capacity scenarios using a designed mathematical model. Then, focusing on a workable case consisting of two 10.4 kW wind turbines, 110 kWp photovoltaic panels and a PHS system with an upper reservoir of 5106 m
3, the authors concluded that PHS is the best energy storage system for 100% energy autonomy in isolated communities.
Within the framework of studies using software tools, Nasser Yimen et al. [
23] used HOMER software to analyze a stand-alone PV/Wind/Biogas/PHS hybrid system for rural electrification of Djoundé, a remote village in Northern Cameroon. The authors took into account the residential, commercial, agricultural, and community load demands of the village and considered NPC as an objective function. They found out that the optimal architecture of the system was made up of a 15-kW biogas generator, an 81.8-kW PV array for a COE of 0.256 EUR/kWh, and an NPC of 370,426 EUR. Dahyun Kang and Tae Yong Jung [
24] used HOMER software to optimize a PV/Wind/Battery hybrid system for electrification of Kibong-ri, a remote village in North Korea. The authors compared the optimized system to the grid-extension option and found that the obtained hybrid system was more cost-effective for the selected location. Adaramola et al. [
25] applied HOMER software to perform the optimization of a hybrid solar/wind/Diesel Generator system for the electrification of a hypothetical remote village of Ghana. Considering the NPC as an objective function, they found that the optimal system included a 100-kW wind turbine, an 80-kW PV array, and a 60-Surrette 4KS25P battery. Their system could generate 791.1 MWh of power per year at a COE of 0.281 USD/kWh. HOMER software was also used to analyze a stand-alone PV/Wind hybrid system in Kenya and South-Africa [
26], and a PV/Fuel Cell/Battery hybrid system for seawater desalination at Saudi NEOM City [
27]. Very recently, Donado et al. [
28] presented HYRES (Hybrid Renewable Energy System), a new software tool for the optimal sizing of HRES. The designed software has the advantage of using intelligent techniques that allow multiobjective optimization using genetic algorithms. The comparison of the results obtained from 23 case studies with the developed tool and HOMER software showed that HYRES was statistically acceptable.
The literature review reveals that the PV/Wind/Diesel/Battery configuration is one of the most analyzed configurations in existing HRES related studies, especially those conducted in sub-Saharan Africa. Both classes of methods (optimization techniques and software tools) have been applied for optimal sizing of the systems. However, some aspects related to such systems have not been investigated. This is the case of the effect of the reliability on the economic performance of the system. Besides, studies that carried out techno-economic and emissions analyses of the optimized system compared to the two traditional modes of rural electrification (diesel generator and grid-extension) in the region are rare. Such an analysis could be essential to highlight the relevance of HRESs as a better means to increase the electrification rate in rural areas, and, therefore, attract the attention of decision-makers to the importance of designing adequate policies to strengthen their promotion and implementation in the region.
This study aims at filling the literature gaps as mentioned above by proposing a two-step research methodology for optimal sizing and techno-economic analysis of a hybrid PV/Wind/Diesel/Battery system to meet the load demand of Fanisau, a remote village of Northern Nigeria.
The organization of the rest of this article is as follows:
Section 2 introduces the materials and methods applied to achieve the study.
Section 3 displays the results obtained and presents the discussion of these results. The conclusions end the paper in
Section 4.
2. Materials and Methods
This study adopted a two-step methodological framework to analyze the proposed HRES. The block diagram of this research methodology is presented in
Figure 2.
In the first step, the MATLAB (Version 9.3) environment was used to run simulations and optimize the system via the genetic algorithm with a time interval of 1 h over a year for the load demand and energy output. Then, techno-economic and emissions analysis was carried out in the second step to compare the obtained optimized system to the traditional modes of rural electrification in sub-Saharan Africa. During the techno-economic and emissions analysis phase, first, the break-even distance parameter was adopted to compare the optimized system with the grid-extension. In contrast, the Simple Payback Period (SPP) and Net Present Value (NPV) parameters were used for the comparison with the diesel generator. Finally, the emission reduction potential of the proposed system for each greenhouse gas (GHG) compared to the two conventional modes was calculated to highlight the environmental friendliness of the system.
All analyses were performed on Windows 10 Pro 64-bit with 2 GHz Intel Core i7 CPU, 3 GB GPU, and 8 GB of RAM. Comprehensive information on the developed methodology is given in the following subsections.
2.1. Study Location and the Available Solar and Wind Resources
The proposed stand-alone hybrid renewable power system was designed to meet the load demand of Fanisau, a remote village of Kano state in northern Nigeria. The locality is not yet connected to the electricity grid network by Kano Electricity Distribution Company (KEDCO), the utility company responsible for the distribution of electricity in the states of Kano, Katsina, and Jigawa. The nearest power transformer is located in Ungogo, a town 30 km away.
Figure 3 presents the spatial location of the study area, while
Table 1 displays the related background information.
The solar insolation and wind speed data used for the simulations in this study were collected from the NASA Surface meteorology and Solar Energy (SSE) database [
29], at the coordinates of Kano (12°00′00″ N and 8°31′00″ E), the data location closest to Fanisau.
Figure 4 presents the hourly profiles of solar irradiation (a) and wind speed at the height of 10 m above sea level (b) during a year (8760 h).
2.2. Load Assessment
In most rural areas of developing countries, electricity is essential for an acceptable quality of life and is mainly used for lighting, refrigeration, communication, and motor applications. The demand load of the study area was evaluated for the residential, community, and commercial sectors. The evaluation took into account the future needs of the location and previous studies implemented in Cameroon and Ghana [
23,
25].
Table 2 displays the number and rating of power-consuming appliances needed for the sectors considered, while
Table 3 presents the hourly electricity demand of the study area. Accordingly, the daily electricity demand was evaluated at 484.729 kWh/day, resulting in an annual demand of 176,926 kWh/year.
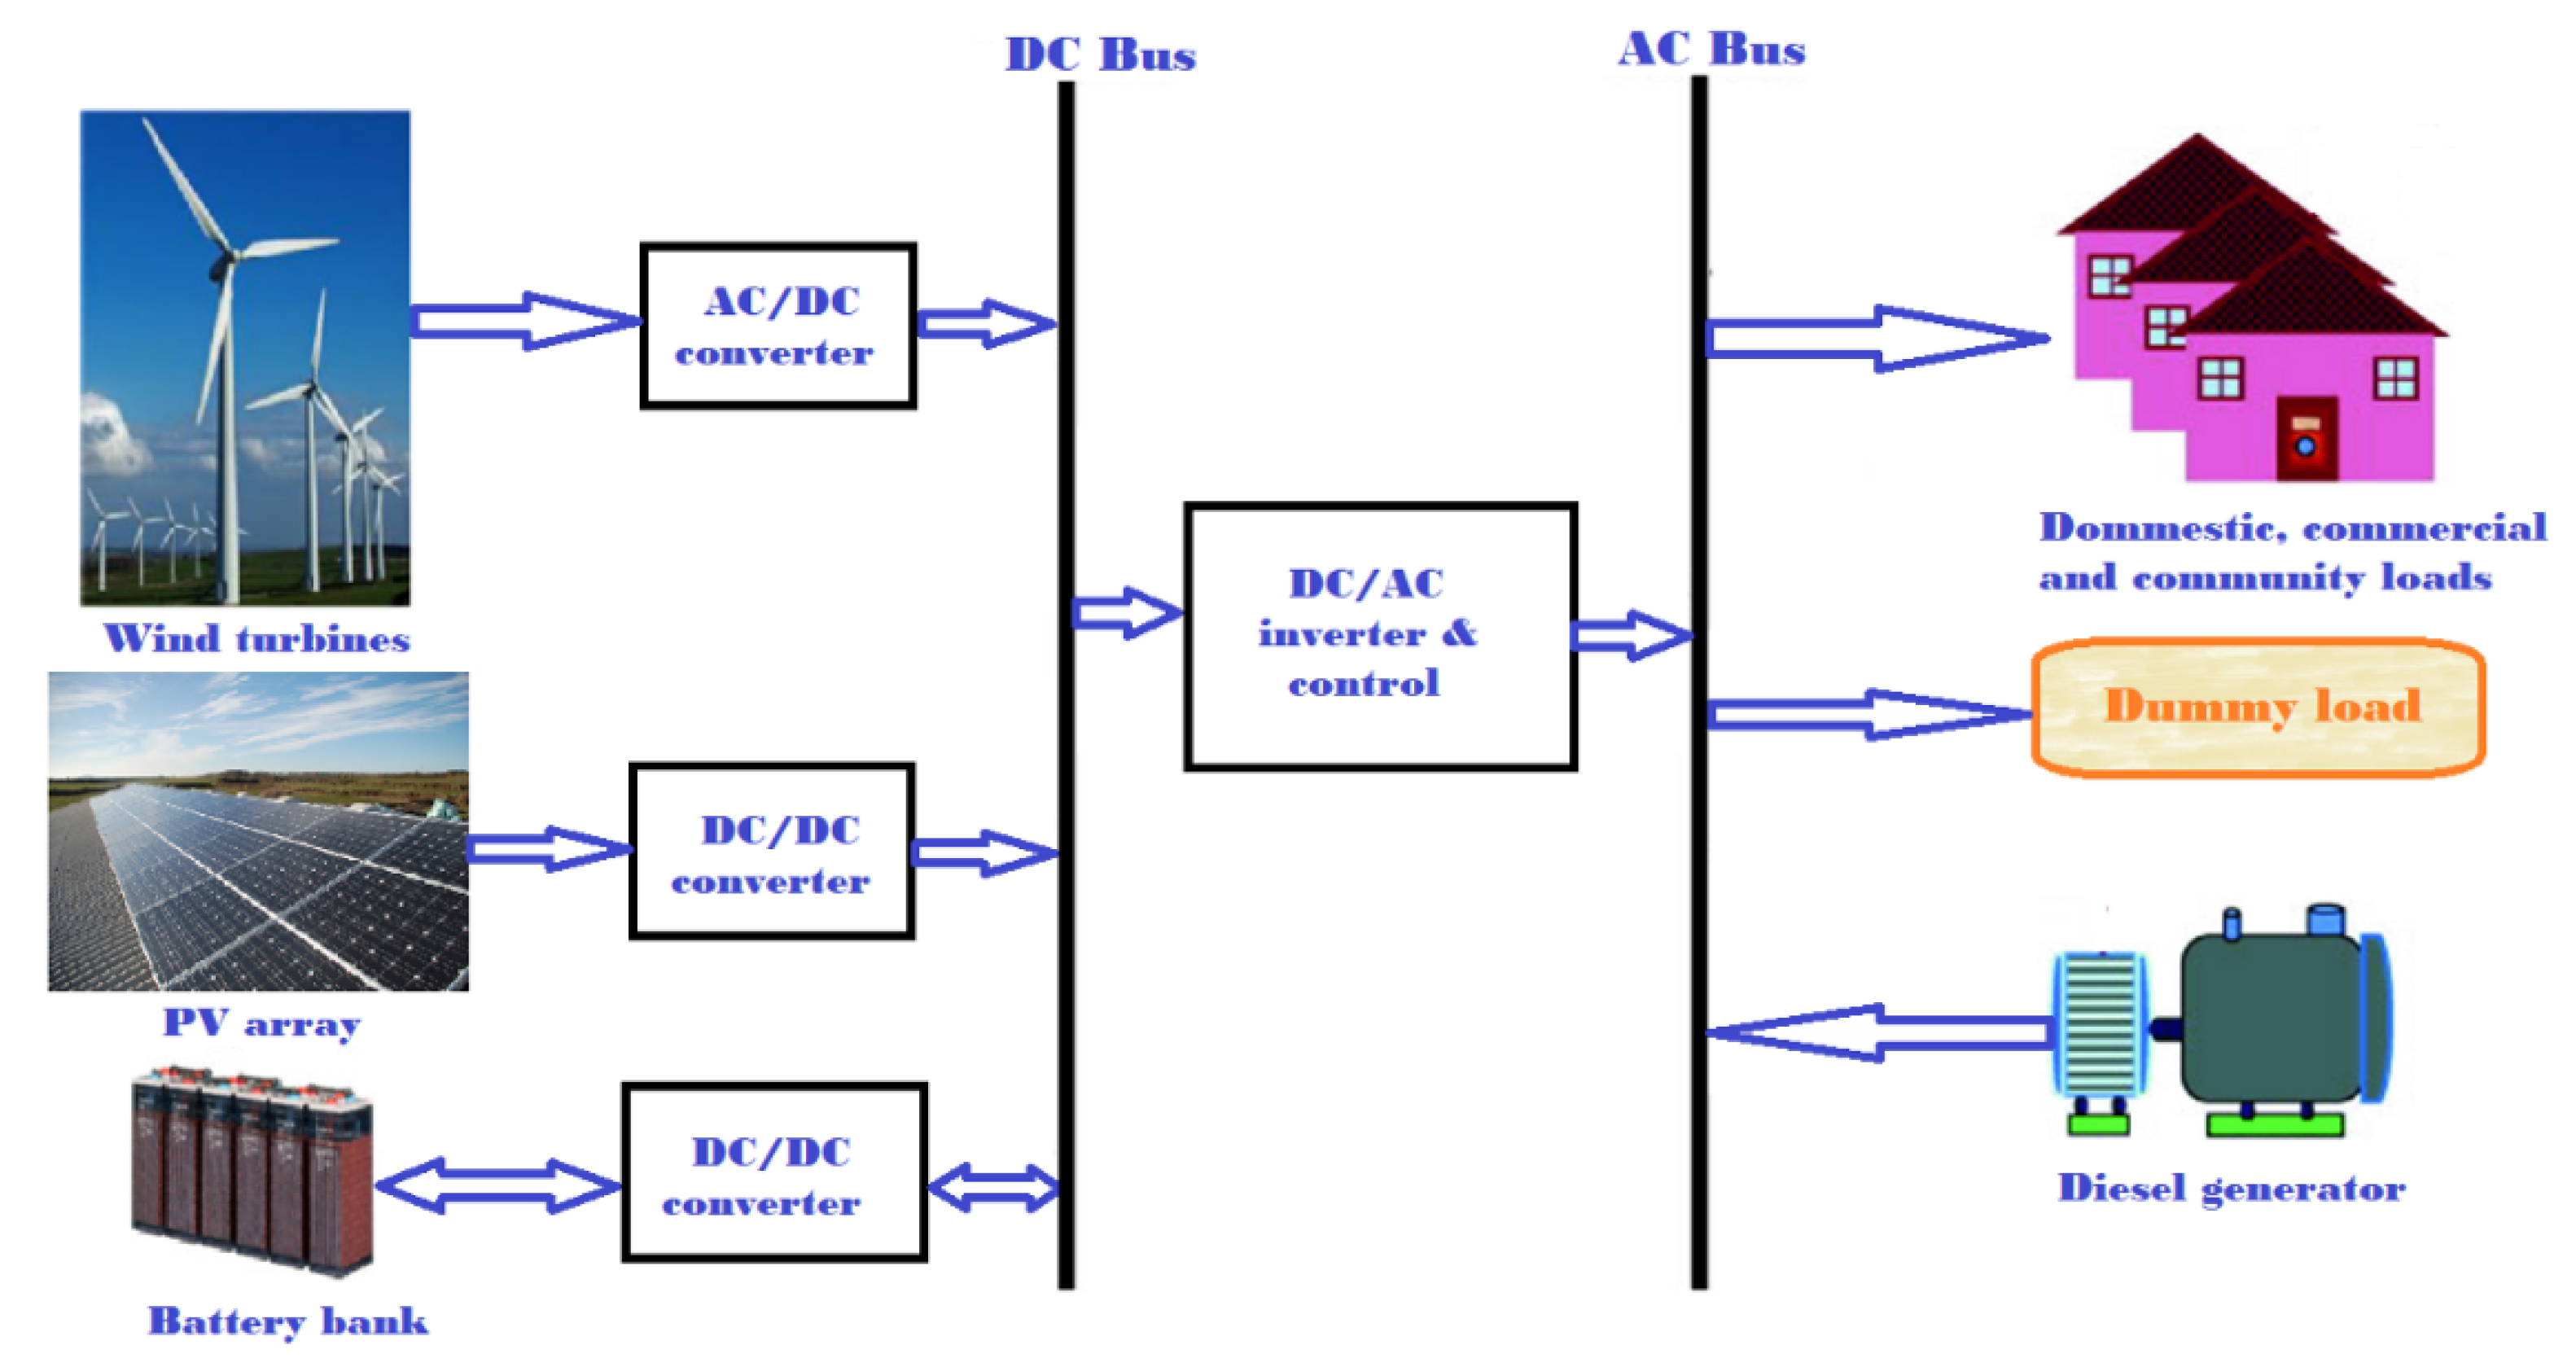
2.3. System Configuration and Operation Strategy
Figure 5 presents the schematic description of the stand-alone hybrid renewable system to be sized. The proposed system is made up of two renewable power generators (wind turbine and PV array), an energy storage device (battery bank), a diesel generator as a back-up power source, and a load. Wind turbines, PV array. and battery banks are connected to the direct current (DC) bus via appropriate inverters or converters. In contrast, load and the diesel generator are connected to the alternative current (AC) bus.
When the power generated by the renewable energy sources (wind turbines and PV array) matches with the load demand, the total power generated is used to meet the load. If this power is higher than the load demand, excess energy is stored in the battery bank, and any further surplus is dumped to the dummy load. If it is lower than the load demand, the power stored in the batteries is used to achieve the balance of power. In a situation where the load demand exceeds the power generated by the renewable energy sources plus that of the storage system, part of the load must be shed, and this results in a loss of power supply.
2.4. Modeling of the System Components
2.4.1. Photovoltaic System Modeling
The design of the photovoltaic system consists of determining the appropriate number of PV modules that convert sunlight directly into direct current (DC) power. A photovoltaic (PV) module is an assembly of PV cells. The output power of each PV module at hour
t (pPV(t)) can be expressed using the following formula [
19]:
where
I(t) is the solar insolation (kW/m
2) at hour
t.
A denotes the PV module area (m
2), and
ηPV is the efficiency of the PV module. In this study, we assumed that the PV modules have a maximum power point tracking (MPPT) system and ignored the temperature effects. Considering
NPV as the number of PV modules, the overall produced power can be calculated as follows:
The SPR-E20-327 model of PV module was adopted for the application in this study. It is a monocrystalline module manufactured by Sunpower. The module has a rated power of 327 W
p, an area of 1.63 m
2, and an efficiency of 20.4%. The technical and economical specifications of the selected PV module model are displayed in
Table 4.
2.4.2. Wind Turbine Modeling
As wind speed rises above the cut-in velocity, the power delivered by the generator is proportional to the cube of wind speed. Once the speed surpasses the rated velocity (v
r), the power generated by the generator is constant and equal to the rated power (
Pr). If the cut-out value (
Vco) is exceeded, the machine stops operating so as to preserve the generator, resulting in zero output power. Mathematically, the power generated by each wind turbine (
pWT) at hour
t is expressed as follows:
For application purposes, the Bergey excel 10-R model wind turbine model is considered in this study. It is manufactured by Bergey Windpower and has a rated power of 10 kW at 12 m/s. The technical and economical specifications of the selected wind turbine are presented in
Table 5.
The wind speed at the hub height was calculated using the power law as follows:
where
Vanem and
Vhub are the wind speeds at the anemometer, and hub height (
Zanem and
Zhub), and
α is the power-law exponent, set at 0.2. The overall amount of power produced is expressed as follows:
where
NWT is the number of wind turbines.
2.4.3. Battery Bank Modeling
Battery, especially deep-cycle lead-acid type, is the most used storage system in hybrid systems. A comprehensive investigation of the charge and discharge requirements of the battery is essential in determining its optimal size.
The state of charge (SOC(t)) of the battery bank at any hour t of the year is linked to SOC(t−1), the previous state of charge, and the energy depletion or accumulation state from t−1 to t.
If
, the generated renewable power is enough to meet the load demand
Pl(t), and the excess is stored in the battery bank. The battery is said to be in the charging state, and
SOC(t) is expressed as follows [
33]:
where
ηinv is the inverter efficiency and
ηbc the charging efficiency of batteries,
Cb is the nominal capacity of a battery in kilowatt-hours,
Nb is the total number of batteries, and
σ is the hourly self-discharge rate.
On the other hand, if
, the renewable power is insufficient to meet the load demand and the energy stored in the batteries is used to fill the gap. The batteries are in the discharge state. Hence,
SOC(t) can be expressed as [
33]:
where
ηbd denotes the discharging efficiency of batteries.
Over-discharge should be avoided to ensure a longer life to the batteries. Consequently, at any hour
t,
SOC(t) should be subjected to the following constraints:
where
DOD is the maximum depth of discharge.
Table 6 presents the relevant technical and economic specifications of the selected battery model for this study.
2.4.4. Diesel Generator Modeling
Ramoji et al. [
33] estimated the annual cost of fuel required to run the generator over the life of the system as follows:
where
CF is the unit fuel cost, set in this study at 1 USD/liter.
F(t) is the hourly fuel consumption of the generator, evaluated by:
where
PDG(t) is the power generated (KW) at time
t, and
PR is the rated power of the generator.
A = 0.246 L/kWh and
B = 0.0845 L/kWh are the fuel curve coefficients.
The diesel generator is used as a back-up power supply to ensure a continuous supply to the load when the energy from renewable energy systems (wind and PV) and batteries is unable to meet the demand, that is to say
. In that case, the required power
PDG(t) from the diesel generator is expressed as follows:
If the required power
PDG(t) is higher than the rated power of the generator
PR, the loss of power supply (
LPS) is computed by:
A generic diesel generator was considered with a unit capital and replacement cost of 1000 USD/kW, an operations and maintenance cost of 0.04 USD/kWh, and a lifetime of 10 years [
34].
2.4.5. Inverter and Converters
Power converters are used in a hybrid AC/DC power system to convert DC to AC and vice versa. The output power of wind turbines, PV panels, and batteries are DC; hence, to meet the AC load demand, inverters are necessary. The rated power of inverter,
Pinv was computed according to the peak AC load demand,
PpeakAC as follows:
where
ηinv denotes the inverter efficiency. For this study, a generic inverter/converter power model with an average installation unit cost of 160 USD/kW and a lifetime of 5 years was considered [
35].
2.5. Sizing Optimization Model
The modeling process of any optimization problem includes (1) identifying the decision variables, (2) defining the objective function (s), and (3) and defining the constraints. These three components linked to this optimal design study are presented in detail in the following subsections.
2.5.1. Decision Variables
The decision variables in an optimization problem are quantities that the decision-maker can control. Their optimal values must be determined to solve the problem. In this optimal sizing study, four decision variables were identified as follows:
NPV: the number of PV module,
NWT: the number of wind turbines,
NBAT: the number of batteries, and
PR: the rated capacity of the diesel generator.
2.5.2. Objective Function
An objective function is a mathematical function in terms of the identified decision variables which expresses the target to be reached in an optimization problem. In this optimal design study, the aim was to minimize the total cost of the proposed HRES. The total annualized cost (
TAC) of the system was considered, so the objective function was defined by:
where
CTA,k,
O&MT,k,
RTA,k,
CFk, and
STA,k are the equivalent value of the annuity (a series of equal annual cash flows) of, respectively, the capital cost, operations and maintenance cost, replacement cost, fuel cost, and salvage value of the component
k.
The value of the equivalent annuity of a present worth is obtained by multiplying the present worth by the capital recovery factor (
CRF).
CRF is defined as follows:
where
i denotes the interest rate, and
N is the lifespan of the system. In this study, the interest rate was set at 10% per year and the lifespan of the system at 20 years.
where
CPV,
CWT,
CBAT,
CCON/INV, represent, respectively, the installation cost of one unit of PV module, wind turbine, battery, and converters/inverters.
CDG is the installation cost per kW of the diesel generator.
In this study, the operations and maintenance costs of battery and converter/inverter are neglected, hence:
where
O&MPV and
O&MWT denote, respectively, the operations and maintenance cost of one unit of PV module and wind turbine,
O&MDG is the operations and maintenance cost of the diesel generator in USD/kWh.
PDG(t) is the power from the diesel generator at time
t.
During the lifetime of the system, only batteries, diesel generator and converters/inverters are replaced. The batteries are replaced three times (in the 5th, 10th, and 15th year), while the converters/inverters and diesel generator are replaced once, in the tenth year. Consequently,
where
RBAT and
RCON/INV are the replacement costs of one unit of battery and converters/inverters, respectively.
The salvage value of a component is its remaining value at the end of the project lifetime. It is calculated as follows:
where
Ck is the installation or replacement cost of the component;
Lrem, its remaining life;
Lcom, its lifetime.
For the proposed hybrid system, only the PV component has a salvage value at the end of the project lifetime
where
LPV is the lifespan of PV modules.
The total annualized cost (
TAC) of an HRES is sometimes associated with the levelized cost of energy (
COE) which is the average production cost of 1 kWh of useful power by the system. It is defined as follows:
where
Eserv is the useful power served by the system.
2.5.3. Constraints
In optimization, a constraint is a condition that the decision variables of the problem must satisfy. In this study, four categories of constraints were identified as follows:
From the above description, the final model of the optimal sizing problem of the proposed HRES can be summarized as in Equation (27):
In the optimization process, LPSP* and REF* were set at 1% and 75%, respectively. However, the sensitivity analysis of LPSP* was performed to further analyze the effect of reliability on the economic performance of the system.
2.6. Simulation and Optimization Process
Figure 6 illustrates the flowchart of the optimization process.
A MATLAB code was developed to simulate the proposed HRES as designed and modeled in the previous subsection. The genetic algorithm was applied as a solving tool to resolve the optimization model in equation 27 to determine the optimal configuration of the system. The genetic algorithm (GA) is a technique for solving both unconstrained and constrained optimization models. It is based on a natural selection process that simulates biological evolution. Further information about the genetic algorithm can be found in [
36,
37]. In the simulation process, the parameters of the genetic algorithm consist of a population size of 40 and a maximum number of generations of 400. Each chromosome [
NPV,
NWT,
NBAT,
PR] consists of four genes, namely, the number of PV module (
NPV), the number of wind turbines (
NWT), the number of batteries (
NBAT), and the rated capacity of the diesel generator (
PR). The elite count was set at 4, and the crossover fraction at 0.8. Since the genetic algorithm is a stochastic optimization technique, the algorithm was run 20 times, and the simulation providing the lowest fitness function value was considered.
Compared to other heuristic algorithms such as Particle Swarm Optimization (PSO), Simulated Annealing (SA), and Ant Colony (AC), the genetic algorithm has the advantage of converging more quickly to the optimal global solution. Besides, the exploration probability of the search area is much higher, and there are multiple starting points and directions in which the search proceeds [
20].
2.7. Techno-Economic and Emissions Analysis
The techno-economic analysis was carried out to compare the optimized system with the traditional modes of rural electrification in SSA, namely diesel generator and grid-extension.
The break-even grid extension distance (
Dgrid) is the distance from the grid where the total annualized cost of grid extension is equal to the total annualized cost of the proposed stand-alone system. After this point, the proposed HRES is more cost-effective than the grid extension for electrification of the village. Before, the grid extension is better. The following formula determines the break-even grid extension [
38]:
where
TAC is the total annualized cost of the stand-alone system in USD;
N is the lifetime of the project in yr;
Edemand is the total annual energy demand in kWh/yr;
cpower is the cost of grid power in USD/kWh;
cinv is the investment cost of grid extension in USD/km;
com is the O&M cost of grid extension in USD/yr/km.
The investment and O&M costs of the grid extension were, respectively, estimated at 14,000 USD/km and 300 USD/year/km in [
23]. The average price of grid electricity in Nigeria is 0.1 USD/kWh [
5].
The profitability of the proposed system compared to the diesel generator, for the electrification of the study area, was achieved by analyzing the hypothetical project of replacing the diesel generator by the designed HRES. In this replacement project, the diesel generator is considered as the defender while the designed HRES is the challenger. The Net Present Value (NPV) and the Simple Payback Period (SPP) parameters were considered while analyzing the project.
The net cash flow
NCFt in the year
t of such a project is defined by the following formula:
where
NCFCt and
NCFDt are the net cash flow of, respectively, the challenger and the defender in the year
i, and
N is the project’s lifetime. A diesel generator can last from 12,000 to 25,000 h. In this study, the lifespan of the defender was set at 2 years and the same model detailed in
Section 2.4.4 was applied. The
SPP of a project is the time required to recover the investment cost. The
NPV of the hypothetical replacement project is defined as follows:
where
i is the interest rate.
As a general rule, a project is economically feasible if its
NPV is higher than 0. In such a case, the defender must be replaced by the challenger. Besides, 8 years is the common acceptable maximum
SPP for renewable energy projects [
39]. Considering the risks associated with implementing such projects in Nigeria, the maximum acceptable
SPP was set at 6 years.
The emissions analysis was carried out to estimate the potential of the designed system in the emission reduction of greenhouse gases (GHGs) which include carbon dioxide (CO2), methane (CH4), and nitrous oxide (N2O).
The annual emission reduction potential of the designed system in comparison to the base case
i for the greenhouse gas
j (Δij) was calculated using the following formula:
where
Ed (kWh/year) is the yearly electricity demand in the study area,
Pdg (kWh/year) the yearly electricity generated from the diesel generator component of the proposed system, and
ei,j is the
j emission factor for the base case
i. Matthew Brander et al. [
40] estimated the CO
2, CH
4, and N
2O emission factor for the Nigerian grid at, respectively, 0.4827796, 0.0000112, and 0.0000016 kg per kWh of electricity consumed. On the other hand, the average CO
2, CH
4, and N
2O emission factor for the diesel generator are 0.69, 0.00002, and 0.00009 kg/kWh, respectively [
41].
3. Results and Discussion
3.1. Optimization and Simulation Results
Different aspects of the simulation and optimization with Matlab are represented in
Figure 7. The algorithm reached the final point (optimal solution) after 157 generations. The best fitness function value at each generation is represented in
Figure 7a. The final point, with a fitness function value of 43,807, is (
NPV*,
NWT*,
Nbat*,
PR*) = (273, 0, 148, 100.31) as plotted in
Figure 7b. The genealogy at each generation is described in
Figure 7c where red and blue lines indicate the mutation and crossover children, respectively, while blue ones indicate elite individuals. The levels of generation and stall criteria at the end of the simulation were, respectively, 39% and 21%, as shown in
Figure 7d.
Based on the above simulation and optimization results, the technical and economic specifications of the optimal HRES are summarized in
Table 7.
The architecture of the optimal system was composed of 273 PV modules, 148 batteries, a diesel generator of 100.31-W capacity. The wind turbine component was not part of the optimal system. The annual electricity produced by the system was 200,792 kWh of which 200,770 kWh were from solar PV, and only 22 kWh from the diesel generator implying a capacity factor of 25.7% for the PV array and 2.5% for the diesel generator. Of the PV power produced, 14,878 kWh were excess to the requirements and transferred to the dump load. Among the total useful power (185,914 kWh), 175,170 kWh representing 94% was consumed by the community, while the rest constituted battery and converter losses. The resulted loss of power supply probability (LPSP) and renewable energy fraction (REF) were, respectively, 1% and 98.72%, which indicated that the LPSP constraint was binding, while the REF’s was not.
The total annualized cost (TAC), total operation and maintenance cost, and total capital cost of the optimal system were found to be 43,807 USD/year, 1817 USD/year, and 323,870USD, respectively. The resulting COE was 0.25 USD/kWh, which is two and a half times the current electricity tariff in Nigeria.
Figure 8 shows the TAC break-down by cost type and components. It should be noted that the PV component represented about 79% of the TAC of the system. Therefore, solar PV may be a critical component in stand-alone HRESs in sub-Saharan Africa. The cost of the battery bank accounted for 17% of the TAC, followed by the inverter cost, which represented approximately 3%. The least-cost component was the diesel generator, at only 1% of the TAC, including the capital, O&M, fuel, and replacement costs.
As compared to previous studies, the share of the diesel generator in the total annual cost is relatively lower. A potential justification of that fact may be the trend of cost reduction of renewable energy technologies and the cost volatility of fossil fuels, which make RE technologies more and more competitive than diesel generator for electricity production. Besides, the absence of the wind turbine component in the architecture of the optimal system can be explained by the difference in cost reduction speed of the two technologies. Although the costs of both technologies have been decreasing over the years, solar PV has been showing higher reduction potential than the wind turbine. According to the International Renewable Energy Agency (IRENA), the capital cost of solar PV is expected to fall by 57% from 2015 to 2025, while the costs of onshore and offshore wind turbine installations are expected to decrease only by 15% and 12% during the same period [
42]. This result is also in line with Nigerian government resolutions to adopt solar PV based stand-alone systems to provide electricity to 60% of the rural population not yet connected to the national grid [
43]. At the regional level, the World Bank recently agreed to strengthen the Regional Off-Grid Electrification Project (ROGEP) with a contribution of USD 225 million in cash and credit. The project aims to improve rural electrification through autonomous solar photovoltaic systems in 19 countries of West Africa and the Sahel, including Burkina Faso, Guinea-Bissau, Cameroon, Guinea, Liberia, Nigeria, Mauritania, Togo, Benin, Central African Republic, Senegal, Chad, Côte d’Ivoire, Ghana, Gambia, Mali, Cabo Verde, Niger, and Sierra Leone [
44,
45].
The hourly profile of the state of charge (SOC) of the battery bank during the simulation year is shown in
Figure 9. The SOC was relatively high most of the time; the maximum SOC (100%) existed for about 10% of the time. This may explain the relatively large amount of excess renewable electricity (14,878 kWh) that could not be stored due to the saturation of the battery bank.
On the other hand, the minimum SOC (30%) only existed 2.5% of the time, which limited the need to resort to the diesel generator to fill the energy deficit, hence the high share of renewable energies (98.72%).
Figure 10 presents the operating schedules, and the power flows of the optimized system components for three consecutive days (23, 24, and 25 June). Usually, between 7:00 a.m. and 3:00 p.m., the renewable electricity (PV power) exceeds the load demand so that the surplus energy is stored in the battery bank, increasing its state of charge (SOC). If the battery bank’s SOC reaches its maximum level (100%), the surplus RE power that can no longer be absorbed by the battery bank is dumped as was the case on 25 June. Approximately between 3:00 p.m. and 7:00 a.m., the RE power is no longer sufficient to meet the load demand, so the power stored in the battery bank is used to fill the deficit. Therefore, the battery bank’s SOC decreases and may reach its minimum level (30%), requiring the activation of the diesel generator. If the capacity of the latter is less than the energy gap, a loss of power supply (unmet load) occurs as was the case at the beginning of 23 June.
The sensitivity analysis result of the maximum loss of power supply probability (
LPSP*) is presented in
Figure 11. It shows that improving the system reliability by lowering
LPSP* from 1% to 0% would lead to 8.7% increase in COE, which could further make the energy produced unaffordable for people in rural areas of sub-Saharan Africa, a majority of whom are poor. On the other hand, degrading the system reliability by increasing
LPSP* from 1% to 2% would only decrease the COE by 2%, which is insignificant. Therefore, this result shows that the level of reliability initially adopted for the system (
LPSP of 1%) was adequate.
3.2. Techno-Economic and Emissions Analysis Results
Figure 12 presents the results of break-even analysis showing the TAC of the proposed autonomous system and grid extension for the electrification of the study area. It indicates a break-even grid extension distance of 16.2 km, which demonstrates that the designed HRES is more cost-effective than the grid extension given that the nearest power transformer from Fanisau is located 30 km away.
On the other hand, the simulation result of powering the village with only the diesel generator showed that this would require an annual O&M and fuel costs of 7077 and 77,574 USD/year, respectively. The calculation results, according to the methodology described in the previous section, of the net cash flow diagram and the corresponding cumulative cash flow of the hypothetical project of replacing the diesel generator by the autonomous system designed for the electrification of Fanisau village are presented in
Figure 13.
The calculated NPV and SPP of this hypothetical project, based on the obtained cash flows, were 572,382 USD and 2.8 years, which highlighted the economic viability of the project.
These techno-economic analysis results demonstrate that the proposed system was more cost-effective than the grid extension and the diesel generator for the electrification of the study area. This could lead decision-makers to give more consideration to HRESs for rural electrification in sub-Saharan Africa. Indeed, although almost all African governments claim to be aware of the role that renewables can play in addressing the challenges of rural electrification, investments in renewable energy technologies are still insignificant. Worst still, most countries have not even put in place adequate policies to attract private investors and boost the renewable energy sector [
46,
47].
Table 8 presents the calculated results of the emission reduction potential of the proposed system, for each GHG, compared to the grid and diesel generator for electricity supply to the study area. These results show that the proposed HRES would save 85,401.08 kg of carbon dioxide (CO
2) per year compared to the grid extension and 122,062.85 kg per year compared to the diesel generator. Therefore, the proposed hybrid system is environmentally friendly compared to the two traditional modes of rural electrification in sub-Saharan Africa.
These results clearly show the role that renewable energy technologies could play in the sustainable electricity supply in rural areas of sub-Saharan African countries. According to the Intergovernmental Panel on Climate Change (IPCC), sub-Saharan Africa is among the regions most vulnerable to climate change, due to various factors including limited adaptive capacity, undeveloped agricultural production systems and heavy dependency on ecosystem goods for livelihoods [
48].
The implementation of the research presented in this article will benefit the local population of Fanisau in three ways. Firstly, the supply of electricity will improve the quality of life of the community since electricity makes it possible to study in the late evening and at night, increases safety, and allows use of electrical appliances to facilitate routine work. Secondly, replacing traditional energy sources with electricity will reduce air pollution from biomass combustion as well as related health issues such as asthma, and therefore help create a healthier environment. Finally, electricity can help stimulate the local economy by promoting the development of small industries and businesses, thereby increasing employment opportunities and reducing poverty.
The main barriers to the development of hybrid renewable energy systems in sub-Saharan Africa include bureaucratic contracting and licensing processes, lack of public consciousness, incompetent technical know-how, and market design issues.
Compared to previous works, the originality of this study lies on three key points, namely: (1) the consideration of both reliability and renewable energy fraction constraints in modeling the optimal sizing problem; (2) the analysis of the effect of the reliability on the economic performance of the system; (3) the techno-economic and emissions analysis of the optimized system compared to conventional rural electrification modes.
However, further research may be needed to address the limitations of this study, including the lack of sensitivity analysis of solar radiation and wind speed on the architecture and total annual cost of the system. Such an analysis would have provided insight into the economic performance of the system analyzed across the SSA region and help estimate the level required for RE policies to improve the viability of the proposed system at any place of the region. Such a sensitivity analysis was carried out by Yimen et al. [
23] for a PV/wind/biogas/pumped-hydro system and the interpretation of the results allowed us to have an overview of the architecture and the economic performance of the system in different parts of the region. Secondly, the analysis performed in this article did not take into account the potential increase in demand for electricity over time due to population growth and technological development. Finally, the study failed to consider the use of biomass resources in the study area for electricity generation in the proposed HRES. Indeed, SSA is the region with the highest bioenergy potential [
49]. A study by Dasappa et al. [
50] estimated the potential of the region in electricity generation from biomass at 15,000 MW which could provide 100 TWh of electricity, about 15% of current energy production.
It should be noted that before the actual implementation of the proposed HRES project, it might not be realistic to find a 100.31 W diesel generator, since the typical smallest size of diesel generators is 1000 W. Thus, it might be necessary to run simulations without a diesel generator and with a 1000 W diesel generator to make the final decision whether or not to integrate the diesel generator into the system. In future work, more recent trends in optimization techniques may be applied in the optimization phase of the methodological framework proposed in this study. These classes of methods include hybrid heuristic optimization algorithms [
51,
52] and multiobjective evolutionary algorithms [
53,
54].

 ,
, 


