Abstract
Controlling ice nucleation during lyophilization of parenteral drug products increases the homogeneity of critical quality attributes, such as residual moisture, across drug product batches and shortens lyophilization cycle time. In the present study, we compare three mechanistically different techniques to control ice nucleation during the freezing step of lyophilization, which are referred to as “depressurization”, “partial vacuum”, and “ice fog” techniques. The techniques are compared with respect to their operational limitations and challenges. Installation considerations are also discussed. Using the aforementioned nucleation techniques, we investigated a monoclonal antibody formulation and an enzyme formulation at different protein concentrations using feasible nucleation temperatures and different vial formats and fill volumes. Samples were compared for solid state properties and other critical quality attributes on stability. When nucleated at the same temperature, the three techniques produced products with the same quality attributes and stability behavior. Under conditions resulting in micro-collapse, stability behavior can be different. We found that each technology had considerations for achieving robust nucleation. The present comparison may serve as guidance in selecting a nucleation method.
1. Introduction
Controlled ice nucleation during lyophilization has been shown to result in improvements to lyophilization cycle time, product consistency, and transfers from lab scale to production scale dryers [1]. When a standard freeze step is employed, the distribution of ice nucleation temperatures is wide. In contrast, controlling ice nucleation results in a much tighter distribution of nucleation temperatures with warmer average nucleation temperatures, and greater process consistency which does not change with scale [2]. Since nucleation temperature has been observed to directly impact critical quality attributes like residual moisture as well as important product attributes like cake surface area, which impacts primary drying time, it is desirable to better control nucleation temperature through the use of controlled ice nucleation [3,4,5].
While there are many potential methods for inducing controlled ice nucleation, most of the commercialized technologies rely on pressure changes or the introduction of an ice fog into the chamber. For instance, ControLyo TM (SP Scientific) [6] and SynchroFreeze (Hof) [7] rely on rapid “depressurization” and “partial vacuum”, respectively, to induce ice nucleation, whereas FreezeBooster® (Millrock Technology) [8], LyoCoN (Martin Christ) [9], and VERISEQ® (IMA Life/Linde) [10] rely on the introduction of an “ice fog” [11]. A comprehensive comparison of these technologies is not available, and few studies have been published with the purpose of evaluating the comparability of drug products nucleated with the different technologies. Gitter et al. previously reported that comparable product and process performance were attained with two mechanistically different technologies (“ice fog” and “depressurization”) [12]. Vollrath et al. generated products with similar solid state properties, but small differences in the residual moisture, comparing three “ice fog” techniques [5]. They further reported that the benefit of increasing nucleation temperature with regard to solid state properties might outweigh the higher risk of incomplete nucleation. In another study, Vollrath et al. reported that no difference was observed in a stability study comparing stochastically and controlled nucleation samples [4]. However, there are still open questions about the robustness of the various technologies to induce nucleation and whether they produce comparable lyophilized drug products when using mechanistically different techniques. In assessing whether comparable drug products can be produced, both solid state properties (such as residual moisture) and accelerated stability behavior should be considered.
To the best of our knowledge, this is the first study which investigates the comparability of three mechanistically orthogonal techniques for the induction of ice nucleation, which will be referred to as “depressurization”, “partial vacuum”, and “ice fog”. We tested the three techniques for nucleation robustness limitations and multiple product attributes. We challenged the techniques by lyophilizing different protein formulations of a monoclonal antibody (10–100 mg/mL) and an enzyme (2.5 mg/mL) at low and high total solid content in different vial configurations (2–50 cc vials). Samples were put on stability at intended storage temperature and at accelerated and stress conditions, and analyzed for physical and chemical stability by size exclusion and ion exchange chromatography. The samples were thoroughly characterized for their solid state properties, including visual appearance, cake structure (by cake embedding, scanning electron microscopy, micro-computational tomography), specific surface area, residual moisture content, and reconstitution time. We further compared the techniques with regard to their operational limitations and challenges, and with regard to installation considerations.
2. Materials and Methods
2.1. Materials Formulations
A monoclonal antibody (IgG1, MW ~145 kDa, pI 9.15, referred to as mAb1) and an enzyme (MW ~59 kDa, pI 7.16) were supplied by F. Hoffmann-La Roche/Genentech. The antibody was formulated at protein concentrations of 10 and 100 mg/mL with 240 mM sucrose in a 20 mM histidine hydrochloride buffer at pH 5.8. The 10 mg/mL and the 100 mg/mL formulation contained 0.004% (w/v) or 0.04% (w/v) polysorbate 20 (Croda, Snaith, UK). The enzyme was formulated at a protein concentration of 2.5 mg/mL with 500 mM arginine phosphate buffer at pH 7.3 and 0.01% (w/v) polysorbate 80 (Croda, Snaith, UK). All formulations were filtered with 0.22 µm polyethersulfone membrane filters (Corning, Corning, NY, USA) prior to filling to nominal fill volumes in vial configurations as summarized in Table 1. All vials were pharmaceutical Type 1 borosilicate glass tubing vials (Schott AG, Mainz, Germany). The 2 cc vials had 13 mm openings, while the 6 cc, 20 cc, and 50 cc vials had 20 mm openings. All vials were partially stoppered with lyophilization stoppers (Daikyo Seiko, Tochigi Prefecture, Japan). The vials were arranged in hexagonal packs in the lyophilizer.

Table 1.
Overview of sample preparation. Samples were manufactured with each nucleation technique, i.e., “depressurization” method, “partial” vacuum method, and “ice fog” method.
2.2. Lyophilization
Samples were loaded into the lyophilizer at 20 °C and frozen with freeze protocols specific to each controlled ice nucleation technology. Successful nucleation was verified visually in pre-experiments, through the lyophilizer’s door, and by temperature sensors attached to the outside of the vial. Each experimental condition as a combination of vial size/fill volume and formulation, as summarized in Table 1, was nucleated at the warmest temperature that resulted in the nucleation of all vials (dependent on nucleation technique). Nucleation of each condition was attempted with the vials equilibrated at −5 °C shelf temperature. If not all vials nucleated, then nucleation was attempted at −10 °C or −15 °C shelf temperature. After the nucleation event, vials were held at the nucleation temperature for one hour and the shelf temperature was ramped to −35 °C (mAb1) or −50 °C (enzyme) at 0.3 °C/min. Vials were equilibrated at the final freeze temperature for at least 3 h to ensure complete freezing of the samples. While each technology has different initial conditioning steps, the equilibration prior to nucleation, post-nucleation hold, final freeze ramp rate, and final freeze hold steps were the same.
For mAb1, primary drying was performed at −10 °C (ramp rate 0.2 °C/min, pressure 133 µbar). Pressure was controlled with a Capacitance Manometer (CM) sensor and primary drying was applied until the Pirani signal was equal to the CM signal. Secondary drying was performed at 25 °C (ramp rate 0.2 °C/min, 100 133 µbar) for 8 h. Samples were stoppered under nitrogen and partial vacuum (760 mbar), and sealed with aluminum crimp-caps before characterization and storage at 5 °C for a maximum of 2 years, 25 °C/60% RH for at least 6 months, or 40 °C/75% RH for at least 3 months.
Control experiments were performed for the mAb1 formulation at 10 and 100 mg/mL in the 20 cc configurations under stochastic nucleation conditions. Samples were equilibrated at 5 °C for 1 h before ramping the shelf temperature to −35 °C at 0.3 °C/min. The samples were then dried with the same primary and secondary drying conditions as detailed above. Stochastically nucleated samples were additionally spiked at 100 mg/mL mAb1 to moisture levels of 1–4% after lyophilization and put on stability to match corresponding controlled nucleation samples. An overview of the prepared samples and controls is provided in Table 1.
For the enzyme in 6 cc and 20 cc vials, primary drying was performed at −10 °C (ramp rate 0.2 °C/min, pressure 133 µbar). Pressure was controlled with a CM sensor and primary drying was applied until the Pirani signal was equal to the CM signal. Secondary drying was performed at 42 °C (ramp rate 0.2 °C/min, 133 µbar) for 8 h. Samples were stoppered under nitrogen and partial vacuum (760 mbar), and sealed with aluminum crimp-caps before characterization and storage at 5 °C, 25 °C/60% RH, or 40 °C/75% RH for 3 months.
For the enzyme in 50 cc vials, primary drying was performed at 19 °C (ramp rate 0.2 °C/min, pressure 200 µbar). Pressure was controlled with a CM sensor and primary drying was applied until the Pirani signal was equal to the CM signal. Secondary drying was performed at 42 °C (ramp rate 0.15 °C/min, 200 µbar) for 16.5 h. Samples were stoppered under nitrogen and vacuum (200 µbar), and sealed with aluminum crimp-caps before characterization and storage at 30 °C/65% RH, 45 °C/75% RH or 60 °C for at least 3 months. For the “ice fog” method, additional samples were manufactured at a nucleation temperature of −15 °C. Samples nucleated at −15 °C for both “partial vacuum” and “ice fog” techniques were dried in addition at conservative, lower primary drying conditions of −10 °C and 133 µbar (Table 1).
2.2.1. Depressurization Method
Vials were loaded into a Lyostar 3 lyophilizer (SP Scientific, Warminster, PA, USA) and equilibrated at 5 °C. The chamber was pressurized with nitrogen to 1.50 bar and depressurized to 1.15 bar twice, and then pressurized to 2.98 bar. The shelf temperature was ramped to the target nucleation temperature at 1 °C/min and the vials were equilibrated for 3 h. The chamber was then rapidly depressurized to 1.15 bar to induce ice nucleation. The remainder of the freeze step was performed as described above.
2.2.2. Partial Vacuum Method
Vials were loaded on a TR01 Lyophilizer (Hof Sonderanlagenbau GmbH, Lohra, Germany) using the LyoCom III software (Hof Sonderanlagenbau GmbH, Lohra, Germany). Samples were equilibrated at 20 °C for 1 h before degassing the samples for 30 min at 35 mbar. The shelf temperature was ramped to the target nucleation temperature at 1 °C/min and vials were equilibrated for 3 h. Nucleation was induced by decreasing the chamber pressure to 1.35 mbar within 20 min, and was regulated by a capacitive manometer MKS1000 (631A 13MMEH, MKS Instruments Inc., Andover, MA, USA). The pressure was subsequently raised to 100 mbar and the isolation valve was closed afterwards. The remainder of the freeze step was performed as described above. The chamber pressure during primary drying was regulated by a capacitive manometer MKS10 (631A 11MDEH, MKS Instruments Inc., Andover, MA, USA).
2.2.3. Ice Fog Method
Vials were loaded into a LyoMax 2 Lyophilizer (IMA Life, Tonawanda, NY, USA) with an attached non-aseptic VERISEQ Ice Fog Generator (Linde, Dublin, Ireland) and equilibrated at 5 °C. The shelf temperature was ramped to the target nucleation temperature at 1 °C/min and the vials were equilibrated for 3 h. The chamber pressure was decreased to 221 mbar and ice fog was injected until the chamber pressure was 414 mbar to chill the lines. Afterwards, the chamber pressure was decreased to 207 mbar and ice fog was injected until the chamber pressure was 951 mbar to induce nucleation. During nucleation, the liquid nitrogen source pressure was maintained at 7.91–8.60 bar, the water column temperature was at least 88 °C, and the gas flow rate target was 70 SCFH. The remainder of the freeze step was performed as described above.
2.3. Solid State Characterization
2.3.1. Specific Surface Area
Specific surface area was determined on a Quantachrome Quadrasorb Evo Automated Surface Area and Pore Size Analyzer (Boynton Beach, Florida, USA). Samples were crushed in a glove box with a relative humidity <3% and loaded into tared bulbs. A sample size of approximately 100 mg was used. Desorption of residual water was performed at 40 °C and hard vacuumed for at least 3 h. Multipoint Brunauer–Emmett–Teller analysis was performed with relative pressures P/PO of 0.05 to 0.24 using Krypton as the adsorbate. Specific surface area was reported as mean with standard deviation of 4 samples.
2.3.2. Residual Moisture Content (by Volumetric Karl Fischer)
Moisture measurement of the enzyme samples was performed with a Mettler Toledo DL31 Volumetric Karl Fischer Titrator (Columbus, OH, USA) on a Mitsubishi, Model RV-2AJ-511, TIX Robotic Titration System (Tokyo, Japan). Samples were crushed in a glove box with a relative humidity <3% and loaded into tared tubes. A sample size of approximately 100 mg was used. Tubes were automatically loaded and titrated with Hydranol. Standards were run at the start of analysis, every four samples, and at the end of analysis. The titrator was washed with methanol between samples. Residual moisture was reported as the mean value with standard deviations of duplicates in percent of the total weight of the lyophilized sample.
2.3.3. Residual Moisture Content (by Coulometric Karl Fischer)
Moisture measurement of the antibody samples was performed with a C30 Coulometric Karl Fischer titrator (Mettler Toledo, Greifensee, Switzerland). Anhydrous methanol was injected into the sample up to the approximate filling volume for reconstitution. The sample was homogenized by vortex and put on a shaker up to 3 h to dissolve before Karl Fischer titration. The supernatant was injected into the titrator for analysis. Empty vials were washed with water and ethanol and dried at 40 °C overnight. Residual moisture was reported as the mean value with standard deviations of duplicates in percent of the total weight of the lyophilized sample.
2.3.4. Reconstitution Time
The reconstitution time was determined with a stopwatch. For the antibody samples, diluent was added in a quantity sufficient to result in a final reconstituted volume equal to the fill volume. For the enzyme samples, diluent was added in a quantity sufficient to result in a final reconstituted volume 2.5 times greater than the fill volume. Time measurement started after the diluent had been completely added. Samples were swirled for 5 s immediately after addition of diluent and then swirled for 5 s every 20 s until all solids had dissolved. The reconstitution time was reported as the mean with standard deviation for triplicates.
2.3.5. Visual Inspection
Samples were visually inspected against a black and white background in a light box after lyophilization and their appearance described, including differentiation of pharmaceutically elegant cakes or cake defects such as cracks, collapse, and shrinkage.
2.3.6. Cake Imaging by Cake Embedding and Microcomputed Tomography (µCT)
Samples were prepared and imaged by PDMS embedding as described previously by Lam and Patapoff [13] for visualization of the internal cake morphology. Internal cake structure was further visualized by invasive µCT using a SkyScan 1272 X-ray microtomograph (Bruker MicroCT, Kontich, Belgium), as previously described by Haeuser et al. [14].
2.4. Protein stability
2.4.1. Size Exclusion Chromatography (mAb)
Size exclusion chromatography for the antibody was performed on an Alliance 2695 HPLC instrument (Waters Corporation, Milford, MA, USA) with UV/Vis detection at 280 nm using a Tosoh Biosciences TSK G3000SWXL 7.8 mm ID × 30 cm L column (Tosoh Bioscience GmbH, Griesheim, Germany) at 20–25 °C. The mobile phase of 0.1 M potassium phosphate, pH 6.8 ± 0.1 was maintained at a flow rate of 0.5 mL/min. Samples were diluted to 10 mg/mL and maintained at 5 °C prior to injection of 20 µL. Peak areas were integrated with respect to the baseline with Empower 3 software (Waters Corporation, Milford, MA, USA), and high molecular weight species (HMWs), low molecular species (LMWs), and monomer content were reported as percent of the total peak area.
2.4.2. Size Exclusion Chromatography (Enzyme)
Size exclusion chromatography for the enzyme was performed with a Hewlett-Packard Agilent, 1200 HPLC with UV detection at 280 nm. Separation was performed using a Tosoh Haas TSK G3000SWXL 7.8 mm ID × 30 cm L (Tosoh Bioscience, Griesheim, Germany) column at 24 °C ± 2 °C. The mobile phase of 10% isopropanol, 0.2M L-Arginine, 0.12M ammonium sulfate, pH 7.3 ± 0.1 was maintained at a flow rate of 0.5 or 1.0 mL/min. 50 µL of 1 mg/mL sample was injected. Peak areas were integrated with respect to the baseline with Chromeleon software (Thermo Scientific, Waltham, MA, USA) and monomer content was reported as percent of the total peak area.
2.4.3. Ion Exchange Chromatography (mAb)
Ion exchange chromatography for the antibody was performed on a Waters HPLC System Alliance 2695 using a Waters 2487 UV/Vis Detector (Waters Corporation, Milford, MA, USA) at a wavelength of 214 nm. Separation occurred on a Dionex ProPac WCX-10 BioLCTM 4 × 250 mm (Thermo Fischer Scientific Inc., Sunnyvale, CA, USA) Analytical column at 20–25 °C. The antibody was digested by dilution to a concentration of 1 mg/mL before incubation with 1% (v/v) of 1 mg/mL carboxypeptidase B for 20 min at 37 °C. Samples were maintained at 5 °C prior to injection of a 50 μL sample. Buffer A was prepared as 10 mM sodium phosphate, pH 7.5 ± 0.1 and Buffer B was prepared as 100 mM sodium chloride, 10 mM sodium phosphate, pH 7.5 ± 0.1. Separation occurred at a gradient elution between Buffer A and B while maintaining a constant flow rate of 0.8 mL/min. Peak areas were integrated with respect to the baseline with Empower 3 software (Waters Corporation, Milford, MA, USA) and the presence of iso-Aspartate (amino acid 102) was reported as percent of the total peak area.
2.5. Statistical Analyses
Individual lyophilization cycles have been performed per formulation, vial/fill volume configuration, and process condition as summarized in Table 1 and Table 2. Process conditions have been tested in pre-tests for reproducibility. Sample variation for individual lyophilization cycles has been assessed by solid state properties in replicates as described for the individual method.
Table 2.
Nucleation temperatures. STN = stochastically nucleated (failed to nucleate), n.p. = not performed.
3. Results
We compared three different ice nucleation techniques referred to as the “depressurization”, “partial vacuum”, and “ice fog” techniques. The objective was to identify the nucleation conditions required for robust nucleation with each technology and to determine whether the three technologies produce comparable drug product when using similar freezing protocols and lyophilization conditions. To this end, we lyophilized combinations of various protein formulations, vial formats, and fill volumes, as summarized in Table 1, to cover common vial/fill volume configurations. Formulations were chosen on the basis of being “hard to lyophilize”, either due to low Tg’ or high total solids. These formulations include a monoclonal antibody (mAb1) formulation with low protein and high sucrose content (10 mg/mL protein, 9% total solids), a monoclonal antibody (mAb1) formulation with high protein and high sucrose content (100 mg/mL protein, 18% total solids), and an enzyme formulation with low protein and high arginine content (2.5 mg/mL protein, 11% total solids).
3.1. Nucleation Temperatures
The three nucleation techniques use different conditioning steps before inducing the nucleation event, but all use the same equilibration step at a defined nucleation temperature before nucleation. Each formulation and vial format was nucleated at the warmest nucleation temperature feasible, in order to obtain the lowest degree of super cooling and thus largest ice crystal growth (Table 2a). Nucleation temperatures for samples used in this study are summarized in Table 2b. Under certain conditions, particular technologies required colder nucleation temperatures to achieve robust nucleation. For example, the “depressurization” technique required colder nucleation temperatures to robustly nucleate smaller vials regardless of formulation, and could not achieve robust nucleation in 2 cc vials even at −15 °C. In contrast, the “partial vacuum” technique required colder temperatures to robustly nucleate the 100 mg/mL mAb1 formulation, regardless of vial size.
3.2. mAb1 at 10 mg/mL
Solid state properties like specific surface area (SSA), residual moisture, reconstitution time, and cake appearance were analyzed for the different formulations and configurations as presented in Figure 1. All 10 mg/mL mAb1 conditions (except for the 2 cc vials produced by the “depressurization” method) were nucleated at −5 °C and were found to have comparable SSA and residual moisture, regardless of technology (Figure 1a). The 2 cc vials could not be nucleated with the “depressurization” method and so were stochastically nucleated. They had higher SSA and lower residual moisture than the controlled nucleation samples. For the 20 cc configuration, one set of samples was produced with stochastic nucleation as a control. These 20 cc samples also showed higher SSA and lower residual moisture than the controlled nucleation samples. These observations are in line with results previously reported in the literature [12]. Reconstitution time was found to be fastest for stochastically nucleated samples, followed by samples produced by the “ice fog” technique, and were found to be longest for the “partial vacuum” and “depressurization” techniques.
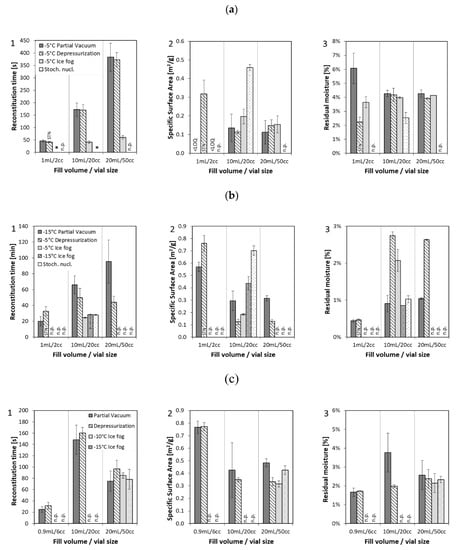
Figure 1.
Solid state properties: (1) specific surface area, (2) residual moisture, and (3) reconstitution time of formulation 1–3 (a) mAb1 at 10 mg/mL, (b) mAb1 at 100 mg/mL, (c) enzyme at 2.5 mg/mL, lyophilized in different formats with three different nucleation techniques compared to stochastically nucleated samples. Nucleation temperatures are indicated in the legend of the graphs. * Immediate dissolution, n.p. = not performed, LOQ = limit of quantification, STN = stochastically nucleated.
Cake appearance by visual inspection matched trends of SSA and residual moisture, and similar cake appearance was obtained between the samples from the three technologies as shown in Table 3. Controlled nucleation samples all had small layers at the top and bottom of the cake. Stochastically nucleated samples comparatively showed so-called “dents”, which is typical for sucrose formulations under normal freeze drying cycles [14,15].
Table 3.
Cake appearance by visual inspection. Representative pictures for the three formulations lyophilized in 20 cc vials using the three different nucleation techniques compared to stochastically nucleated samples. Nucleation temperatures are indicated above the pictures.
Samples lyophilized in 20 cc vials with the “partial vacuum” and the “depressurization” technique were put on stability at 5 °C (12/24 months), 25 °C (6 months), and 40 °C (6/12 months). We analyzed samples for their aggregation propensity by SEC and for their chemical degradation by IEC. No significant differences in degradation rates were found for the samples, neither for losses in monomer content (SEC) nor in changes in iso-Aspartate formation (IEC). The data is summarized in Table A1 in the Appendix A.
3.3. mAb1 at 100 mg/mL
Samples of the 100 mg/mL mAb1 formulation were nucleated at temperatures of −5 °C (“depressurization”, “ice fog”) or −15 °C (“partial vacuum”). For the 20 cc configuration, two sets of control samples were included: the first set was nucleated at −15 °C with the “ice fog” technique and the second set was produced with stochastic nucleation. We observed similar SSA when nucleated at the same temperature (either at −5 °C or −15 °C), different SSA when not nucleated at the same temperature (−5 °C versus −15 °C), and highest SSA for stochastically nucleated samples (Figure 1(b2)). Residual moisture levels were similar, with the stochastically nucleated samples having the lowest moisture (Figure 1(b3)). Reconstitution time followed a similar trend as for the 10 mg/mL mAb1 formulation with fastest time for stochastically nucleated samples (20 cc) and samples prepared with the “ice fog” technique, independent of the nucleation temperature, next fastest for the “depressurization” technique, and slowest for the “partial vacuum” method (Figure 1(b1)). Visual appearance (Table 3) was similar when nucleated at the same temperature (“ice fog” −15 °C not shown) with a visually dense structure for the samples nucleated at −15 °C. For the stochastically nucleated samples, the structure looked similar to the −15 °C samples, but also exhibited denting as did the 10 mg/mL formulation. To further study internal cake appearance, we characterized mAb1 samples at 100 mg/mL lyophilized in the 20 cc configuration in detail by µCT (Table 4). A homogeneous dense structure was confirmed for the stochastically nucleated samples and those nucleated at −15 °C via horizontal and vertical cross sections. For the “ice fog” and “depressurization” techniques, we observed a large crystal-like pattern in the middle of the lyophilized cakes—of different morphology between the two techniques.
Table 4.
Detailed characterization of cake structure by µCT for mAb1 at 100 mg/mL lyophilized in 20 cc vials. The nucleation temperatures are indicated per method. (a) Horizontal cross section from the middle of the cake. (b) Vertical cross section of the complete cake. Red lines indicate the position of the horizontal cross section from the entire cake.
Samples in the 20 cc configurations were put on stability at 5, 25, and 40 °C for different time periods. The losses in monomer are shown in Figure 2a for storage at 40 °C for up to 3 months. Table A1 in the Appendix A further summarizes the monomer content for all temperatures and time points studied up to a maximum of 2 years. Figure 2(a1) shows that the loss in monomer over storage time for the samples nucleated at −5 °C (“depressurization” and “ice fog”) was less than for the samples nucleated at −15 °C (“partial vacuum”, and the “ice fog” control samples). These data were compared to stability data obtained from stochastically nucleated samples (Figure 2(a2)), which had their residual moisture levels adjusted to between 1 and 4%.
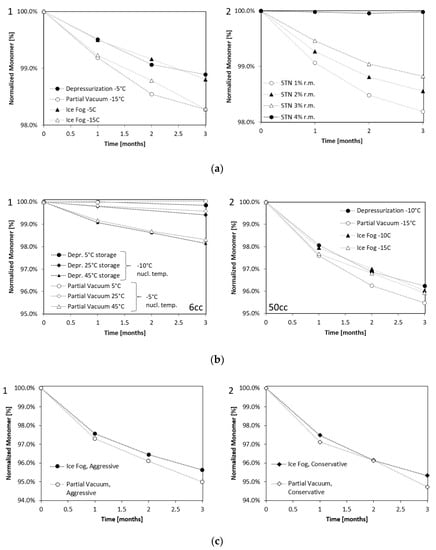
Figure 2.
Loss of Monomer analyzed by SEC. (a1) mAb1 at 100 mg/mL after 3 months’ storage at 40 °C lyophilized in 20 cc vials with three different techniques compared to (a2) stochastically nucleated samples (STN) with defined residual moisture level (r.m.). (b1) Enzyme at 2.5 mg/mL after storage at 5 °C, 25 °C, and 45 °C for three months lyophilized in 6 ccvials, or (b2) lyophilized in 50 cc vials and stored at 60 °C for 3 months. (c) Enzyme at 2.5 mg/mL (nucleation temperature −15 °C) after storage at 60 °C for three months lyophilized in 50 cc vials with “partial vacuum” and “ice fog” technique for conservative (c1) and aggressive (c2) lyophilization conditions. Nucleation temperatures and techniques are indicated in the legend.
The controlled nucleation samples nucleated at −5 °C had residual moisture levels of approximately 3% and the samples nucleated at −15 °C had residual moisture levels of approximately 1%. The stability behavior of these controlled nucleation samples was equivalent to that of the stochastically nucleated samples with matching residual moisture, revealing residual moisture to be the most important stability-impacting solid state property for this formulation. We did not find significant differences between the controlled nucleation sample degradation rate by IEC, nor greater iso-Aspartate formation for the stochastically nucleated samples independent of the residual moisture. For details on IEC data, please refer to Table A1b in the Appendix A.
3.4. Enzyme at 2.5 mg/mL
For the enzyme formulation, the same nucleation temperature was achieved by each technology in the 20 cc configuration. For the 6 cc configuration, the “depressurization” method required a 5 °C lower nucleation temperature than the “partial vacuum” method, and for the 50 cc configuration, the “partial vacuum” method required a 5 °C lower nucleation temperature than the “depressurization” method (Table 2b). No significant difference in solid state properties was observed for the three different nucleation techniques with 6 cc and 20 cc vials. Significant differences in specific surface area were observed for 50 cc vials depending on nucleation temperature, with warmer nucleation temperatures corresponding to lower specific surface area. Visual appearance was similar among all of the nucleation technologies, even when there were differences of up to 5 °C in nucleation temperature, as seen in Table 3. Horizontal denting around the middle of the cakes was observed for all 50 cc vials and is likely due to the common aggressive lyophilization parameters for the configuration.
Further characterization of the cake structures by PDMS embedding revealed differences in the micro-structure of the samples (Table 5a). Using µCT, we detected regions of higher density for the “partial vacuum” samples, indicating more extensive micro-collapse (data not shown). To further evaluate the potential effects of micro-collapse, additional samples were generated for the 50 cc format using the “ice fog” and the “partial vacuum” methods at the same nucleation temperature −15 °C, and dried with both conservative and aggressive primary drying conditions. As expected, the samples that were dried aggressively had lower specific surface area and higher residual moisture than the samples dried conservatively (Appendix B, Figure A1), indicating the presence of more extensive micro-collapse. There was no statistically significant difference between the two nucleation methods for specific surface area or residual moisture. A difference between the two nucleation methods for reconstitution time was a result of samples being stoppered at different pressures (Figure A1). Detailed characterization of cake structure by µCT did not reveal major differences in cake density between the two nucleation methods. However, pronounced heterogeneous morphology was observed across the vial particularly for the aggressive conditions (Table 5b).
Table 5.
Characterization of internal cake structure for enzyme at 2.5 mg/mL lyophilized in 50 cc vials depending on nucleation technique by (a) PDMS cake embedding and (b) µCT. (a) Samples from initial lyophilization cycle compared to stochastically nucleated sample. (b) Samples obtained by aggressive and conservative lyophilization conditions. The nucleation temperatures are indicated per method.
Samples were put on stability for 3 months at 5 °C, 25 °C, 45 °C (6 cc) and 30 °C, 45 °C, 60 °C (50 cc). Figure 2b shows loss of monomer over time. The degradation rate of samples in the 6 cc format were similar (Figure 2(b1)). However, in the 50 cc format, samples produced with the “partial vacuum” method at a nucleation temperature of −15 °C degraded faster than samples produced with the other methods (nucleation temperature −10 °C or −15 °C) even though no differences in solid state properties other than µCT were observed (Figure 2(b2)). For the experiment with the 50 cc format dried either aggressively or conservatively, more degradation was once again observed for the “partial vacuum” method than with the “ice fog” method, particularly when dried aggressively (Figure 2c). For the time being, it is unclear why 50 ccvials produced using the “partial vacuum” method were observed to degrade faster than vials produced with the other nucleation methods. The differences in degradation rate are not explained by solid state properties like specific surface area or residual moisture, nor are they explained by different cake morphology (cake density) as observed with µCT. The only observed difference was the heterogeneous morphology, which was different between the samples for the aggressive conditions.
4. Discussion
4.1. Comparability of Product Attributes
While different pre-conditioning techniques are used for each technology before controlled induction of ice nucleation, we demonstrate that the most important parameter for ensuring comparability of solid state attributes and stability was nucleation temperature. When the nucleation temperature was the same, the solid state properties and stability were comparable regardless of technology with two exceptions: one condition had different reconstitution time and one condition had different stability, discussed below. Our results are generally in line with Gitter et al.’s results using “depressurization” and “ice fog”, where they concluded that the thermal history is crucial for achieving a comparable drug product, rather than the applied mechanism [12].
The specific surface area of cakes depended directly on nucleation temperature. The specific surface area was higher when samples were nucleated at colder nucleation temperatures. As expected, cakes produced by stochastic nucleation (colder nucleation temperatures) had higher specific surface area than those produced with controlled ice nucleation. Additionally, when cakes were produced at the same nucleation temperature or five degrees apart, the specific surface area was similar, regardless of the technology. Only when the nucleation temperature differed by ten degrees did we observe significant differences in specific surface.
Residual moisture content was inversely related to the specific surface area. Higher residual moisture was observed for samples nucleated at warmer temperatures. As expected, the residual moisture content of controlled nucleation cakes (using warmer nucleation temperatures) was higher than stochastically nucleated cakes. These results are in line with observations previously published [1,5,12,16,17].
Reconstitution time was generally similar between the “partial vacuum” and “depressurization” technologies. However, with the “ice fog” technology the 10 mg/mL and 100 mg/mL mAb1 samples reconstituted quicker than the samples from the other two technologies. These “ice fog” samples reconstituted at the same rate as the stochastically nucleated samples. These results differ from previous studies which suggest that controlled ice nucleation can improve reconstitution time for highly concentrated protein formulations compared to stochastically nucleated samples [18]. It is unclear why we did not observe controlled ice nucleation to improve reconstitution time compared to stochastically nucleated samples. Differences might be attributed to local differences in cake structure, which were observed depending on the technique applied, as displayed in Table 4 and Table 5. However, this requires further investigation.
The macroscopic structure of the cakes as determined by visual inspection from the outside of the vial was similar for each technology when nucleated at the same temperature. In general, controlling ice nucleation improved cake appearance, and the amount of hexagonal denting at the base of the cakes decreased with warmer nucleation temperatures. This suggests improved intra-vial homogeneity as previously reported by Oddone et al., who studied the impact of vacuum induced surface freezing on intra- and inter-vial homogeneity [19,20]. However, some inhomogeneity was still present in particular when the inner cake structure was studied. All of the controlled ice nucleation cakes had a thin layer of high-density material at the top surface of the cake, which we hypothesize forms during the nucleation event. Furthermore, we cannot confirm improvement of intra-vial homogeneity from the inner cake perspective based on analysis by imaging techniques such as µCT, with the exact pore morphology being unique to each cake.
With regard to product stability, we demonstrate that protein stability was generally comparable between the three technologies and compared to stochastically nucleated samples with the mentioned exception. The stability of the 10 mg/mL and 100 mg/mL mAb1 cakes was the same for all technologies when nucleated at the same temperature or even temperatures differing by 5 degrees. The stability of the 100 mg/mL mAb1 formulation depended entirely on the residual moisture content. These findings are in line with recent literature. Vollrath et al. investigated two monoclonal antibody formulations at low (1 mg/mL) and high (70–100 mg/mL) protein content by application of an “ice fog” technique as proposed by Geidobler et al. [21] using the same nucleation temperatures [4]. Although solid-state properties differed slightly, they concluded that controlled ice nucleation had neither a positive nor negative impact on protein stability compared to stochastically nucleated samples. Oddone et al. reported no difference in stability of stochastic versus controlled nucleation vials by the “partial vacuum” method investigated for different formulations of human growth hormone [22]. The current study focused on investigating and comparing the impact of three mechanistically different nucleation techniques on protein stability and included challenging protein configurations. The stability of the enzyme in the 50 cc vial behaved somewhat differently and was only similar for the “depressurization” and “ice fog” technologies. Samples produced by the “partial vacuum” technology degraded faster, even when nucleated at the same temperature, and had similar specific surface area and residual moisture content. In addition, the “partial vacuum” samples did not show any obvious macroscopic cake structure differences. This is currently not understood and is an important topic for future studies.
4.2. Nucleation Robustness
As discussed above, we demonstrate that the nucleation temperature can impact solid state properties, including residual moisture and specific surface area. These parameters can in turn impact stability behavior. This means that it is highly desirable that each nucleation technology be capable of robustly nucleating all product vials at the same temperature to ensure both comparable solid state and stability properties.
The nucleation robustness of each technology depends on different factors, and partly on the specific technology. For the “depressurization” technology it has previously been demonstrated that process robustness increases with greater pressure drop, faster pressure drop, colder equilibration temperatures prior to “depressurization”, and the use of argon instead of nitrogen to pressurize the chamber [2]. In this study, nucleation robustness was observed to increase with vial size, with the 2 cc vials entirely failing to nucleate. There are several possible explanations for this behavior. The first is that the small vial opening of the 2 cc vials impacts the rate of pressure drop within the vial and therefore prevents nucleation. However, 6 cc vials have the same opening as the larger vials and yet still required a colder nucleation temperature than larger vials. This implies that vial opening size was not the only factor in the difference in nucleation behavior. A second possible explanation is that nucleation robustness may be related to the liquid surface area, which increases with vial size. Since ice nucleation is fundamentally a stochastic process, the odds of forming an ice crystal that exceeds the critical radius scales with the liquid surface area. At the edge of failure, we showed that increasing the liquid surface area (as when increasing vial size from 2 cc to 6 cc or from 6 cc to 50 cc) significantly increases nucleation robustness. Thus, our results suggest that the liquid surface area may be responsible for the dependence of nucleation robustness on vial size with the “depressurization” method.
For the “partial vacuum” technology, nucleation robustness was observed to decrease with total solids in the formulation and vial size [23]. It is theorized that evaporation from the liquid surface is responsible for inducing ice nucleation and that only the upper part of the solution nucleates [23,24]. The dependence on total solids may be explained by Raoult’s law, which suggests that the vapor pressure decreases as the total solids content of the formulation increases (meaning the mole fraction of the water decreases), resulting in slower evaporation, less cooling, and therefore lower nucleation robustness. It is very interesting that a similar dependence on total solids was not observed with the “depressurization” technology, given that it is also theorized to rely on evaporation-driven cooling to induce nucleation. However, a key difference between the two technologies is that the “depressurization” technology’s evaporation phase is currently theorized to occur over a few seconds, whereas the “partial vacuum” technology’s evaporation phase occurs over tens of seconds. It is possible that the different dynamics of each technology explain the differing dependence of nucleation robustness on total solids content. Specifically, it is possible that the “depressurization” technology removes a smaller amount of energy quickly from a smaller volume, while the “partial vacuum” technology removes more energy, but more slowly from a larger volume.
We observed robust nucleation for the “ice fog” technology for all of the tested conditions. Since the technology relies on adequate distribution of the ice fog throughout the chamber, nucleation robustness may be sensitive to the nucleation protocol and the lyophilizer itself, which was not evaluated in this study. All samples were nucleated and lyophilized in the same chamber.
In summary, nucleation robustness limitations related to formulation and vial size were identified for two of the three technologies. If a nucleation process may be run at the edge of failure, the impact of these factors should be evaluated in addition to nucleation protocol parameters to avoid unanticipated nucleation challenges. Further, if a lyophilization cycle is to be run at parameters which would be acceptable for a controlled nucleation vial but may cause micro-collapse in a stochastically nucleated vial due to differing cake resistance, it is essential to ensure nucleation robustness in order to guarantee batch homogeneity, control of critical quality attributes, and process performance. While a warmer nucleation temperature results in shorter primary drying time when paired with optimized primary drying parameters, it can also mean a loss of nucleation robustness if set too warm. Therefore, the nucleation temperature should be selected carefully.
4.3. Operational and Installation Considerations
The current data emphasize that the nucleation robustness of the “depressurization” and the “ice fog” techniques was not observed to be formulation-dependent even when tested under challenging conditions. This implies that generic process parameters may be used independent of formulation parameters such as solids content. However, nucleation robustness was found to depend on vial format for the “depressurization” technique, which implies that initial process parameters may need to be developed and optimized per vial configuration to ensure nucleation robustness. There were no observed vial configuration limitations for the “ice fog” technique, which facilitates scale-up activities significantly. For the “partial vacuum” method, we observed both formulation and vial format limitations, and nucleation robustness was more challenging for formulations with higher solids content and larger vial sizes.
Gitter et al. suggested that process transfer from one to the other controlled nucleation technique should be achievable without major challenges based on investigations of “ice fog” and “depressurization” technologies [12]. Vollrath et al. discussed the low risk of changing product properties when using the “depressurization” and “ice fog” technologies [5]. We also conclude from our experiments that the “depressurization” and “ice fog” techniques may be interchangeable in terms of product attributes when using the same nucleation temperature, and can be transferred from one to the other, facilitating scale-up and transfer activities.
Besides operational considerations, installation requirements are different and important for scale-up activities. While the “partial vacuum” method needs automation changes and particular pressure gauges, the “ice fog” technique requires automation changes, a liquid nitrogen source, and especially ports in locations that facilitate effective distribution of the fog throughout the chamber. The “depressurization” technique requires automation changes, available ports of certain size to allow for rapid depressurization, an exhaust manifold, a supply of nucleation gas, and may also require filter banks for the exhaust gas. Moreover, the lyophilization chamber needs to be able to withstand pressurization to relevant pressures (i.e., greater than 2.39 bar). A lyophilizer in a commercial setting, which can be steamed in place, can achieve relevant pressures, but potentially not as high as a lab-scale lyophilizer. Another aspect to consider during development is the temperature distribution of the shelves, which may be potentially higher in large scale lyophilizers. As each technology has specific installation requirements, the capabilities of the facility should be considered prior to selection of any particular technology.
5. Conclusions
Ensuring nucleation robustness is crucial to benefit from the advantages of controlling ice nucleation, such as improved process performance and batch homogeneity. A balance must be struck between ensuring robust nucleation and achieving warm nucleation temperatures to produce product with smaller specific surface area and shorter primary drying time. Nucleation robustness limitations associated with formulation or vial format were identified for two of the three technologies: the “partial vacuum” and “depressurization” methods, whereas there were no formulation or vial format limitations identified for the “ice fog” technique, which facilitates scale-up activities. We highlight that each of the technologies requires different levels of process development and installation considerations.
We conclude that while the pre-conditioning steps for each evaluated controlled ice nucleation technology are different, the most important factor for ensuring comparable solid state properties and stressed stability behavior was the nucleation temperature. A comparable drug product was successfully produced with multiple formulations and vials using an “ice fog”, “depressurization”, and “partial vacuum” controlled ice nucleation technology. The exception was a challenging enzyme formulation at a low protein concentration produced with the “partial vacuum” technology. Samples showed similar solid state properties compared to controls, but different stability behavior, which needs further investigation.
Author Contributions
Conceptualization, data curation, visualization, writing—original draft preparation, supervision, J.L. and A.A.; methodology, formal analysis, J.L. and E.I.; resources, project administration, A.A.; writing—review and editing, J.L., E.I., C.L.M. and A.A. All authors have read and agreed to the published version of the manuscript.
Funding
This research received no external funding.
Acknowledgments
The authors would like to acknowledge Rebekka Rippe, Raphael Mietzner, and Yuen Li Butt (Pharmaceutical Development EU, F. Hoffmann-La Roche) for their help with the “partial vacuum” lyophilization runs, and Jasmin John (Pharmaceutical Development EU, F. Hoffmann-La Roche), Wilson Cheng, and Harshavardan Gurrala (Pharmaceutical Development US, Genentech/Roche) for support in analytical testing. The authors further thank Eva Roedel and Michael Goellner for supporting µCT measurements (Solid State Sciences, F. Hoffmann-La Roche) and acknowledge Fred Lim and Lokesh Kumar (Pharmaceutical Development US, Genentech/Roche), as well as Joerg Luemkemann and Pierre Goldbach (Pharmaceutical Development EU, F. Hoffmann-La Roche), for their support and helpful discussions within this project. Thank you also goes to Gerhard Schilder from Hof Sonderanlagen for information on the “partial vacuum”/SynchroFreeze technology.
Conflicts of Interest
The authors declare no conflict of interest.
Appendix A
Table A1.
Stability of mAb1 at a protein concentration of (a) 10 mg/mL or (b) 100 mg/mL in the 20 cc configuration. (A) Monomer analyzed by SEC. (B) Iso-Aspartate formation (amino acid aa102) by IEC. Values are presented as measured and not normalized as performed in the main manuscript for direct comparison to controls. STN = stochastically nucleated rm = residual moisture.
| (A) mAb1 10 mg/mL (20 cc Configuration) | |||||||||||||
| Nucleation Technique/ | Partial Vacuum | Depressurization | |||||||||||
| Nucleation Temperature (°C) | −5 | −5 | |||||||||||
| Storage Temperature (°C)/ Time (months) | 5 | 25 | 40 | 5 | 25 | 40 | |||||||
| (a) Monomer (%) by SE-HPLC | |||||||||||||
| initial | 99.7 | - | - | 99.7 | - | - | |||||||
| 1 | 99.6 | - | 99.6 | 99.7 | 99.7 | 99.7 | |||||||
| 3 | 99.7 | - | 99.7 | 99.7 | 99.7 | 99.7 | |||||||
| 6 | 99.6 | - | - | 99.6 | 99.7 | 99.6 | |||||||
| 12 | 99.7 | - | 99.7 | 99.7 | - | - | |||||||
| 24 | - | - | - | 99.7 | - | - | |||||||
| (b) aa102 iso-Aspartate (%) by IEC | |||||||||||||
| initial | 69.6 | - | - | 69.5 | - | - | |||||||
| 1 | 69.4 | - | 67.5 | 69.5 | 69.4 | 68.3 | |||||||
| 3 | 69.2 | - | 66.7 | 73.3 | 73.3 | 67.1 | |||||||
| 6 | 67.5 | - | - | 68.8 | 68.4 | 67.7 | |||||||
| 12 | 68.6 | - | 68.6 | 68.6 | - | - | |||||||
| 24 | - | - | - | 68.5 | - | - | |||||||
| (B) mAb1 100 mg/mL (20 cc Configuration) | |||||||||||||
| Nucl. Technique/ | Partial Vacuum | Depressurization | Ice Fog | STN (1% rm) | STN (2% rm) | STN(3% rm) | STN (4%rm) | ||||||
| Nucl. Temp. (°C) | −15 | −5 | −5 | −15 | - | - | - | - | |||||
| Storage Temp. (°C)/ Time (months) | 5 | 25 | 40 | 5 | 25 | 40 | 40 | 40 | 40 | 40 | 40 | 40 | |
| (a) Monomer (%) by SE-HPLC | |||||||||||||
| initial | 99.5 | - | - | 99.6 | - | - | 66.4 | 99.5 | 99.3 | 99.3 | 99.3 | 99.4 | |
| 1 | 99.5 | 99.3 | 98.8 | 99.6 | 99.5 | 99.1 | 65.0 | 98.8 | 98.3 | 98.6 | 98.7 | 99.4 | |
| 2 | - | - | 98.1 | - | - | 98.6 | 63.7 | 98.3 | 97.8 | 98.1 | 98.3 | 99.4 | |
| 3 | 99.3 | 99.1 | 97.8 | 99.5 | 99.3 | 98.5 | 63.1 | 97.8 | 97.5 | 97.9 | 98.1 | 99.4 | |
| 6 | 99.4 | 98.9 | - | 99.4 | 99.1 | - | 59.2 | 97.0 | 96.6 | 97.2 | 97.4 | 98.9 | |
| 12 | 99.3 | - | - | 99.4 | - | - | 56.3 | - | 95.1 | 96.0 | 96.4 | 99.4 | |
| 24 | 99.0 | - | - | 99.4 | - | - | - | - | 92.7 | 92.0 | 94.3 | 64.1 | |
| (b) aa102 iso-Aspartate (%) by IEC | |||||||||||||
| initial | 69.6 | - | - | 69.5 | - | - | 68.0 | 67.2 | 66.1 | 66.1 | 66.1 | 66.4 | |
| 1 | 69.5 | 69.3 | 68.6 | 69.5 | 69.4 | 69.0 | 67.8 | 66.8 | 64.9 | 65.1 | 65.2 | 65.0 | |
| 2 | - | - | 67.5 | - | - | 67.8 | 67.5 | 66.4 | 64.3 | 64.6 | 64.7 | 63.7 | |
| 3 | 73.2 | 73.3 | 71.4 | 73.3 | 73.2 | 71.8 | 66.9 | 65.6 | 63.5 | 63.9 | 64.1 | 63.1 | |
| 6 | 68.7 | 68.0 | 68.6 | 68.2 | - | 66.5 | 64.6 | 62.1 | 62.2 | 62.0 | 59.2 | ||
| 12 | 68.0 | - | - | 68.3 | - | - | - | - | 61.1 | 61.8 | 61.3 | 56.3 | |
| 24 | 67.7 | - | - | 68.3 | - | - | - | - | 58.2 | 49.7 | 56.7 | - | |
Appendix B

Figure A1.
Solid state properties of enzyme at 2.5 mg/mL lyophilized with aggressive or conservative lyophilization cycle in 50 cc vial with “partial vacuum” or “ice fog” technique. (1) Reconstitution time, (2) specific surface area, and (3) residual moisture. Nucleation temperatures are indicated in the legend of the graphs.

References
- Konstantinidis, A.K.; Kuu, W.; Otten, L.; Nail, S.L.; Sever, R.R. Controlled nucleation in freeze-drying: Effects on pore size in the dried product layer, mass transfer resistance, and primary drying rate. J. Pharm. Sci. 2011, 100, 3453–3470. [Google Scholar] [CrossRef] [PubMed]
- Luoma, J.; Magill, G.; Kumar, L.; Yusoff, Z. Controlled Ice Nucleation Using ControLyo® Pressurization-Depressurization Method. In Lyophilization of Pharmaceuticals and Biologicals—New Technologies and Approaches, 1st ed.; Ward, K., Matejtschuk, P., Eds.; Humana Press: New York, NY, USA, 2019; pp. 57–77. [Google Scholar]
- Awotwe-Otoo, D.; Agarabi, C.; Read, E.K.; Lute, S.; Brorson, K.A.; Khan, M.A.; Shah, R.B. Impact of controlled ice nucleation on process performance and quality attributes of a lyophilized monoclonal antibody. Int. J. Pharm. 2013, 450, 70–78. [Google Scholar] [CrossRef] [PubMed]
- Vollrath, I.; Friess, W.; Freitag, A.; Hawe, A.; Winter, G. Does controlled nucleation impact the properties and stability of lyophilized monoclonal antibody formulations? Eur. J. Pharm. Biopharm. 2018, 129, 134–144. [Google Scholar] [CrossRef] [PubMed]
- Vollrath, I.; Friess, W.; Freitag, A.; Hawe, A.; Winter, G. Comparison of ice fog methods and monitoring of controlled nucleation success after freeze-drying. Int. J. Pharm. 2019, 558, 18–28. [Google Scholar] [CrossRef] [PubMed]
- Scientific, S. ControLyo® Technology. Available online: https://www.spscientific.com/ControLyo/ (accessed on 20 August 2020).
- Allmendinger, A.; Schilder, G.; Mietzner, R.; Butt, Y.L.; Luemkemann, J.; Lema Martinez, C. Controlled Nucleation during Freeze Drying Using Vacuum-Induced Surface Freezing. Invention Disclosure rd633018. 2017. Available online: http://www.researchdisclosure.com (accessed on 20 August 2020).
- Millrock Technology: FreezeBooster® Controlled Nucleation Technology. Available online: https://www.millrocktech.com/freezebooster-controlled-nucleation-technology/ (accessed on 20 August 2020).
- Martin Christ: Controlled Nucleation LyoCoN. Available online: https://www.martinchrist.de/de/gefriertrocknung/controlled-nucleation-lyocon/ (accessed on 20 August 2020).
- IMA: VERISEQ® NUCLEATION. Available online: https://ima.it/pharma/lab4life/veriseq-nucleation/ (accessed on 20 August 2020).
- Geidobler, R.; Winter, G. Controlled ice nucleation in the field of freeze-drying: Fundamentals and technology review. Eur. J. Pharm. Biopharm. 2013, 85, 214–222. [Google Scholar] [CrossRef] [PubMed]
- Gitter, J.H.; Geidobler, R.; Presser, I.; Winter, G. A Comparison of Controlled Ice Nucleation Techniques for Freeze-Drying of a Therapeutic Antibody. J. Pharm. Sci. 2018, 107, 2748–2754. [Google Scholar] [CrossRef] [PubMed]
- Lam, P.; Patapoff, T.W. An improved method for visualizing the morphology of lyophilized product cakes. PDA J. Pharm. Sci. Technol 2011, 65, 425–430. [Google Scholar] [CrossRef] [PubMed]
- Haeuser, C.; Goldbach, P.; Huwyler, J.; Friess, W.; Allmendinger, A. Imaging Techniques to Characterize Cake Appearance of Freeze-Dried Products. J. Pharm. Sci. 2018, 107, 2810–2822. [Google Scholar] [CrossRef] [PubMed]
- Haeuser, C.; Goldbach, P.; Huwyler, J.; Friess, W.; Allmendinger, A. Impact of dextran on thermal properties, product quality attributes, and monoclonal antibody stability in freeze-dried formulations. Eur. J. Pharm. Biopharm. 2020, 147, 45–56. [Google Scholar] [CrossRef] [PubMed]
- Kasper, J.C.; Friess, W. The freezing step in lyophilization: Physico-chemical fundamentals, freezing methods and consequences on process performance and quality attributes of biopharmaceuticals. Eur. J. Pharm. Biopharm. 2011, 78, 248–263. [Google Scholar] [CrossRef] [PubMed]
- Searles, J.A.; Carpenter, J.F.; Randolph, T.W. The ice nucleation temperature determines the primary drying rate of lyophilization for samples frozen on a temperature-controlled shelf. J. Pharm. Sci. 2001, 90, 860–871. [Google Scholar] [CrossRef] [PubMed]
- Geidobler, R.; Konrad, I.; Winter, G. Can controlled ice nucleation improve freeze-drying of highly-concentrated protein formulations? J. Pharm. Sci. 2013, 102, 3915–3919. [Google Scholar] [CrossRef] [PubMed]
- Arsiccio, A.; Barresi, A.; De Beer, T.; Oddone, I.; Van Bockstal, P.J.; Pisano, R. Vacuum Induced Surface Freezing as an effective method for improved inter- and intra-vial product homogeneity. Eur. J. Pharm. Biopharm. 2018, 128, 210–219. [Google Scholar] [CrossRef] [PubMed]
- Oddone, I.; Van Bockstal, P.J.; De Beer, T.; Pisano, R. Impact of vacuum-induced surface freezing on inter- and intra-vial heterogeneity. Eur. J. Pharm. Biopharm. 2016, 103, 167–178. [Google Scholar] [CrossRef] [PubMed]
- Geidobler, R.; Mannschedel, S.; Winter, G. A new approach to achieve controlled ice nucleation of supercooled solutions during the freezing step in freeze-drying. J. Pharm. Sci. 2012, 101, 4409–4413. [Google Scholar] [CrossRef] [PubMed]
- Oddone, I.; Arsiccio, A.; Duru, C.; Malik, K.; Ferguson, J.; Pisano, R.; Matejtschuk, P. Vacuum-Induced Surface Freezing for the Freeze-Drying of the Human Growth Hormone: How Does Nucleation Control Affect Protein Stability? J. Pharm. Sci. 2020, 109, 254–263. [Google Scholar] [CrossRef] [PubMed]
- Allmendinger, A.; Butt, Y.L.; Mietzner, R.; Schmidt, F.; Luemkemann, J.; Lema Martinez, C. Controlling ice nucleation during lyophilization: Process Optimization of vacuum-induced surface freezing. Processes 2020, 8, 1263. [Google Scholar] [CrossRef]
- Kramer, M.; Sennhenn, B.; Lee, G. Freeze-drying using vacuum-induced surface freezing. J. Pharm. Sci. 2002, 91, 433–443. [Google Scholar] [CrossRef] [PubMed]


Publisher’s Note: MDPI stays neutral with regard to jurisdictional claims in published maps and institutional affiliations. |
© 2020 by the authors. Licensee MDPI, Basel, Switzerland. This article is an open access article distributed under the terms and conditions of the Creative Commons Attribution (CC BY) license (http://creativecommons.org/licenses/by/4.0/).