Article

Biosorption of Co2+ Ions from Aqueous Solution by K2HPO4-Pretreated Duckweed Lemna gibba

by
Jessica Lizeth Reyes-Ledezma
,
Eliseo Cristiani-Urbina
and
Liliana Morales-Barrera
*
Departamento de Ingeniería Bioquímica, Escuela Nacional de Ciencias Biológicas, Instituto Politécnico Nacional, Av. Wilfrido Massieu s/n, Unidad Profesional Adolfo López Mateos, Ciudad de Mexico 07738, Mexico
*
Author to whom correspondence should be addressed.
Processes 2020, 8(12), 1532; https://doi.org/10.3390/pr8121532
Submission received: 19 October 2020 / Revised: 22 November 2020 / Accepted: 23 November 2020 / Published: 25 November 2020
(This article belongs to the Special Issue Various Adsorbents for Water Purification Processes)

Abstract

:
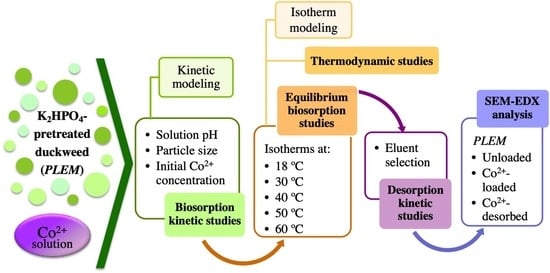
The wastewater of the many industries that use divalent cobalt (Co2+)-containing compounds has elevated levels of this metal. Thus, novel technology is needed to efficiently remove Co2+ ions from aqueous solutions. Biosorption is a low-cost technique capable of removing heavy metals from contaminated water. This study aims to evaluate the performance of KH2PO4-pretreated Lemna gibba (PLEM) as a biosorbent of Co2+ in aqueous solutions tested under different conditions of pH, particle size, and initial Co2+ concentration. Kinetic, equilibrium, and thermodynamic studies were conducted. The capacity of biosorption increased with a greater initial Co2+ concentration and was optimal at pH 7.0 and with small-sized biosorbent particles (0.3–0.8 mm). The pseudo-second-order sorption model best describes the experimental data on Co2+ biosorption kinetics. The Sips and Redlich-Peterson isotherm models best predict the biosorption capacity at equilibrium. According to the thermodynamic study, biosorption of Co2+ was endothermic and spontaneous. The effect of pH on the biosorption/desorption of Co2+ suggests that electrostatic attraction is the main biosorption mechanism. SEM-EDX verified the presence of Co2+ on the surface of the pretreated-saturated biosorbent and the absence of the metal after desorption.

Graphical Abstract

1. Introduction

Excessive population growth, urbanization, and industrial development have increased the pollution of the planet and altered ecosystems. Of all environmental pollution, the contamination of water is the most worrisome because of affecting the primordial element on which life is based. The main source of water pollution is the discharge of industrial wastewater with diverse toxic substances, among which heavy metals are of particular concern [1].
Cobalt is a heavy metal found in the Earth’s crust, being a natural component of volcanic emissions, as well as surface and subterranean water. It is released into the environment through anthropogenic activities: Burning fossil fuels, applying fertilizers, mining, electroplating, manufacturing batteries, and producing commodities with industrial processes involving cobalt-containing compounds, among others.
Although cobalt is an essential nutrient in human metabolism and the principal component of vitamin B12 [2], it is harmful to our health beyond trace levels, competing with other elements that constitute integral parts of a proper metabolic function [3]. In excess, it can give rise to skin irritation and problems in bone development, as well as respiratory, cardiac, thyroid, liver, and gastric disorders [4,5]. Due to being hazardous to humans and ecosystems [6], cobalt-contaminated wastewater should be treated prior to being released into the environment.
Since low concentrations of cobalt are difficult to remove from water by conventional physicochemical treatments, it is necessary to apply innovative technology characterized by safety, efficiency, and versatility. One alternative is biosorption, a process independent of cell metabolism [7]. This technique, which has been little studied as a remedy for Co2+ pollution, can be carried out by living, dead, or inactive biological material [8,9].
Biosorption is a process of capturing heavy metals by physical adsorption (physisorption), ionic interchange, chemisorption (e.g., complexation, coordination, and chelation), and microprecipitation [10]. Diverse biological materials are capable of biosorption, including agroindustrial waste, microbial biomass, and biopolymers. These economical materials are available in great quantities, and the respective processes are environmentally friendly [11,12]. Unlike physicochemical methods, biosorption techniques can efficiently remove low concentrations of metals from aqueous solutions. If biosorption is followed by desorption, the metals can be recovered and the biosorbents regenerated for later use [13].
The current contribution focuses on the biosorbent potential of Lemna gibba, a macrophyte of universal distribution commonly known as duckweed. This plant, which quickly proliferates to double its biomass in about two days, lends itself to the bioremediation of aquatic systems, due to its small size (2–4 mm) and ability to bioaccumulate toxic compounds (e.g., heavy metals) [14]. Because eutrophication has provoked an excessive spread of Lemna gibba, it is now a plague in many places. Its excessive growth in the form of a thick mat on the aquatic body leads to navigation problems, harbors harmful fauna, and prevents sunlight from reaching photosynthetic species in the water below, thus interrupting the correct oxygenation of its environment [15,16]. Apart from being abundantly available, the plant material holds promise as a sustainable biosorbent for treating wastewater contaminated with cobalt and other heavy metals.
According to a previous report, pretreatment of L. gibba with K2HPO4 substantially improves the availability of sorption sites on the surface of plant cells, and therefore, their capacity for Co2+ biosorption, which is achieved by removing salts and producing a higher negative charge (−35 vs. −26 mV). The zero point of charge (ζ0) was 2.37 for unpretreated and 1.62 for K2HPO4-pretreated Lemna gibba, thus creating a greater attraction in the latter for positively charged Co2+. The ATR-FTIR analysis of K2HPO4-pretreated Lemna gibba revealed an important role of its hydroxyl and carboxyl groups in the removal of Co2+ [17]. The aim of the present study was to analyze the performance of K2HPO4-pretreated L. gibba as a biosorbent under distinct conditions of pH, particle size, and the initial concentration of Co2+. Various theoretical models were tested to find the best one for describing the experimental data on biosorption. To determine the best eluent solution for desorption, saturated L. gibba was processed with strong and weak acids, as well as some alkaline compounds. Considering that recyclability is a prerequisite for the practical application of biosorption technology, three biosorption/desorption cycles were herein evaluated.

2. Materials and Methods

2.1. Reagents

The reagents employed in the experiments were all of analytical grade (JT Baker®, Monterrey, Mexico). During the biosorption experiments, the pH of the solutions was maintained constant by adding HCl and NaOH in the solution at a concentration of 0.1 M and 0.01 M, respectively. The different concentrations of Co2+ were prepared by making dilutions of a stock solution of CoCl2·6H2O (>98% purity) containing 1 g L−1 of Co2+.

2.2. Preparation of the Biosorbent

Lemna gibba was collected from the Xochimilco canals in Mexico City (19°15′31.8″ N 99°05′05.3″ W). It was cleaned with running tap water and then deionized water before being dried in a Luzeren® oven (Proveedor de Laboratorios, Mexico) at 60 °C for 48 h. Afterward, the material was ground in a hammer mill (Glen Creston, Ltd., London, UK) and sieved (U.S. ASTM) to obtain fractions of the biosorbent, each with a particular particle size between 0.3 and 2.0 mm (0.3–0.5, 0.5–0.8, 0.8–1.4, and 1.4–2.0 mm). The fractions were all pretreated with K2HPO4. Briefly, 5 g (dry weight) of Lemna gibba per liter were exposed to K2HPO4 (0.3 M) at 18 °C for 30 min. During the pretreatment, the material was agitated at 140 rpm in an orbital shaker (All Sheng™, Hangzhou Allsheng Instruments Co, Ltd., Hangzhou, China). Upon completion of the exposure time, the biosorbent was washed with deionized water. When the resulting wash water had a pH near the deionized water being used, the material was dried in an oven at 60 °C for 48 h [17]. Each fraction of dried, pretreated Lemna gibba (PLEM) was stored in a separate, well-labeled, hermetically-sealed bottle at room temperature (rt).

2.3. The Influence of Different Physicochemical Parameters on the Biosorption of Co2+ by PLEM

Experiments to evaluate the effect of several physicochemical variables on the biosorption of Co2+ by PLEM were carried out in 500 mL Erlenmeyer flasks. They contained 120 mL of a solution with a known concentration of Co2+ at a predetermined pH value. Subsequently, an addition was made of 0.12 g of PLEM at a certain particle size, thus achieving a biosorbent concentration of 1 g (dry weight) L−1. The suspensions were left at 18 °C (rt) for 2 h under constant agitation at 140 rpm in an orbital shaker (All Sheng™, Hangzhou Allsheng Instruments Co, Ltd., Hangzhou, China). The pH of the solutions was adjusted to the desired value and maintained constant throughout the assay by adding 0.1 M HCl and 0.01 M NaOH.
Firstly, the pH varied (2, 3, 4, 5, 6, and 7), while maintaining the initial concentration of Co2+ (Cini) at 100 mg L−1 and the particle size of PLEM at 0.3–0.5 mm. Later, distinct particle sizes (0.3–0.5, 0.5–0.8, 0.8–1.4, 1.4–2.0, and 0.3–0.8 mm) were utilized, while maintaining Cini at 100 mg L−1 and the pH at 7.0. Finally, different initial values of Cini (10, 20, 40, 60, 80, 100, 200, and 300 mg L−1) were used, while maintaining the pH at 7.0 and the particle size at 0.3–0.8 mm.
During the experiment, samples were taken at various exposure times and filtered to afford a solution free of biosorbent. The filtrate of each flask was diluted properly for the posterior quantification of the cobalt concentration. From the values obtained, the biosorption capacity of Co2+ by PLEM was calculated at a series of exposure times using Equation (1):
q = V M ( C i n i C )
where q (mg g−1) is the capacity of biosorption of Co2+, V (L) is the total volume of the solution, M (g) is the biosorbent mass, and Cini and C (mg L−1) correspond to the initial concentration of Co2+ in the solution and its concentration at time t (h), respectively. When the system reaches equilibrium, t = teq, C = Ceq and q = qeq. Based on the values of biosorption capacity found, the most suitable pH of the solution and the best particle size for the removal of Co2+ were selected for the rest of the biosorption experiments. For each of the parameters examined, controls free of biosorbent were established and analyzed for possible changes in the concentration of cobalt.

2.4. Kinetic Modeling of the Biosorption of Co2+ by PLEM

For the kinetic modeling of the biosorption of Co2+ by PLEM, the equations of pseudo-first-order, pseudo-second-order, and fractional power were employed (Table 1).

2.5. Biosorption Isotherm Studies at Different Temperatures

In 125 mL flasks were poured 30 mL of solutions of Co2+ at distinct concentrations (20, 40, 60, 80, 100, 200, and 300 mg L−1), adjusting the pH to 7.0. Then 0.03 g of PLEM (particle size = 0.3–0.8 mm) was placed in each flask to ensure a concentration of 1 g L−1 of PLEM. The suspensions were left for 2 h at 18, 30, 40, 50, or 60 °C to reach biosorption equilibrium. Subsequently, the samples from each flask were filtered, and the residual concentration of Co2+ was quantified in each filtrate. With the experimental results of the biosorption capacity found at equilibrium (qeq) and the residual concentration of cobalt at equilibrium (Ceq) for each initial concentration of metal assayed (Cini), the isotherm for adsorption was calculated. It was then possible to select the best mathematical model for describing the experimental behavior. With this objective in mind, models of two (Langmuir and Freundlich) and three parameters (Sips and Redlich-Peterson) were used (Table 1).

2.6. Determination of the Thermodynamic Parameters

The thermodynamic parameters examined were the changes in Gibbs free energy (ΔG0, J mol−1), in standard entropy (ΔS0, J mol−1 K−1), and in standard enthalpy (ΔH0, J mol−1). With the data on the isotherms for biosorption at equilibrium, the coefficient of distribution (Kd, L g−1) was obtained for each temperature and concentration assayed using Equation (2) [21]:
K d = q e q C e q
In the graph of Ln Kd vs. Ceq for each temperature, the point at which the ordinate crosses the origin corresponds to Ln K0 (K0 being the sorption constant at equilibrium, L g−1). These values were substituted in Equation (3) to find the change in Gibbs free energy [22]:
Δ G 0 = R T   L n   K 0
where R is the constant of the ideal gases (8.315 J mol−1 K−1), and T is the absolute temperature (K) during biosorption. The change in standard entropy (ΔS0) was found by Equation (4):
Δ S 0 = Δ G 0 T
The slope of the graph of ΔG0 vs. T indicates the mean value of ΔS0. The change in the standard enthalpy was furnished by Equation (5):
Δ G 0 = Δ H 0 + T Δ S 0

2.7. Desorption of Co2+ from the Biosorbent

To evaluate desorption, the biosorbent was first saturated by exposing PLEM (1 g L−1, with a particle size of 0.3–0.8 mm) to a solution of Co2+ (300 mg L−1, pH 7.0, rt) under constant agitation at 140 rpm for 2 h. Upon completion of this time, the biosorbent was washed with deionized water several times to eliminate the excess cobalt and then dried in an oven at 60 °C for 48 h. Finally, it was stored in hermetically-sealed bottles until further use.
For the desorption of Co2+ from PLEM, diverse solutions were tested as eluents: Water at rt (H2O rt, the control), water at 60 °C (H2O 60 °C), various acidic solutions (HCl, H2SO4, HNO3, C2H2O4, KH2PO4, and NH4Cl) and three alkaline compounds (NaOH, NaHCO3, and K2HPO4). The concentration of all compounds was 0.1 M. Desorption was carried out by placing 120 mL of one of the distinct eluent solutions in each Erlenmeyer flask and adding the saturated biosorbent at a concentration of 1 g L−1. The material was maintained under constant agitation at 140 rpm and 18 °C for 2 h, collecting and filtering samples from each of the flasks at different times. The concentration of desorbed metal on each filtrate was quantified. The percentage of desorption at time t was calculated with Equation (6) [23]:
E D ( % ) = V ( C D C i n i ) M   q e q × 100
where Cini and CD (mg L−1) are the initial concentration of metal in the solution (t = 0 h) and the concentration of Co2+ eluted from the solution at time t, respectively, and qeq (mg g−1) is the amount of Co2+ retained per gram of biosorbent (determined experimentally). The results of the percentage of the desorption were compared to select the adequate solution for eluting Co2+ from PLEM.

2.8. Biosorption-Desorption Cycles

PLEM was saturated with Co2+ for 2 h, as described in the previous section. Upon completion of this time, samples of the solution were taken to assess the biosorption capacity of PLEM in the first stage (Equation (1)). Subsequently, the saturated biosorbent was washed, dried, and subjected to the desorption of Co2+ (as already explained) by putting 1 g L−1 of the material in a solution with the selected eluent and leaving it under constant agitation at 140 rpm and rt for 2 h. Samples were then taken to quantify the concentration of Co2+ in the solution and calculate the percentage of desorption for the first cycle (Equation (6)). PLEM was washed with deionized water and dried at 60 °C for 48 h to be submitted to posterior cycles. Three cycles of biosorption/desorption were carried out under the same conditions, allowing for the comparison of the capacity of biosorption and percentage of desorption from one cycle to another.

2.9. Scanning Electron Microscope Coupled to Energy-Dispersive X-ray Spectroscopy (SEM-EDX)

The possible changes in the structure and composition of the surface of PLEM, due to the process of biosorption and the posterior desorption of Co2+ were explored on a scanning electron microscope (SEM). The three types of samples of PLEM (unexposed to Co2+, saturated, and desorbed in the first cycle) were dried for 24 h at 60 °C. Subsequently, they were covered with carbon to be later observed with a JEOL high-resolution scanning electron microscopy (HR-SEM) (model JSM7800F, Jeol Ltd., Tokyo, Japan) with an acceleration voltage of 5 kV.

2.10. Analytical Methods

Co2+ was quantified by the dimethylglyoxime (DMG) method, with which a compound is formed with an intensity of color proportional to the concentration of Co2+ present in the solution [24]. The measurement of absorbance was conducted in a Spectronic Genesys UV/Vis 10 spectrophotometer (Thermo Electron Scientific Instruments Corp, Madison, WI, USA) at 400 nm. The concentration of Co2+ was established by constructing metal-type curves with at least 10 distinct known concentrations.

2.11. Statistical Analysis

Each experiment was performed independently at least twice, and the determinations of residual cobalt were made at least three times, with the aim of attaining the appropriate statistical power. Data are expressed as the mean ± standard deviation (SD) of the values obtained experimentally. Regarding the values from the kinetics of biosorption and the experimental biosorption capacity at equilibrium (qeq), differences between groups were examined with two-way ANOVA and Tukey’s test (with a confidence interval of α = 0.05) on the GraphPad Prism® Ver 8.4 program 2020 (GraphPad Software Inc, San Diego, CA, USA). The kinetic and equilibrium parameters were scrutinized by nonlinear regression on the same software, selecting the best model in accordance with a variety of error functions: The correlation coefficient (R2), the absolute sum of squares (ASE), the standard deviation of the residuals (Sy.x) and Akaike’s information criterion (AICc). The data from the three cycles of biosorption/desorption were compared with one-way ANOVA and Dunnett’s test (confidence interval, α = 0.05) on the GraphPad Prism® Ver 8.4 program 2020 (GraphPad Software Inc., San Diego, CA, USA).

3. Results and Discussion

No change in the concentration of Co2+ was found for the PLEM-free solutions, used as controls for the evaluation of the influence of the physicochemical conditions herein tested. Thus, the removal of Co2+ from the aqueous solution can be fully attributed to the effect of biosorption produced by PLEM.

3.1. The Effect of pH

The level of pH is one of the physicochemical factors that most influence the biosorption of heavy metals [25]. The pH values of 2–7 were presently employed because the precipitation of cobalt was observed experimentally as of pH 8, likely due to the formation of cobalt hydroxide [26,27]. At each pH value, the biosorption capacity was evaluated with respect to time (Figure 1a). With the pH at 2 or 3, the cobalt removal capacity was near 0.
The sorption capacity was enhanced with each increment in pH from 4 to 7, which can be easily explained by considering the pH of the plant material (1.67), which results in zero point of charge (ζ0) [17]. When the pH of a solution is less than that found at ζ0, the net charge of the surface of the biosorbent is positive. Hence, an electrostatic repulsion exists between the positive charge of both the metal ions and the surface of the biosorbent [28]. In contrast, when a solution has a pH value above that at ζ0, the net charge of the surface of the biosorbent is negative, and there is an attraction with the positively charged metal ion [29]. A pH value of 5–7 herein afforded the fastest biosorption of Co2+ during the first 10 min (0.17 h) of the experiment. After this time, however, the velocity of removal of the metal decreased until reaching equilibrium, at which point the velocity of net transfer was 0. The initial rapid biosorption was due to the greater number of sites on PLEM available for the uptake of the sorbate and the higher concentration of Co2+ in the aqueous solution. As time passed, the available sites and the concentration of free cobalt ions were both diminished, leading to a gradual decline in the velocity of the removal of Co2+ until reaching the equilibrium dynamic. It was observed that as the pH increased, the biosorbent removed more Co2+, and therefore, required more time to reach equilibrium (teq). The same phenomenon has been reported for the effect of pH on the biosorption of other divalent metal ions [29].
A summary of the of Co2+ removal capacity at experimental equilibrium (qeq), the time to reach equilibrium (teq), and the values of the parameters and error functions for each model and at each pH value assayed are provided in Table 2. None of the kinetic models employed fit the experimental results at pH 2 or 3, probably owing to the minimal biosorption of Co2+ under these conditions. At pH 4, a reduction in the removal capacity was only found after 0.75 h (Figure 1a), a time period not included in the process of biosorption. Hence, the corresponding data was not considered when determining the values of the parameters for the kinetic models. With a pH of 4–7, the pseudo-second-order model had the highest correlation coefficient (R2) and the lowest values for ASE, Sy.x, and AICc compared to the other two models (pseudo-first-order and fractional power). The Elovich model was also evaluated, but is not listed in the tables because the R2 was too small, and the parameters obtained had exaggerated SD values. Given that a pH of 7 produced the greatest biosorption capacity at equilibrium, this value was used for further testing.

3.2. The Effect of Particle Size

Particle size is a physical property that affects the surface area of contact between a sorbent and the liquid phase, thus playing a key role in biosorption [30,31]. When the particle size is reduced, the area of contact is amplified, and the sites of sorption are more accessible, generating a better capacity, efficiency, and velocity of biosorption and a decrease in the time to reach equilibrium (Figure 1b). The present results are in agreement with previous reports of an enhanced biosorption capacity as the particle size diminishes, considering particles from 0.3 to 2.0 mm (Table 3).
The biosorption of Co2+ was not significantly different (p > 0.05) between the size intervals of 0.3–0.5 mm and 0.5–0.8 mm. Therefore, a kinetic study was carried out to remove Co2+ by PLEM at a particle size of 0.3–0.8 mm. The statistical analysis with two-way ANOVA and Tukey’s test indicated the lack of significant difference (p > 0.05) between the equilibrium biosorption capacity qeq values of the samples with the following three particle sizes: 0.3–0.5, 0.5–0.8 mm, and 0.3–0.8 mm. The Co2+ biosorption rate was slightly faster (as expected) at the smaller particle size range (0.3–0.5 mm), reaching equilibrium at 0.5 h. The particle size range of 0.5–0.8 mm achieved equilibrium in a longer period of time (0.75 h), probably due to the greater surface area available with a smaller particle size, leading to faster binding of Co2+ ions to the surface of the biosorbent. With a particle size range of 0.3–0.8 mm, the time required to reach equilibrium (teq) of Co2+ biosorption by PLEM was 0.5 h, similar to the time found for the smallest particles tested (0.3–0.5 mm).
One advantage of employing a particle size of 0.3–0.8 mm is that it is possible to utilize fixed-bed columns packed with the material. Volesky [32] suggested using a particle size of 0.4–0.7 mm, since smaller sizes could obstruct the bed and provoke a drop in pressure. Additionally, particles of 0.3–0.8 mm (but not smaller) allow for the application of more biosorbent material. If the particle size range is under 0.3 mm, pretreatment is more difficult. Hence, a particle size of 0.3–0.8 mm was chosen for the rest of the experiments. The experimental results of the Co2+ removal capacity at equilibrium (qeq) were compared to the parameters of the kinetic models assayed (Table 3). As can be appreciated, the equation of the pseudo-second-order model shows a higher correlation coefficient (R2) and lower error functions (ASE, Sy.x, and AICc) than the other two models.

3.3. The Effect of the Initial Co2+ Concentration

The initial concentration of metallic ions is an important variable because it significantly affects the biosorption capacity and the time to reach equilibrium [33]. A boost in the initial concentration of the metal from 10 to 300 mg L−1 generated an 8.46-fold rise (from 5.46 to 46.17 mg g−1) in the biosorption capacity at equilibrium (Figure 1c). Increasing the initial concentration of the sorbate, while maintaining the concentration of the biosorbent constant likely amplified the driving force behind sorption (the transfer of the cobalt ions from the aqueous solution to the surface of the biosorbent), a consequence of the higher gradient of concentration. Moreover, there is a greater probability of Co2+ binding to the active sites available in the sorbent, which would bring about a better biosorption capacity [34]. The experimental data on biosorption capacity at equilibrium (qeq), the time required to reach equilibrium (teq), and the values of the parameters of the kinetic models and their corresponding error functions are listed in Table 4. Of the theoretical models applied to the data, the pseudo-second-order model gave the values closest to those found experimentally (as occurred with the other environmental variables) for the distinct initial concentrations of Co2+.
The sorption velocity (k2) is a kinetic parameter known to be related to the time to reach equilibrium, and therefore, depends on the initial concentration of the metal. The analysis of the kinetic parameters with two-way ANOVA and multiple comparisons by Tukey’s test revealed a significant difference in relation to teq and k2 between two initial concentrations of Co2+ (Cini): 10 and 300 mg L−1. The corresponding values for teq were 0.05 and 0.75 h, while those for k2 were 6.847 and 1.402 g mg−1 h−1, respectively (Table 4). Thus, an increase in the initial concentration of cobalt led to a decrease in k2 and a longer time necessary to reach equilibrium, which is in agreement with previous reports on the biosorption of metallic ions [33,35].

3.4. Biosorption Isotherm Studies at Various Temperatures

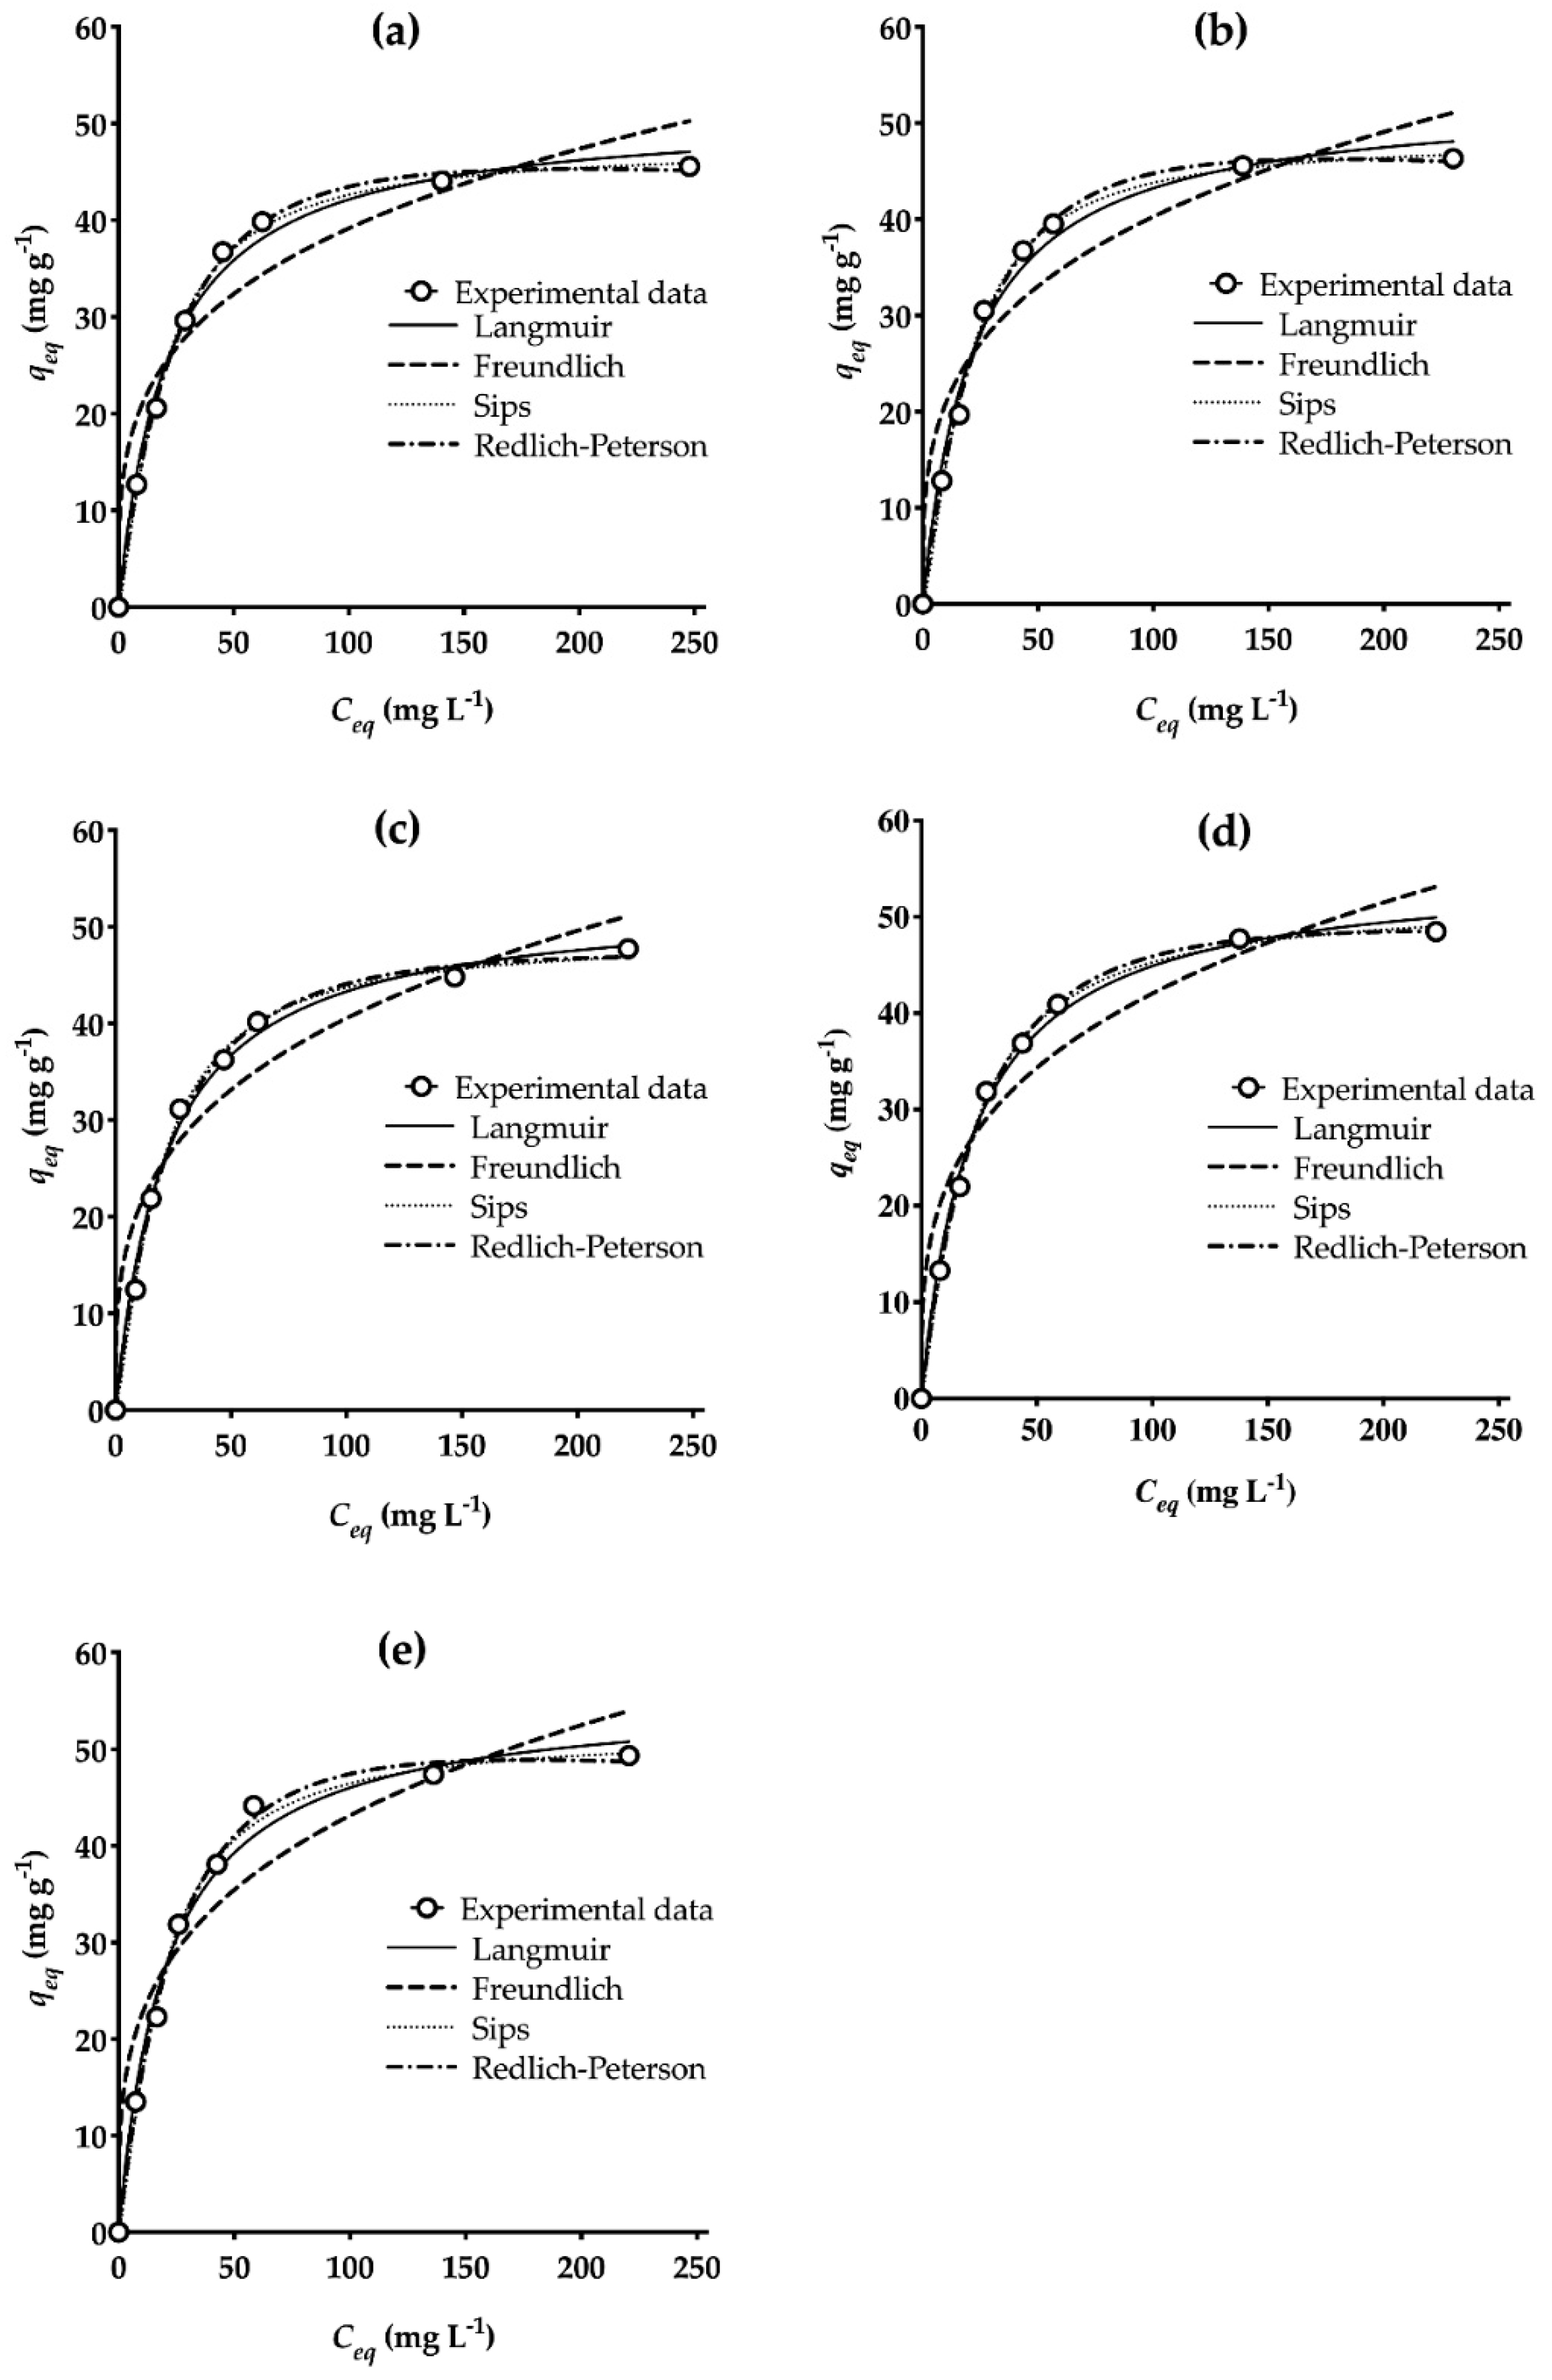
To understand the sorbate-sorbent interaction, it is crucial to assess the isotherm of biosorption and model it at several temperatures. This approach also allows for the prediction of the maximum biosorption capacity of the sorbent (qm) and consequently a comparison of distinct sorbents (a prerequisite for the design of an adsorption system) [36,37]. Biosorption at equilibrium was established by examining the variation of the biosorption capacity at equilibrium (qeq) with respect to the concentration of the sorbent at equilibrium (Ceq). The relation between the experimental isotherms and those predicted by the theoretical models for the biosorption of Co2+ by PLEM at different temperatures is shown in Figure 2.
The maximum experimental sorption capacity (qm exp) was determined at each temperature, as were the values of the other parameters and the error functions (R2, ASE, Sy.x, and AICc) for the models of isotherms (Table 5).
Regarding the isotherm models of two parameters, the Langmuir model afforded the best correlation coefficient (R2 > 0.99) and the smallest error functions. The value of the separation factor (RL) reflects the nature of biosorption, which is considered unfavorable with RL ≥ 1, favorable with 0 < RL < 1, an irreversible if RL = 0 [38]. The values of RL calculated presently indicate that biosorption is favorable (0.07 < RL < 0.5) at all temperatures assayed.
On the other hand, each of the models of three parameters (Sips and Redlich-Peterson) provided a higher correlation coefficient (R2 > 0.996) and lower error functions than the models of two parameters. Overall, the Redlich-Peterson model gave the lowest error functions. The values of maximum biosorption capacity predicted by the isotherm of Sips (qmSP = 47.55 to 51.55 mg g−1) at the five temperatures herein employed were very close to the experimental data (qm exp = 46.17 to 49.35 mg g−1). Compared to the capacity for the biosorption of Co2+ previously reported for diverse biosorbents, the value found in the current study reveals an excellent capacity for PLEM (Table 6). Thus, it is an attractive biosorbent for the detoxification of water contaminated with Co2+.

3.5. Thermodynamic Parameters

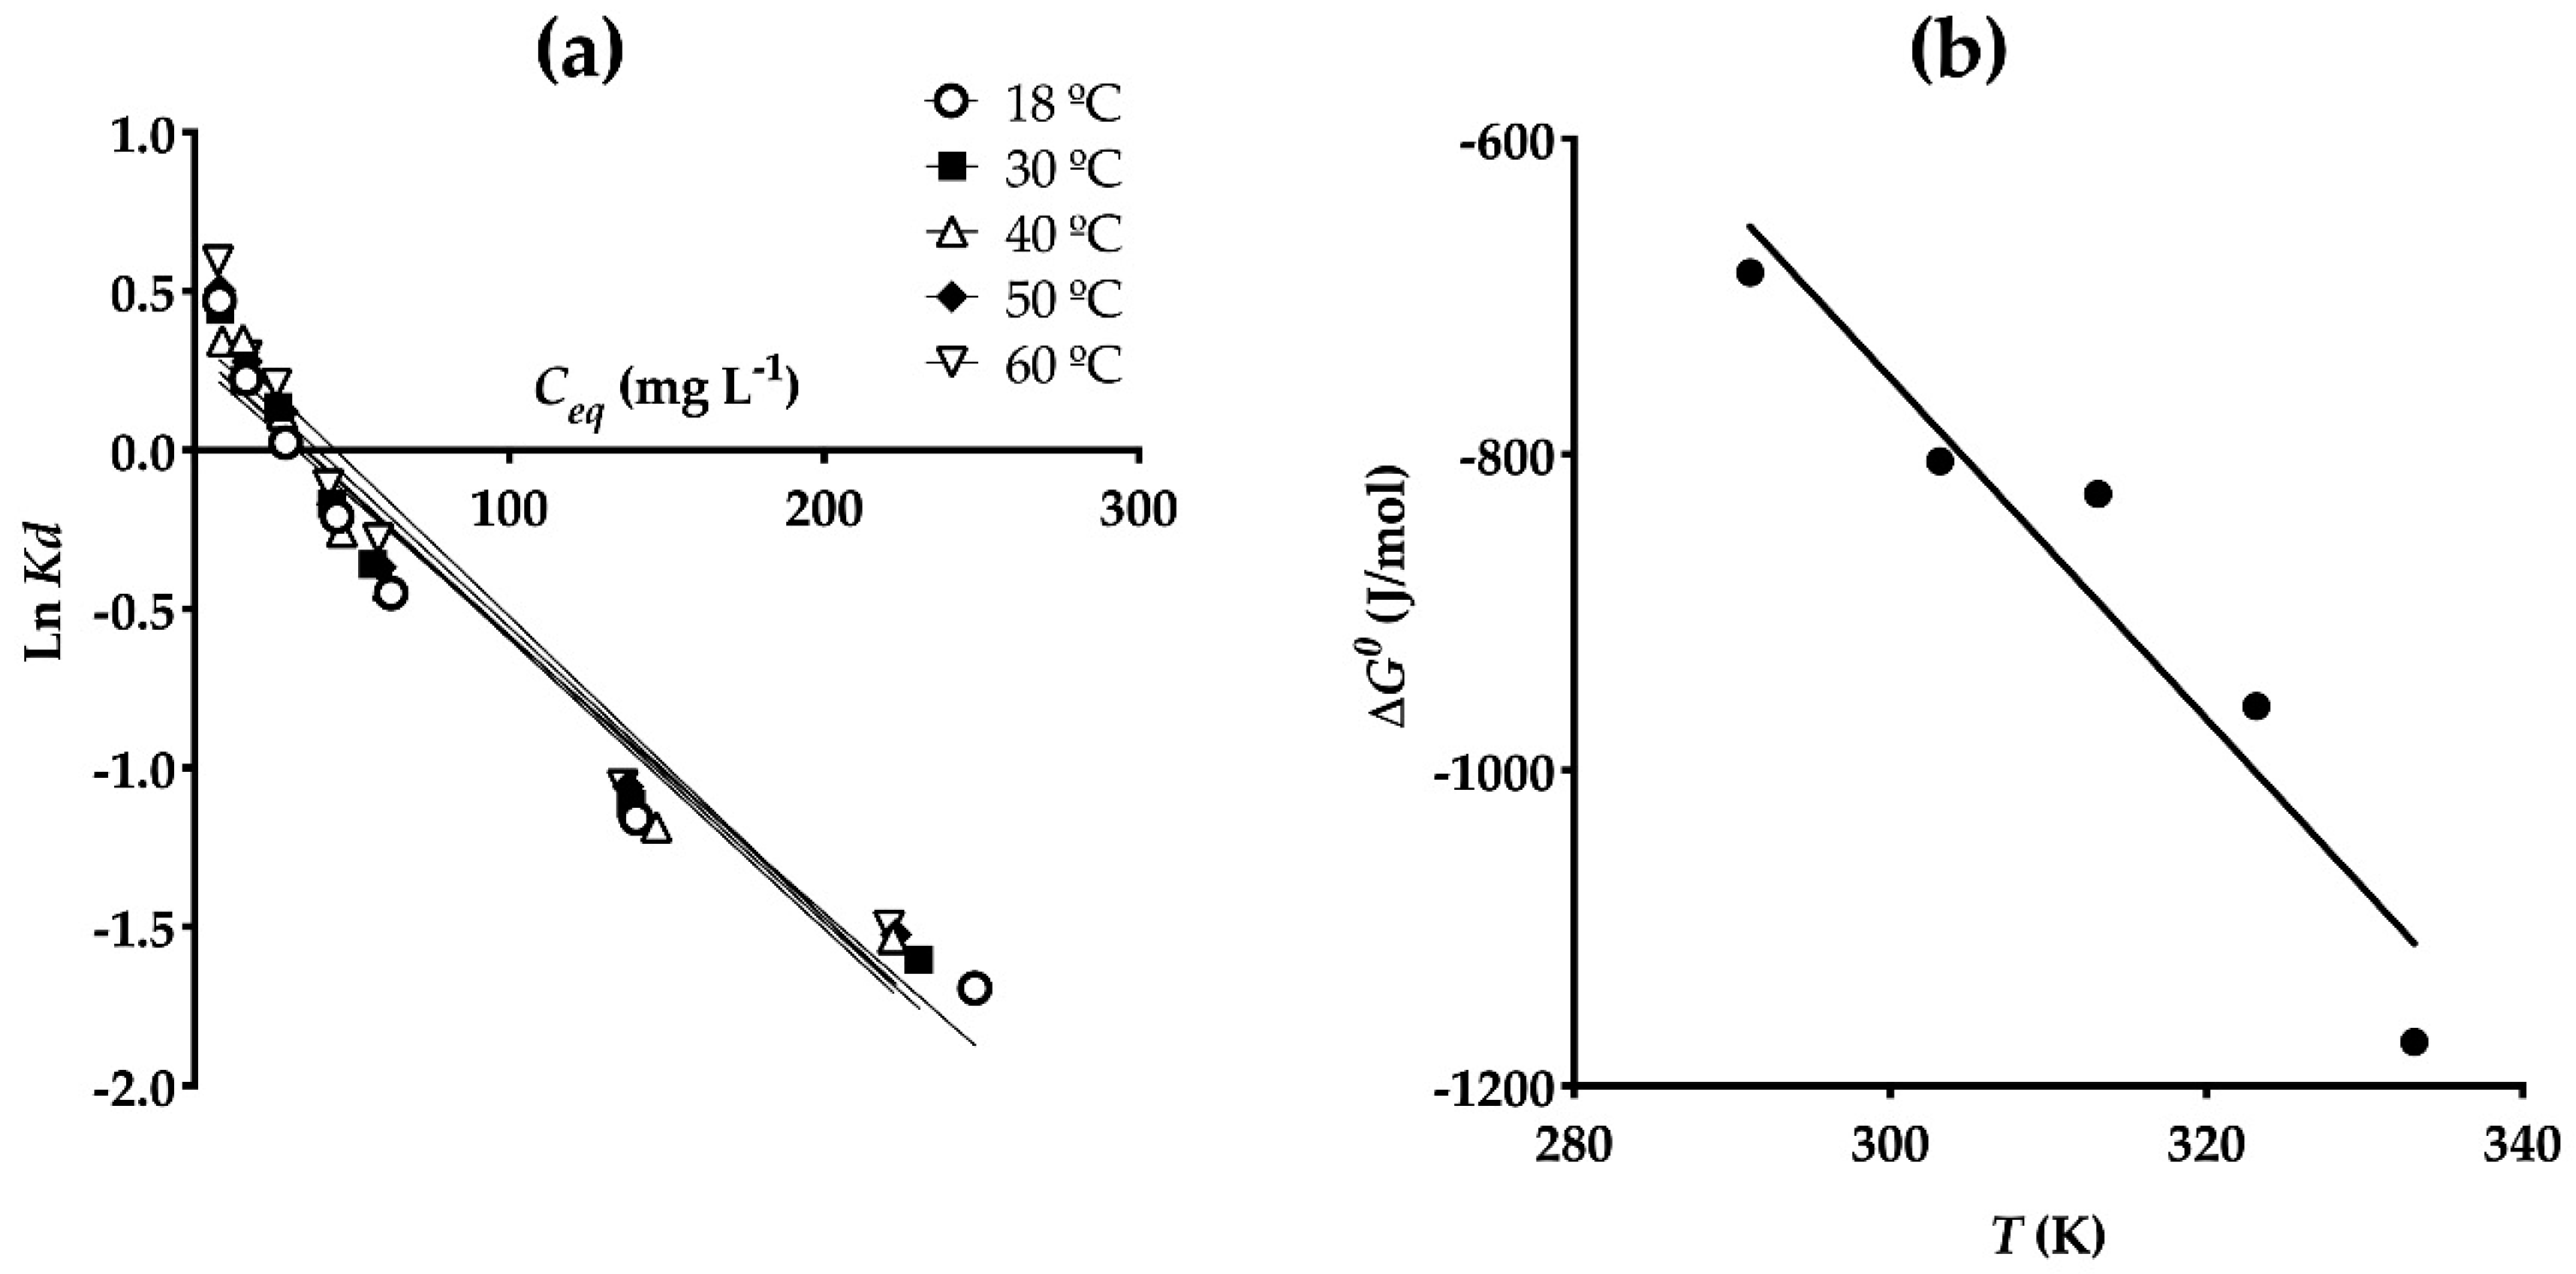
Graphs were constructed to find the thermodynamic parameters, ΔG0 (Figure 3a), ΔH0, and ΔS0 (Figure 3b), and the corresponding values were determined (Table 7).
The Gibbs free energy (ΔG0) values are negative for the biosorption of Co2+ by PLEM (Table 7), suggesting a spontaneous process. The biosorption has been reported to improve as the temperature rises [22]. The positive values of ΔH0 show an endothermic biosorption, which is consistent with the enhanced biosorption capacity (qm exp) presently found at higher temperatures (Table 5). The change in the mean calculated standard enthalpy was ΔH0prom = 2.49 KJ mol−1. A value below 40 kJ mol−1 is indicative of a process of physisorption [21]. The positive value of standard entropy (ΔS0) reveals a high affinity of Co2+ for PLEM [22], and thus, the probability that the metal promotes structural changes in the biosorbent. Hence, the process of biosorption likely increases the degree of disorder of the whole system [25,52]. According to the values of the thermodynamic parameters, adsorption of Co2+ by PLEM is spontaneous and favorable, allowing this material to be utilized for the removal of metal from polluted water.

3.6. Desorption

The elution of Co2+ after its sorption by PLEM was tested with various acids and bases (Figure 4). Overall, the strong acids (HCl, HNO3, and H2SO4) were the best eluent solutions, giving superior desorption percentages (>94%) compared to the weak acids (<65%) or alkaline compounds (<20%). Water, whether at rt or 60 °C, was not capable of eluting more than 10% of Co2+.
Thus, the biosorbent was positively charged at the pH of acid solutions, resulting in an electrostatic repulsion with the sorbate [53]. Accordingly, physisorption seems to play a key role in the process of biosorption of Co2+ by PLEM. On the other hand, a high concentration of H+ ions in the acid solutions could cause competition with Co2+ for these sorption sites, favoring ionic interchange, and consequently, the desorption process [54]. Since 0.1 M HCl was the eluent with the greatest percentage of desorption (100%), the biosorbent was eluted with this solution in posterior assays.
The effect of pH on the biosorption/desorption of Co2+ suggests that the main biosorption mechanism is electrostatic attraction, a physical process between negatively charged groups of the biosorbent and the positive charge of Co2+. The thermodynamic value of ΔH0prom (2.49 KJ mol−1) indicates a physisorption process, which reinforces the idea of electrostatic attraction being the principal mechanism of biosorption.

3.7. Biosorption-Desorption Cycles

Considering the indispensable requirement of recyclability for the practical application of a biosorbent, an evaluation of the cycles of biosorption/desorption is necessary to assure that the material can be regenerated in a cost-effective manner [23]. Additionally, insights are provided as to the best way to dispose of the biosorbent once it is no longer useful. Few such studies have been reported for the biosorption/desorption of Co2+ [9,43].
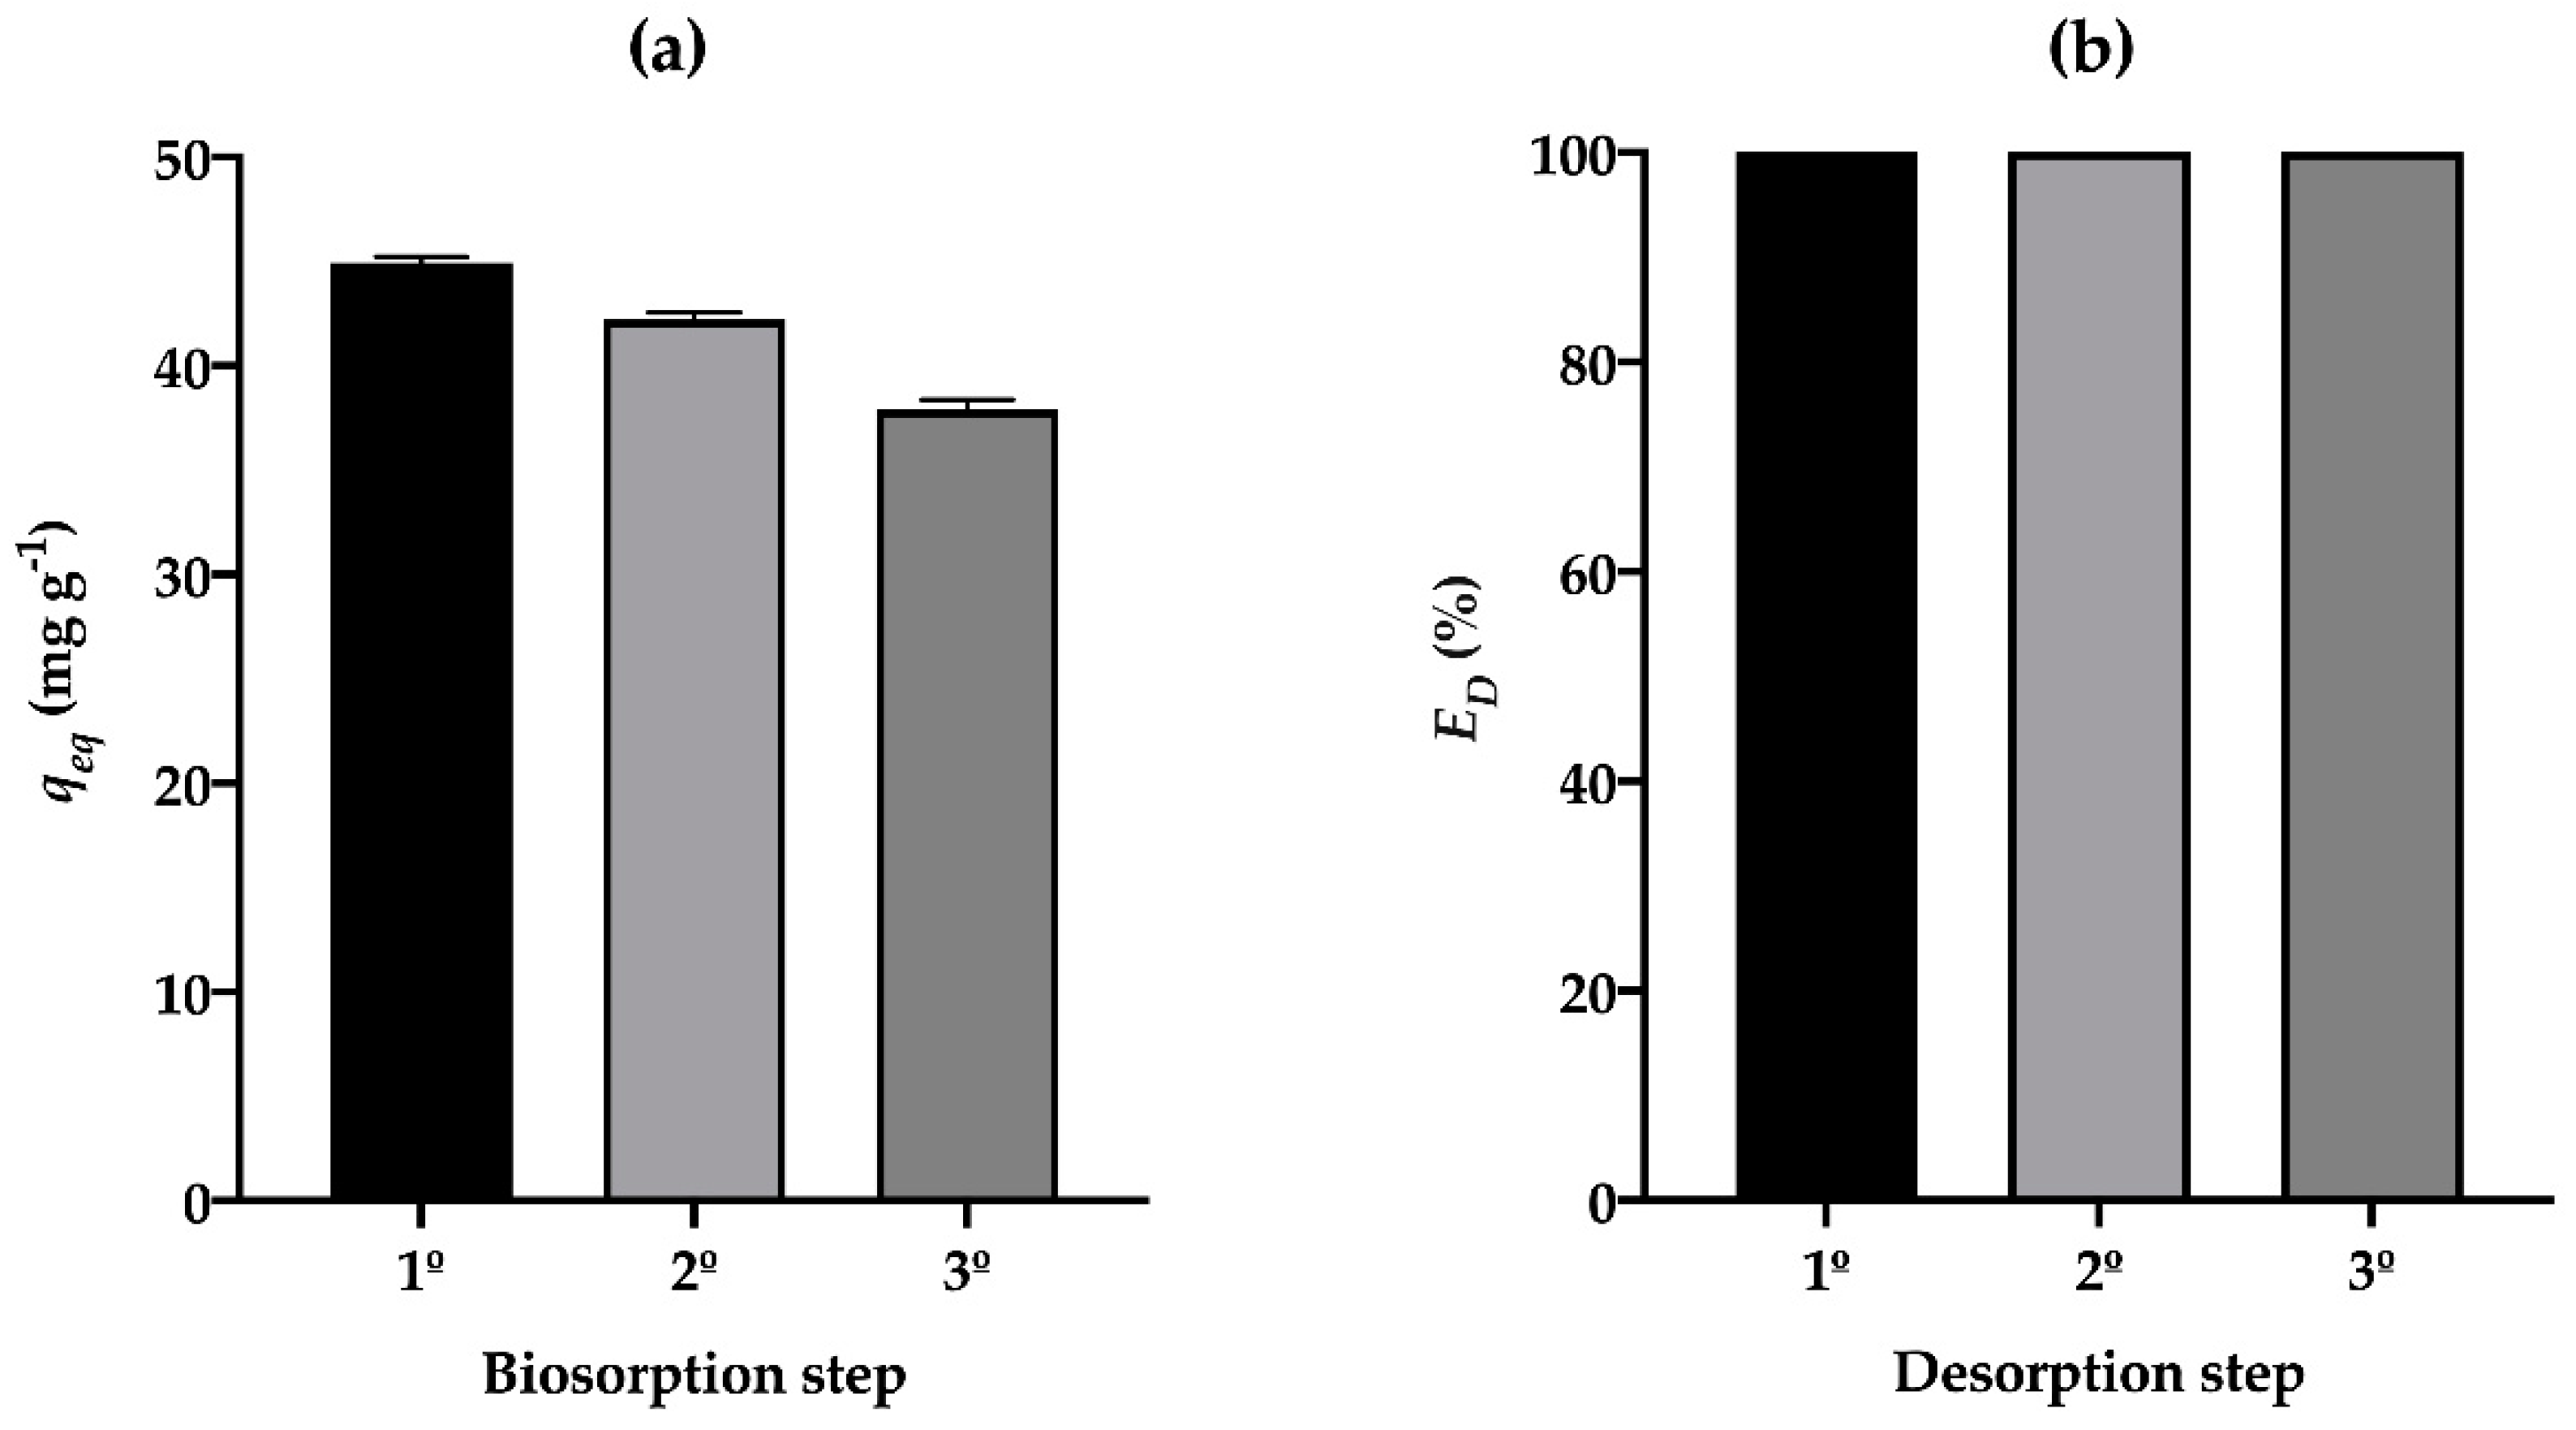
The biosorption capacity of PLEM in the first cycle (46.17 ± 0.41 mg g−1) was diminished 8.53% in the second cycle and a cumulative 17.89% by the end of the third cycle (Figure 5a), representing significant differences. Hence, the eluent herein employed (0.1 M HCl) could have damaged the composition and structure of the biosorbent, affecting the sorption sites and reducing the capacity of Co2+ removal from one cycle to the next [55]. However, PLEM maintained an elevated capacity of Co2+ removal throughout the three cycles. During all three cycles, moreover, Co2+ was completely desorbed (ED = 100%) from the biosorbent (Figure 5b), evidencing its recyclability. After the end of its useful life, PLEM can be integrated into compost with null impact on the environment because of not containing any Co2+.

3.8. Scanning Electron Microscopy Coupled with Energy-Dispersive X-ray Spectroscopy (SEM-EDX)

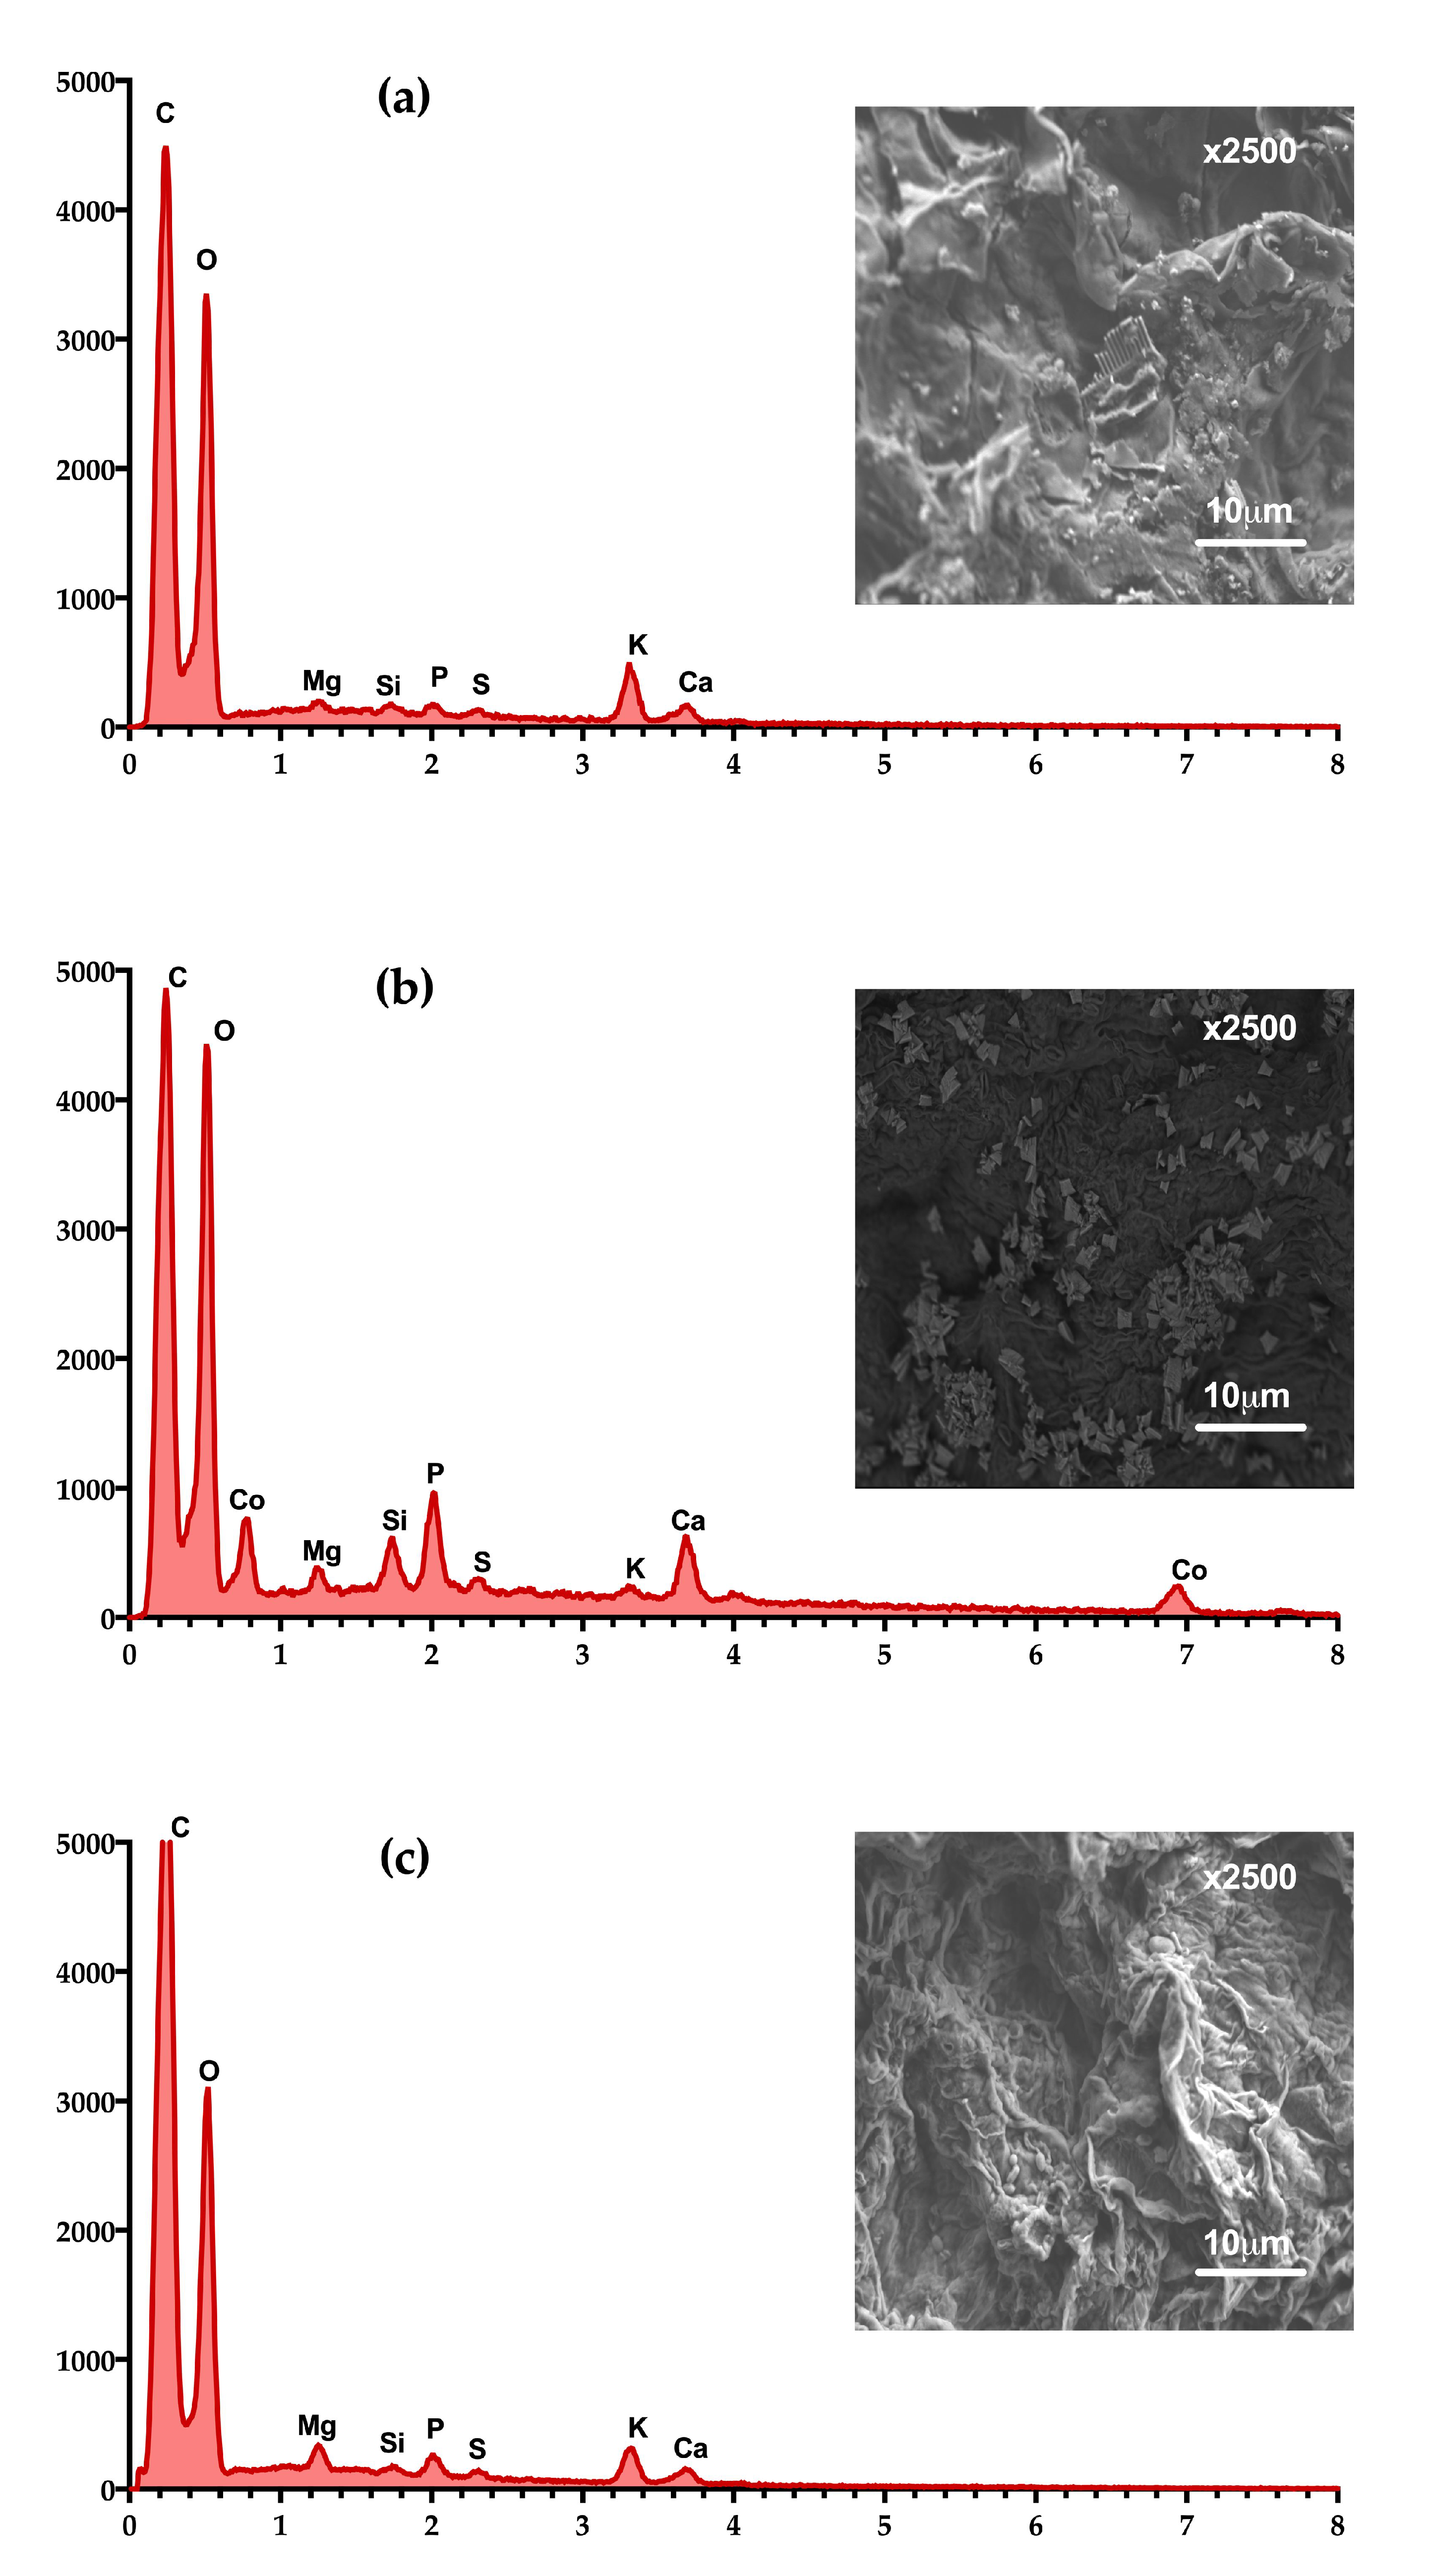
The SEM-EDX analysis of PLEM before exposure to Co2+ (Figure 6a) reveals a course and porous surface with agglomerations of the biosorbent. Hence, the surface is characterized by an ample exposure of the active sites for the capture of Co2+. The EDX spectra of PLEM evidences a surface free of Co2+.
The micrograph of PLEM saturated with Co2+ (Figure 6b) shows a more homogenous surface (on which rectangular particles are dispersed) than PLEM prior to contact with Co2+. The following desorption with 0.1 M HCl (Figure 6c), the appearance of the surface of PLEM is similar to that observed before exposure to Co2+. In the EDX spectrum, two peaks corresponding to Co2+ indicate its presence after the biosorption step (Figure 6b). The absence of such peaks after desorption (Figure 6c) evidenced the adequacy of the eluent solution for the total recovery of the metallic ion. Consequently, HCl was able to regenerate the biosorbent for posterior cycles of biosorption/desorption.

4. Conclusions

The results demonstrate that PLEM is an attractive, economical, sustainable, and environmentally friendly material for the removal of Co2+ from aqueous solutions. The capacity of biosorption of Co2+ by PLEM was enhanced by smaller particle size, a greater pH of the solution, and a higher initial concentration of the metal. The main mechanism of removal of Co2+ from the aqueous solution is physisorption based on electrostatic attraction. While the kinetics of the experimental biosorption data were adequately described by the pseudo-second-order model, the isotherms of biosorption at equilibrium at different temperatures were properly predicted by the Sips and Redlich-Peterson models. According to the thermodynamic study, the biosorption of Co2+ by PLEM is an endothermic and spontaneous process. The best eluent solution for the recovery of both the metal and the biosorbent material was 0.1 M HCl. PLEM can be used for at least three cycles of biosorption/desorption, with a high capacity of biosorption and complete desorption in each cycle, revealing the recyclability of the material, and therefore, the possibility of its economical use. The SEM-EDX analysis confirmed the biosorption of Co2+ by PLEM and the posterior desorption of the plant material by means of its exposure to 0.1 M HCl.

Author Contributions

Conceptualization, L.M.-B. and E.C.-U.; methodology, J.L.R.-L., L.M.-B. and E.C.-U.; software, J.L.R.-L.; validation, J.L.R.-L. and L.M.-B.; formal analysis, L.M.-B. and E.C.-U.; investigation, J.L.R.-L.; resources, L.M.-B. and E.C.-U.; writing—original draft preparation, review and editing, L.M.-B. and E.C.-U.; visualization, L.M.-B.; supervision, L.M.-B. and E.C.-U.; project administration, L.M.-B. and E.C.-U.; funding acquisition, L.M.-B. and E.C.-U. All authors have read and agreed to the published version of the manuscript.

Funding

This research was funded by the Instituto Politécnico Nacional, Secretaría de Investigación y Posgrado, project number: 20201814.

Acknowledgments

The authors are grateful for the technical support provided by the Centro de Nanociencias y Micro y Nanotecnologías, IPN. The CONACyT awarded a graduate scholarship to the coauthor J.L.R.-L., L.M.-B. and E.C.-U. hold grants from EDI-IPN, COFAA-IPN, and SNI-CONACYT. The authors thank Bruce Allan Larsen for proofreading the manuscript.

Conflicts of Interest

The authors declare that they have no conflict of interest.

References

  1. Vilvanathan, S.; Shanthakumar, S. Modeling of fixed-bed column studies for removal of cobalt ions from aqueous solution using Chrysanthemum indicum. Res. Chem. Intermed. 2017, 43, 229–243. [Google Scholar] [CrossRef]
  2. World Health Organization (WHO). Cobalt and Inorganic Cobalt Compounds. In Concise International Chemical Assessment Document 69; Kim, J.H., Gibb, H.J., Howe, P.D., Eds.; WHO: Geneva, Switzerland, 2006; pp. 1–84. Available online: https://apps.who.int/iris/handle/10665/43426 (accessed on 3 August 2020).
  3. He, E.-K.; Baas, J.; Van Gestel, C.A. Interaction between nickel and cobalt toxicity in Enchytraeus crypticusis due to competitive uptake. Environ. Toxicol. Chem. 2015, 34, 328–337. [Google Scholar] [CrossRef] [PubMed] [Green Version]
  4. Oguz, E.; Ersoy, M. Biosorption of cobalt(II) with sunflower biomass from aqueous solutions in a fixed bed column and neural networks modelling. Ecotoxicol. Environ. Saf. 2014, 99, 54–60. [Google Scholar] [CrossRef] [PubMed]
  5. Anirudhan, T.; Deepa, J.; Christa, J. Nanocellulose/nanobentonite composite anchored with multi-carboxyl functional groups as an adsorbent for the effective removal of Cobalt(II) from nuclear industry wastewater samples. J. Colloid Interface Sci. 2016, 467, 307–320. [Google Scholar] [CrossRef]
  6. Fawzy, M.A.; Hifney, A.F.; Adam, M.S.; Al-Badaani, A.A. Biosorption of cobalt and its effect on growth and metabolites of Synechocystis pevalekii and Scenedesmus bernardii: Isothermal analysis. Environ. Technol. Innov. 2020, 19, 100953. [Google Scholar] [CrossRef]
  7. Pipíška, M.; Trajteľová, Z.; Horník, M. Compartmentalization of Co and Mn in live cells of Escherichia coli: Investigation using 60Co and 54Mn as radioindicators. J. Radioanal. Nucl. Chem. 2017, 314, 1197–1205. [Google Scholar] [CrossRef]
  8. Pipíška, M.; Richveisová, B.M.; Frišták, V.; Horník, M.; Remenárová, L.; Stiller, R.; Soja, G. Sorption separation of cobalt and cadmium by straw-derived biochar: A radiometric study. J. Radioanal. Nucl. Chem. 2017, 311, 85–97. [Google Scholar] [CrossRef]
  9. Pipíška, M.; Zarodňanská, S.; Horník, M.; Ďuriška, L.; Holub, M.; Safarik, I. Magnetically Functionalized Moss Biomass as Biosorbent for Efficient Co2+ Ions and Thioflavin T Removal. Materials 2020, 13, 3619. [Google Scholar] [CrossRef] [PubMed]
  10. Robalds, A.; Naja, G.M.; Klavins, M. Highlighting inconsistencies regarding metal biosorption. J. Hazard. Mater. 2016, 304, 553–556. [Google Scholar] [CrossRef]
  11. Saman, N.; Tan, J.-W.; Mohtar, S.S.; Kong, H.; Lye, J.W.P.; Mat, H.; Hassan, H.; Mat, H. Selective biosorption of aurum(III) from aqueous solution using oil palm trunk (OPT) biosorbents: Equilibrium, kinetic and mechanism analyses. Biochem. Eng. J. 2018, 136, 78–87. [Google Scholar] [CrossRef]
  12. Moradi, P.; Hayati, S.; Ghahrizadeh, T. Modeling and optimization of lead and cobalt biosorption from water with Rafsanjan pistachio shell, using experiment based models of ANN and GP, and the grey wolf optimizer. Chemom. Intell. Lab. Syst. 2020, 202, 104041. [Google Scholar] [CrossRef]
  13. Muller da Cunha, J.; Klein, L.; Moro Bassaco, M.; Hiromitsu Tanabe, E.; Bertuol, D.A.; Dotto, G.L. Cobalt recovery from leached solutions of lithium-ion batteries using waste materials as adsorbents. Can. J. Chem. Eng. 2015, 93, 2198–2204. [Google Scholar] [CrossRef]
  14. Greenberg, B.M.; Huang, X.-D.; Dixon, D.G. Applications of the aquatic higher plant Lemna gibba for ecotoxicological assessment. J. Aquat. Ecosyst. Health 1992, 1, 147–155. [Google Scholar] [CrossRef]
  15. Arroyave, M.D. La lenteja de agua (Lemna minor L.): Una planta acuática promisoria. Rev. EIA 2004, 1, 33–38. Available online: http://www.scielo.org.co/scielo.php?script=sci_arttext&pid=S1794-12372004000100004&lng=en&tlng=es (accessed on 9 November 2020).
  16. Canales-Gutiérrez, Á. Evaluación de la biomasa y manejo de Lemna gibba (Lenteja de agua) en la bahía interior del lago titicaca, puno. Ecol. Apl. 2010, 9, 91–99. [Google Scholar] [CrossRef] [Green Version]
  17. Reyes-Ledezma, J.L. Biosorción de Co(II) a Partir de Soluciones Acuosas por Lemna sp. Master’s Thesis, Instituto Politécnico Nacional, Mexico City, Mexico, 2017. [Google Scholar]
  18. Reyes-Ledezma, J.L.; Uribe-Ramírez, D.; Cristiani-Urbina, E.; Morales-Barrera, L. Biosorptive removal of acid orange 74 dye by HCl-pretreated Lemna sp. PLoS ONE 2020, 15, e0228595. [Google Scholar] [CrossRef]
  19. Morales-Barrera, L.; Flores-Ortiz, C.M.; Cristiani-Urbina, E. Single and Binary Equilibrium Studies for Ni2+ and Zn2+ Biosorption onto Lemna Gibba from Aqueous Solutions. Processes 2020, 8, 1089. [Google Scholar] [CrossRef]
  20. Gupta, S.; Sharma, S.; Kumar, A. Biosorption of Ni(II) ions from aqueous solution using modified Aloe barbadensis Miller leaf powder. Water Sci. Eng. 2019, 12, 27–36. [Google Scholar] [CrossRef]
  21. Guo, Z.; Liu, X.; Huang, H. Kinetics and Thermodynamics of Reserpine Adsorption onto Strong Acidic Cationic Exchange Fiber. PLoS ONE 2015, 10, e0138619. [Google Scholar] [CrossRef] [Green Version]
  22. Zhao, Y.; Zhao, X.; Deng, J.; He, C. Utilization of chitosan–clinoptilolite composite for the removal of radiocobalt from aqueous solution: Kinetics and thermodynamics. J. Radioanal. Nucl. Chem. 2016, 308, 701–709. [Google Scholar] [CrossRef]
  23. Ramírez-Rodríguez, A.E.; Reyes-Ledezma, J.L.; Chávez-Camarillo, G.M.; Cristiani-Urbina, E.; Morales-Barrera, L. Cyclic biosorption and desorption of acid red 27 onto Eichhornia crassipes leaves. Rev. Mex. Ing. Química 2018, 17, 1121–1134. [Google Scholar] [CrossRef]
  24. Gramlich, A.; Moradi, A.B.; Robinson, B.H.; Kaestner, A.; Schulin, R. Dimethylglyoxime (DMG) staining for semi-quantitative mapping of Ni in plant tissue. Environ. Exp. Bot. 2011, 71, 232–240. [Google Scholar] [CrossRef]
  25. Yu, H.; Pang, J.; Ai, T.; Liu, L. Biosorption of Cu2+, Co2+ and Ni2+ from aqueous solution by modified corn silk: Equilibrium, kinetics, and thermodynamic studies. J. Taiwan Inst. Chem. Eng. 2016, 62, 21–30. [Google Scholar] [CrossRef]
  26. Tofan, L.; Teodosiu, C.; Paduraru, C.; Wenkert, R. Cobalt (II) removal from aqueous solutions by natural hemp fibers: Batch and fixed-bed column studies. Appl. Surf. Sci. 2013, 285 Pt A, 33–39. [Google Scholar] [CrossRef]
  27. Lee, M.-Y.; Hong, K.-J.; Kajiuchi, T.; Yang, J.-W. Determination of the efficiency and removal mechanism of cobalt by crab shell particles. J. Chem. Technol. Biotechnol. 2004, 79, 1388–1394. [Google Scholar] [CrossRef]
  28. Xu, H.; Liu, Y.; Tay, J.-H. Effect of pH on nickel biosorption by aerobic granular sludge. Bioresour. Technol. 2006, 97, 359–363. [Google Scholar] [CrossRef]
  29. Suazo-Madrid, A.; Morales-Barrera, L.; Aranda-García, E.; Cristiani-Urbina, E. Nickel(II) biosorption by Rhodotorula glutinis. J. Ind. Microbiol. Biotechnol. 2011, 38, 51–64. [Google Scholar] [CrossRef]
  30. Abbas, M.; Kaddour, S.; Trari, M. Kinetic and equilibrium studies of cobalt adsorption on apricot stone activated carbon. J. Ind. Eng. Chem. 2014, 20, 745–751. [Google Scholar] [CrossRef]
  31. Vijayaraghavan, K.; Yun, Y.-S. Bacterial biosorbents and biosorption. Biotechnol. Adv. 2008, 26, 266–291. [Google Scholar] [CrossRef]
  32. Volesky, B. Detoxification of metal-bearing effluents: Biosorption for the next century. Hydrometallurgy 2001, 59, 203–216. [Google Scholar] [CrossRef]
  33. Bulgariu, D.; Bulgariu, L. Potential use of alkaline treated algae waste biomass as sustainable biosorbent for clean recovery of cadmium(II) from aqueous media: Batch and column studies. J. Clean. Prod. 2016, 112, 4525–4533. [Google Scholar] [CrossRef]
  34. Mishra, A.; Tripathi, B.D.; Rai, A.K. Packed-bed column biosorption of chromium(VI) and nickel(II) onto Fenton modified Hydrilla verticillata dried biomass. Ecotoxicol. Environ. Saf. 2016, 132, 420–428. [Google Scholar] [CrossRef] [PubMed]
  35. Vilvanathan, S.; Shanthakumar, S. Biosorption of Co(II) ions from aqueous solution using Chrysanthemum indicum: Kinetics, equilibrium and thermodynamics. Process. Saf. Environ. Prot. 2015, 96, 98–110. [Google Scholar] [CrossRef]
  36. Kılıç, M.; Kırbıyık, Ç.; Çepelioğullar, Ö.; Putun, A.E. Adsorption of heavy metal ions from aqueous solutions by bio-char, a by-product of pyrolysis. Appl. Surf. Sci. 2013, 283, 856–862. [Google Scholar] [CrossRef]
  37. Thilagavathy, P.; Santhi, T. Kinetics, Isotherms and Equilibrium Study of Co(II) Adsorption from Single and Binary Aqueous Solutions by Acacia nilotica Leaf Carbon. Chin. J. Chem. Eng. 2014, 22, 1193–1198. [Google Scholar] [CrossRef]
  38. Rangabhashiyam, S.; Anu, N.; Nandagopal, M.S.G.; Selvaraju, N. Relevance of isotherm models in biosorption of pollutants by agricultural byproducts. J. Environ. Chem. Eng. 2014, 2, 398–414. [Google Scholar] [CrossRef]
  39. Hymavathi, D.; Prabhakar, G. Optimization, equilibrium, and kinetic studies of adsorptive removal of cobalt(II) from aqueous solutions using Cocos nucifera L. Chem. Eng. Commun. 2017, 204, 1094–1104. [Google Scholar] [CrossRef]
  40. Imessaoudene, D.; Hanini, S.; Bouzidi, A.; Ararem, A. Kinetic and thermodynamic study of cobalt adsorption by spent coffee. Desalin. Water Treat. 2015, 57, 6116–6123. [Google Scholar] [CrossRef]
  41. Marešová, J.; Pipíška, M.; Rozložník, M.; Horník, M.; Remenárová, L.; Augustín, J. Cobalt and strontium sorption by moss biosorbent: Modeling of single and binary metal systems. Desalination 2011, 266, 134–141. [Google Scholar] [CrossRef]
  42. Demirbaş, E. Adsorption of Cobalt(II) Ions from Aqueous Solution onto Activated Carbon Prepared from Hazelnut Shells. Adsorpt. Sci. Technol. 2003, 21, 951–963. [Google Scholar] [CrossRef]
  43. Lucaci, A.R.; Bulgariu, D.; Ahmad, I.; Bulgariu, L. Equilibrium and Kinetics Studies of Metal Ions Biosorption on Alginate Extracted from Marine Red Algae Biomass (Callithamnion corymbosum sp.). Polymers 2020, 12, 1888. [Google Scholar] [CrossRef] [PubMed]
  44. Vijayaraghavan, K.; Jegan, J.; Palanivelu, K.; Velan, M. Biosorption of cobalt(II) and nickel(II) by seaweeds: Batch and column studies. Sep. Purif. Technol. 2005, 44, 53–59. [Google Scholar] [CrossRef]
  45. Bhatnagar, A.; Minocha, A.; Sillanpää, M. Adsorptive removal of cobalt from aqueous solution by utilizing lemon peel as biosorbent. Biochem. Eng. J. 2010, 48, 181–186. [Google Scholar] [CrossRef]
  46. Lakshmipathy, R.; Sarada, N. Application of watermelon rind as sorbent for removal of nickel and cobalt from aqueous solution. Int. J. Miner. Process. 2013, 122, 63–65. [Google Scholar] [CrossRef]
  47. Vilvanathan, S.; Shanthakumar, S. Removal of Ni(II) and Co(II) ions from aqueous solution using teak (Tectona grandis) leaves powder: Adsorption kinetics, equilibrium and thermodynamics study. Desalin. Water Treat. 2016, 57, 3995–4007. [Google Scholar] [CrossRef]
  48. Dabbagh, R.; Moghaddam, Z.A.; Ghafourian, H. Removal of cobalt(II) ion from water by adsorption using intact and modified Ficus carica leaves as low-cost natural sorbent. Desalin. Water Treat. 2016, 57, 19890–19902. [Google Scholar] [CrossRef]
  49. Singh, S.A.; Shukla, S.R. Adsorptive removal of cobalt ions on raw and alkali-treated lemon peels. Int. J. Environ. Sci. Technol. 2016, 13, 165–178. [Google Scholar] [CrossRef] [Green Version]
  50. Ahmadpour, A.; Tahmasbi, M.; Bastami, T.R.; Besharati, J.A. Rapid removal of cobalt ion from aqueous solutions by almond green hull. J. Hazard. Mater. 2009, 166, 925–930. [Google Scholar] [CrossRef]
  51. Nadeem, R.; Zafar, M.N.; Afzal, A.; Hanif, M.A.; Saeed, R. Potential of NaOH pretreated Mangifera indica waste biomass for the mitigation of Ni(II) and Co(II) from aqueous solutions. J. Taiwan Inst. Chem. Eng. 2014, 45, 967–972. [Google Scholar] [CrossRef]
  52. Bhattacharyya, K.G.; Gupta, S.S. Removal of Cu(II) by natural and acid-activated clays: An insight of adsorption isotherm, kinetic and thermodynamics. Desalination 2011, 272, 66–75. [Google Scholar] [CrossRef]
  53. Ye, W.-M.; He, Y.; Chen, Y.-G.; Chen, B.; Cui, Y.J. Adsorption, Desorption and Competitive Adsorption of Heavy Metal Ions from Aqueous Solution onto GMZ01 Bentonite. In Engineering Geology for Society and Territory; Lollino, G., Giordan, D., Thuro, K., Carranza-Torres, C., Wu, F., Marinos, P., Delgado, C., Eds.; Springer International Publishing: Cham, Switzerland, 2015; Volume 6, pp. 533–536. [Google Scholar]
  54. Zhang, X.; Wang, X. Adsorption and Desorption of Nickel(II) Ions from Aqueous Solution by a Lignocellulose/Montmorillonite Nanocomposite. PLoS ONE 2015, 10, e0117077. [Google Scholar] [CrossRef] [PubMed] [Green Version]
  55. Ronda, A.; Calero, M.; Blázquez, G.; Pérez, A.; Martín-Lara, M.Á. Optimization of the use of a biosorbent to remove heavy metals: Regeneration and reuse of exhausted biosorbent. J. Taiwan Inst. Chem. Eng. 2015, 51, 109–118. [Google Scholar] [CrossRef]
Figure 1. Capacity of biosorption of Co2+ by pretreated Lemna gibba (PLEM): (a) At various pH values of the solution (Cini = 100 mg L−1, particle size = 0.3–0.5 mm), (b) with distinct particle sizes of PLEM (Cini = 100 mg L−1, pH = 7.0), and (c) at different initial concentrations of the metal (pH = 7.0, particle size = 0.3–0.8 mm). The continuous lines were predicted by the pseudo-second-order kinetic model.
Processes 08 01532 g001
Figure 2. Isotherms for the adsorption of Co2+ by PLEM at the following temperatures: (a) 18 °C, (b) 30 °C, (c) 40 °C, (d) 50 °C, and (e) 60 °C (pH = 7.0, particle size = 0.3–0.8 mm).
Processes 08 01532 g002
Figure 3. Graphs based on the values of (a) Ln Kd vs. Ceq and (b) ΔG0 vs. T, which were used to calculate the thermodynamic parameters of biosorption of Co2+ by PLEM.
Processes 08 01532 g003
Figure 4. Kinetics of desorption of Co2+ from PLEM with distinct eluent solutions.
Processes 08 01532 g004
Figure 5. (a) Capacity of biosorption and (b) the percentage of desorption of Co2+ by PLEM during three cycles of biosorption/desorption.
Processes 08 01532 g005
Figure 6. SEM and EDX micrograph of PLEM during the first biosorption/desorption cycle: (a) Before exposure to Co2+, (b) saturated with Co2+, and (c) subsequent to desorption of the biosorbent with 0.1 M HCl.
Processes 08 01532 g006
Table 1. Biosorption models were tested.
Kinetic ModelsEquationParameters
Pseudo-first-order [18] q = q e q 1 [ 1 e ( k 1 t ) ] k1—pseudo-first-order sorption velocity constant (min−1)
qeq1—equilibrium biosorption capacity predicted by the model (mg g−1)
Pseudo-second-order [18] q = t ( 1 k 2 q e q 2 2 ) + ( t q e q ) k2—pseudo-second-order sorption velocity constant (g mg−1 min−1)
qeq2—equilibrium biosorption capacity predicted by the model (mg g−1)
Fractional power [18] q = k F P t v kFP—constant of the model (mg g−1)
ν—velocity constant (h−1)
Isothermal modelsEquationParameters
Langmuir [19,20] q e q = q m L   b L C e q 1 + b L C e q
R L = 1 1 + b L C i n i
qmL—maximum biosorption capacity determined by Langmuir (mg g−1)
bL—Langmuir constant, linked to affinity for the active sites (L mg−1)
Cini—initial concentration (mg L−1)
RL—separation factor
Freundlich [19] q e q = k F   C e q 1 n F kF—Freundlich constant, related to the biosorption capacity (mg g−1 (mg L−1)−1/nF)
nF—Freundlich constant, linked to the intensity of sorption
Sips [19] q e q = q m S P   k S P   C e q n S P 1 + k S P   C e q n S P qmSP—maximum biosorption capacity, determined by Sips (mg g−1)
kSP—constant of the model (mg L−1)−nSP
nSP—exponent of the model
Redlich-Peterson [19] q e q = k R P   C e q 1 + a R P   C e q b R P kRP—constant of the model (L g−1)
aRP—constant of the model (mg L−1) −bRP
bRP—exponent of the model
Table 2. Kinetic parameters of the biosorption of Co2+ by PLEM at various pH values of the solution (Cini = 100 mg L−1, particle size = 0.3–0.5 mm).
ParameterpH
4.05.06.07.0
qeq (mg g−1)12.35 ± 0.0917.85 ± 0.0829.78 ± 0.1840.13 ± 0.18
teq (h)0.250.250.250.5
Pseudo-first-order
qeq1 (mg g−1)12.19 ± 0.1517.51 ± 0.1329.20 ± 0.2238.80 ± 0.26
k1 (h−1)18.81 ± 0.9825.03 ± 1.1141.79 ± 2.3234.96 ± 1.59
R20.97400.97570.96990.9777
ASE17.57033.360104.200139.400
Sy.x0.64680.78601.3891.607
AICc−33.79−22.5441.2557.55
Pseudo-second-order
qeq2 (mg g−1)13.69 ± 0.2218.61 ± 0.1130.57 ± 0.1640.86 ± 0.09
k2 (g mg−1 h−1)1.88 ± 0.172.28 ± 0.102.51 ± 0.131.50 ± 0.03
R20.9750.9900.9890.998
ASE16.8113.7535.2312.31
Sy.x0.63270.50460.80770.4775
AICc−35.73−72.18−19.50−78.37
Fractional power
kFP (mg g−1)15.03 ± 0.5618.37 ± 0.3330.61 ± 0.3940.85 ± 0.52
v (h−1)0.211 ± 0.020.107 ± 0.010.073 ± 0.0070.086 ± 0.008
R20.7580.6760.6670.7293
ASE68.31133.90190.00342.90
Sy.x1.3411.6371.9492.619
AICc55.7080.4973.88104.6
Table 3. Kinetic parameters of the biosorption of Co2+ by PLEM, using different particle sizes (Cini = 100 mg L−1, pH = 7.0).
ParameterParticle Size (mm)
0.3–0.50.5–0.80.8–1.41.4–20.3–0.8
qeq (mg g−1)40.13 ± 0.1839.77 ± 0.2533.38 ± 0.1732.25 ± 0.0740.05 ± 0.16
teq (h)0.50.751.01.00.5
Pseudo-first-order
qeq1 (mg g−1)38.80 ± 0.2638.01 ± 0.2931.74 ± 0.3230.91 ± 0.3138.76 ± 0.25
k1 (h−1)34.96 ± 1.5936.02 ± 1.9813.66 ± 0.6212.41 ± 0.5235.08 ± 1.56
R20.9780.9680.9690.9730.979
ASE139.4191.9154.2130.8134.0
Sy.x1.6071.8851.6901.5561.575
AICc57.5575.4363.2053.9755.32
Pseudo-second-order
qeq2 (mg g−1)40.86 ± 0.0940.07 ± 0.1034.45 ± 0.2333.64 ± 0.1940.80 ±0.09
k2 (g mg−1 h−1)1.50 ± 0.031.55 ± 0.040.61 ± 0.020.56 ± 0.021.52 ± 0.09
R20.9980.9980.9910.9940.998
ASE12.3114.6646.0427.9811.73
Sy.x0.4780.5210.9230.7200.466
AICc−78.37−68.58−4.504−32.39−81.09
Fractional power
kFP (mg g−1)40.85 ± 0.5240.18 ± 0.4533.06 ± 0.5832.02 ± 0.5940.78 ± 0.52
v (h−1)0.09 ± 0.010.09 ± 0.010.17 ± 0.010.18 ± 0.010.08 ± 0.01
R20.7290.7810.8190.8140.723
ASE342.9256.4422.2453.9348.1
Sy.x2.6192.2652.9063.0132.638
AICc104.689.47115.4119.2105.4
Table 4. Kinetic parameters of the biosorption of Co2+ by PLEM at various initial concentrations of the metal (particle size = 0.3–0.8 mm, pH = 7.0).
ParameterCini (mg L−1)
1020406080100200300
qeq (mg g−1)5.46 ± 0.1612.18 ± 0.2020.20 ± 0.1329.22 ± 0.1936.44 ± 0.4840.05 ± 0.1644.22 ± 0.3146.17 ± 0.41
teq (h)0.050.080.160.20.50.50.750.75
Pseudo-first-order
qeq1 (mg g−1)5.71 ± 0.0312.44 ± 0.0719.95 ± 0.1428.64 ± 0.2334.53 ± 0.4138.76 ± 0.2541.56 ± 0.4643.81 ± 0.42
k1 (h−1)24.01 ± 0.8525.00 ± 0.8132.93 ± 1.5834.58 ± 1.9135.81 ± 2.9435.08 ± 1.5633.50 ± 2.5337.68 ± 2.58
R20.98530.98710.97410.96660.92880.97850.93710.9514
ASE2.3248.89443.08113.9356.2134.0456.9384.9
Sy.x0.20750.40580.89321.4522.5681.5752.9092.670
AICc−171.7−96.58−8.22146.20110.155.32124.0114.4
Pseudo-second-order
qeq2 (mg g−1)6.05 ± 0.0913.15 ± 0.0920.97 ± 0.1030.13 ± 0.1536.52 ± 0.2740.80 ± 0.0944.03 ± 0.2646.19 ± 0.23
k2 (g mg−1 h−1)6.85 ± 0.763.37 ± 0.202.85 ± 0.132.06 ± 0.091.65 ± 0.111.52 ± 0.031.27 ± 0.071.40 ± 0.07
R20.94560.98300.99150.99150.98040.99810.98820.9912
ASE8.61711.7414.1729.0298.2511.7385.7869.72
Sy.x0.39950.46630.51220.73311.3490.46601.2601.136
AICc−98.35−81.02−70.50−30.3437.94−81.0930.3418.74
Fractional power
kFP (mg g−1)5.89 ± 0.1612.92 ± 0.2620.84 ± 0.3230.05 ± 0.4236.85 ± 0.3640.78 ± 0.5344.33 ± 0.4146.49 ± 0.46
v (h−1)0.099 ± 0.020.099 ± 0.010.083 ± 0.0090.083 ± 0.0080.095 ± 0.0050.085 ± 0.0070.098 ± 0.0050.088 ± 0.006
R20.45810.59350.64020.68450.84630.72260.86750.8184
ASE31.4684.08128.5218.8157.8348.1206.0269.9
Sy.x0.79321.2971.6032.0921.7772.6382.0302.323
AICc−19.6331.4853.5381.2164.23105.478.0892.13
Table 5. Isotherms for the biosorption of Co2+ by PLEM.
ParameterTemperature (°C)
1830405060
qm exp (mg g−1)46.17 ± 0.4146.33 ± 0.1947.73 ± 0.1248.49 ± 0.2149.35 ± 0.22
Langmuir
bL (L mg−1)0.047 ± 0.0050.046 ± 0.0050.046 ± 0.0040.045 ± 0.0030.048 ± 0.006
qmL (mg g−1)51.12 ± 1.4952.66 ± 1.8252.78 ± 1.4854.97 ± 1.2755.57 ± 1.91
RL0.508 − 0.0680.509 − 0.0730.508 − 0.0750.513 − 0.0760.498 − 0.071
R20.9930.9900.9930.9960.990
ASE13.6519.1812.98.85621.46
Sy.x1.5081.7881.4661.2151.891
AICc16.2818.9915.8212.8119.89
Freundlich
kF (mg g−1 (L g−1)1/nF)11.05 ± 2.6510.82 ± 2.6610.6 ± 2.3910.94 ± 2.4311.71 ± 2.80
nF3.64 ± 0.703.504 ± 0.673.433 ± 0.593.422 ± 0.583.53 ± 0.67
R20.9240.9220.9380.9390.926
ASE140.7150.4120.7126161
Sy.x4.8425.0064.4844.5825.179
AICc34.9435.4733.7134.0536.01
Sips
kSP (L g−1)0.022 ± 0.0050.018 ± 0.0050.022 ± 0.0050.026 ± 0.0040.023 ± 0.008
qmSP (mg g−1)47.55 ± 1.02648.25 ± 1.06548.79 ± 1.12251.57 ± 0.97551.55 ± 1.677
nSP1.295 ± 0.0861.367 ± 0.0951.294 ± 0.0921.224 ± 0.0661.304 ± 0.131
R20.9980.9980.9980.9990.996
ASE3.7134.384.0552.5049.674
Sy.x0.86170.9360.9000.70771.391
AICc15.1916.5115.912.0422.85
Redlich-Peterson
kRP (L g−1)1.822 ± 0.0961.789 ± 0.1262.006 ± 0.2221.964 ± 0.0991.996 ± 0.178
aRP (L mg−1)bRP0.017 ± 0.0030.014 ± 0.0040.023 ± 0.0090.019 ± 0.0040.015 ± 0.006
bRP1.142 ± 0.0291.171 ± 0.0441.095 ± 0.0571.116 ± 0.0281.162 ± 0.054
R20.9990.9980.9960.9990.997
ASE2.1114.1977.7741.8247.069
Sy.x0.64980.91621.2470.6041.189
AICc10.6816.1721.19.50720.34
Table 6. Capacity for the biosorption of Co2+ by different materials.
MaterialBiosorption Capacity (mg g−1)pHReference
Cocos nucifera leaf3.695[39]
Spent coffee5.376[40]
Rhytidiadelphus squarrosus7.386[41]
Natural hemp fibers13.584.5–5[26]
Activated carbon from hazelnut shells13.886[42]
Alginate from Callithamnion corymbosum sp.18.794.4[43]
Sargassum wightii20.634.5[44]
Carbonized lemon peel22.006[45]
Watermelon rind23.305[46]
Prunus dulcis bio-char27.867[36]
Teak leaves29.485[47]
MgCl2-pretreated Ficus carica leaves33.96[48]
Acacia nilotica35.455[37]
NaOH-treated lemon peels35.716[49]
Almond green hull45.50ND[50]
PLEM46.477The present study
Corn silk82.046[25]
NaOH-pretreated Mangifera indica leaves1145[51]
ND, no data.
Table 7. Thermodynamic parameters of biosorption of Co2+ by PLEM.
Temperature °CΔG0 (J mol−1)ΔH0 (J mol−1)ΔS0 (J mol−1 K−1)
18−684.82461.310.81 ± 1.89
30−804.32471.6
40−825.02558.8
50−959.42532.6
60−1172.12427.9
Publisher’s Note: MDPI stays neutral with regard to jurisdictional claims in published maps and institutional affiliations.