Adsorption of CO2 on Amine-Modified Silica Particles in a Confined-Fluidized Bed

 ,
, 
 ,
,
Abstract
:
1. Introduction
2. Materials and Methods
2.1. Experimental Apparatus
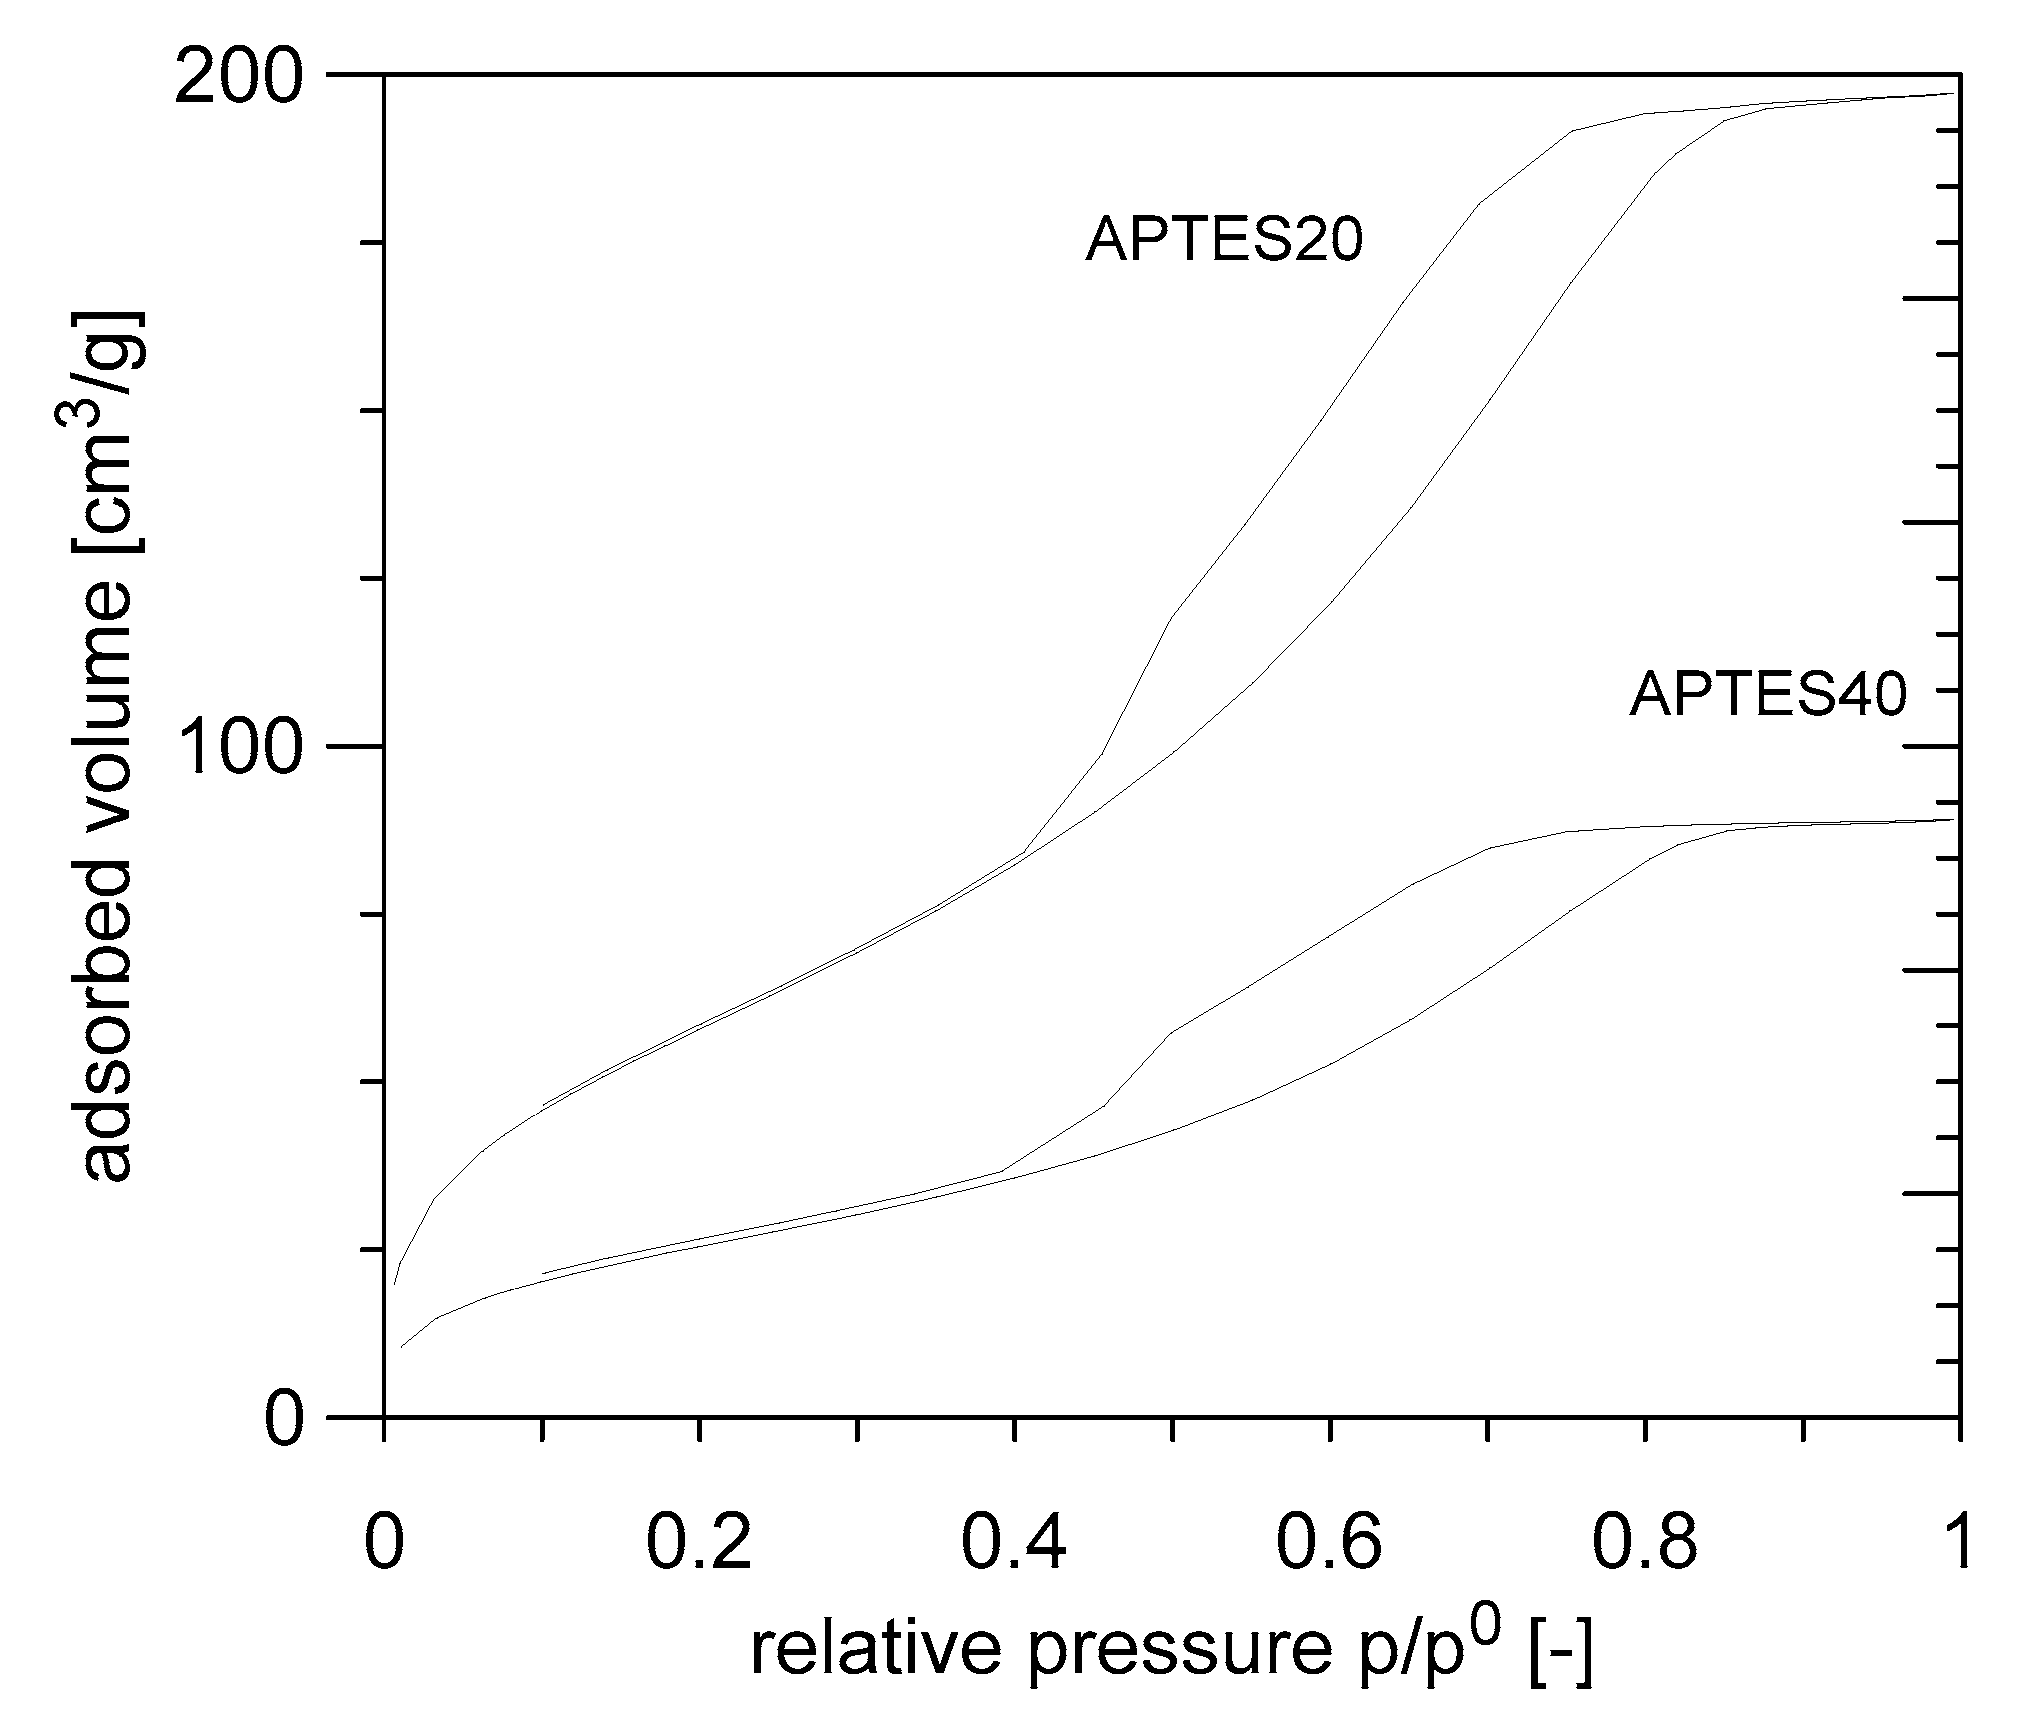
2.2. Adsorbent Preparation and Characterization
2.3. Fluid-Dynamic Characterization
3. Results
3.1. Test on As-Made Silica
3.2. Test on Amino-Functionalized Silica
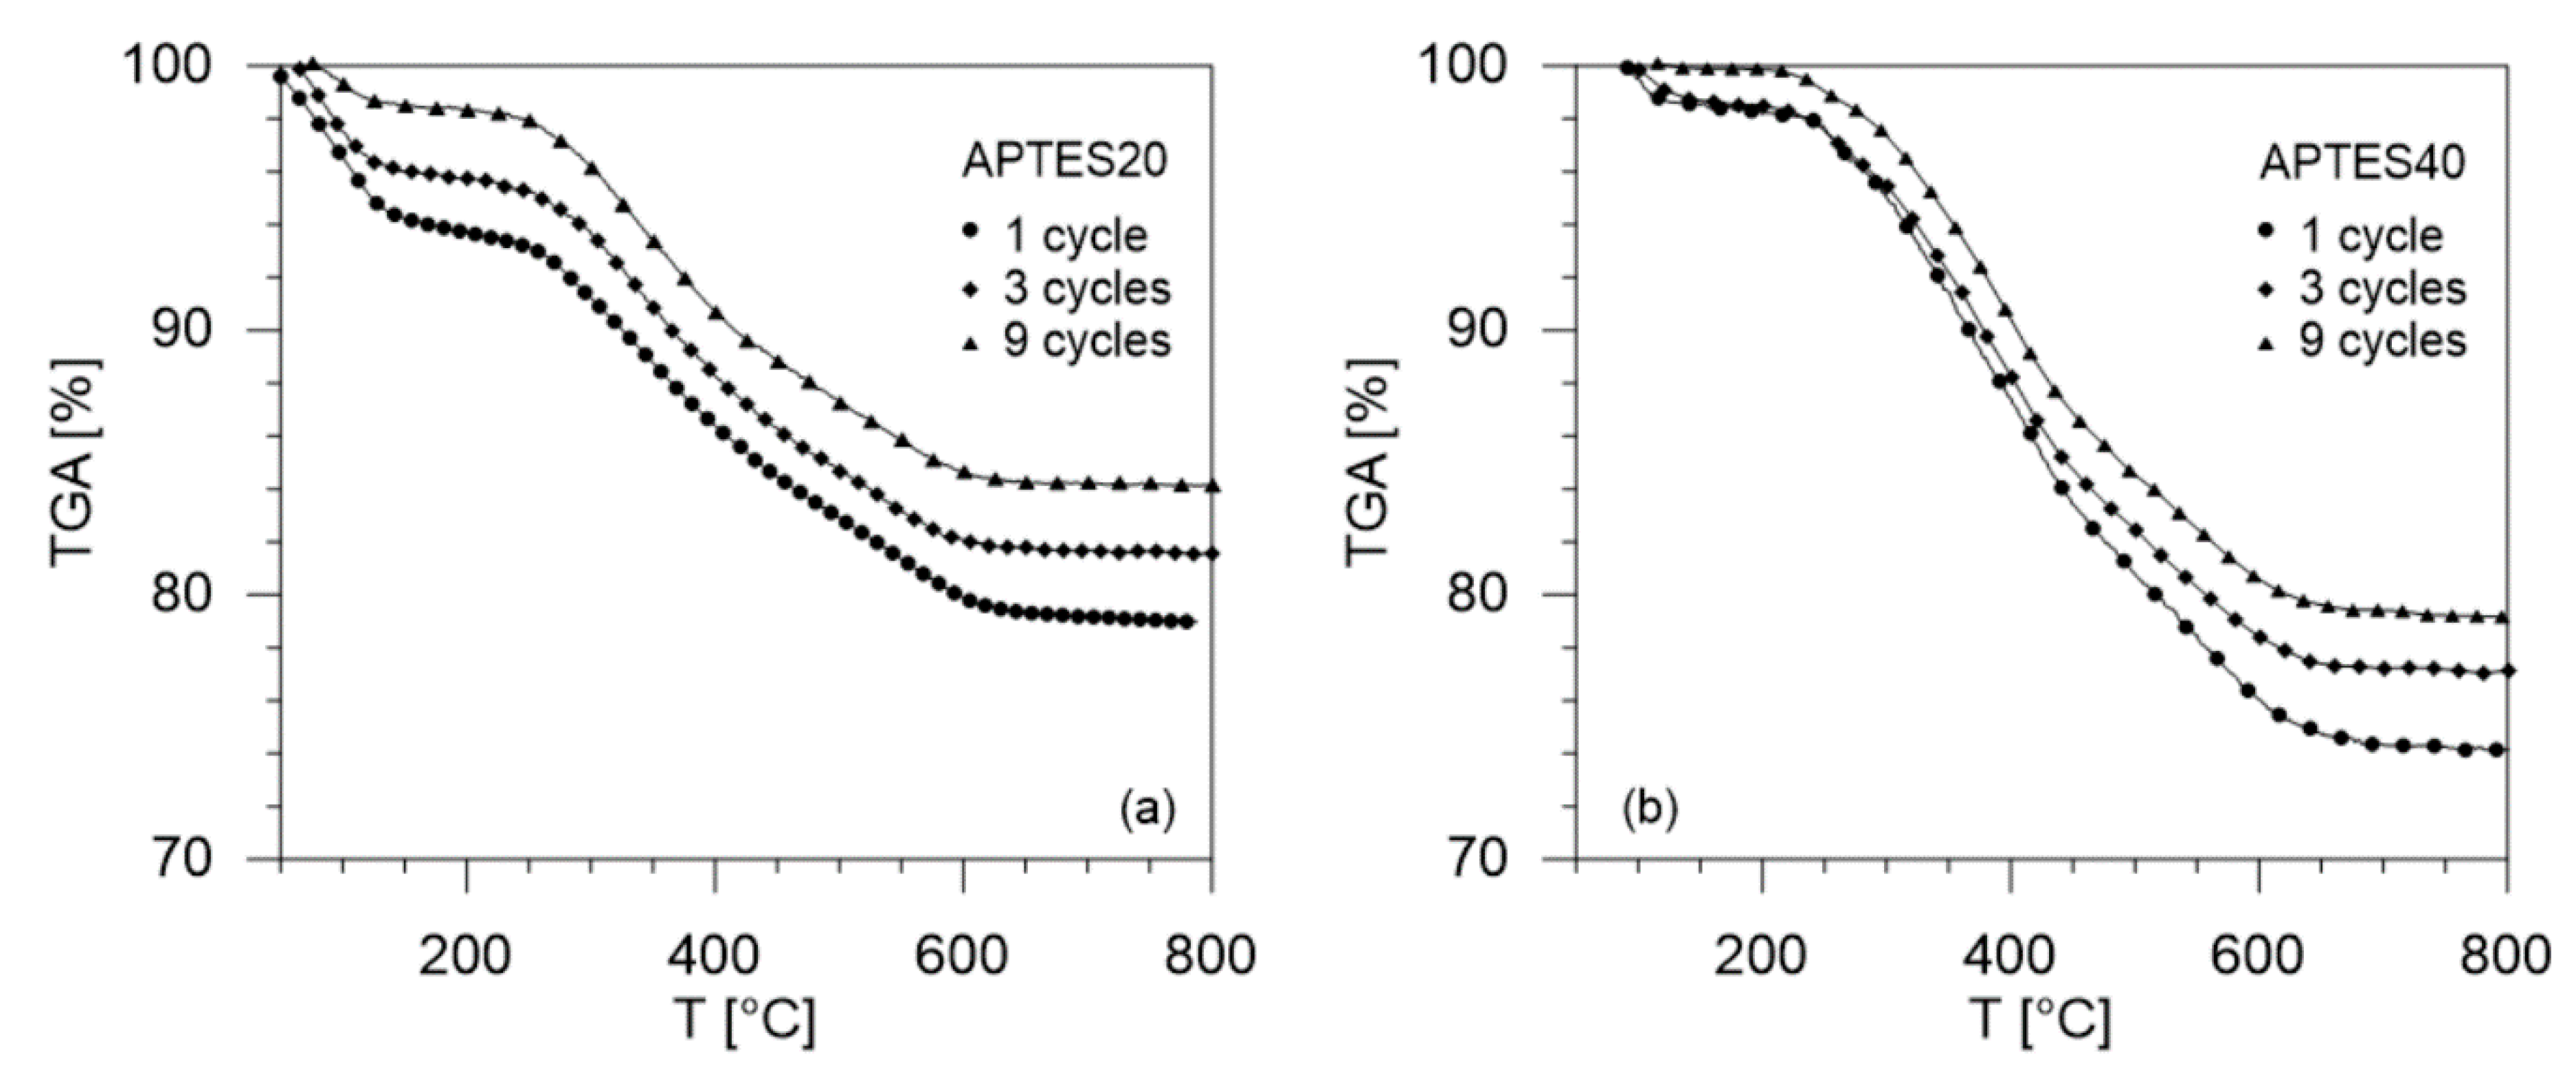
3.3. Thermal Stability
4. Discussion and Conclusions
Author Contributions
Funding
Acknowledgments
Conflicts of Interest
Notation
| A | column section, cm2 |
| C/C0 | dimensionless CO2 fraction in the effluent gas, - |
| D | column diameter, cm |
| dV | volume diameter of sorbent, μm |
| Hfc | sorbent height in confined bed, cm |
| mCO2 | mass of CO2 adsorbed per unit mass of sorbent, mgCO2/g sorbent, |
| m | mass of sorbent bed, g |
| n | expansion index, - |
| Qair | volumetric flow rate of air, cm3/s |
| QCO2 | volumetric flow rate of gas mixture, cm3/s |
| Qmix | volumetric flow rate of gas mixture, cm3/s |
| t | time, s |
| tb | breakthrough time in the confined bed, s |
| tc | contact time in the confined bed, s |
| ts | saturation time in the confined bed, s |
| T | temperature in the middle of the confined fluidized bed, °C |
| Tmax | maximum temperature in the middle of the confined fluidized bed, °C |
| u | superficial gas velocity, cm/s |
| umfc | minimum fluidization velocity of the confined bed, cm/s |
| u0 | maximum expansion velocity of the confined bed, cm/s |
| V | geometrical volume of the solid, cm3 |
| Vopen | volume available to gas, cm3 |
| W | fraction of bed utilized at breakpoint, % |
| xCO2 | CO2 fraction in the inlet gas, % vol |
Greek Symbols
| ΔPconf | pressure drop in the confined system, Pa |
| ε | voidage in the packed-fluidized bed, - |
| εfc | voidage of the equivalent conventional bed, - |
| εp | voidage of the packed bed, - |
| ρ | particle density of solid, kg/m3 |
References
- Harvey, C.; Gronewold, N. CO2 emissions will break another record in 2019. E&E News, 4 December 2019. [Google Scholar]
- Wang, Y.; Zhao, L.; Otto, A.; Robinius, M.; Stolten, D. A Review of post-combustion CO2 capture technologies from coal-fired power plants, energy. Procedia 2017, 114, 650–665. [Google Scholar]
- Haszeldine, R.S. Carbon Capture and Storage: How Green Can Black Be? Science 2009, 325, 1647–1651. [Google Scholar] [CrossRef] [PubMed]
- Rochelle, G.T. Amine Scrubbing for CO2 Capture. Science 2009, 325, 1652–1654. [Google Scholar] [CrossRef] [PubMed]
- Choi, S.; Drese, J.H.; Jones, C.W. Adsorbent Materials for Carbon Dioxide Capture from Large Anthropogenic Point Sources. ChemSusChem 2009, 2, 796–854. [Google Scholar] [CrossRef]
- Sayari, A.; Belmabkhout, Y.; Serna-Guerrero, R. Flue Gas treatment via CO2 adsorption. Chem. Eng. J. 2011, 171, 760–774. [Google Scholar] [CrossRef]
- Yu, C.-H.; Huang, C.-H.; Tan, C.-S. A review of CO2 capture by absorption and adsorption. Aerosol Air Qual. Res. 2012, 12, 745–769. [Google Scholar] [CrossRef] [Green Version]
- Quang, D.V.; Rabindran, A.V.; El Hadri, N.; Abu-Zahra, M.R.M. Reduction in the regeneration energy of CO2 capture process by impregnating amine solvent onto precipitated silica. Eur. Sci. J. 2013, 9, 82–102. [Google Scholar]
- Wang, Z.L.; Ding, Y.L.; Ghadiri, M. Flow of a gas–solid two-phase mixture through a packed bed. Chem. Eng. Sci. 2004, 59, 3071–3079. [Google Scholar] [CrossRef]
- Girimonte, R.; Vivacqua, V. The expansion process of particle beds fluidized in the voids of a packing of coarse spheres. Powder Technol. 2011, 213, 63–69. [Google Scholar] [CrossRef]
- Girimonte, R.; Vivacqua, V. Design criteria for homogeneous fluidization of Geldart’s class B solids upward through a packed bed. Powder Technol. 2013, 249, 316–322. [Google Scholar] [CrossRef]
- Girimonte, R.; Vivacqua, V.; Formisani, B. Extension of the model of binary fluidization to beds confined in a packing of coarse spheres. Powder Technol. 2016, 297, 275–282. [Google Scholar] [CrossRef]
- Girimonte, R.; Formisani, B.; Testa, F. Adsorption of CO2 on a confined fluidized bed of pelletized 13X zeolite. Powder Technol. 2017, 311, 9–17. [Google Scholar] [CrossRef]
- Girimonte, R.; Formisani, B.; Testa, F. CO2 adsorption in a confined fluidized bed of zeolite pellets: Influence of operating velocity. Particuology 2019, 46, 67–74. [Google Scholar] [CrossRef]
- Abrahamsen, A.R.; Geldart, D. Behaviour of gas-fluidized beds of fine powders, part I. Homogeneous expansion. Powder Technol. 1980, 26, 35–46. [Google Scholar] [CrossRef]
- Brunauer, S.; Emmett, P.H.; Teller, E. Adsorption of gas in multimolecular layers. J. Am. Chem. Soc. 1938, 60, 309–319. [Google Scholar] [CrossRef]
- Barrett, E.P.; Joyner, L.G.; Halenda, P.P. The Determination of Pore Volume and Area Distributions in Porous Substances. I. Computations from Nitrogen Isotherms. J. Am. Chem. Soc. 1951, 73, 373–380. [Google Scholar] [CrossRef]
- Thommes, M.; Kaneko, K.; Neimark, A.V.; Olivier, J.P.; Rodriguez-Reinoso, F.; Rouquerol, J.; Sing, K.S.W. Physisorption of gases, with special reference to the evaluation of surface area and pore size distribution (IUPAC Technical Report). Pure Appl. Chem. 2015, 87, 1051–1069. [Google Scholar] [CrossRef] [Green Version]
- Quang, D.V.; Hatton, T.A.; Abu-Zahra, M.R.M. Thermally stable amine-grafted adsorbent prepared by impregnating 3-Aminopropyltriethoxysilane on mesoporous silica for CO2 capture. Ind. Eng. Chem. Res. 2016, 55, 7841–7852. [Google Scholar] [CrossRef]
- Xu, X.; Song, C.; Andresen, J.M.; Miller, B.G.; Scaroni, A.W. Novel Polyethylenimine-Modified Mesoporous Molecular Sieve of MCM-41 Type as High-Capacity Adsorbent for CO2 Capture. Energy Fuels 2002, 16, 1463–1469. [Google Scholar] [CrossRef]
- Sayari, A.; Belmabkhout, Y. Stabilization of amine-containing CO2 adsorbents: Dramatic effect of water vapour. J. Am. Chem. Soc. 2010, 132, 6312–6314. [Google Scholar] [CrossRef]
- Leal, O.; Bolívar, C.; Ovalles, C.; García, J.J.; Espidel, Y. Reversible adsorption of carbon dioxide on amine surface-bonded silica. Inorg. Chim. Acta 1995, 240, 183–189. [Google Scholar] [CrossRef]


| Sieve Size [μm] | d10% [μm] | d50% [μm] | d90% [μm] | Span [-] | dv [μm] | φ [-] |
|---|---|---|---|---|---|---|
| 400–500 | 346 | 509 | 736 | 0.768 | 527 | 0.75 |
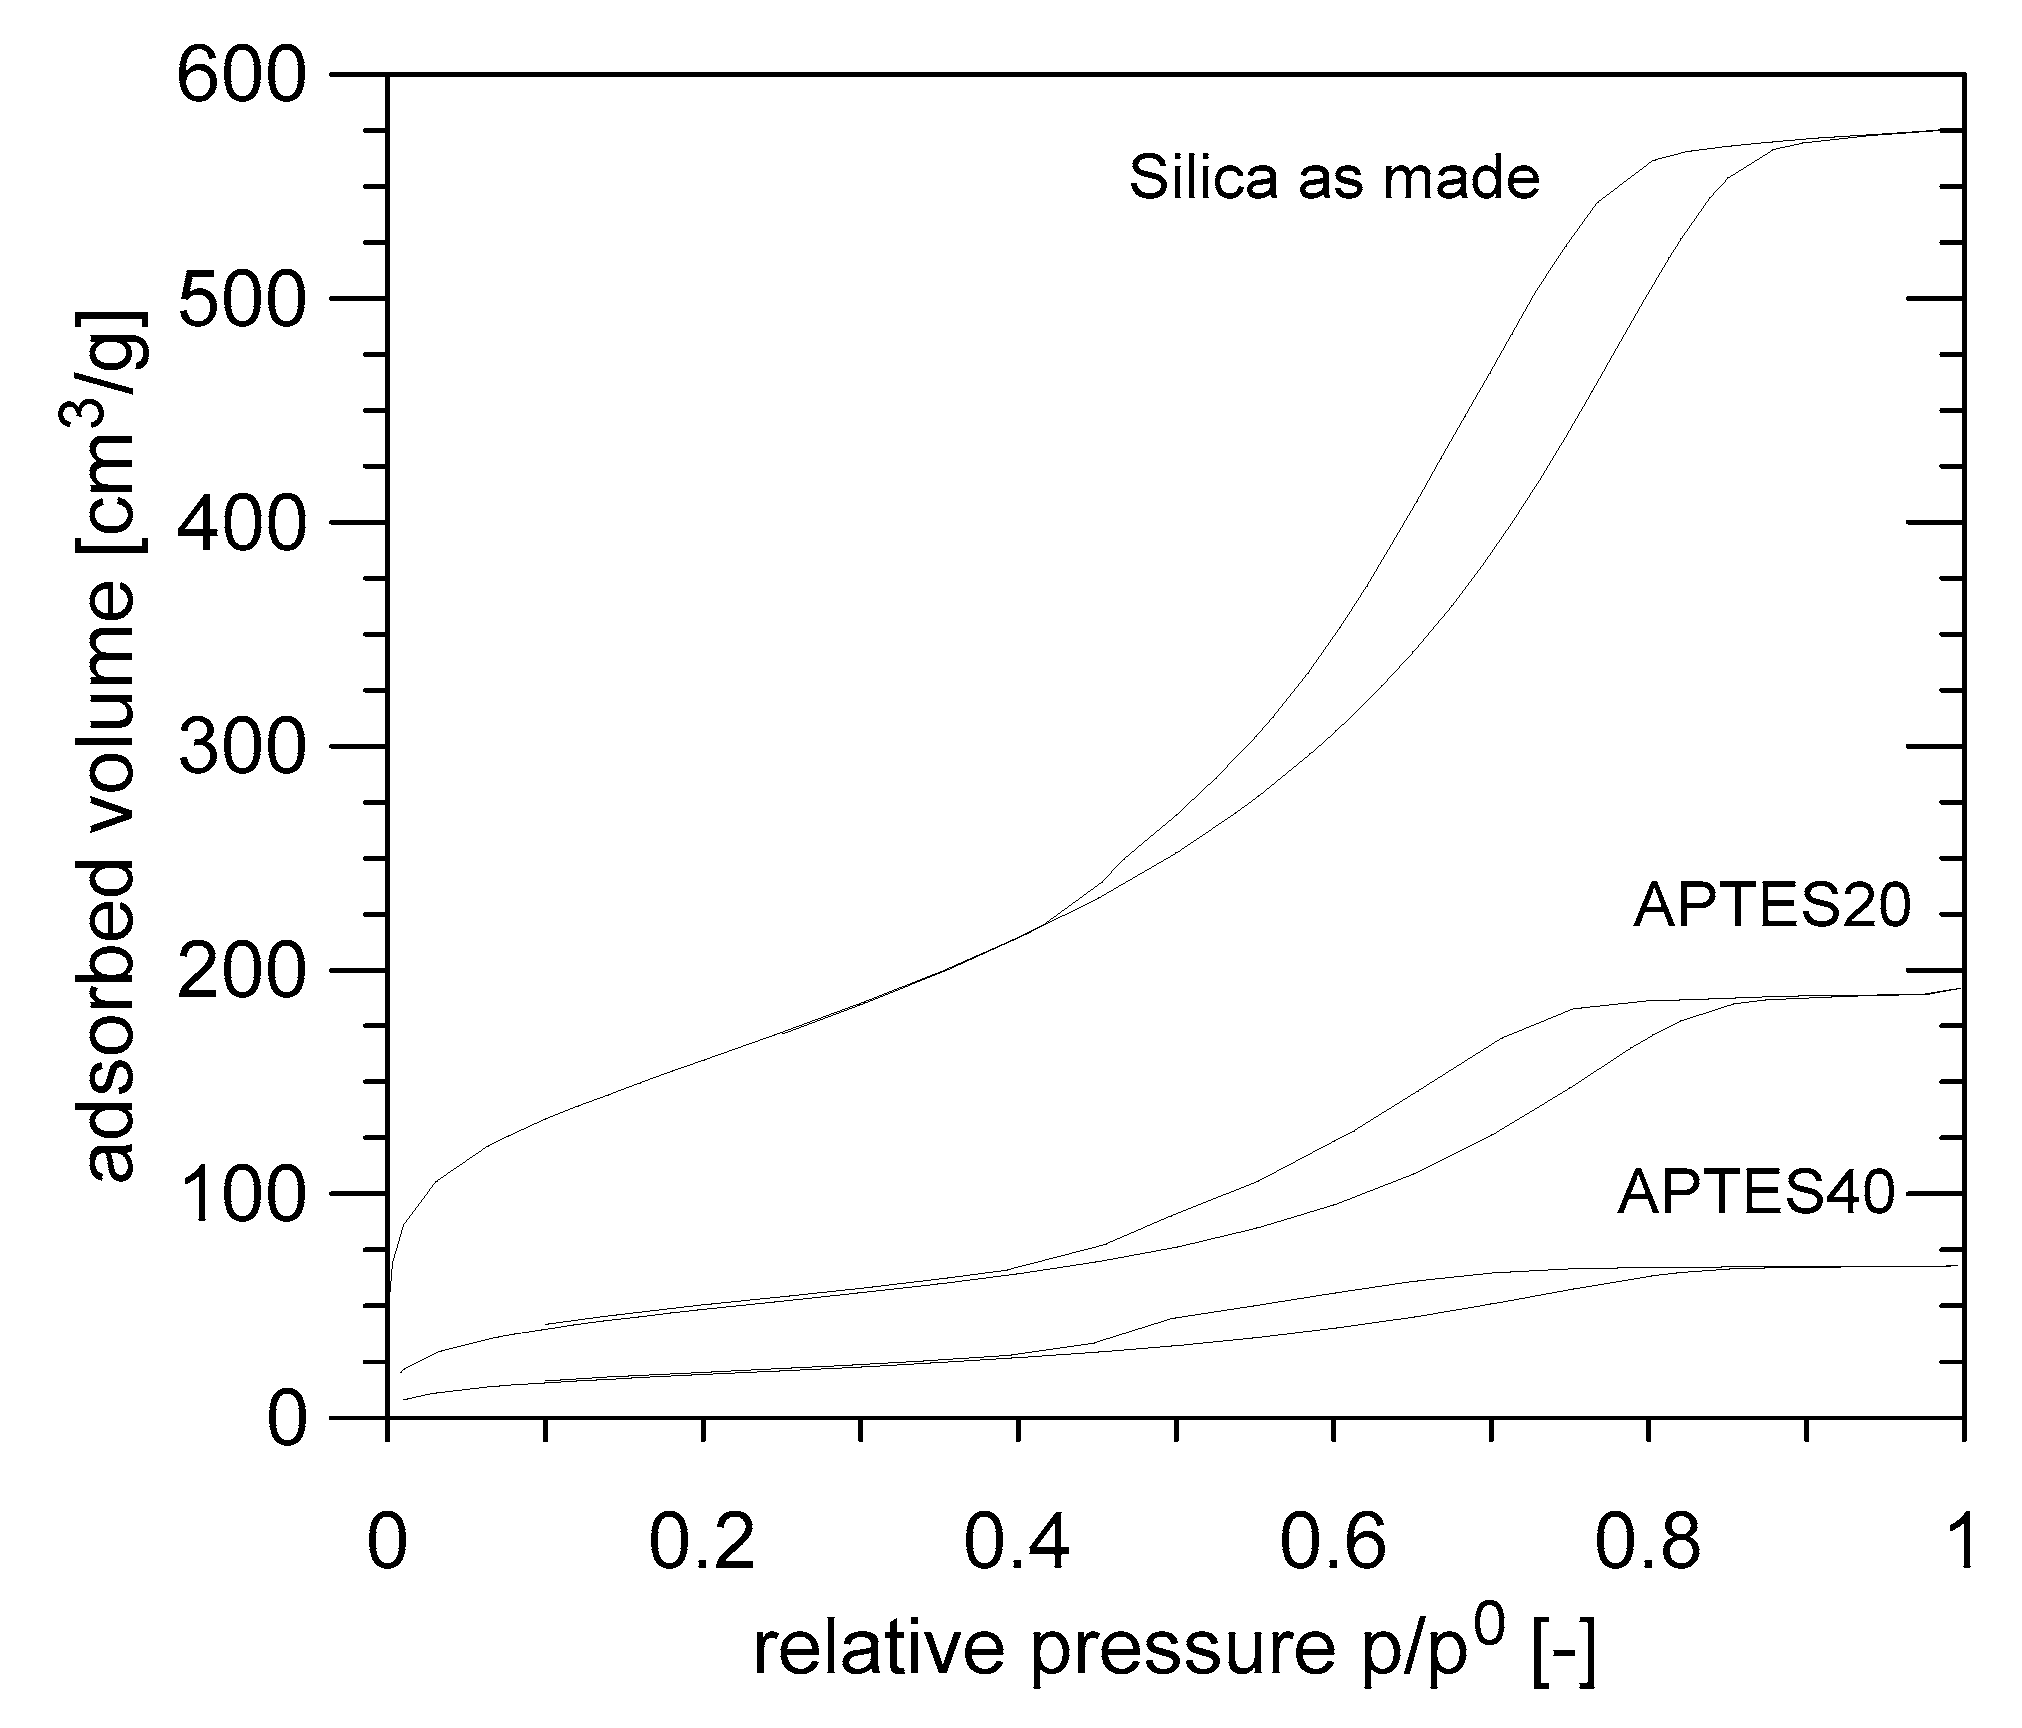
| Adsorbent | ρ [kg/m3] | SBET [m2/g] | Pore Volume [cm3/g] |
|---|---|---|---|
| As-made Silica | 947 | 584 | 0.89 |
| APTES20 | 1380 | 180 | 0.30 |
| APTES40 | 1520 | 73 | 0.10 |
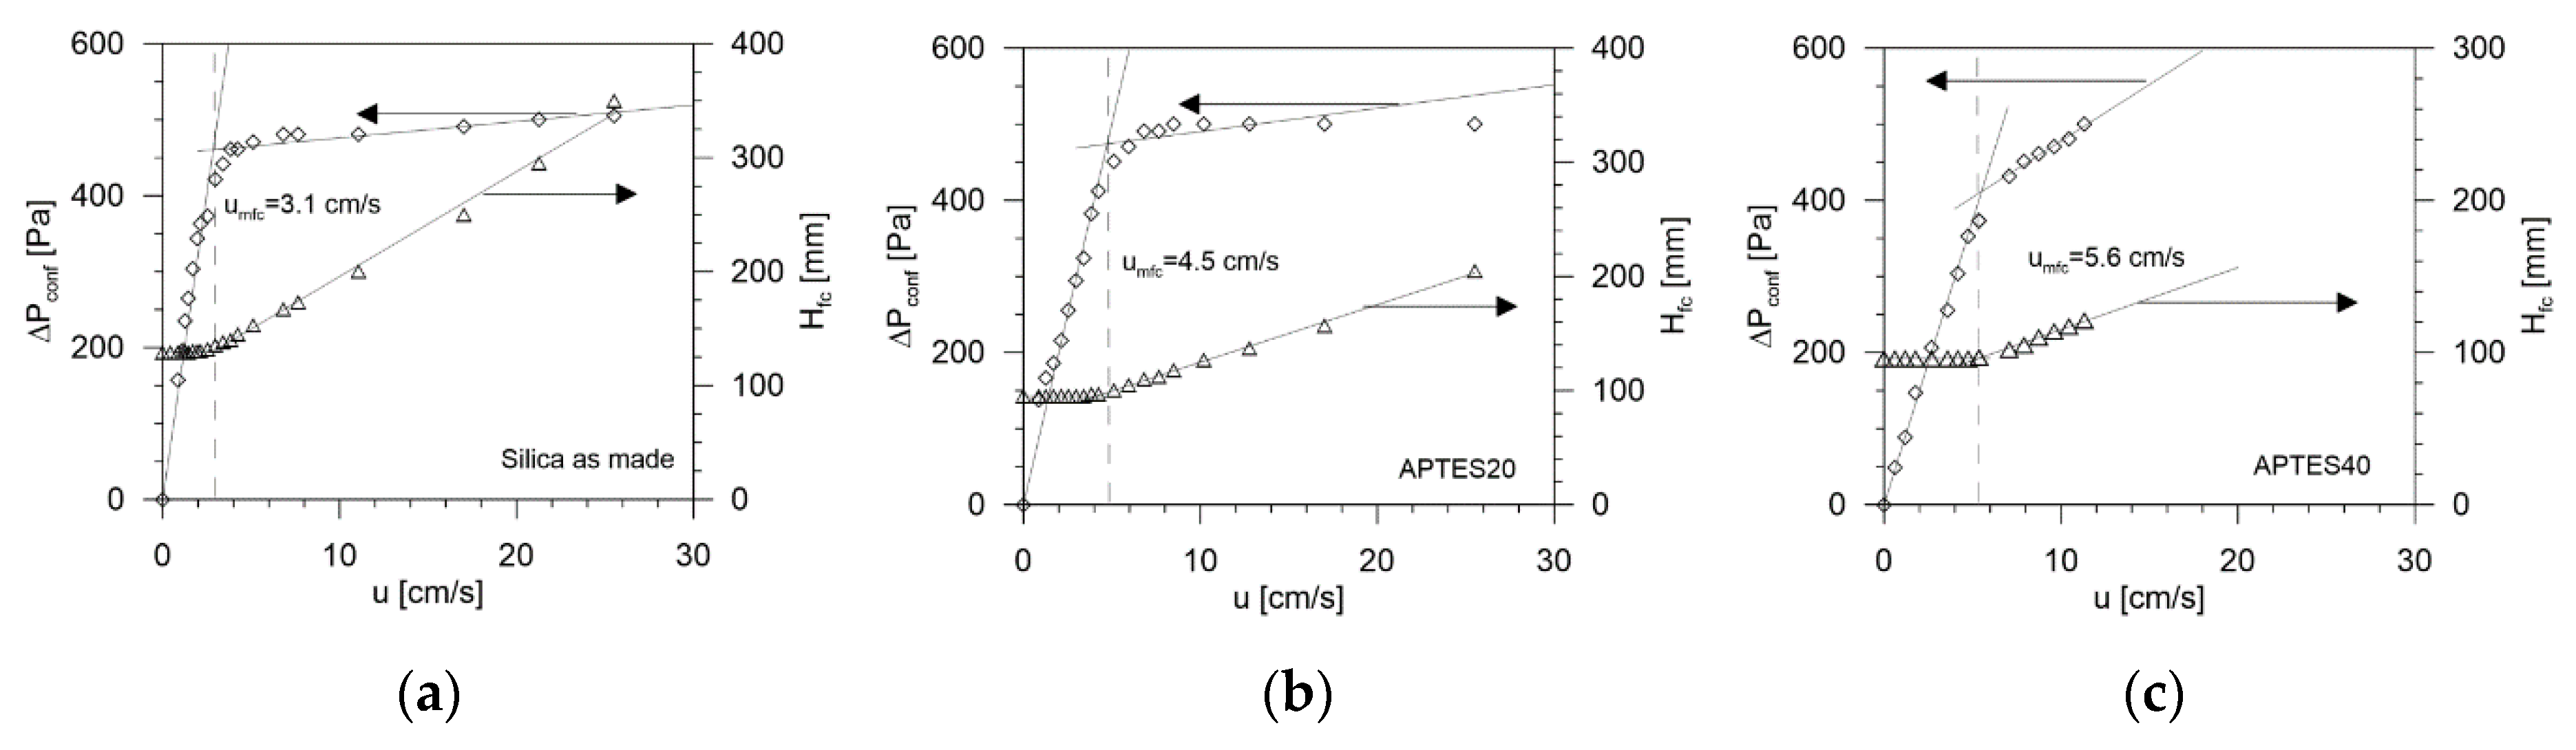
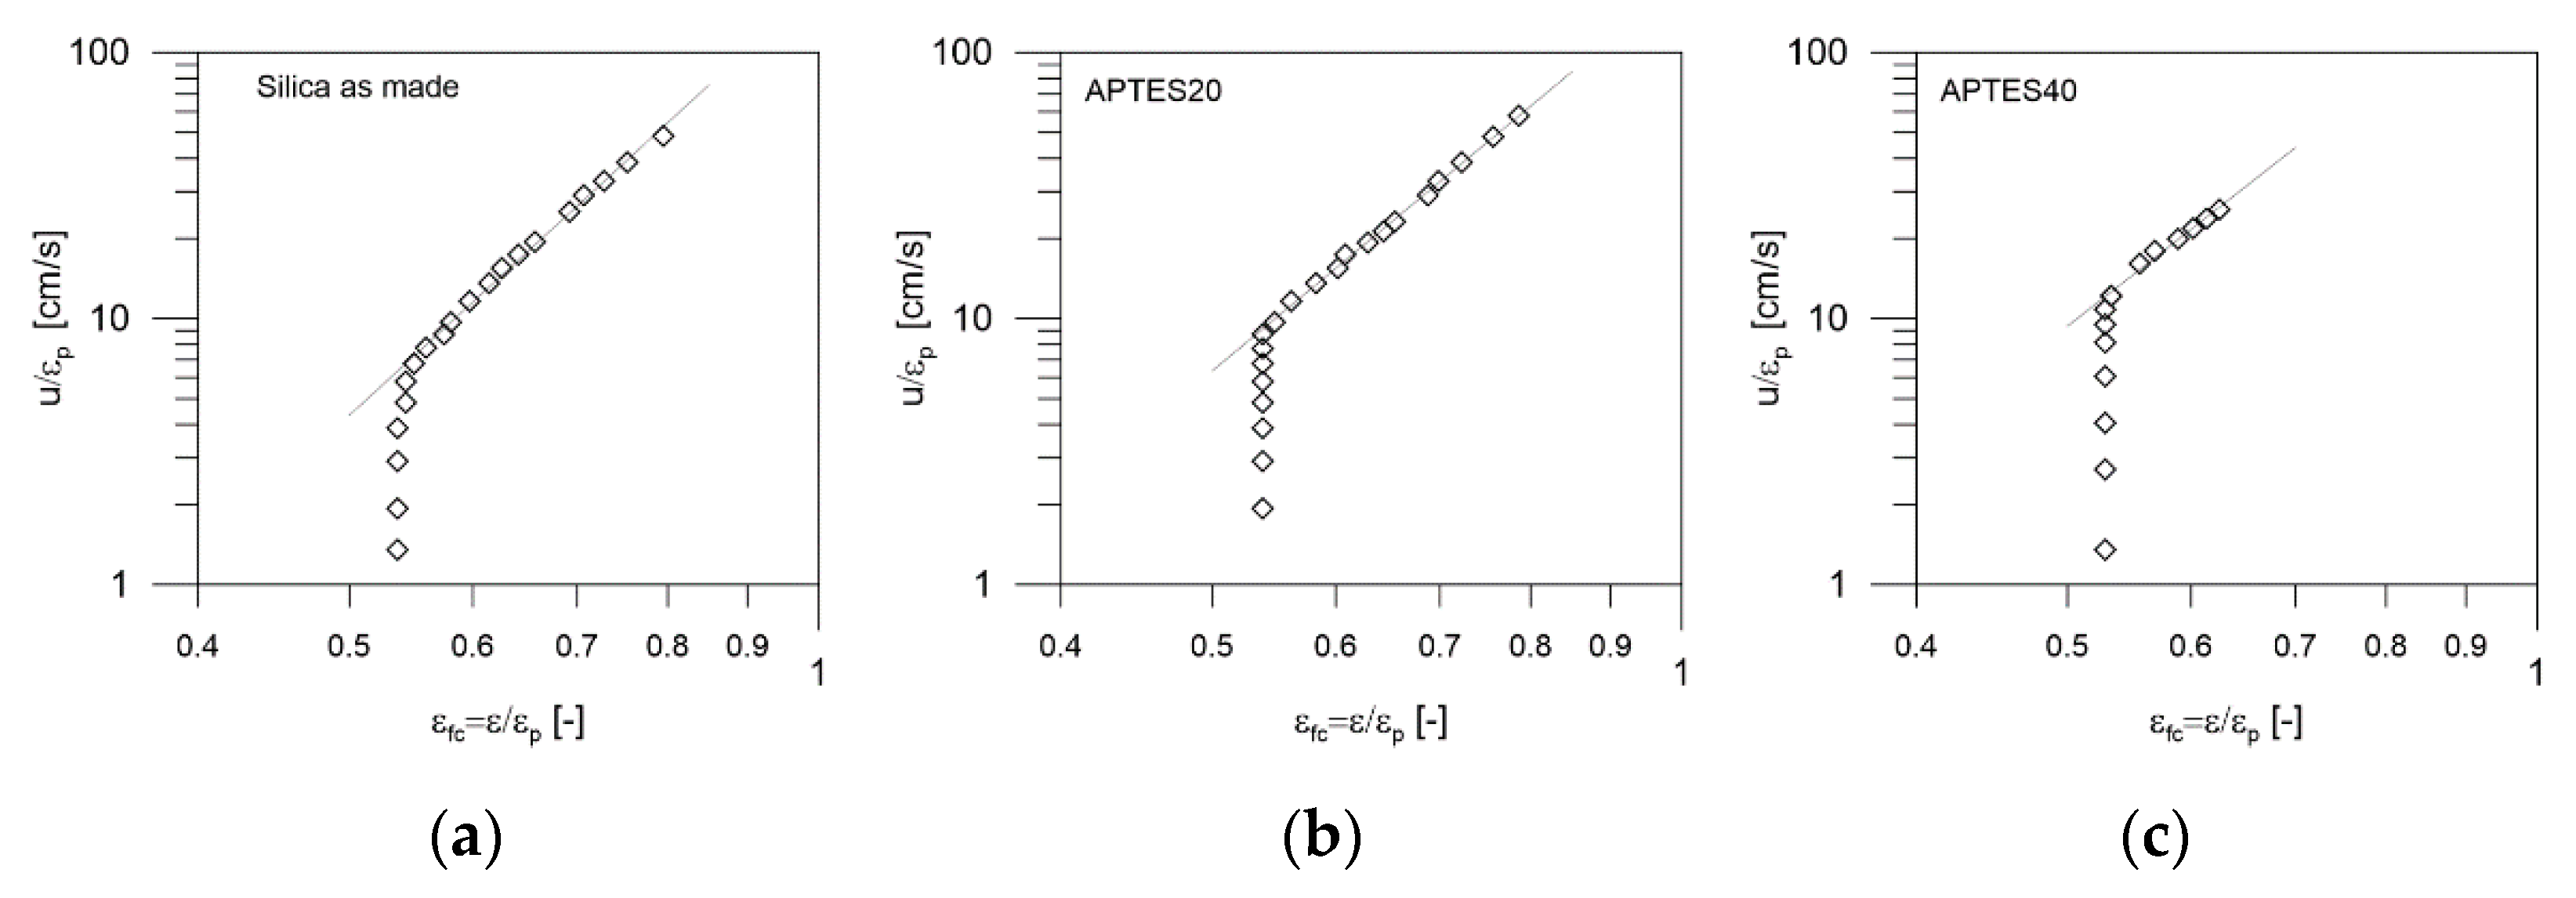
| Adsorbent | Hfc/D [-] | umfc [10−2 m/s] | ε [-] | εfc = ε/εp [-] | u0 [10−2 m/s] | n [-] |
|---|---|---|---|---|---|---|
| As-made Silica | 2.6 | 3.1 | 0.236 | 0.537 | 189 | 5.4 |
| APTES20 | 1.9 | 4.5 | 0.237 | 0.539 | 187 | 4.9 |
| APTES40 | 1.6 | 5.6 | 0.233 | 0.530 | 204 | 4.3 |
| Sample | Gas Velocity u [cm/s] | Contact Time tc [s] | Breakthrough Time tb [s] | Saturation Time ts [s] | CO2 Adsorbed mCO2 (mg/gsolid) | W (g/g %) | Tmax (°C) | CO2/N Molar Ratio [-] | Efficiency (%) |
|---|---|---|---|---|---|---|---|---|---|
| As-made Silica | 3.7 | 1.09 | 5 | 10 | 6.15 | 68.7 | 25.5 | ||
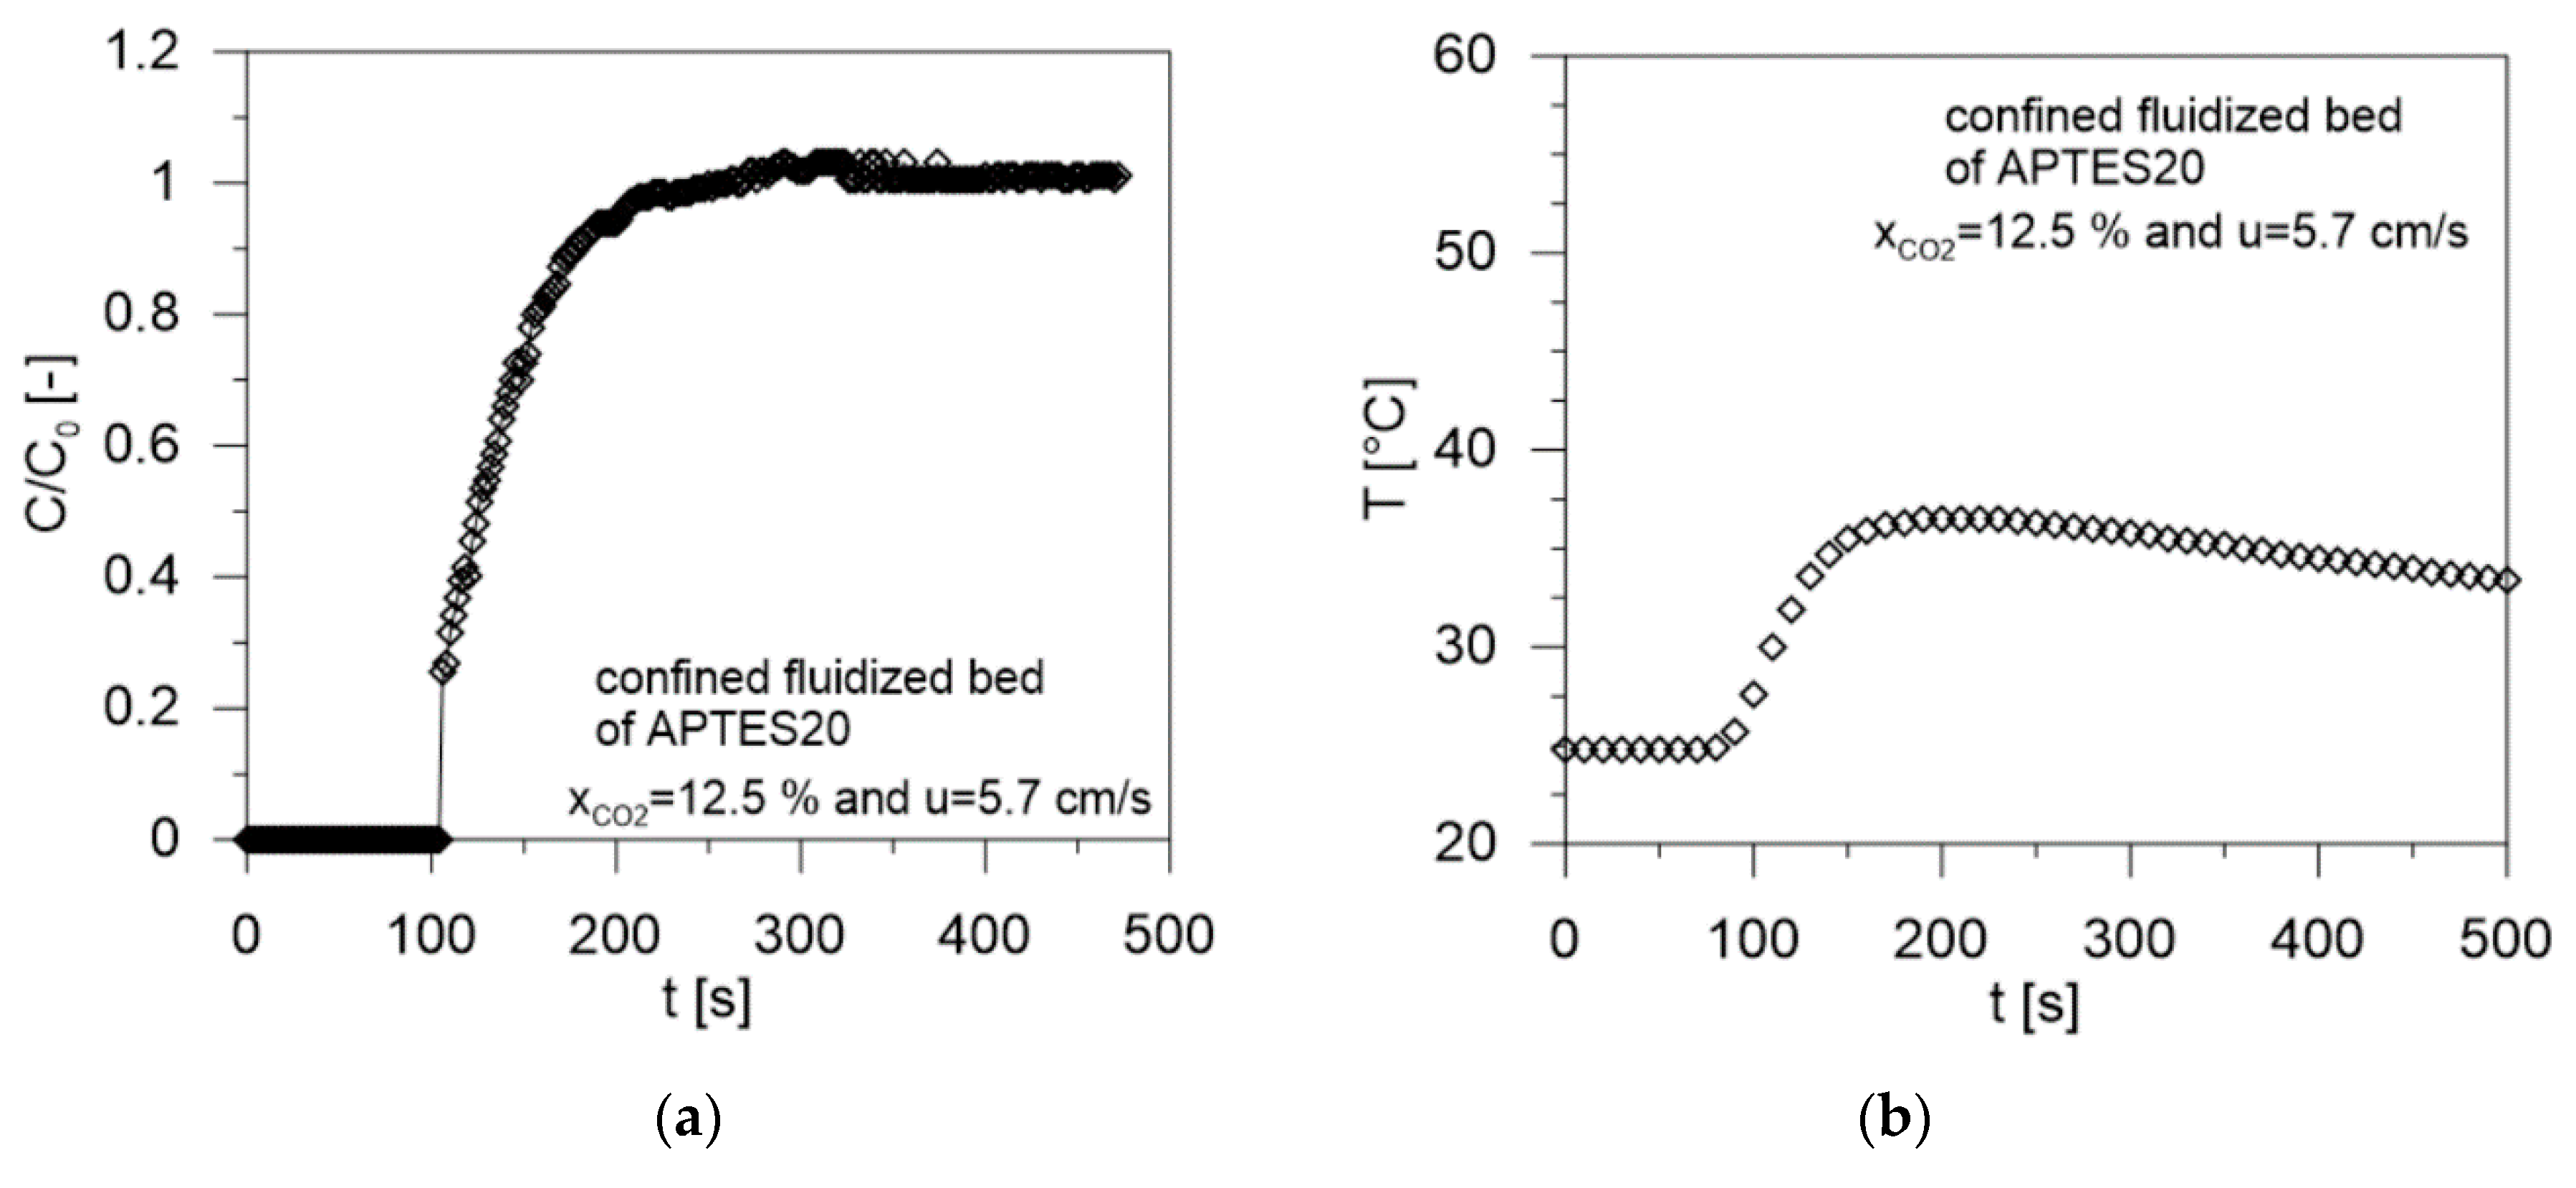
| APTES20 | 5.7 | 0.68 | 104 | 170 | 29.9 | 78.0 | 36.5 | 0.935 | 100 |
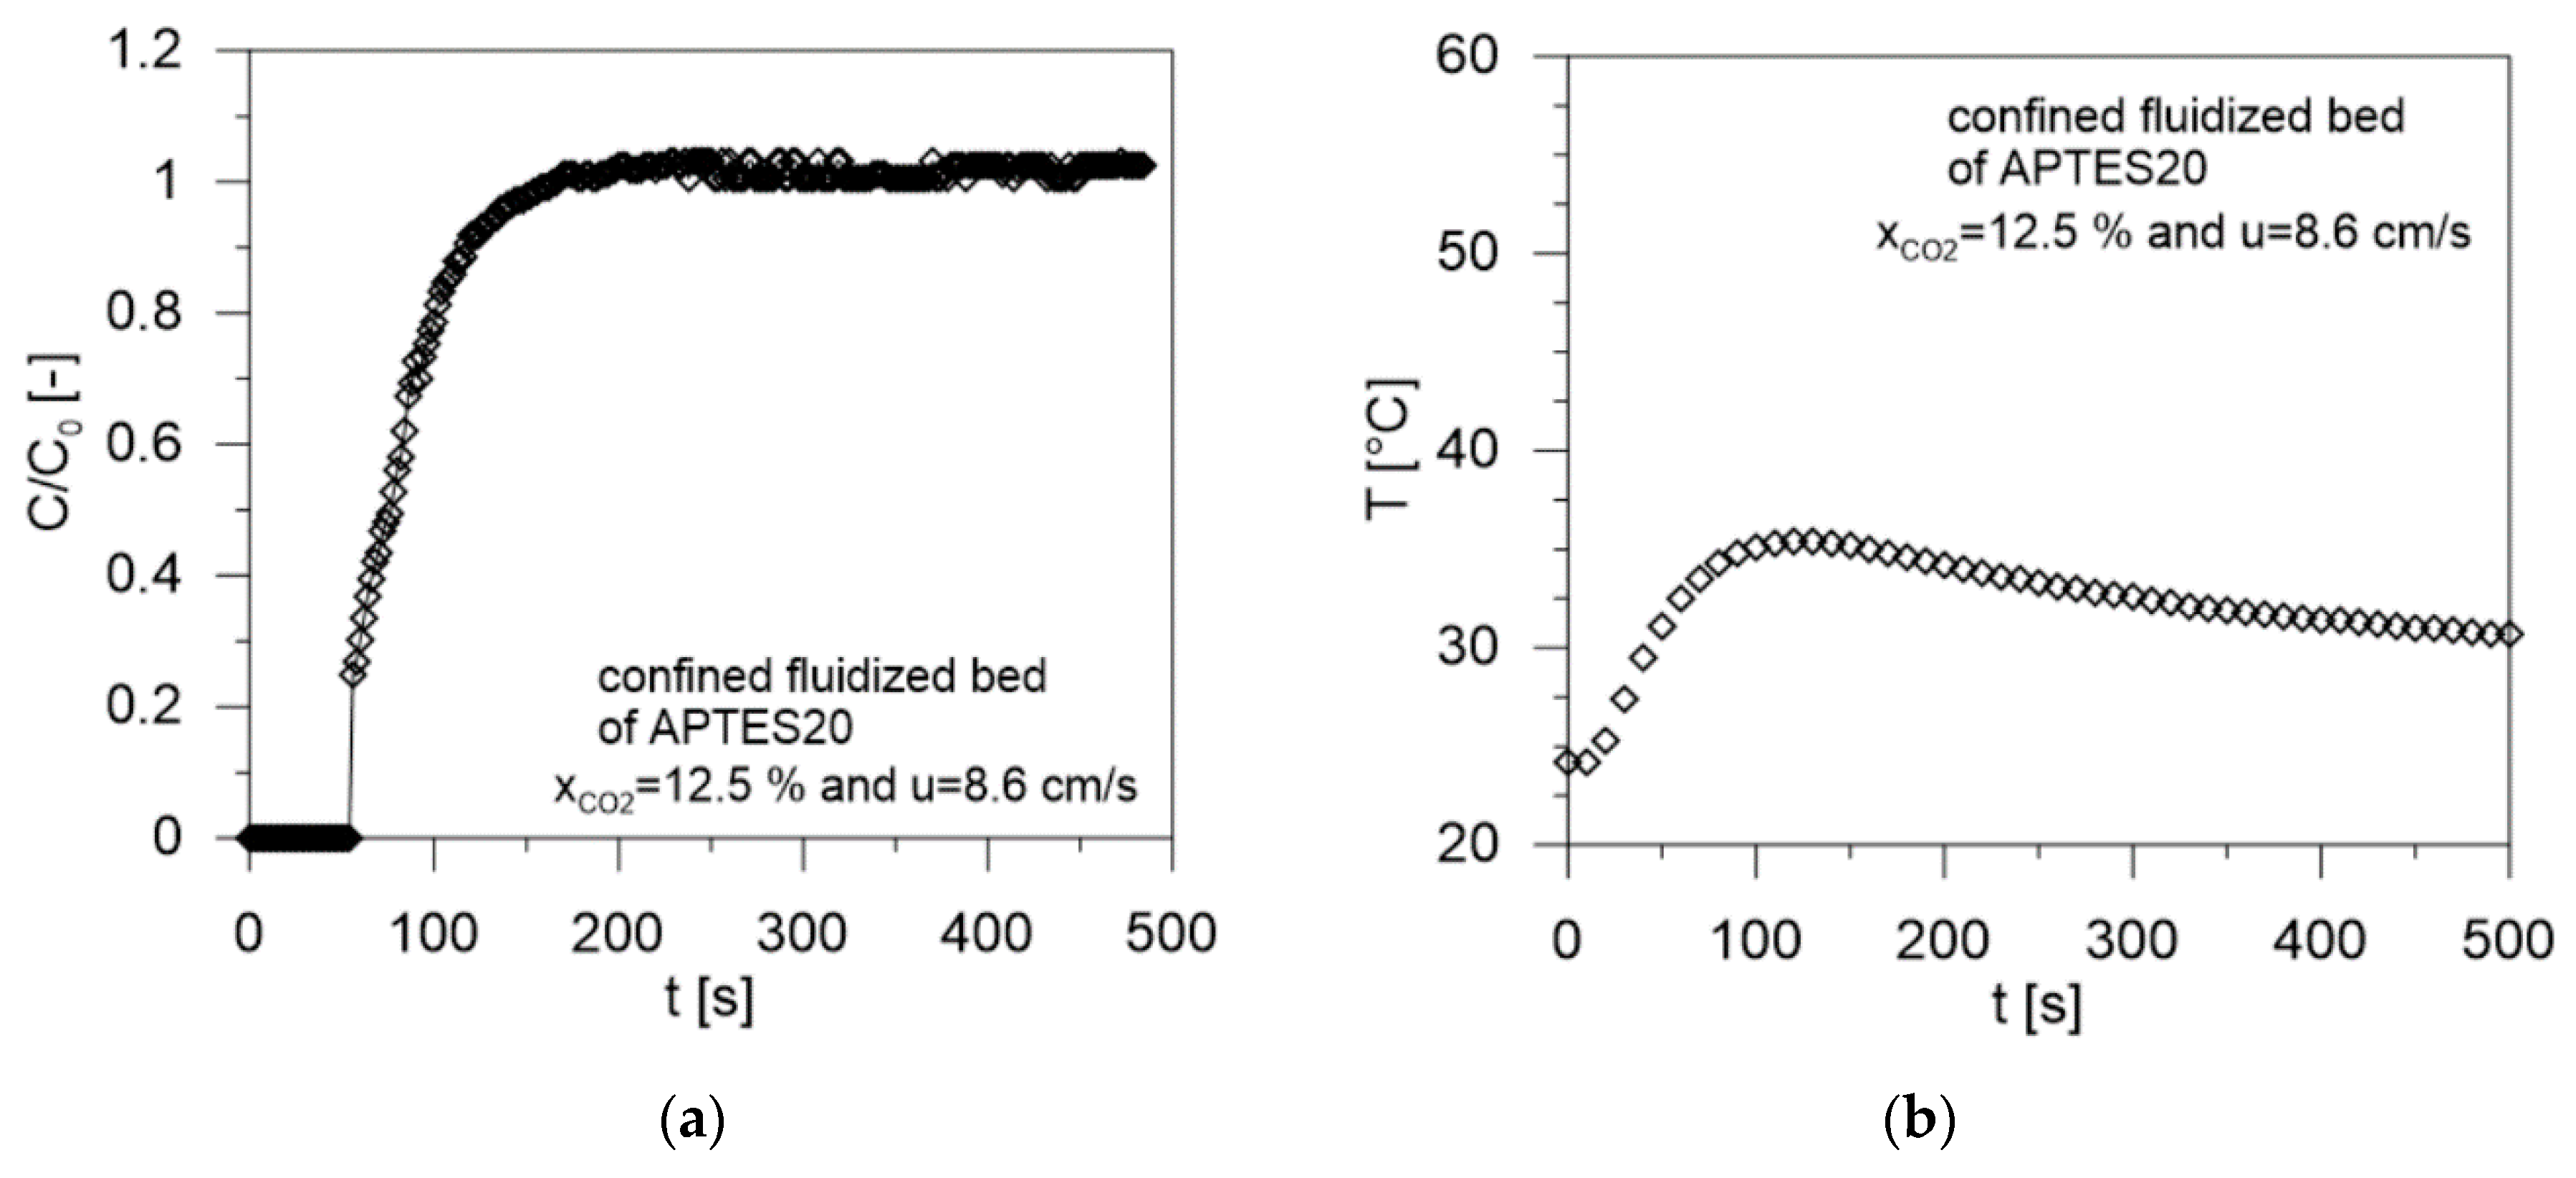
| 8.6 | 0.57 | 54 | 128 | 29.6 | 65.0 | 35.4 | 0.926 | ||
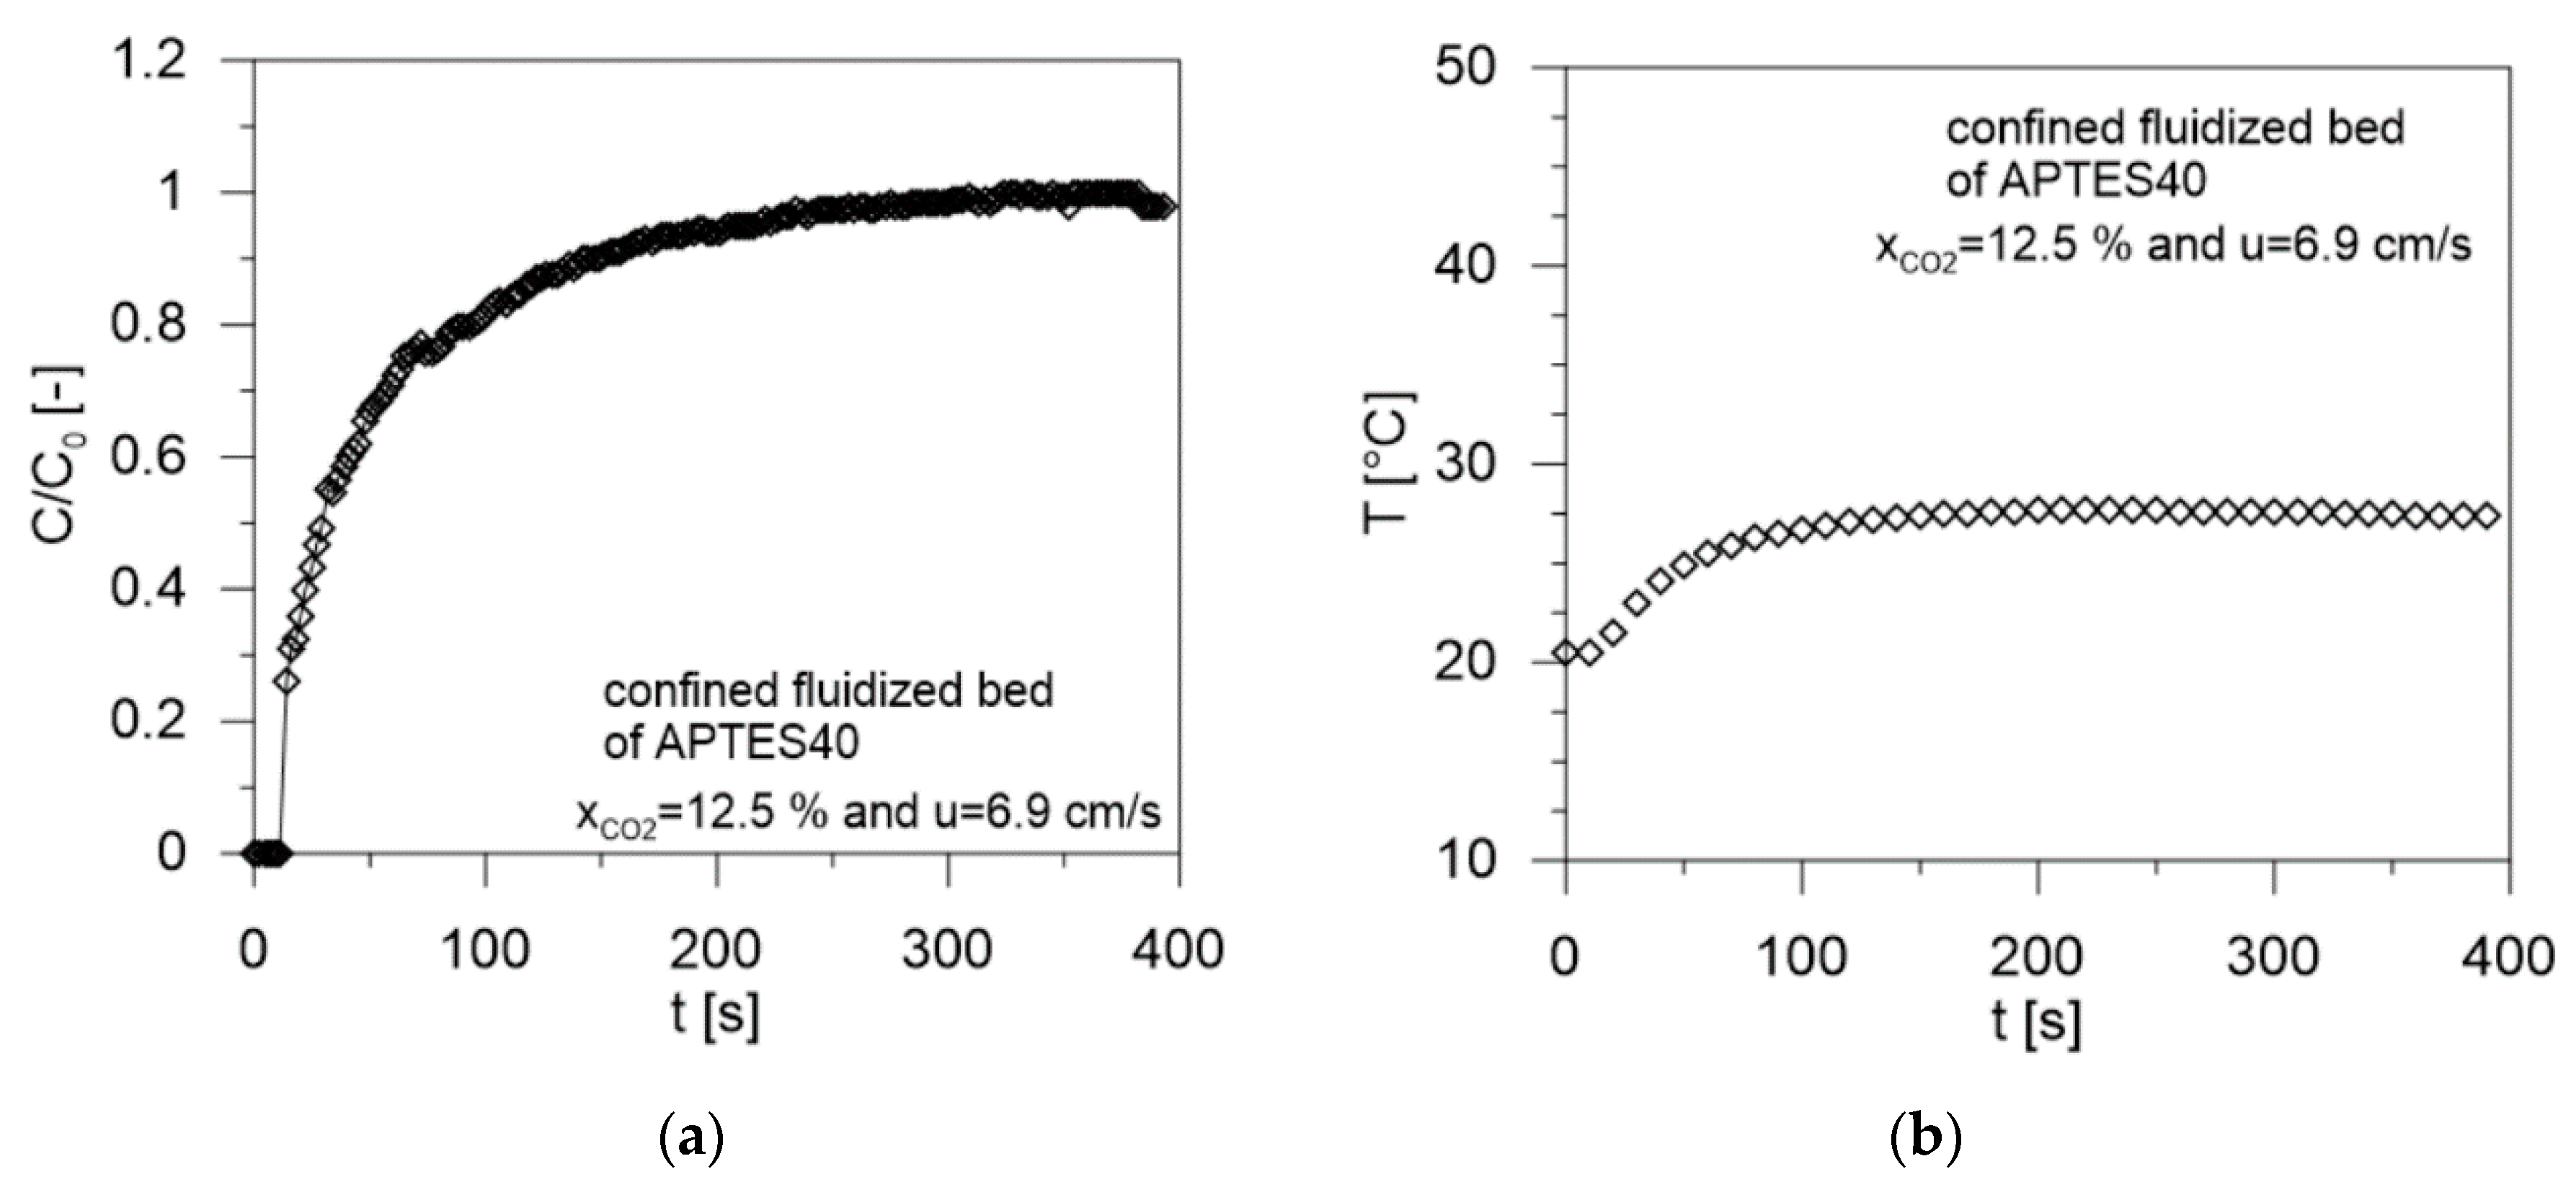
| APTES40 | 6.9 | 0.64 | 11 | 219 | 32.5 | 20.5 | 27.7 | 0.665 | 82.8 |
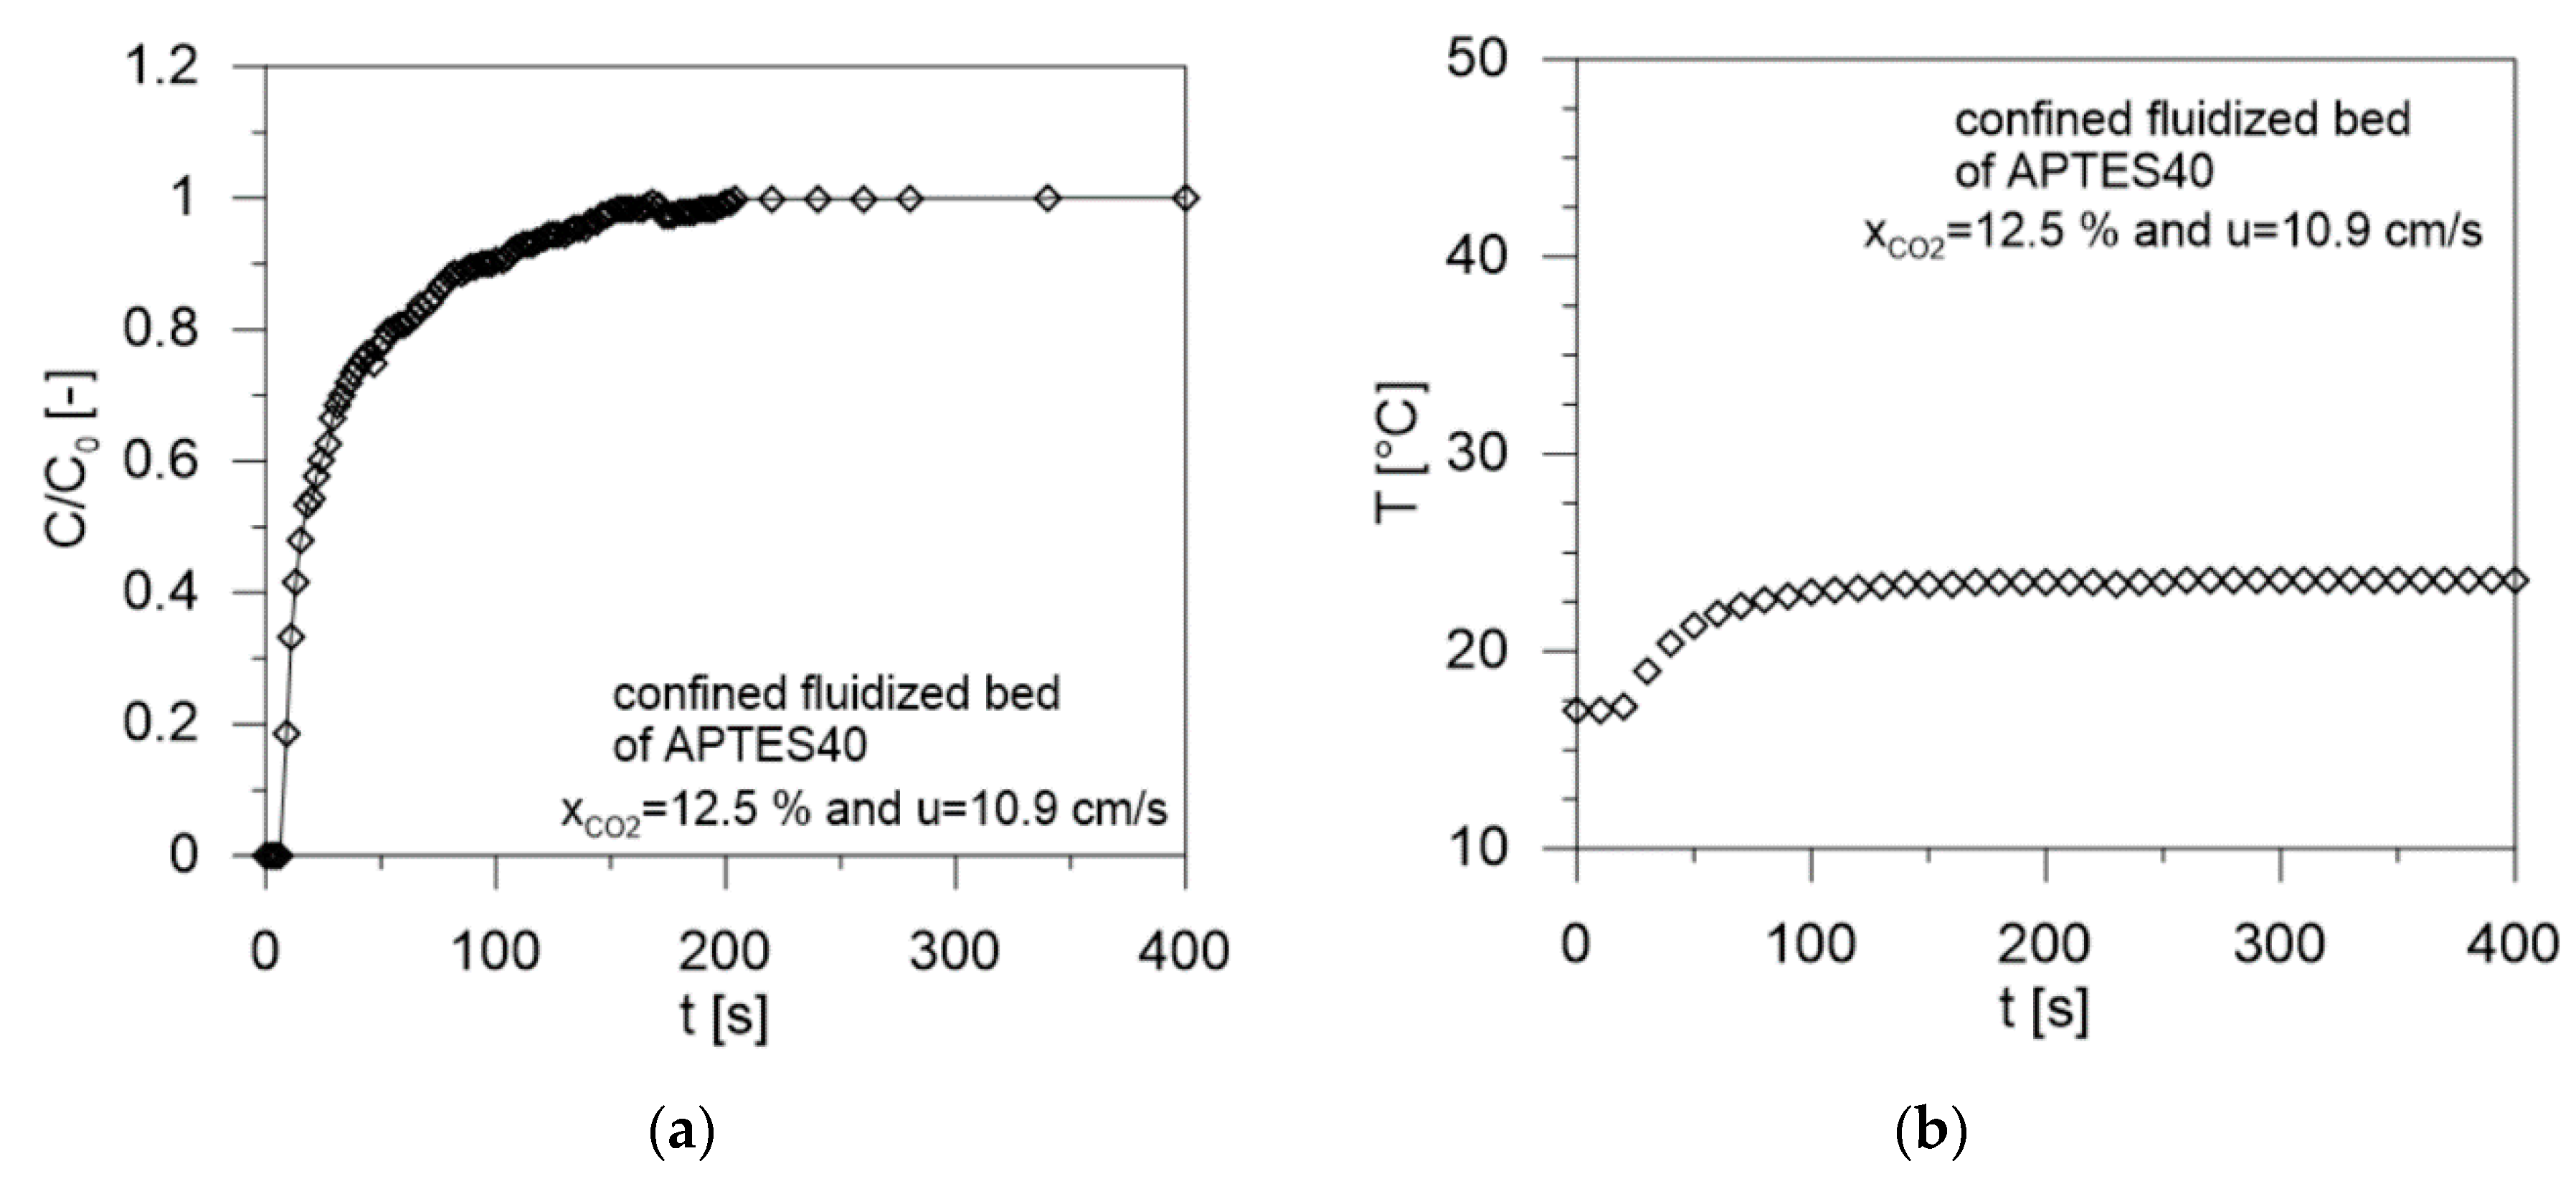
| 10.9 | 0.49 | 6 | 134 | 31.3 | 17.0 | 23.6 | 0.641 |
Publisher’s Note: MDPI stays neutral with regard to jurisdictional claims in published maps and institutional affiliations. |
© 2020 by the authors. Licensee MDPI, Basel, Switzerland. This article is an open access article distributed under the terms and conditions of the Creative Commons Attribution (CC BY) license (http://creativecommons.org/licenses/by/4.0/).
Share and Cite
Girimonte, R.; Testa, F.; Gallo, M.; Buscieti, R.; Leone, G.; Formisani, B. Adsorption of CO2 on Amine-Modified Silica Particles in a Confined-Fluidized Bed. Processes 2020, 8, 1531. https://doi.org/10.3390/pr8121531
Girimonte R, Testa F, Gallo M, Buscieti R, Leone G, Formisani B. Adsorption of CO2 on Amine-Modified Silica Particles in a Confined-Fluidized Bed. Processes. 2020; 8(12):1531. https://doi.org/10.3390/pr8121531
Chicago/Turabian StyleGirimonte, Rossella, Flaviano Testa, Marta Gallo, Rocco Buscieti, Giuseppe Leone, and Brunello Formisani. 2020. "Adsorption of CO2 on Amine-Modified Silica Particles in a Confined-Fluidized Bed" Processes 8, no. 12: 1531. https://doi.org/10.3390/pr8121531
APA StyleGirimonte, R., Testa, F., Gallo, M., Buscieti, R., Leone, G., & Formisani, B. (2020). Adsorption of CO2 on Amine-Modified Silica Particles in a Confined-Fluidized Bed. Processes, 8(12), 1531. https://doi.org/10.3390/pr8121531