Article

Samnamul (Shoots of Aruncus dioicus) Inhibit Adipogenesis by Downregulating Adipocyte-Specific Transcription Factors in 3T3-L1 Adipocytes

1
Department of Herbal Crop Research, National Institute of Horticultural & Herbal Science, Eumsung 27709, Korea
2
Department of Food Science and Biotechnology, Chungbuk National University, Chungbuk 28644, Korea
3
Wild Vegetables Research Institute, Gangwondo Agricultural Research and Extension Services, Pyeongchang 25300, Korea
4
Department of Biochemistry, School of Life Sciences, Chungbuk National University, Cheongju 28644, Korea
5
Development of Horticultural Crop Research, National Institute of Horticultural & Herbal Science, RDA, Jeonju 55365, Korea
*
Authors to whom correspondence should be addressed.
Processes 2020, 8(12), 1576; https://doi.org/10.3390/pr8121576
Submission received: 27 October 2020 / Revised: 19 November 2020 / Accepted: 26 November 2020 / Published: 29 November 2020
(This article belongs to the Section Food Process Engineering)

Abstract

:
Adipocyte-specific transcription factors and antioxidants are considered the best target of obesity. Aruncus dioicus var. kamtschaticus (A. dioicus, Samnamul) is easily available owing to edible and inexpensive. However, the anti-adipogenic effects of the underlying mechanism of A. dioicus extract (ADE) have not yet been reported. In the present study, we evaluate anti-adipogenic pathway in 3T3-L1 adipocytes, antioxidant activities and quantified phenolics using high-performance liquid chromatography of ADE. The results revealed ADE had reduced adipocyte differentiation (0.72-fold vs. MDI (media of differentiation) control), triglyceride (TG; 0.50-fold vs. MDI control, p < 0.001), and total cholesterol contents (0.77-fold vs. MDI control) by regulating adipocyte-specific transcription factors (C/EBPα, PPARγ, and SREBP1) and their downstream mRNA (AdipoQ, Ap2, SREBP1-c, and FAS) levels. Furthermore, ADE has higher total phenol and flavonoid contents and scavenging assay in the DPPH and ABTS+. In particularly, ADE contains chlorogenic acid (7.04 mg/kg), caffeic acid (20.14 mg/kg), ferulic acid (1.74 mg/kg), veratric acid (29.31 mg/kg), cinnamic acid (4.70 mg/kg), and quercetin (4.18 mg/kg). In conclusion, since these phenols, especially quercetin, in the ADE appear to reduce differentiation, TG and cholesterol content by regulating adipocyte-specific transcription factors in adipocytes, ADE has the potential to be developed into a new antioxidant and anti-obesity therapeutics.

1. Introduction

Obesity means an excessive accumulation of fat in the body by an increase in hypertrophy of adipose cells with no effects on the number of cells and causes chronic diseases including diabetes mellitus, cardiovascular disease, and some cancers [1,2]. In recent times, the prevalence rate of obesity has increased to the extent that it can be considered as a global syndemic such as epidemics and climate change [3]. These current trends in obesity carry a high personal cost and social costs for public policy [4]. Thus, anti-obesity studies are conducted to reduce the burden on various diseases caused by obesity. However, due to the dependence and safety of appetite-suppressing drugs, the development of anti-obesity drugs using natural products can be a good alternative strategy [5].
The CAAT/enhancer-binding protein (C/EBP) and peroxisome proliferator-activated receptor (PPAR) family are known to play a role in the transcriptional activation of adipogenesis [6]. Among them, C/EBPα and PPARγ are activated just before or concomitantly with the transcription of most adipocyte-specific genes [6]. Another transcription factor, sterol regulatory element-binding proteins (SREBPs) including SREBP-2, SREBP-1a and SREBP-1c, regulates gene expression associated with lipogenesis [7]. Furthermore, these factors involved in adipocyte differentiation were significantly regulated by oxidative stress [8]. Therefore, adipocyte-specific transcription factors and antioxidants are a significant target of anti-obesity agents.
Samnamul is the aerial part of Aruncus dioicus, a plant that belongs to the family Rosaceae [9]. Samnamul has a unique flavor, is very nutritious, and widely grown in mountain areas of Japan, China, and Korea, and is inexpensive [10,11]. Samnamul contains dietary fiber, minerals, vitamin A, phenolic compounds, monoterpenoids, and saponins. Samnamul has beneficial antioxidant, anti-wrinkling, and anti-inflammatory activities and inhibits type 2 diabetes cells and animal models [9,11,12,13,14]. However, anti-adipogenic effect of A. dioicus and their mechanism have not been reported. Therefore, this study examined the adipogenesis inhibitory activity of A. dioicus extract (ADE) and the underlying molecular mechanism that regulates both adipogenesis and lipogenesis. Furthermore, since the anti-obesity effects were closely related to its antioxidant effects and contents of antioxidant compounds of the aerial parts of ADE were measured.

2. Materials and Methods

2.1. Preparation of Sample

Aerial parts of A. dioicus (AD) were collected from the Department of Herbal Crop Research (Eumsung, Chungcheongbuk-do, Korea) in 2018. AD was freeze-dried after collection. For the preparation of extracts, AD (10 g) was ground, sifted through a testing sieve (aperture 1.40 mm, wire 0.71 mm). Dried AD was extracted with 70% ethanol (ADE) at a 1:10 (v:v) ratio for 24 h, three times at room temperature. After filtration, extracts were concentrated in vacuo used by vacuum evaporator (Rotavapor R-121, Buchi, Switzerland), freeze-dried (PVTFD50R, ilShinBioBase, Korea; 20 mTorr, −40 °C, 1 week), and stored at −80 °C. This study was approved by the Cooperative Research Program for Agriculture Science and Technology Development Program (PJ01361603), Rural Development Administration, Republic of Korea.

2.2. Cell Culture and Differentiation

3T3-L1 adipocytes were obtained from ATCC (#CL-173; Manassas, VA, USA). Briefly, cells were incubated in Dulbecco’s modified Eagle medium (DMEM; Gibco, Billings, MT, USA) supplemented with 10% bovine calf serum (Gibco, Billings, MT, USA) and 1× penicillin/streptomycin/glutamate (P/S/G; Gibco, Canada). Differentiation was induced in post confluent cells with growth media containing 500 μM isobutylmethylxanthine (Sigma-Aldrich, St. Louis, MO, USA), 1 μM dexamethasone (Sigma-Aldrich, St. Louis, MO, USA), and 10 μg/mL insulin (Gibco, Billings, MT, USA) for 2 days, and cells were replenished by DMEM with 10% fetal bovine serum (Gibco, Billings, MT, USA), 1× P/S/G and 2.5 μg/mL insulin (10 μg/mL) media every 2 days [15]. Experiments were performed in adipocytes 8 days post differentiation.

2.3. Cytotoxicity

Cell viability was measured with a CellTiter 96 Aqueous One Solution Cell Proliferation Assay Kit (Promega Corporation, Madison, WI, USA) according to the manufacture’s instruction. Briefly, cells (1 × 10⁴ cell/mL) were seeded in 96 well plates and incubated at 37 °C in 5% CO2 with ADE (25–200 μg/mL). After 24 h, MTS solution was added to each well, incubated for 1 h, and absorbance at 490 nm was measured using a Synergy H1 microplate reader (Biotek, Winooski, VT, USA).

2.4. Oil Red O Staining

Lipid droplets were measured using Oil Red O (ORO; Sigma, St. Louis, MO, USA) stain as described by Ramirez-Zacarias et al. [16]. The ORO working solution was prepared with dH2O and ORO (6/4 = w/v). The 3T3-L1 cells were washed with phosphate-buffered saline (PBS) and were then fixed in 10% formaldehyde for 1 h incubated at 37 °C. Fixed cells were washed with ddH2O and then washed with 60% isopropanol for 3 min. The cells were stained with ORO solutions for 15 min. The cells were washed with dH2O four times to remove the un-stained dye. The stained droplet was observed with an inverted phase microscope (10×; Observer A1, Zeiss, Oberkochen, Germany). In addition, isopropanol was added for quantification to elute stained reagents, and the absorbance was measured at 520 nm using by Synergy H1 microplate reader.

2.5. Triglyceride (TG) Assay

3T3-L1 adipocytes in the 12 wells plates were rinsed with PBS. Cells were homogenized with 5% NP-40/ddH2O. TG in adipocytes was measured by a Triglyceride Assay Kit from Abcam (Cambridge, UK) according to the instruction of the manufacturer. The absorbance was evaluated at 570 nm by a Synergy H1 microplate reader.

2.6. Measurement of Total Cholesterol

Cells were lysed with chloroform/isopropanol/NP-40 (v/v = 7/11/0.1). Cells were centrifuged for 5 min at 15,000× g, and then the supernatant was transferred to a new tube. The supernatant was dried at 50 °C to remove chloroform. Dried supernatant was dissolved with assay buffer (included in Kit). Cellular cholesterol levels were determined with a Cholesterol Assay Kit from Abcam (Cambridge, UK) according to the instruction of the manufacturer. The absorbance was performed at 570 nm using a Synergy H1 microplate reader.

2.7. Western Blot

Whole adipocyte for protein extraction was lysed in a RIPA buffer containing protease and phosphatase inhibitor cocktail (GenDEPOT, Katy, TX, USA). Cell lysates containing equal amounts of proteins were determined using the Bradford assay (BioRad, Hercules, CA, USA). Western blot was performed as described previously reported [17]. The PVDF-membranes were incubated with primary antibody (1:500–1000 dilution) at 4 °C, overnight, and secondary antibody (1:2000 dilution) were treated for 2 h. All primary and secondary antibodies were prepared by cell signaling (Beverly, MA, USA). The blots were visualized using the enhanced chemiluminescence (ECL) reagent (BioRad, Hercules, CA USA). Quantitative analysis was measured with free ImageJ (version 1.52a for windows; NIH, Rockville, MD, USA).

2.8. Quantitative Real-Time Polymerase Chain Reaction (qPCR)

Total RNA of adipocytes was extracted by TRIzol reagent (Ambion, Austin, TX, USA) referring to the manufacturer’s instructions. cDNA was synthesized using a reverse transcriptase premix kit (Elpis Biotech, Daejeon, Korea). The qPCR was performed using the QuantiTect SYBR Green PCR Kit (Qiagen, Valencia, CA, USA). Primers were designed using Primer-BLAST shown in Table 1 (NCBI, Bethesda, MD, USA). The threshold cycle (Ct) value for each gene was normalized by β-actin.

2.9. Measurement of Antioxidant Activity

DPPH (Sigma-Aldrich, MO, USA) scavenging assay was followed by Mishra et al. with some modifications [18]. The DPPH solutions were prepared by DPPH (300 µM) in 99.9% ethanol was prepared. The working solution was diluted with 99.9% ethanol. The ADE (40 μL) were allowed to react with the DPPH solution (160 μL) for 1 h in the dark. Then, the absorbance was taken at 515 nm and was expressed as the half-maximal inhibitory concentration (IC50, μg/mL).
The ABTS (Sigma-Aldrich, MO, USA) assay was slightly modified by Miller and Rice-Evans [19]. Briefly, the stock of ABTS solutions included ABTS+ solution (7.4 mM) and potassium persulfate (2.6 mM) for 4 h at 4 °C. The ABTS+ solution was diluted with dH2O until an absorbance of 0.7 ± 0.02 at 734 nm. Then, ADE (20 μL) was mixed with ABTS+ solution (180 μL) for 1 h in the dark. The absorbance was performed at 734 nm and was expressed as the half-maximal inhibitory concentration (IC50, μg/mL).

2.10. Total Phenol and Flavonoid Contents

Total phenol contents (TPC) were measured using Folin–Ciocâlteu [20]. Briefly, ADE (100 µL) was mixed with 1 N Folin–Ciocâlteu (50 µL) and dH2O (400 µL). The absorbance was read at 725 nm using a Synergy H1 microplate reader. The standard calibration curve of gallic acid (10–50 µg/mL) was plotted. Total flavonoid contents (TFC) were measured using the modified Pękal et al. method [21]. Briefly, ADE (100 µL) was mixed with 5% NaNO2 (75 µL; w/v) for 6 min and, 10% AlCl3 (150 µL; w/v) was added. A mixture was neutralized with 1 M NaOH solution (750 µL). The absorbance was read at 510 nm using Synergy H1 microplate reader. The standard calibration curve of (+)-catechin (10–50 µg/mL) was plotted.

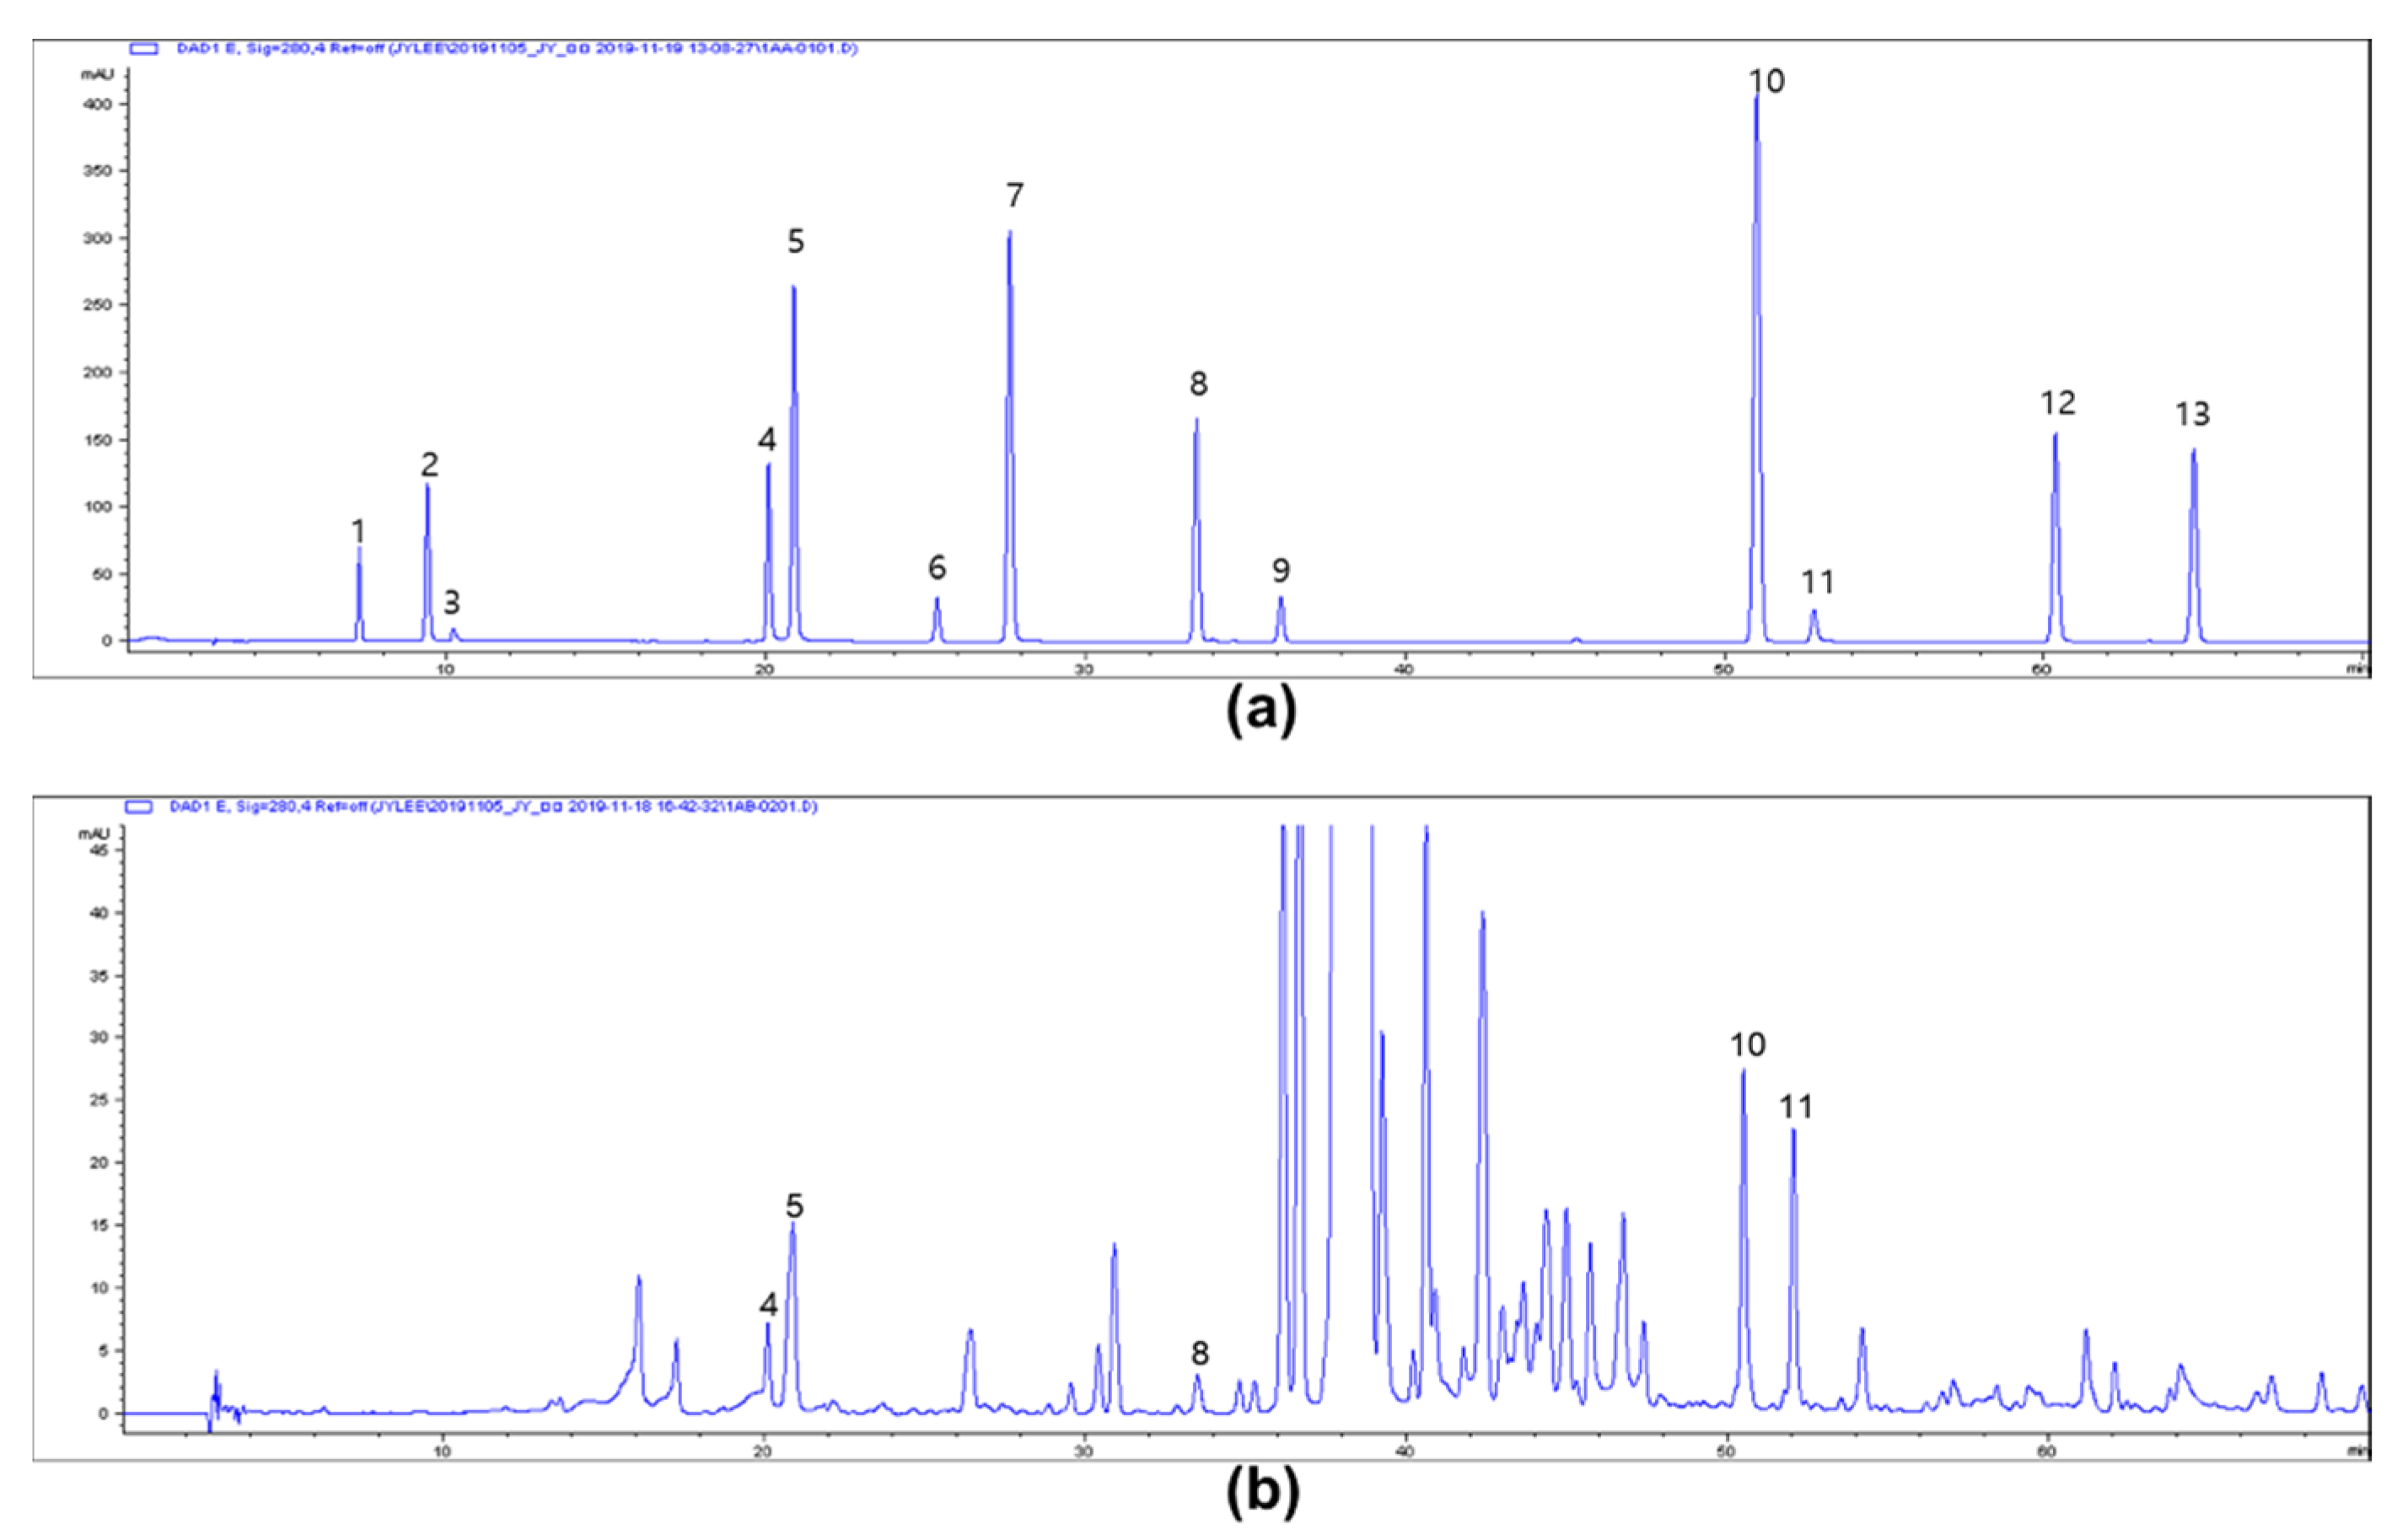
2.11. HPLC Analysis for Phenolics

The modified method for HPLC from Agilent 1200 series, Agilent Technologies (Santa Clara, CA, USA) analysis of Kim et al. was applied [22]. Preparations of a phenol-rich fraction of AD (5 g) were redissolved in dH2O and then fractionated by ether/ethyl acetate (1:1 = v/v). HPLC was analyzed by a reversed-phase using a synergy fusion RP column (250 × 4.6 mm, 4 μm; Phenomenex, Torrance, CA, USA) at 35 °C. The mobile phase (solvent A, 0.5% acetic acid in water; solvent B, 0.5% acetic acid in acetonitrile), gradient, injection volume and flow rate were performed as described previously [23]. Homogentisic acid, protocatechuic acid, gentisic acid, chlorogenic acid, caffeic acid, phloretic acid, p-coumaric acid, ferulic acid, veratric acid, cinnamic acid, quercetin, naringenin (Sigma-Aldrich, St. Louis, MO, USA) were used as phenolic standards. Phenolics were detected at 280 nm using diode array detection (DAD). All solutions with HPLC grade methanol and were prepared filtered by a 0.22 μM polyvinylidene difluoride (PVDF; Pall Co., Port Washington, NY, USA) membrane.

2.12. Statistics

All experimental results are presented as the means ± standard deviation (SD). The statistical significance of differences in this study was determined by a one-way analysis of variance (ANOVA) using Tukey’s multiple comparison test (Prism 5.02 GraphPad Software, San Diego, CA, USA).

3. Results

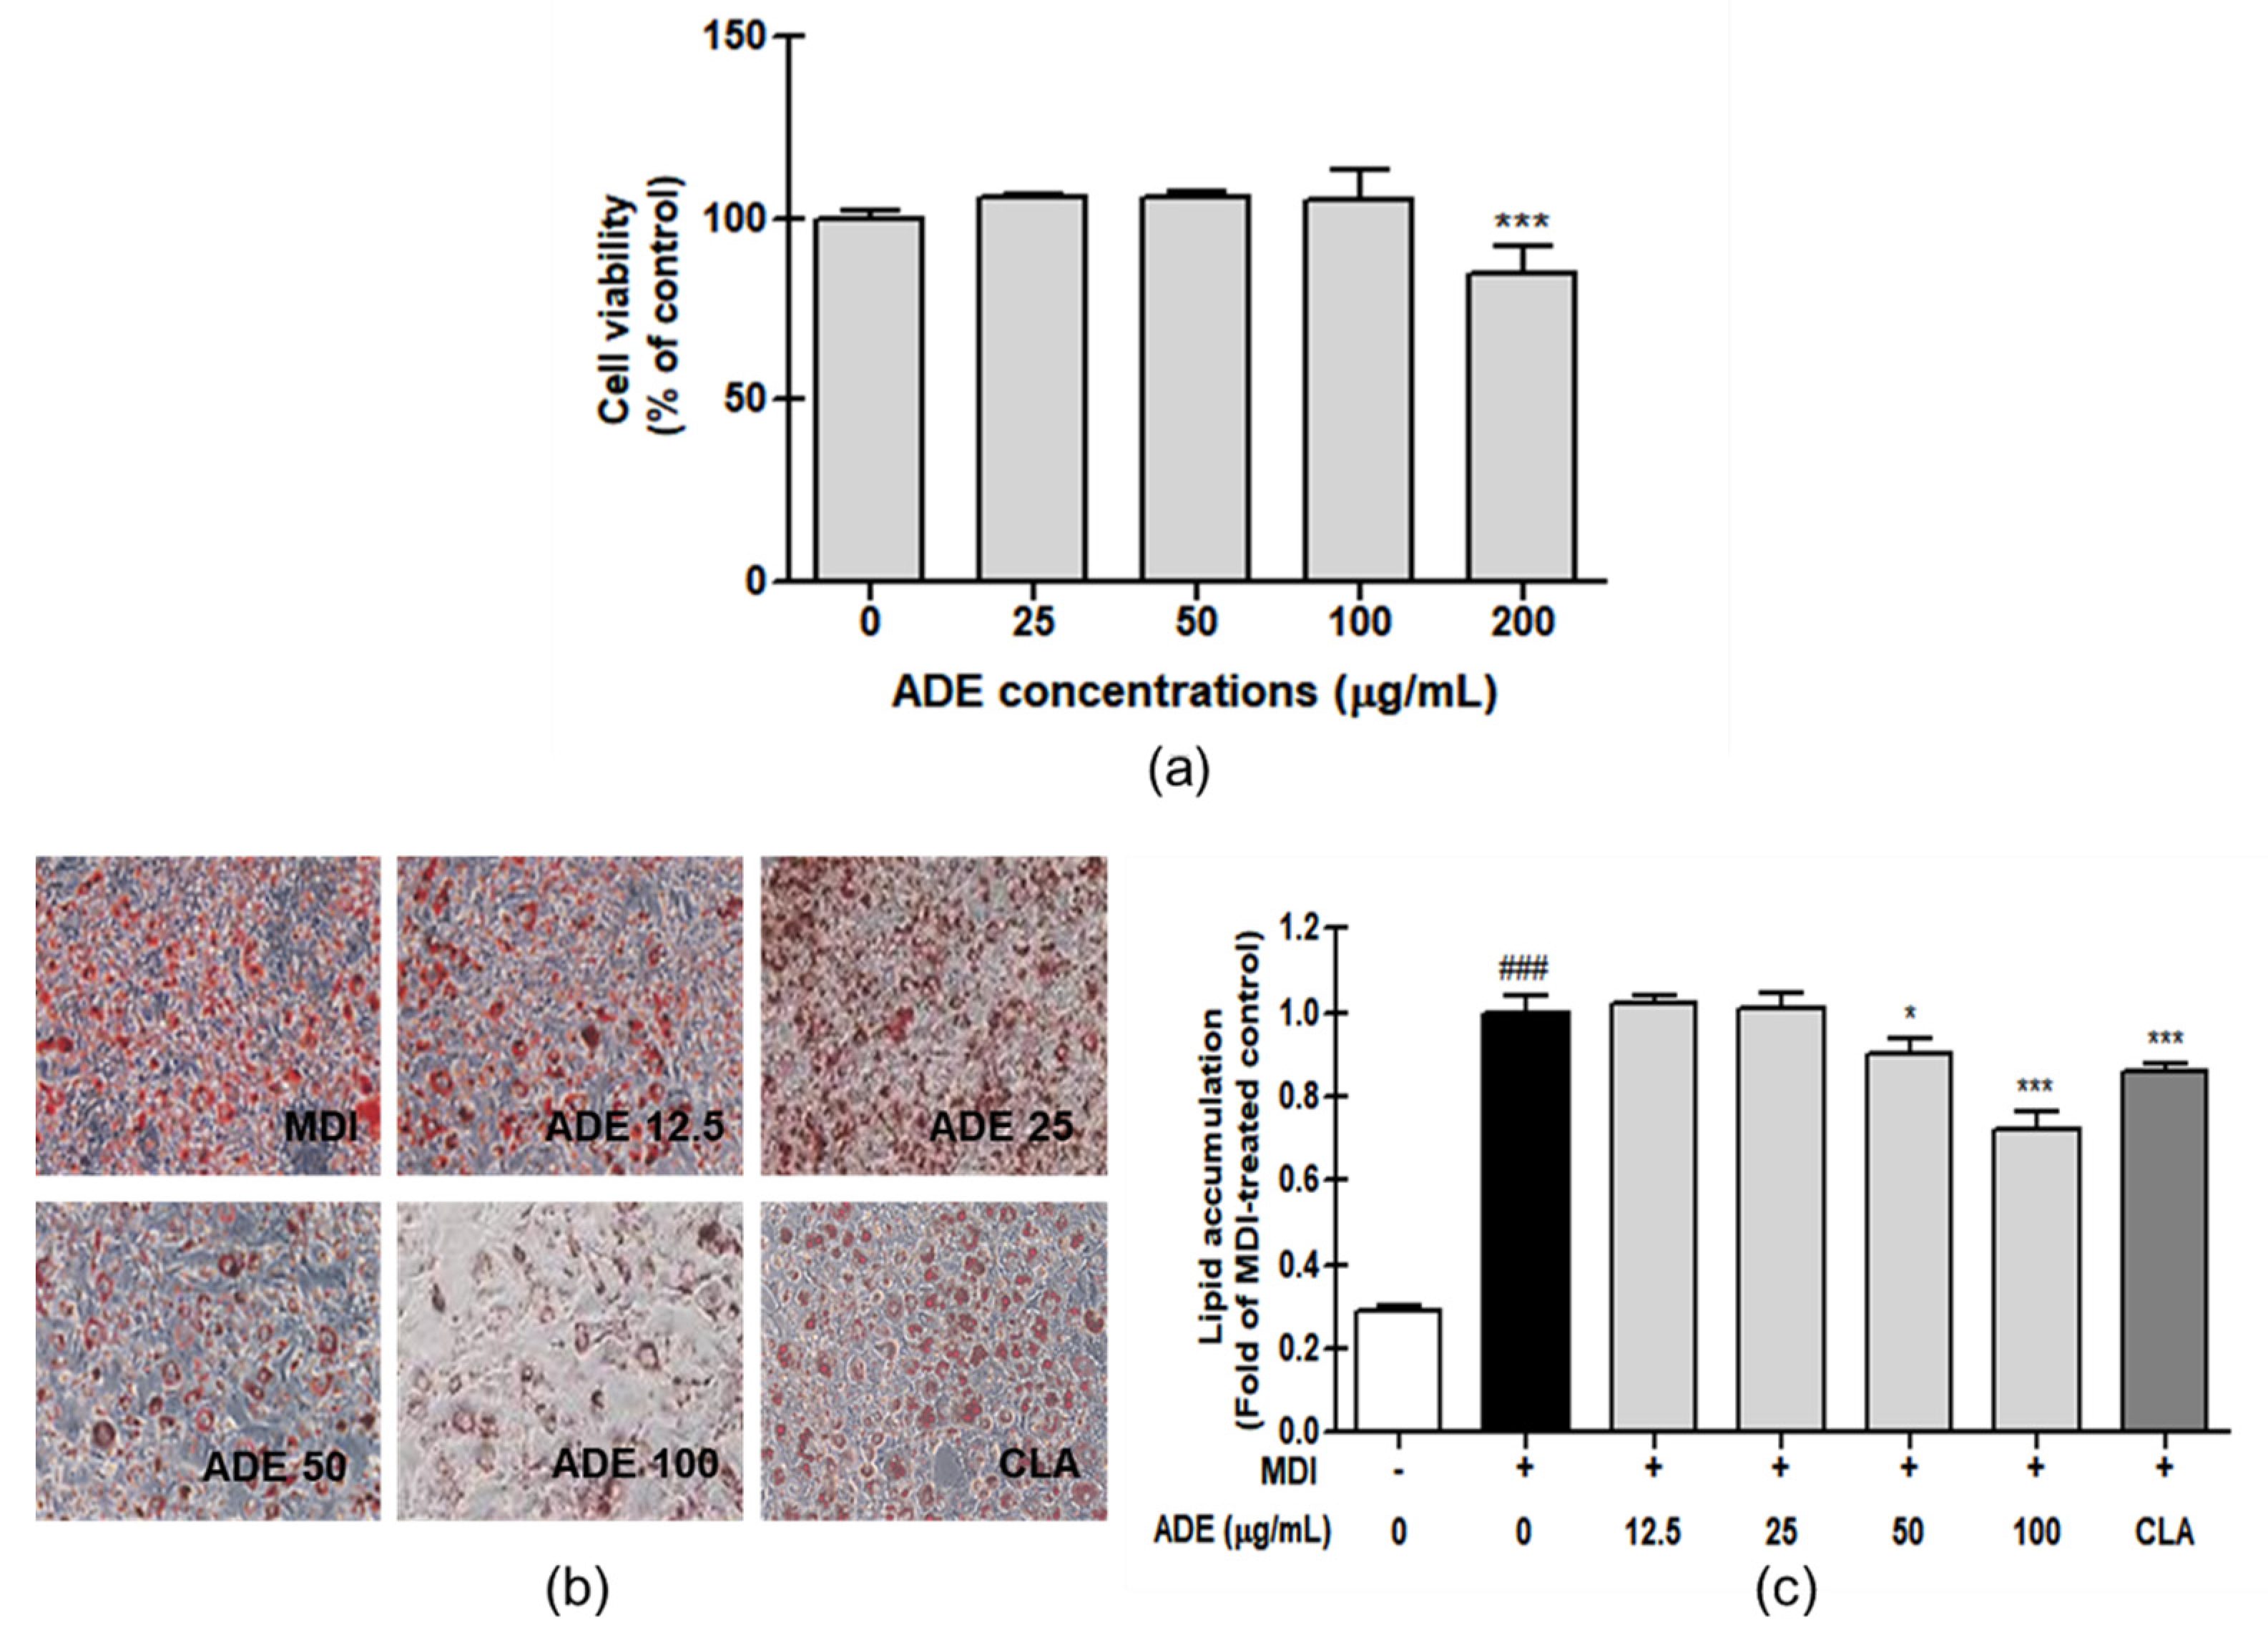
3.1. ADE Has Anti-Adipogenesis Effect on 3T3-L1 Adipocyte

The viability of 3T3-L1 adipocytes did not change 25–100 μg/mL ADE (≥100%), while 200 μg/mL ADE (85.97%, p < 0.001) was cytotoxic (Figure 1a). Therefore, ADE concentrations up to 100 μg/mL were used for subsequent experiments. The anti-adipogenic effect of ADE was determined using ORO during the differentiation. Microscopically, the MDI control group had more stained lipid droplets than the undifferentiated controls, and the stained lipid droplets of the ADE groups were decreased with 50 and 100 μg/mL (Figure 1b). The amount was also significantly increased in the differentiated controls compared to the undifferentiated controls (3.46-fold vs. control, p < 0.001) and the 50 and 100 μg/mL ADE groups had lower fat accumulation rates (0.90- and 0.72-fold vs. MDI control, p < 0.05 and p < 0.001). In particular, the level was lower in the 100 μg/mL ADE group than the positive controls (conjugated linoleic acids, CLA; 0.86-fold vs. MDI control, p < 0.001), shown in Figure 1c.

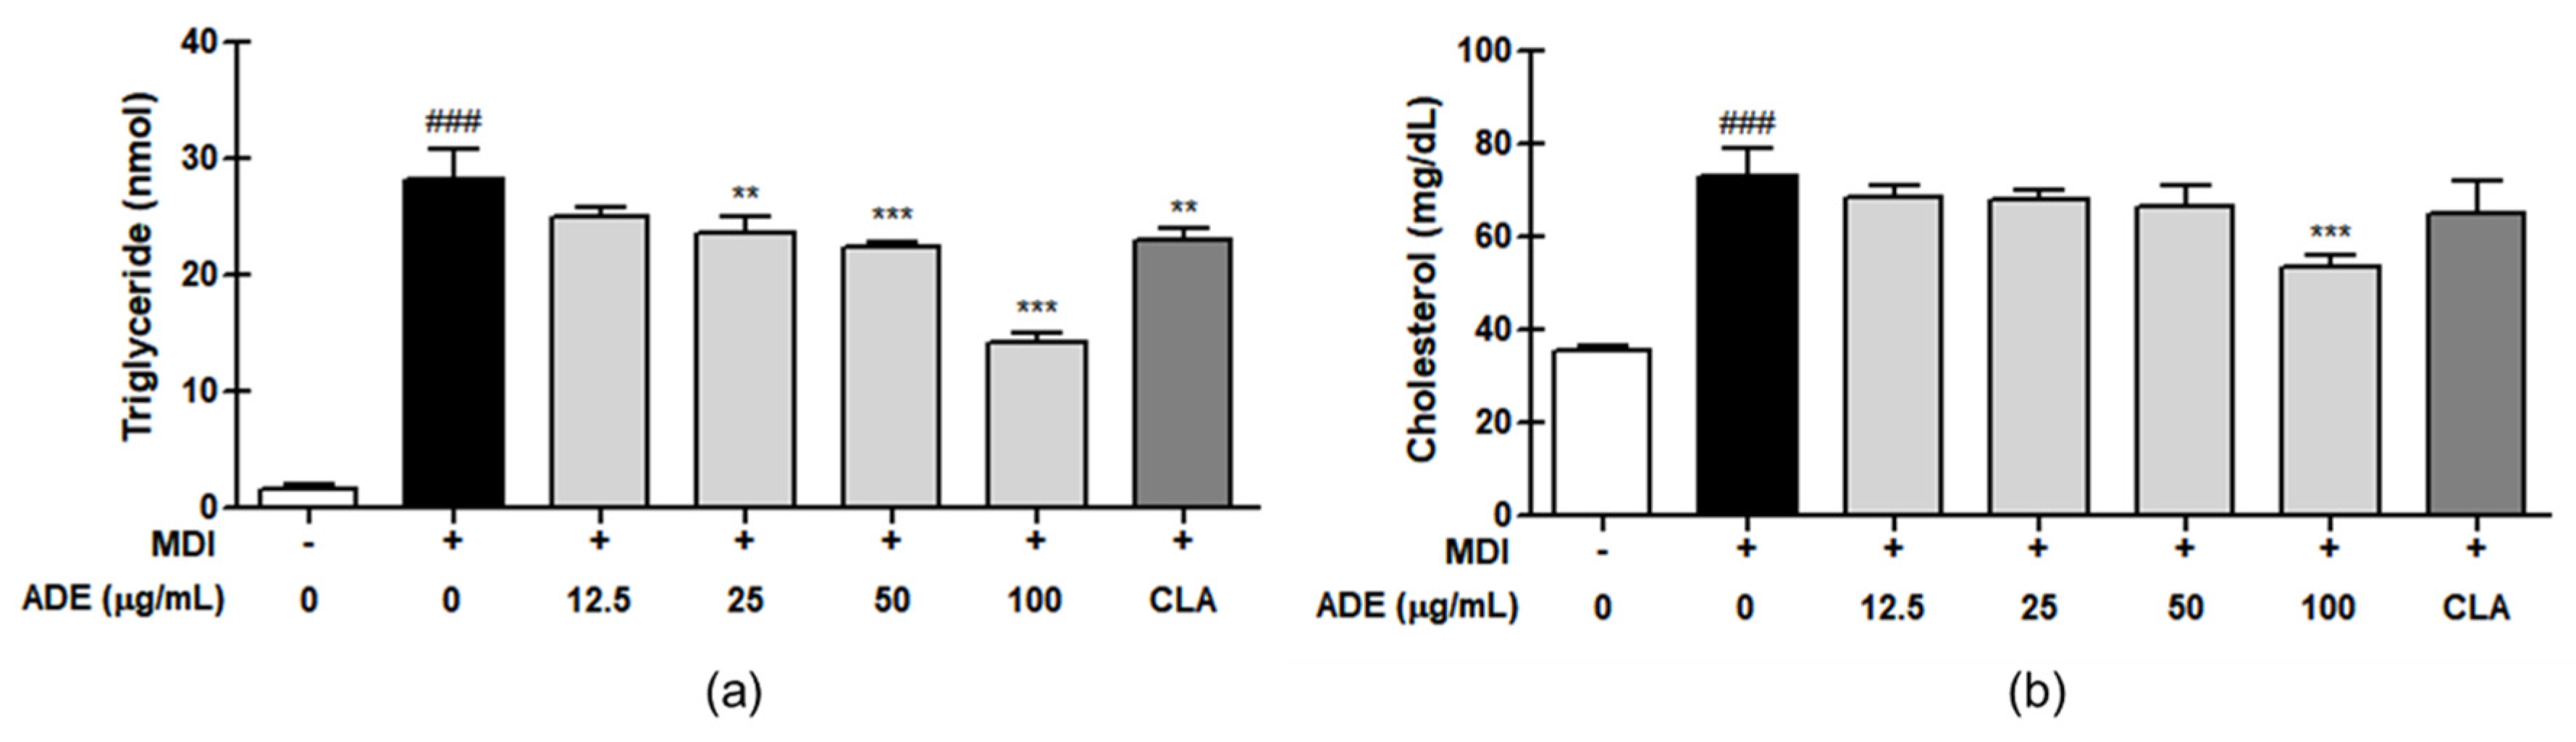
3.2. ADE Reduces the TG and Total Cholesterol Levels in 3T3-L1 Adipocytes

Exposure to MDI to cause the differentiation led to increases in the TG content compared to the control (16.91-fold vs. control, p < 0.001; Figure 2a). All ADE concentrations from 25 μg/mL inhibited TG accumulation. The TG levels were markedly lower in the 50 and 100 μg/mL ADE groups (0.79- and 0.50-fold vs. MDI control, p < 0.001). The level in the positive control (CLA, 50 μM) was 0.83-fold vs. MDI control (p < 0.01), which was similar to 50 μg/mL, but higher than 100 μg/mL ADE. The cholesterol level was significantly increased in the MDI control (2.05-fold vs. control, p < 0.001; Figure 2b). Treatment with 100 μg/mL ADE reduced cholesterol by 0.77-fold (p < 0.001) compared with MDI control and was lower than in the positive control (CLA, 50 μM; 1.03-fold vs. MDI control). Therefore, 50 and 100 μg/mL ADE were used to examine adipogenic- and lipogenic-related protein expression on 3T3-L1 adipocytes.

3.3. ADE Induced Anti-Adipogenesis by Controlling Adipogenesis Marker Proteins and mRNA Expression on 3T3-L1 Adipocytes

To elucidate whether 50 and 100 μg/mL ADE were linked to their anti-adipogenic effects on 3T3-L1 adipocytes, the expression of the adipogenic-related proteins C/EBPα and PPARγ [6] was measured by Western blotting. The addition of 50 or 100 μg/mL ADE dramatically decreased the levels of C/EBPα (0.43- and 0.22-fold vs. MDI control, p < 0.001) and PPARγ (0.62- and 0.45-fold vs. MDI control, p < 0.001) proteins in 3T3-L1 adipocytes (Figure 3a). Since the expressions of adipogenic-related adipoq and ap2 mRNA are changed by regulating C/EBPα and PPARγ, the mRNA expression was measured [24]. The expression of adipoq was markedly decreased (0.45-fold vs. control, p < 0.01) and the ap2 expression was increased (3.71-fold vs. control, p < 0.001; Figure 3b) in the MDI control. Treatment with 100 μg/mL ADE increased adipoq mRNA by 3.45-fold and reduced ap2 mRNA by 0.38-fold (vs. MDI control, p < 0.001).

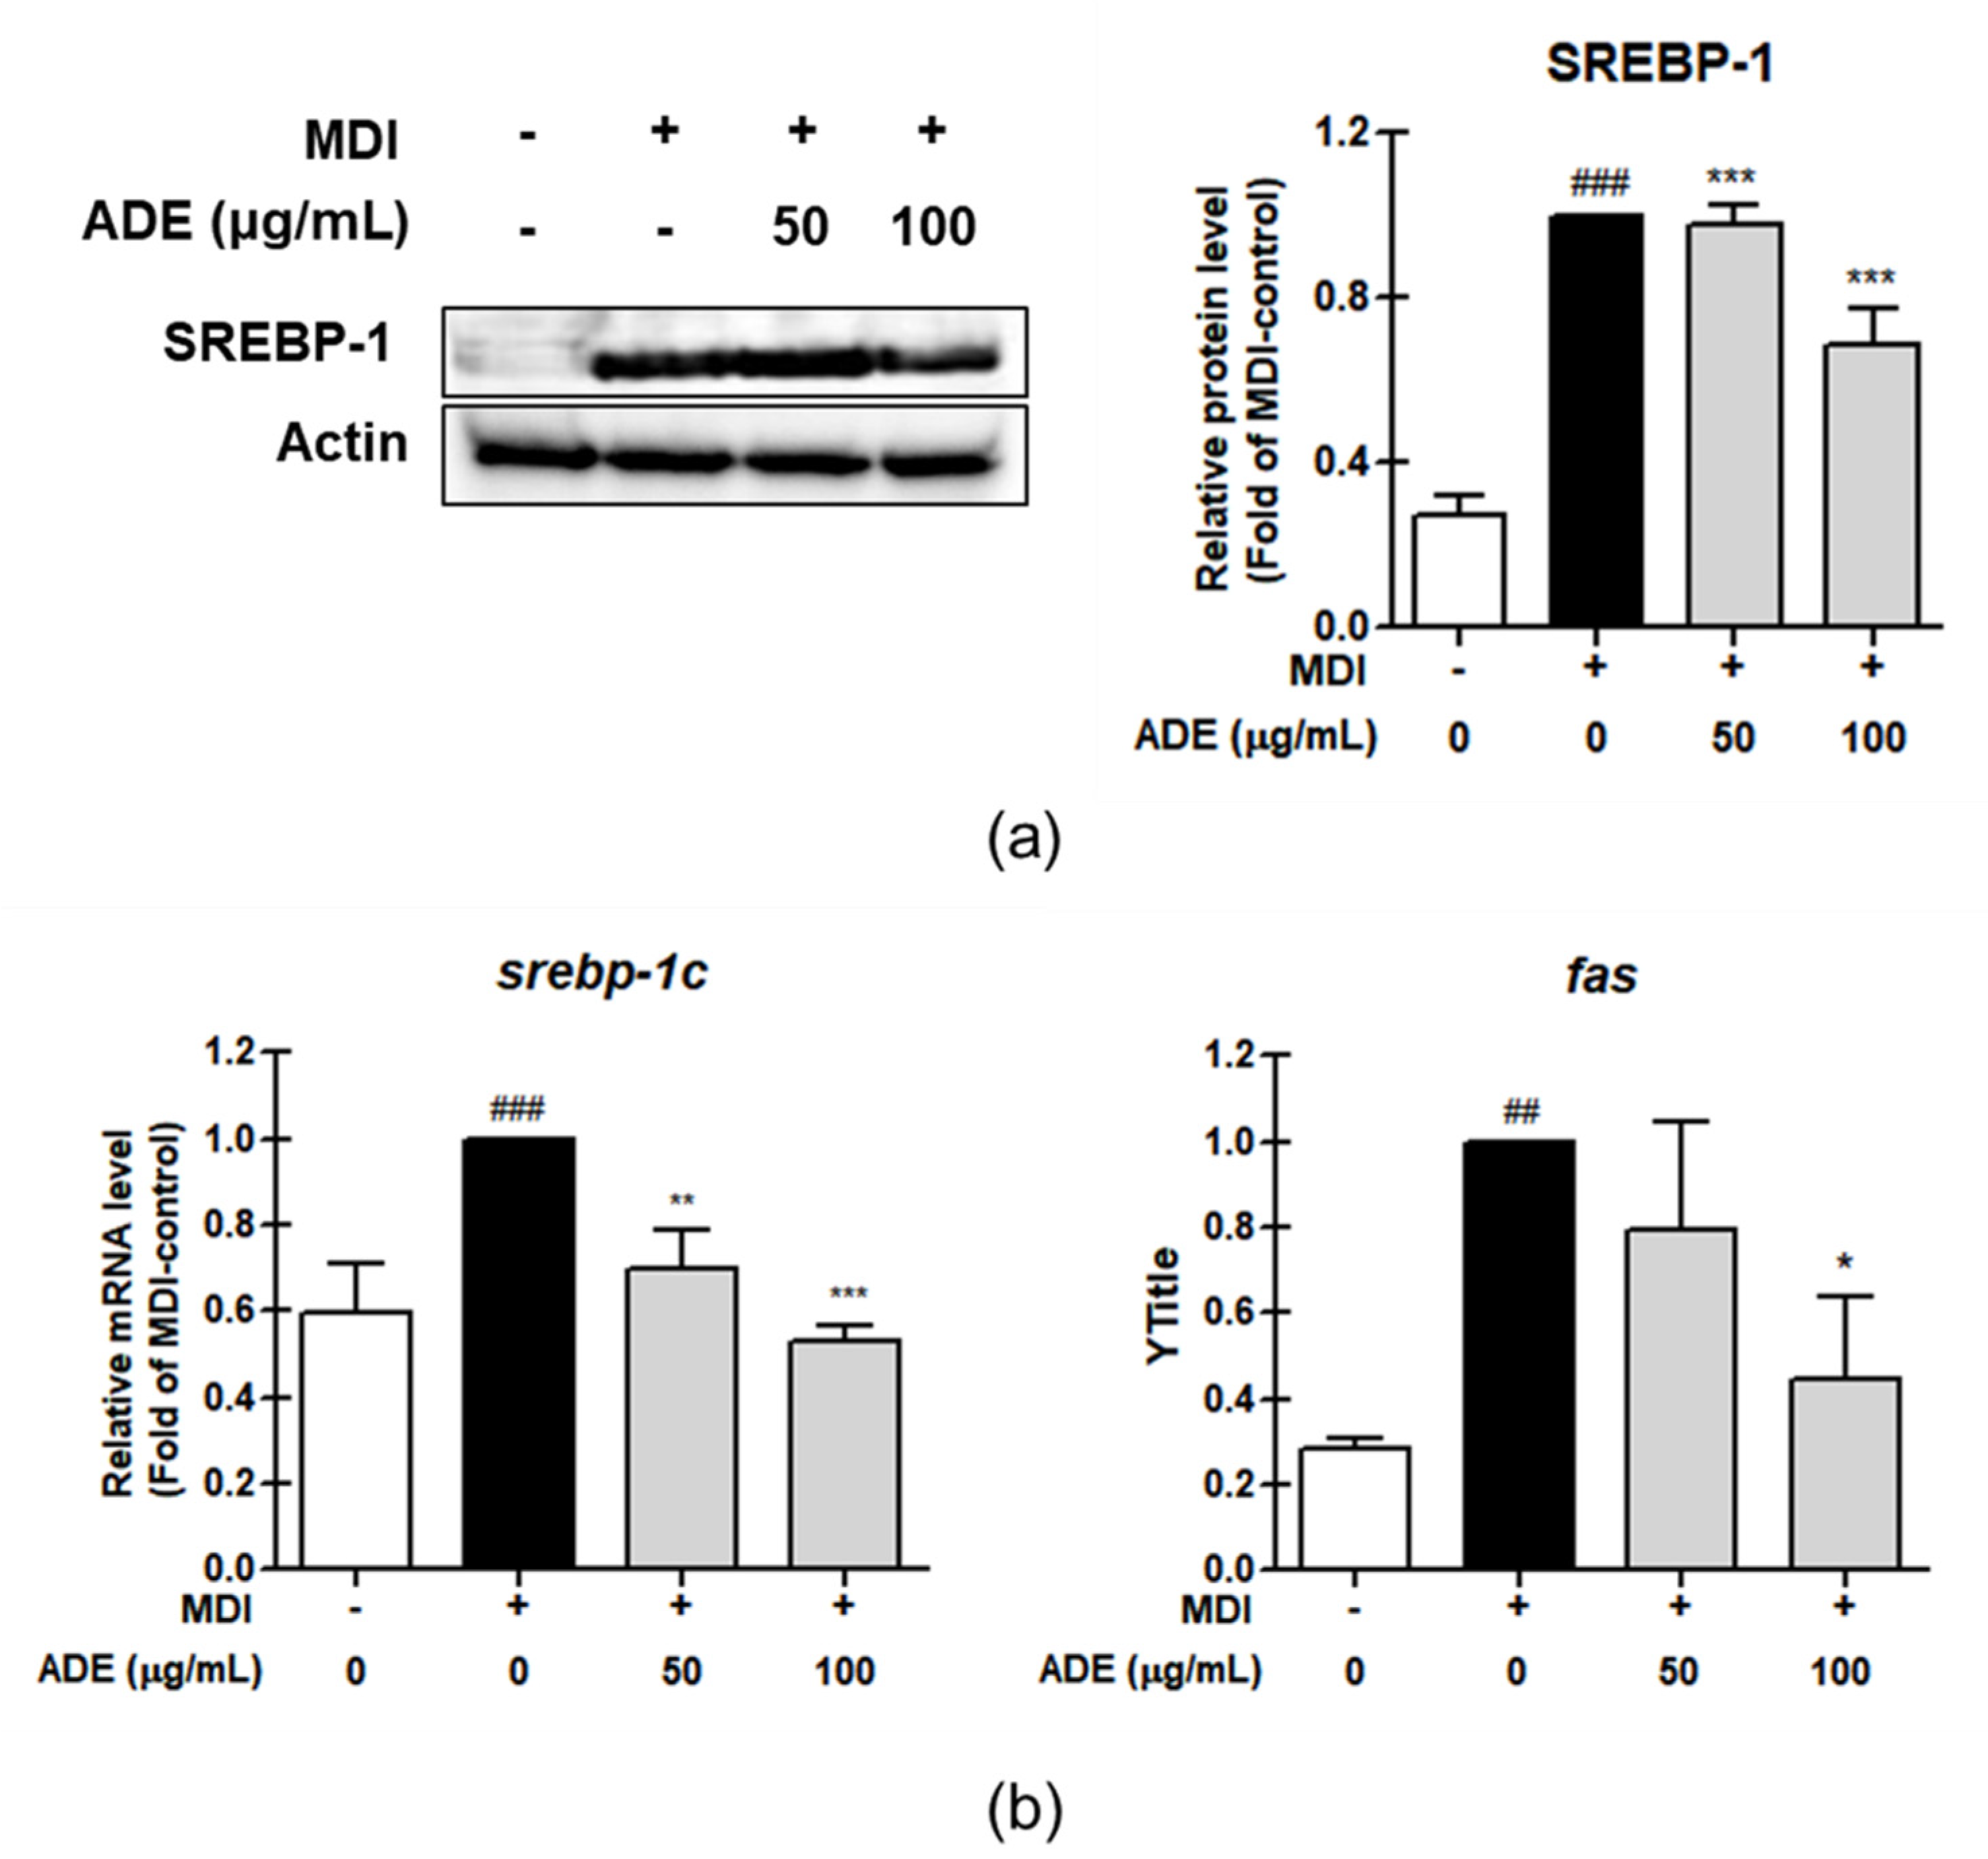
3.4. ADE Downregulates Lipogenesis Protein and mRNA Expression on 3T3-L1 Adipocytes

We explored whether ADE alters the expression of lipogenic-related protein and mRNA on 3T3-L1 adipocytes. SREBP-1 is a key transcription factor in the induction of lipogenesis [25]. As shown in Figure 4a, marked SREBP-1 protein expression was induced by 3.66-fold (vs. control, p < 0.001) in MDI control. After treatment with 100 μg/mL ADE, it declined rapidly by about 0.68-fold (vs. MDI control, p < 0.001). In the SREPB-1 family, srebp1c is a lipogenic gene and fas is activated by SREBPs [26]. The srebp-1c and fas mRNA levels in 3T3-L1 adipocytes were upregulated in the MDI control (3.52- and 1.68-fold vs. control, p < 0.001 and p < 0.01; Figure 4b). Conversely, 100 μg/mL ADE downregulated the srebp-1c and fas mRNA levels by 0.45- and 0.53-fold, respectively (vs. MDI control, p < 0.001 and p < 0.05).

3.5. Antioxidant Activities of ADE

Oxidative stress promotes adipogenesis, which is the conversion of pre-adipocytes-to-adipocytes [27]. Thus, the antioxidant activity and phenol, flavonoid, and phenolic contents were measured to examine functional compounds that account for the antioxidant activity and anti-adipogenic and anti-lipogenic effects. The DPPH and ABTS+ scavenging assay, indicative of antioxidant activity, was assessed with a simple colorimetric method [23]. The antioxidant activity of ADE was examined using ascorbic acid. The IC50 values of ADE were 66.96 and 30.56 μg/mL for the ABTS+ and DPPH scavenging effects, respectively (Table 2). The phenols and flavonoids have beneficial antioxidant effects [28], so TPC and TFC were measured. The ADE contained 127.39 mg/g TPC and 104.17 mg/g TFC.
Phenolic compounds responsible for the beneficial effects of ADE were analyzed by HPLC (Figure 5). To determine the phenolic compounds, ADE was re-extracted in phenol-rich fractions. The phenolic compounds are shown in Table 3. Only chlorogenic (7.04 ± 1.10 mg/kg), caffeic (20.14 ± 0.52 mg/kg), ferulic (1.74 ± 0.87 mg/kg), veratric (29.31 ± 4.26 mg/kg), and cinnamic (4.70 ± 0.86 mg/kg) acids and quercetin (418.41 ± 7.26 mg/kg) were detected in the ADE. Therefore, these compounds likely play a crucial role in the anti-adipogenic effects of ADE.

4. Discussion

This study explored the anti-obesity potential of ADE by regulating the expression of adipogenic proteins and mRNA, such as C/EBPα, PPARγ, AdipoQ, and Ap2, and the lipogenic proteins and mRNA, including SREBP1c and FAS in 3T3-L1 adipocytes. The ADE extract had antioxidant activity, as shown with the ABTS and DPPH scavenging assays, and antioxidants were detected in the TPC, TFC, and HPLC analyses.
Obesity is associated with adipocyte differentiation and lipid accumulation [29]. Adipogenesis is the differentiation of pre-adipocytes into mature adipocytes, which have a large internal lipid droplet and store TG [30]. When ADE was treated in the process of differentiation of 3T3L1 adipocytes, lipid droplets and TG were effectively decreased (Figure 1 and Figure 2). This result is seen as a result of reducing adipogenesis. To evaluate the protein expression of adipogenic-related factors, adipocyte-specific transcription factors such as C/EBPα, PPARγ, and SREBP-1 were identified [31]. The activation of adipogenesis involves the cooperative interplay of members of the C/EBP and PPAR families, especially C/EBPα and PPARγ. They promote adipocyte differentiation by activating the transcription of the other synergistically [6]. C/EBPα and PPARγ activate downstream genes like adipoq and ap2 at the terminal stage of differentiation to cause fat accumulation in cells [24]. SREBP-1 controls lipogenesis and lipid homeostasis [30] by mediating the induction of lipid synthesis, cholesterol synthesis, and lipogenic enzyme genes such as srebp-1c and fas [7]. ADE reduced the total cholesterol content by inhibiting the expressions of the SREBP-1, srebp-1c, and fas factors involved in cholesterol synthesis (Figure 4) in adipocytes.
One study reported a correlation between antioxidants and obesity prevalence and found that free radicals promote the conversion of pre-adipocytes into mature adipocytes [31]. DPPH and ABTS free radical scavenging is a simple, convenient method for assessing antioxidant activity in food and complex samples [32]. As shown in Table 1, the free radical scavenging capacity (IC50) of ADE was 66.96 μg/mL in DPPH and 30.56 μg/mL in ABTS, which are better than the values of other medicinal plants [33]. Some phenols and flavonoids exert antioxidant activity and anti-obesity effects by lowering TG and cholesterol levels, reducing adipogenic transcription factors, and increasing fat oxidation [34]. As mentioned above, ADE contained 127.39 mg/g total phenols and 104.17 mg/g total flavonoids (Table 2). Using HPLC, ADE was found to contain the compounds shown in Figure 5. Of these, the quercetin levels were highest (418.41 mg/kg) in ADE (Table 3). Quercetin reduces lipid accumulation in obese mice by increasing heme oxygenase-1, an antioxidant enzyme, and downregulating the adipocyte-specific transcription factors C/EBPα and PPARγ [35,36]. Quercetin in ADE likely plays a critical role in downregulating adipocyte-specific transcription factors and generating antioxidant activity.

5. Conclusions

ADE prevents adipogenesis and lipogenesis processes in 3T3-L1 adipocytes by suppressing lipid droplets, TG, and cholesterol levels. ADE acts by regulating transcription factors, C/EBPα, PPARγ, SREBP-1, and their target mRNAs, such as SREBP-1c, FAS, AdipoQ, and Ap2. ADE affects ABTS and DPPH scavenging and contains phenols and flavonoids such as caffeic, ferulic, veratric, and cinnamic acids and quercetin, which have critical roles in its anti-adipogenic and -lipogenic effects. Therefore, ADE may be a useful functional food for treating and obesity and a source of new antioxidants and anti-obesity therapeutics.

Author Contributions

Conceptualization, K.H.S. and H.D.K.; methodology, J.Y.L. and J.-Y.P.; data curation, J.Y.L., H.T.S., H.-AS., Y.-J.J. and S.E.L.; resources, H.T.S.; writing—original draft preparation, J.Y.L.; writing—review and editing, K.H.S. and H.D.K.; funding acquisition, H.D.K. and K.H.S. All authors have read and agreed to the published version of the manuscript.

Funding

This work was supported by the Cooperative Research Program for Agriculture Science and Technology Development Program (PJ01361603), Rural Development Administration, Republic of Korea.

Conflicts of Interest

The authors declare no conflict of interest. The founding sponsors had no role in the design of the study; collection, analyses, or interpretation of the data; writing of the manuscript; or the decision to publish the results.

References

  1. Achike, F.I.; To, N.H.P.; Wang, H.; Kwan, C.Y. Obesity, metabolic syndrome, adipocytes and vascular function: A holistic viewpoint. Clin. Exp. Pharmacol. 2011, 38, 1–10. [Google Scholar] [CrossRef]
  2. Low, S.; Chin, M.C.; Deurenberg-Yap, M. Review on epidemic of obesity. Ann. Acad. Med. Singap. 2009, 38, 57. [Google Scholar]
  3. Morshed, A.B.; Kasman, M.; Heuberger, B.; Hammond, R.A.; Hovmand, P.S. A systematic review of system dynamics and agent-based obesity models: Evaluating obesity as part of the global syndemic. Obes. Rev. 2019, 20, 161–178. [Google Scholar] [CrossRef] [Green Version]
  4. Rashad, I.; Grossman, M. The Economics of Obesity; Public Interest: Denville, NJ, USA, 2004; pp. 104–113. [Google Scholar]
  5. Ilze, V.; Alvaro, M.V.; Josias, H.H. Natural products in anti-obesity therapy. Nat. Prod. Rep. 2011, 28, 1493–1533. [Google Scholar]
  6. Mandrup, S.; Lane, M.D. Regulating adipogenesis. J. Biol. 1997, 272, 5367–5370. [Google Scholar] [CrossRef] [Green Version]
  7. Kersten, S. Mechanisms of nutritional and hormonal regulation of lipogenesis. EMBO Rep. 2001, 2, 282–286. [Google Scholar] [CrossRef] [PubMed] [Green Version]
  8. Turker, I.; Zhang, Y.; Zhang, Y.; Rehman, J. Oxidative stress as a regulator of adipogenesis. FASEB J. 2007, 21, A1053. [Google Scholar]
  9. Youn, J.S.; Shin, S.Y.; Wu, Y.X.; Hwang, J.Y.; Cho, J.H.; Ha, Y.G.; Kim, J.K.; Park, M.J.; Lee, S.H.; Kim, T.H. Antioxidant and anti-wrinkling effects of Aruncus dioicus var. kamtschaticus extract. Korean J. Food Preserv. 2012, 19, 393–399. [Google Scholar] [CrossRef] [Green Version]
  10. Kim, A.N.; Lee, K.Y.; Ha, Y.G.; Heo, H.J.; Cho, S.G. Effect of freeze, hot-air, and vacuum drying on antioxidant properties and quality characteristics of samnamul (Aruncus dioicus var. kamtschaticus). Korean J. Food Preserv. 2018, 25, 811–818. [Google Scholar] [CrossRef]
  11. Zhang, Q.; Kim, H.Y. DNA damage protection and anti-inflammatory activity of different solvent fractions from Aruncus dioicus var. kamtschaticus. Korean J. Plant Res. 2014, 27, 714–719. [Google Scholar] [CrossRef]
  12. Lee, K.C.; Han, S.K.; Kwon, Y.H.; Jeon, S.R.; Lee, C.W.; Seo, D.J.; Park, W.G. Effects of Shading Treatments on Growth and Physiological Characteristics of Aruncus dioicus var. kamtschaticus (Maxim.) H. Hara Seedling. Korean J. Med. Crop Sci. 2019, 27, 30–37. [Google Scholar] [CrossRef]
  13. Ahn, H.; Kim, J.; Kim, J.; Auh, J.; Choe, E. In vitro α-glucosidase and pancreatic lipase inhibitory activities and antioxidants of Samnamul (Aruncus dioicus) during rehydration and cooking. Food Sci. Biotechnol. 2014, 23, 1287–1293. [Google Scholar] [CrossRef]
  14. Kim, J.I.; Yun, J.A.; Jeong, Y.K.; Baek, H.J. Hypoglycemic and hypolipidemic effects of samnamul (Shoot of Aruncus dioicus var. kamtschaticus Hara) in mice fed a high-fat/high-sucrose diet. Food Sci. Biotechnol. 2018, 27, 1467–1473. [Google Scholar] [CrossRef] [PubMed]
  15. Lee, J.Y.; Park, J.Y.; Kim, H.D.; Lee, S.E.; Lee, J.H.; Lee, Y.; Seo, K.H. Anti-oxidant and anti-adipocyte differentiation of Aster glehni and Aster yomena. J. Nutr. Health 2019, 52, 250–257. [Google Scholar] [CrossRef]
  16. Ramirez-Zacarias, J.; Castro-Munozledo, F.; Kuri-Harcuch, W. Quantitation of adipose conversion and triglycerides by staining intracytoplasmic lipids with Oil red O. Histochemistry 1992, 97, 493–497. [Google Scholar] [CrossRef] [PubMed]
  17. Mahmood, T.; Yang, P.C. Western blot: Technique, theory, and trouble shooting. N. Am. J. Med. Sci. 2012, 4, 429. [Google Scholar] [PubMed]
  18. Mishra, K.; Ojha, H.; Chaudhury, N.K. Estimation of antiradical properties of antioxidants using DPPH assay: A critical review and results. Food Chem. 2012, 130, 1036–1043. [Google Scholar] [CrossRef]
  19. Miller, N.J.; Rice-Evans, C.A. Factors influencing the antioxidant activity determined by the ABTS•+ radical cation assay. Free Radical Res. 1997, 26, 195–199. [Google Scholar] [CrossRef]
  20. Azlim Almey, A.; Ahmed Jalal Khan, C.; Syed Zahir, I.; Mustapha Suleiman, K.; Aisyah, M.; Kamarul Rahim, K. Total phenolic content and primary antioxidant activity of methanolic and ethanolic extracts of aromatic plants’ leaves. Int. Food Res. 2010, 17, 1077–1084. [Google Scholar]
  21. Pękal, A.; Pyrzynska, K. Evaluation of aluminium complexation reaction for flavonoid content assay. Food Anal. Methods 2014, 7, 1776–1782. [Google Scholar] [CrossRef] [Green Version]
  22. Kim, M.Y.; Jang, G.Y.; Lee, S.H.; Kim, K.M.; Lee, J.; Jeong, H.S. Preparation of black soybean (Glycine max L) extract with enhanced levels of phenolic compound and estrogenic activity using high hydrostatic pressure and pre-germination. High. Press. Res. 2018, 38, 177–192. [Google Scholar] [CrossRef]
  23. Lee, J.Y.; Park, J.Y.; Kim, D.H.; Kim, H.D.; Ji, Y.J.; Seo, K.H. Erigeron annuus protects PC12 neuronal cells from oxidative stress induced by ROS-mediated apoptosis. Evid.-Based Compl. Alt. 2020. [Google Scholar] [CrossRef] [PubMed] [Green Version]
  24. Cristancho, A.G.; Lazar, M.A. Forming functional fat: A growing understanding of adipocyte differentiation. Nat. Rev. Mol. 2011, 12, 722–734. [Google Scholar] [CrossRef] [PubMed]
  25. Shimano, H.; Yahagi, N.; Amemiya Kudo, M.; Hasty, A.H.; Osuga, J.I.; Tamura, Y.; Shionoiri, F.; Iizuka, Y.; Ohashi, K.; Harada, K. Sterol regulatory element-binding protein-1 as a key transcription factor for nutritional induction of lipogenic enzyme genes. J. Biol. Chem. 1999, 274, 35832–35839. [Google Scholar] [CrossRef] [Green Version]
  26. Shimano, H. Sterol regulatory element-binding proteins (SREBPs): Transcriptional regulators of lipid synthetic genes. Prog. Lipid Res. 2001, 40, 439–452. [Google Scholar] [CrossRef]
  27. Gummersbach, C.; Hemmrich, K.; Kröncke, K.-D.; Suschek, C.V.; Fehsel, K.; Pallua, N. New aspects of adipogenesis: Radicals and oxidative stress. Differentiation 2009, 77, 115–120. [Google Scholar] [CrossRef]
  28. Rice-Evans, C.A.; Miller, N.J.; Paganga, G. Structure-antioxidant activity relationships of flavonoids and phenolic acids. Free Radical Biol. Med. 1996, 20, 933–956. [Google Scholar] [CrossRef]
  29. Kim, S.; Ahn, S.H.; Park, J.H.; Park, C.H.; Sin, Y.S.; Shin, G.W.; Kwon, J. Anti-adipogenic effects of viscothionin in 3T3-L1 adipocytes and high fat diet induced obesity mice. Appl. Biol. Chem. 2020, 63, 1–9. [Google Scholar] [CrossRef]
  30. Ali, A.T.; Hochfeld, W.E.; Myburgh, R.; Pepper, M.S. Adipocyte and adipogenesis. Eur. J. Cell Biol. 2013, 92, 229–236. [Google Scholar] [CrossRef]
  31. Sarjeant, K.; Stephens, J.M. Adipogenesis. Csh. Perspect. Biol. 2012, 4, a008417. [Google Scholar] [CrossRef] [Green Version]
  32. Magalhães, L.M.; Segundo, M.A.; Reis, S.; Lima, J.L. Methodological aspects about in vitro evaluation of antioxidant properties. Anal. Chim. Acta. 2008, 613, 1–19. [Google Scholar] [CrossRef] [PubMed]
  33. Lee, Y.M.; Bae, J.H.; Jung, H.Y.; Kim, J.H.; Park, D.S. Antioxidant activity in water and methanol extracts from Korean edible wild plants. J. Korean Soc. Food Sci. Nutr. 2011, 40, 29–36. [Google Scholar] [CrossRef]
  34. Mashmoul, M.; Azlan, A.; Khaza’ai, H.; Yusof, B.N.M.; Noor, S.M. Saffron: A natural potent antioxidant as a promising anti-obesity drug. Antioxidants 2013, 2, 293–308. [Google Scholar] [CrossRef] [Green Version]
  35. Kim, C.S.; Kwon, Y.; Choe, S.Y.; Hong, S.M.; Yoo, H.; Goto, T.; Kawada, T.; Choi, H.S.; Joe, Y.; Chung, H.T. Quercetin reduces obesity-induced hepatosteatosis by enhancing mitochondrial oxidative metabolism via heme oxygenase-1. Nutr. Metab. 2015, 12, 33. [Google Scholar] [CrossRef] [PubMed] [Green Version]
  36. Carvajal-Aldaz, D.G. Inhibition of Adipocyte Differentiation in 3T3-L1 Cell Line by Quercetin or Isorhamnetin. Master’s Theses, Louisiana State University, Baton Rouge, LA, USA, December 2012. [Google Scholar]
Figure 1. Cell viability (a) and inhibition of lipid droplet accumulation by ADE on microscopy (b) and quantifications (c) of 3T3-L1 adipocytes. Differentiating cells were treated every 2 days with extracts (25–100 µg/mL) for 8 days in adipocyte-induction media. Conjugated linoleic acid (CLA) (50 μM) was a positive control. All values are means ± SD (n = 3). ### p < 0.001 vs. non-MDI treated control; * p < 0.05 and *** p <0.001 vs. MDI control. MDI, media of differentiation; ADE, A. dioicus extract.
Processes 08 01576 g001
Figure 2. Effect on triglyceride (a) and cholesterol contents (b) of ADE. Differentiating 3T3-L1 adipocytes were treated with every 2 days with extracts (25–100 µg/mL) for 8 days in adipocyte-induction media. CLA (50 μM) was a positive control. All values are means ± SD (n = 3). ### p < 0.001 vs. non-MDI treated control; ** p < 0.01, *** p < 0.001 vs. MDI control. MDI, media of differentiation; ADE, A. dioicus extract.
Processes 08 01576 g002
Figure 3. Effect of ADE on levels of adipogenic-related proteins and mRNA in 3T3-L1 adipocytes. Differentiating 3T3-L1 cells were treated every 2 days with extracts (50 and 100 µg/mL) for 8 days in adipocyte-induction media. Protein expressions C/EBPα and PPARγ were performed by Western blotting (a). The mRNA expressions of adipoq and ap2 were evaluated by the quantitative real-time PCR (b). Relative levels were normalized to their β-actin (n = 3). ## p < 0.01 and ### p < 0.001 vs. non-MDI treated control; * p < 0.05, ** p < 0.01 and *** p < 0.001 vs. MDI treated control. MDI, media of differentiation; ADE, A. dioicus extract.
Processes 08 01576 g003
Figure 4. The expressions of lipogenesis-related protein and mRNA in 3T3-L1 adipocytes with ADE. Differentiating 3T3-L1 cells were treated with extracts (50 and 100 µg/mL) for 8 days in adipocyte-induction media. Protein expressions SREBP1 was performed by Western blotting (a). The mRNA expressions of srebp-1c and fas were measured by the qPCR (b). Relative levels were normalized to their β-actin (n = 3). ## p < 0.01 and ### p < 0.001 vs. non-MDI treated control; * p < 0.05, ** p < 0.01 and *** p < 0.001 vs. MDI treated control. MDI, media of differentiation; ADE, A. dioicus extract.
Processes 08 01576 g004
Figure 5. The chromatograms of phenolic compounds from ADE based on HPLC analysis. Peak identification: 1: homogentisic acid, 2: protocatechuic acid, 3: gentisic acid, 4: chlorogenic acid, 5: caffeic acid, 6: phloretic acid, 7: p-coumaric acid, 8: ferulic acid, 9: veratric acid, 10: cinnamic acid, 11: quercetin, 12: naringenin, and 13: hesperidin. Chromatogram of (a) standard solution used for phenolic compound analysis (100 μg/mL each), (b) ADE (20 mg/mL). ADE, A. dioicus extract.
Processes 08 01576 g005
Table 1. Primer sequence of lipogenic-related genes for RT–PCR.
Gene 1 Sequence (5′→3′)
adipoqForwardAATTCCCAGGAAGATGAAGG
ReverseGAAGAACAAGCCAAAGACCA
ap2ForwardGGAAGCTTGTCTCCAGTGAA
ReverseCGCCTTTCATAACACATTCC
srebp-1cForwardTTGAGGATAGCCAGGTCAAA
ReverseACAAAGAGAAGAGCCAAGCA
fasForwardAAGCAAGAAGGTGTGTTTGC
ReverseCTTCATCAAGGGAATGATGG
β-actinForwardACAGGCATTGTGATGGACTC
ReverseAGAAGGAAGGCTGGAAAAGA
1adipoq, adiponectin; ap2, adipocyte protein 2; srebp-1c, sterol regulatory element-binding protein-1c; fas, fatty acid synthesis.
Table 2. Antioxidant activities and compound contents in A. dioicus extract.
SampleDPPH (IC50, μg/mL)ABTS (IC50, μg/mL)Contents
Total Phenol (mg GA/g Extract)Total Flavonoid (mg CE/g Extract)
A. dioicus66.96 ± 3.17 b30.56 ± 0.20 b127.39 ± 1.04104.17 ± 3.31
Ascorbic acid4.36 ± 0.32 c5.91 ± 0.11 c--
All values are means ± SD. Means with different letters on the same column are significantly different at p < 0.05 by Duncan’s test.
Table 3. HPLC analysis of phenolics extracted from A. dioicus.
Phenolics (mg/kg)Chlorogenic AcidCaffeic AcidFerulic AcidVeratric AcidCinnamic AcidQuercetin
7.04 ± 1.10 c20.14 ± 0.52 b1.74 ± 0.87 d29.31 ± 4.26 b4.70 ± 0.86 c418.41 ± 7.26 a
All values are means ± SD. Means with different letters on the same column are significantly different at p < 0.05 by Duncan’s test.
Publisher’s Note: MDPI stays neutral with regard to jurisdictional claims in published maps and institutional affiliations.

