Article

An Integrated Approach to the Design of Centralized and Decentralized Biorefineries with Environmental, Safety, and Economic Objectives

1
División Académica Multidisciplinaria de Jalpa de Mendez, Universidad Juárez Autonoma de Tabasco, Jalpa de Mendéz, Tab. 86205, Mexico
2
Gas and Fuels Research Center, Texas A&M Engineering Experiment Station, College Station, TX 77843, USA
3
International School of Beijing, Shunyi District, Beijing 101318, China
4
Economics Department, Faculty of Economics and Administration, King Abdulaziz University, Jeddah 21589, Saudi Arabia
5
Department of Chemical Engineering, Texas A&M University, College Station, TX 77843, USA
*
Author to whom correspondence should be addressed.
Processes 2020, 8(12), 1682; https://doi.org/10.3390/pr8121682
Submission received: 3 November 2020 / Revised: 17 December 2020 / Accepted: 17 December 2020 / Published: 20 December 2020

Abstract

:
Biorefineries provide economic, environmental, and social benefits towards sustainable development. Because of the relatively small size of typical biorefineries compared to oil and gas processes, it is necessary to evaluate the options of decentralized (or distributed) plants that are constructed near the biomass resources and product markets versus centralized (or consolidated) facilities that collect biomass from different regions and distribute the products to the markets, benefiting from the economy of scale but suffering from the additional transportation costs. The problem is further compounded when, in addition to the economic factors, environmental and safety aspects are considered. This work presents an integrated approach to the design of biorefining facilities while considering the centralized and decentralized options and the economic, environmental, and safety objectives. A superstructure representation is constructed to embed the various options of interest. A mathematical programming formulation is developed to transform the problem into an optimization problem. A new correlation is developed to estimate the capital cost of biorefineries and to facilitate the inclusion of the economic functions in the optimization program without committing to the type of technology or the size of the plant. A new metric called Total Process Risk is also introduced to evaluate the relative risk of the process. Life cycle analysis is applied to evaluate environmental emissions. The environmental and safety objectives are used to establish tradeoffs with the economic objectives. A case study is solved to illustrate the value and applicability of the proposed approach.

1. Introduction

A biorefinery is a processing facility which uses physical, chemical, biological, and/or biochemical processes to convert biomass into value-added products and energy. In recent years, biorefineries have garnered much interest and research as the energy demand and climate crisis become increasingly pressing issues. Biorefineries are essential for the sustainable development of energy and chemical resources while reducing greenhouse gas (GHG) emissions. Nonetheless, biorefinery sizes tend to be smaller than fossil-based refineries because of the relatively distributed nature of biomass compared to the large-scale production of fossil materials from specific regions [1,2]
The sources of biomass may be broadly classified as virgin biomass or waste biomass. Virgin biomass includes any new sources that are cultivated or otherwise grown for the purpose of using in the biorefineries. Examples of virgin biomass include sugarcane and corn for bioethanol, and soybeans and algae for biodiesel. Waste biomass may be derived from various sources such as municipal solid waste (MSW), agricultural waste, forestry-product and industrial wastes, and waste cooking oils and grease from restaurants. A biorefinery may be designed to handle multiple feedstocks [3]. In some cases, preliminary sorting is needed to separate the organic portions of the waste. For instance, sorting and mechanical methods are used to obtain refuse-derived fuel (RDF) from MSW.
Although the types of biomass are varied, the technologies to convert them to chemicals and fuels may be largely classified into the following main categories: biochemical or thermochemical platforms. Biochemical platforms include fermentation (aerobic or anaerobic) and transesterification. Thermochemical platforms include the utilization of heat and pressure in various combinations and processes like liquefaction, gasification, pyrolysis, and combustion are used to obtain products [4,5,6].
The biorefinery industry is complex and multifaceted and depends on many factors, including the scale, location, and its association with economic factors, logistic factors, market factors and industrial practices [7]. Furthermore, economic factors that affect a biorefinery as an industrial firm can be categorized into internal and external factors, the former are related to microeconomic or firm-level elements, such as capital, labor, operating cost, profit, and related risk. The external factors are related to macroeconomic and institutional-level determinants, such as real economic growth subsides, government intervention, institutional quality, and regulatory quality. From the microeconomic perspective, several measurements can be considered when evaluating the biorefinery process designs and performances. In order to acquire proper insights and accomplish significant outputs in connection with economic factors and optimal designs, it is crucial to estimate the economic feasibility of the process design of a new biorefinery plant. This is due to the high capital investment and operating costs that are commonly associated with biorefinery technologies [7,8,9]
Subsidies, which are an aspect of government economic policy, can be used as an instrument to stimulate renewable energy production [10]. Biorefinery projects may need government intervention and subsides to assist in technology development and profitable operations. Subsidies are an element of government expenditure and may be financed through public funds via several channels, including taxation and tariffs [11]. However, the subsidies implemented for renewable products have certain drawbacks. For example, subsidies that cannot correct market failures can result in an early exit from the industry; to illustrate, some energy products are potentially susceptive of market failure, as the prices of these products are determined by free market and international markets conditions, which can control the prices; that is a potential source of market failure that requires government intervention through adapting some new policies, such as corrective energy taxes [12,13]. Another form of subsidy that may be used in renewable energy production, particularly in the renewable energy certification system, is a hybrid of fees and subsidies. Examples of this include fee-rebate (or “Feebate”), Renewable and Green Certificate Market, and Renewable Identification Numbers (RIN) [14,15,16].
In order to protect the environment, mitigate climate change globally, and narrow the economic gap between developing and developed countries, several international institutions have established the Sustainable Development Goals (SDGs). The aim was to focus on innovation and sustainability in all forms and sectors, including industrial sectors, energy, ecosystem, climate change, and protecting natural species and the environment [17]. In addition, the SDGs have strongly recommended the development of bioenergy, biorefinery, and bioeconomy (UN-DESA/DSDG, 2018). Thus, a biorefinery has a significant role to play in the implementation of the goals within SDGs: (i) fostering resilience against climate change, (ii) enhancing the environment for green growth, (iii) creating opportunities for sustainable production and consumption of renewable resources, and (iv) conserving natural resources for future generations [18]. These goals will help create development opportunities that support local and global markets, estimated to be more than 1 trillion USD [18].
Important contributions have been made in the design and optimization of biorefineries. For recent reviews of the topic, the reader is referred to literature on the subject [5,6,7,8,19,20,21,22,23]. Relevant to the scope of this paper, several important research contributions have been made in the areas of optimal design of biorefineries and the assessment of their technical, economic, environmental, and safety objectives. To compare the options of standalone, centralized drop-in, and distributed drop-in (that uses pipelines for connection with processing facilities) for thermochemical biorefineries, Alamia et al. [24] calculated the efficiencies of the various options. Since distributed manufacturing offers unique benefits for environmental impact, Lan et al. [25] provided a life cycle analysis for decentralized preprocessing systems associated with biorefineries using pyrolysis. The complexity of designing integrated biorefineries and associated supply chains calls for the use of powerful optimization frameworks. Roni et al. [26] developed an optimization approach for the distributed supply chains of biorefineries with multiple feedstocks. Psycha et al. [27] developed a design approach for algae biorefineries using multiple feedstocks. To simplify the preliminary synthesis of integrated biorefineries, Bao et al. [28] introduced a shortcut process–synthesis method using high-level process technology details. Another shortcut approach developed by Tay et al. [29,30] used thermodynamic equilibrium models to design biorefineries. Because of the significant potential of integrated biorefineries towards sustainable development, sustainability metrics have been considered in several research efforts for the design of biorefineries. Meramo-Hurtado and González-Delga [31] used sustainability parameters to guide a hierarchical approach to designing biorefineries. Parada et al. [32] analyzed the incorporation of sustainability metrics and stakeholder perspectives in designing biorefineries. Andiappan et al. [33] developed a process synthesis approach for biorefineries with economic and environmental objectives. Traditionally, safety has not been considered as a primary objective during conceptual design of biorefineries. Typically, a biorefinery is first designed and then the safety aspects are subsequently assessed. There is a growing recognition of the importance of including safety during conceptual design [34,35]. Potential risks include fire, explosion, and release of toxic emissions. Different approaches for risk assessment may be used depending on the intended objectives, the stage of process design, and the available data and details. El-Halwagi et al. [8] presented a multiobjective optimization approach to the design of biorefineries with economic and safety objectives. Bowling et al. [36] addressed the problem of facility location of biorefineries as part of the integrated supply chains. Piñas et al. [37] carried out an economic assessment of centralized and decentralized biogas plants. Ng et al. [21], Tay et al. [38], and Ponce-Ortega et al. [39] used disjunctive fuzzy optimization for planning and synthesis of biorefineries while considering industrial symbiosis. Ng et al. [22] introduced a framework for optimizing mixture design in biorefining facilities. Sun and Fan [40] reviewed optimization methods for the supply chains associated with biorefineries. Notwithstanding the value of the aforementioned contributions, there are no published papers (to our knowledge) that provide a unified optimization-based approach to the screening, selection, and design of a combination of centralized and decentralized biorefineries while accounting for the technical, economic, environmental, and safety objectives.
Unlike fossil fuels that are produced in large quantities in specific regions, biomass is generated in a rather fragmented and nonconsolidated manner. Therefore, the sizes of biorefineries range from large, centralized facilities to smaller, decentralized facilities. Large processing facilities that use a single feedstock are able to achieve maximum economy of scale for capital expenditure (CAPEX) and produce market competitive products. Nonetheless, transportation of raw materials from distant areas increase the operating expenditure (OPEX) and may lead to detrimental environmental impact. On the other hand, small-scale biorefineries lose the advantageous economy of scale but reduce the transportation cost of biomass because they mostly use available raw materials from adjacent areas. Therefore, important decisions must be made on whether biomass should be collected from various regions and transported to a large facility (centralized processing) or if several biorefineries should be installed to treat biomass within a certain region (decentralized or distributed processing). Although economy of scale does not favor decentralized/distributed manufacturing, there are several advantages offered by decentralized biorefineries, such as: (1) lower costs and emissions for transporting biomass to the facility and products to the market; (2) higher integration opportunities with other processing facilities (e.g., refining, gas conversion); (3) enhanced resilience especially to natural disasters by virtue of geographical distribution; and (4) increased flexibility in handling multiple feedstocks and generating multiple products. There is also a critical need for further research to understand the economic, environmental, and safety tradeoffs for centralized versus decentralized biorefineries. This paper presents a systematic approach for the comparison of centralized and decentralized biorefineries. A superstructure-based optimization formulation is developed to reconcile the various objectives while making important decisions on the plant capacity, technology, feedstock source and distribution, and product rate and distribution. A methanol-from-RDF case study is solved to illustrate the merits of the proposed approach.

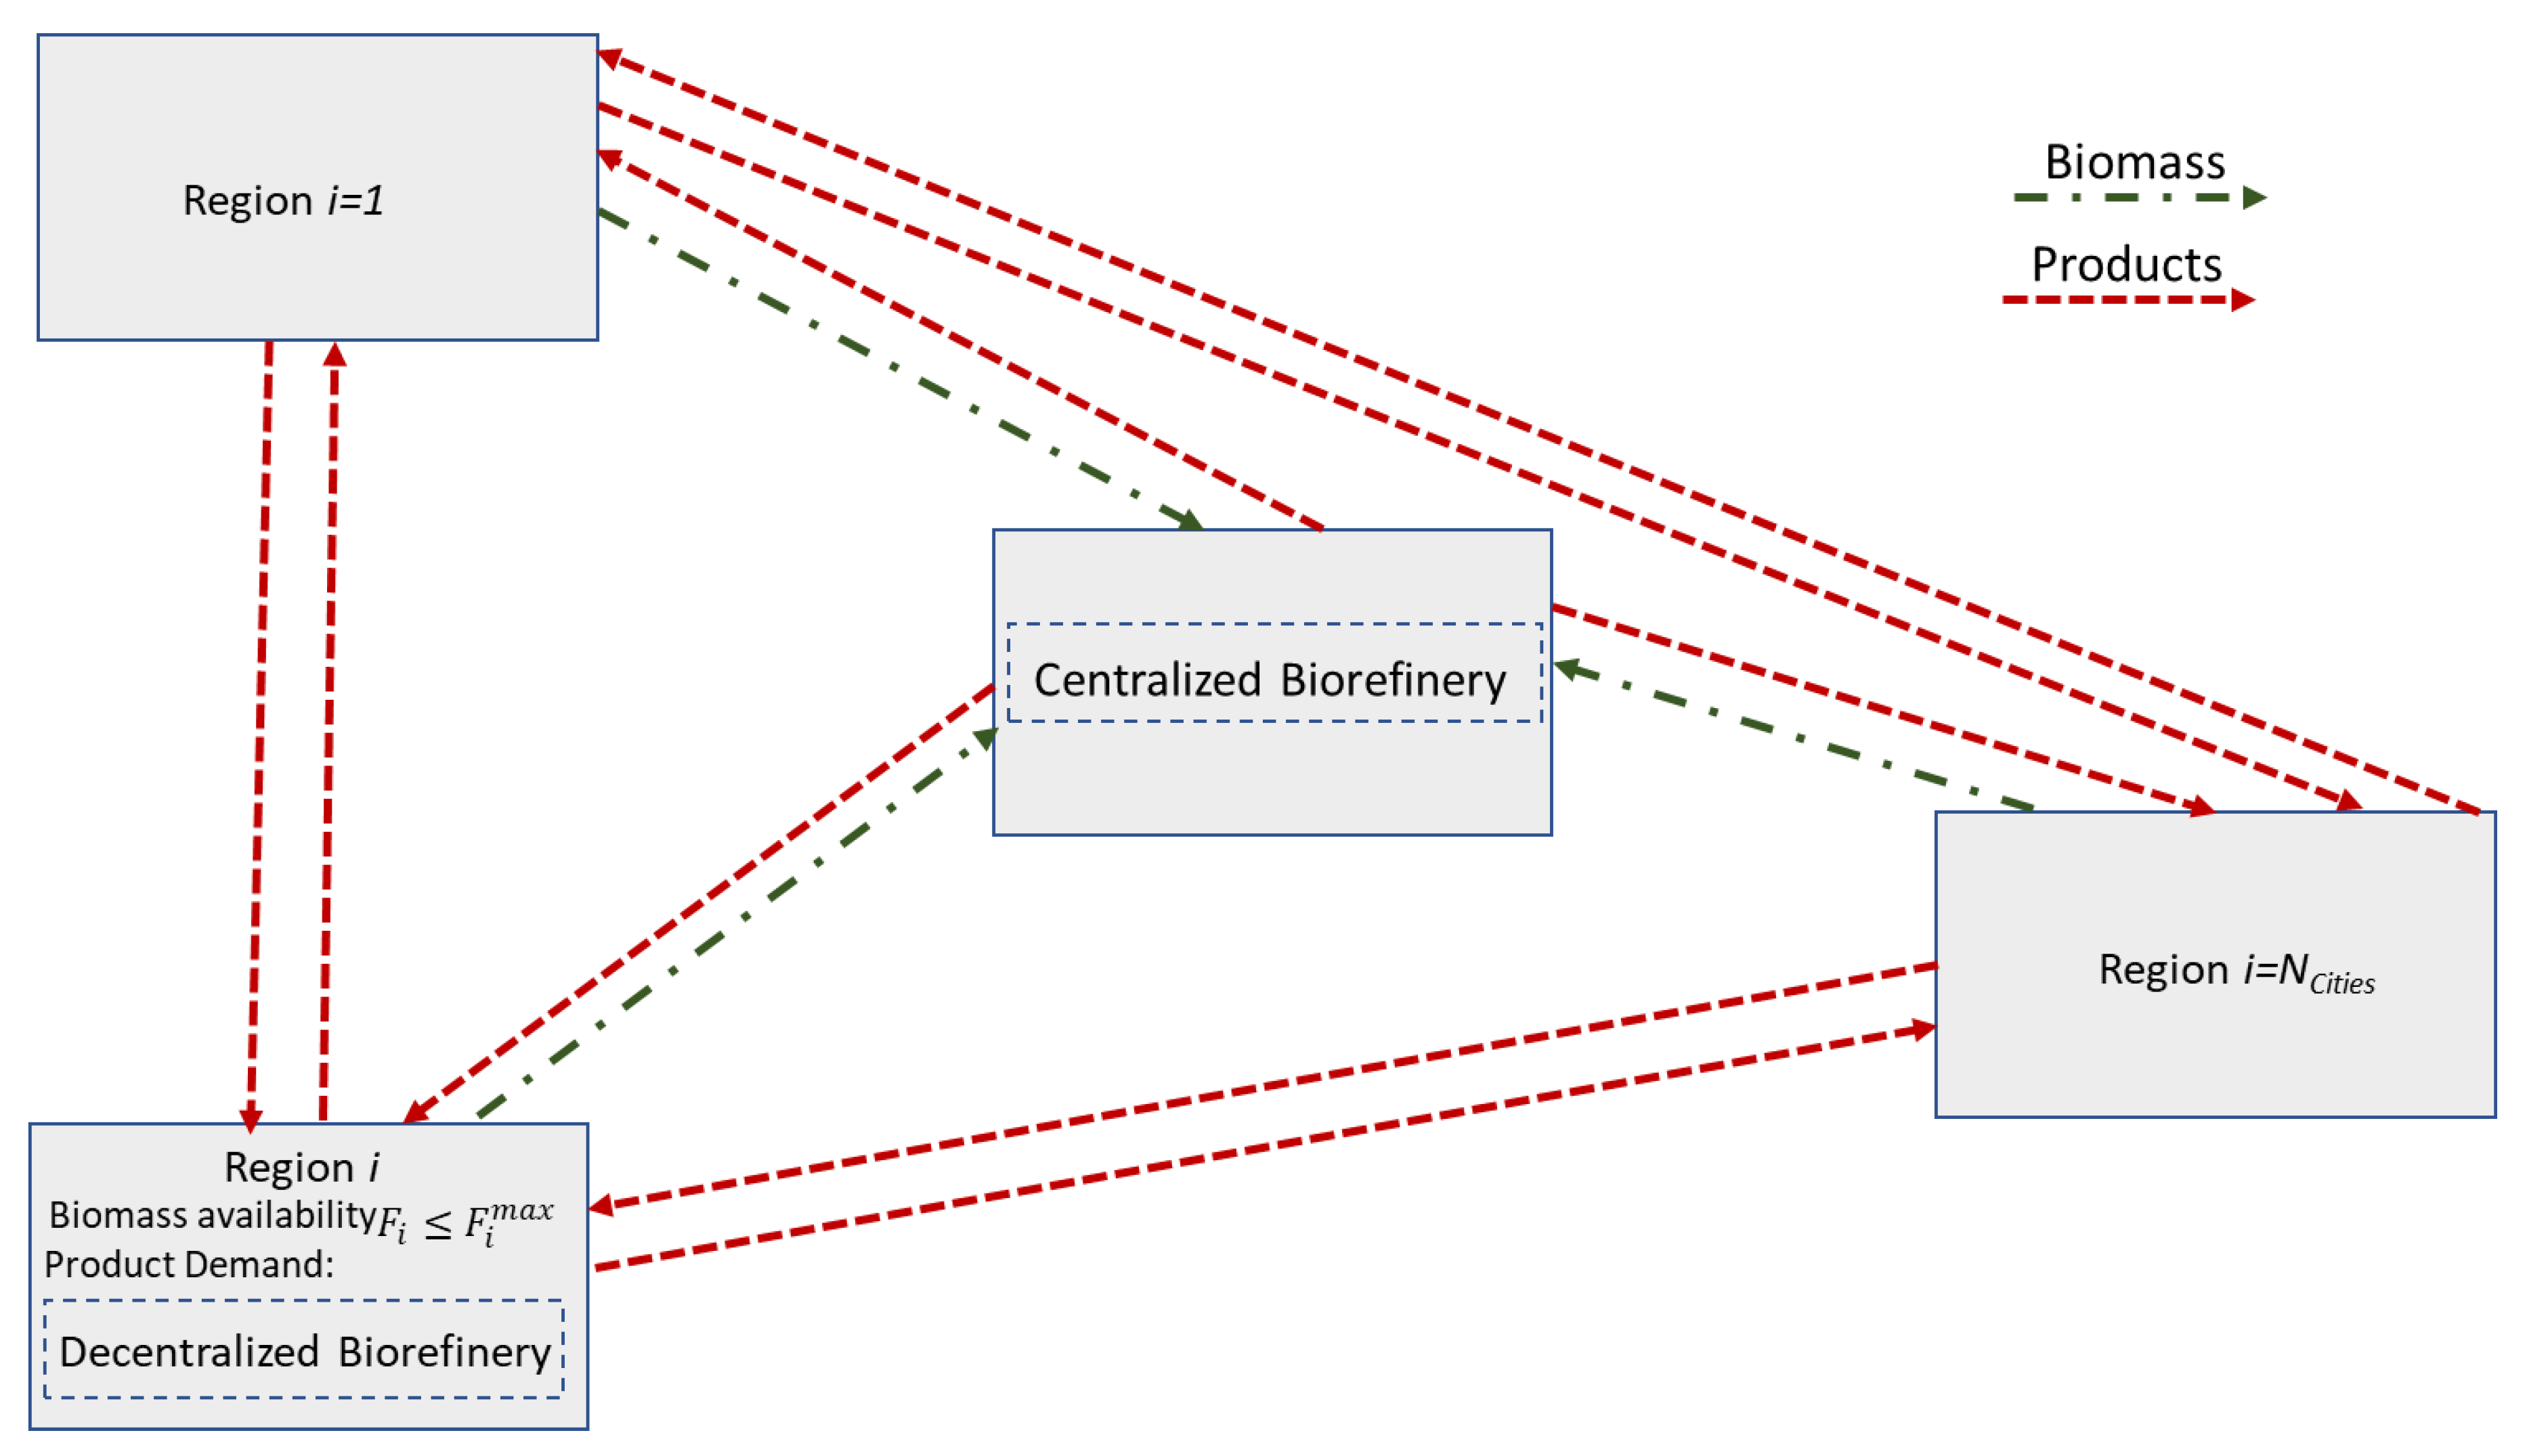
2. Problem Statement

Given are:
  • A set of cities/regions: {i|i = 1, 2, …, NCities}. Each city/region has a supply of available biomass with known flowrate (Fi), composition of Ncomponents, and price (Costi, USD/tonne).
  • A proposed location for a centralized facility, which is given the index i = NCities+1.
  • A set of monetization technologies {j|j = 1, 2, …, NTech} that may be used to convert the biomass to a set of value-added chemicals and fuels {p|p = 1, 2, …, NProducts}. The selling price of each product is referred to as Cp.
  • A set of transportation options for biomass and for products with known cost (USD/tonne·mile).
  • Market demand and selling price for each product.
It is desired to identify an optimal strategy for monetizing the biomass by answering the following questions:
  • Should the biomass be processed in centralized facilities with industrial symbiosis or in decentralized facilities?
  • Which technologies should be used?
  • What is the capacity of each facility?
  • What are the economic, environmental, and safety roles of transporting biomass to the biorefineries and the products to consumers?
  • How should the economic, environmental, and safety objectives for the integrated systems be evaluated and reconciled?

3. Methodology

The main steps in the proposed methodology are shown in the flowchart of Figure 1. The methodology is streamlined via the following tasks:
  • Development of superstructure and optimization formulation;
  • Development of a correlation for capital cost to be used in the economic optimization;
  • Life cycle analysis of the proposed pathways;
  • Safety analysis of the proposed pathways;
  • Reconciliation of economic, environmental, and safety objectives.
First, the various configurational alternatives are embedded through a superstructure representation that represents the basis for formulating the optimization program. In order to explicitly include cost optimization within the optimization formulation, a correlation is developed for estimating capital cost of the proposed biorefineries. Three objectives are considered using economic, environmental, and safety metrics. The ɛ-constraint method is used to solve the multiobjective optimization problem. The economic metric (e.g., maximizing return on investment) is used as the objective function while the safety and environmental objectives are placed in the constraints with certain bounds that are repeatedly altered to generate the tradeoff results. First, the relaxed optimization problem is solved for maximizing profit with no bounds on the safety and environmental metrics. Next, the safety and environmental bounds are added and the optimization program is solved to generate alternate configurations with tradeoffs that constitute the basis for decision making.
The following sections summarize the key steps used in setting up the optimization formulation and the solution approach.

3.1. Development of Superstructure and Optimization Formulation

The first step is to create a superstructure that embeds the options of interest. Figure 2 shows the superstructure with centralized and decentralized options. A source–interception–sink representation [41] is used. Sources represent the biomass available from each region. Sinks represent the market demands in the various regions. The centralized and decentralized biorefineries represent the interceptors. Biomass may be processed within the same city in a decentralized facility or hauled to a larger centralized plant that accepts feedstock from multiple regions. The products may also be used locally or transported for sales in other regions. The flowrates of biomass and products assigned within the superstructure (represented by dashed arrows) as well as the throughput through each biorefinery are unknown and to be determined via the solution of the optimization formulation. A zero value indicates the absence of an option.
Using the aforementioned superstructure, the optimization formulation is given below:
Maximize Profitability (e.g., return on investment (ROI))
Subject to:
Annual   Sales   =   i = 1 N C i t i e s + 1 j = 1 N T e c h p = 1 N P r o d u c t s C p R i , j , p
where Ri,j,p is the production capacity of product p in the plant in city i using technology j (which is an optimization variable).
To ensure a practical capacity of each plant between a lower bound (LB) and an upper bound (UB), the following constraint is used:
L B I i , j , p R i , j , p U B I i , j , p
where Ii,j,p is a binary integer variable that takes the value of 1 when product p is produced in region/city i using technology j. Otherwise, it is zero.
To limit the number of facilities per city to a maximum number, the following constraint is used:
j = 1 N T e c h p = 1 N P r o d u c t s I i , j , p N P l a n t s i m a x i
The fixed capital investment (FCI) is given by:
F C I =   i = 1 N C i t i e s + 1 j = 1 N T e c h p = 1 N P r o d u c t s F C I i , j , p
The total capital investment (TCI) is given by
TCI = FCI + WCI
where WCI is the working capital investment. In this work, WCI is taken to be 15/85 of the FCI (El-Halwagi, 2017a).
The annual net profit (ANP) is expressed as (El-Halwagi, 2017a):
ANP = (Annual Sales − Annual OPEX − Annualized FCI) * (1 − Tax Rate) + Annualized FCI
The ɛ-constraint method is used to account for the environmental and safety objectives:
E M E M M a x
R M R M M a x
where EM and RM are the environmental and risk metrics, respectively, and Max designates an upper bound on the metric. The metrics may be selected from a wide variety of options [34,35,41]. The case study in this paper shows an example of the calculation and use of such metrics.
The process yield is:
G i , j , p = ( F i , j , p )
where is the yield function that depends on the feed characteristics and technology.
The availability of feedstock is:
F i F i m a x i
The market limitations are:
G i , p G i , p m a x i
The flowrate of the biomass received in city i, for technology j, to produce product p is obtained from shipments coming from all cities. Therefore,
F i , j , p =   i = 1 N C i t i e s + 1 F i , i , j , p
where F i , i , j , p is the biomass flowrate assigned from city i to city i’ and technology j to produce product p.
Therefore, the sum of all shipments of biomass from a city is given by the shipments distributed from sources to sinks:
F i =   j = 1 N T e c h p = 1 N P r o d u c t s F i , j , p i
The net production of product p is:
G i , p =   j = 1 N T e c h G i , j , p   i = 1 N C i t i e s + 1 G i , i , p T r a s p o r t e d i , p
The first term on the right-hand side represents that total amount of product p generated by all technologies in city i. Product p may also be shipped to or from city i. The second term represents the net amount of product p shipped out of city i. The term G i , i , p T r a s p o r t e d has a positive value when it is shipped out of city i and a negative value when it is shipped to city i.

3.2. Capital Cost Estimation

A convenient approach to including a parametric function for the estimation of CAPEX in the optimization formulation is to use a generic formulation that works for various biorefining technologies, feedstocks, and products. Because of the nature of this work intended to generate high-level directions for decision making, order-of-magnitude cost estimates are appropriate. Towards this end, we have carried out data analytics for the information extracted from 40 biorefineries. A functional form similar to the correlation developed by Zhang and El-Halwagi [42] was used. The correlation relates the FCI to two main factors: process throughput (feed flowrate of biomass) and number of functional steps “N” (which represent primary operation such as separation, reaction, and waste treatment). The data sources are given in the Supplementary Materials.
The resulting correlation is expressed as:
F C I   ( in   USDMM )   =   0.16 N ( Flowrate   of   biomass   feed   in   1000   tonnes / year ) 0.84
As indicated earlier, for the intended purposes of high-level decision making, an order-of-magnitudes cost estimation has the proper level of accuracy [41,42].

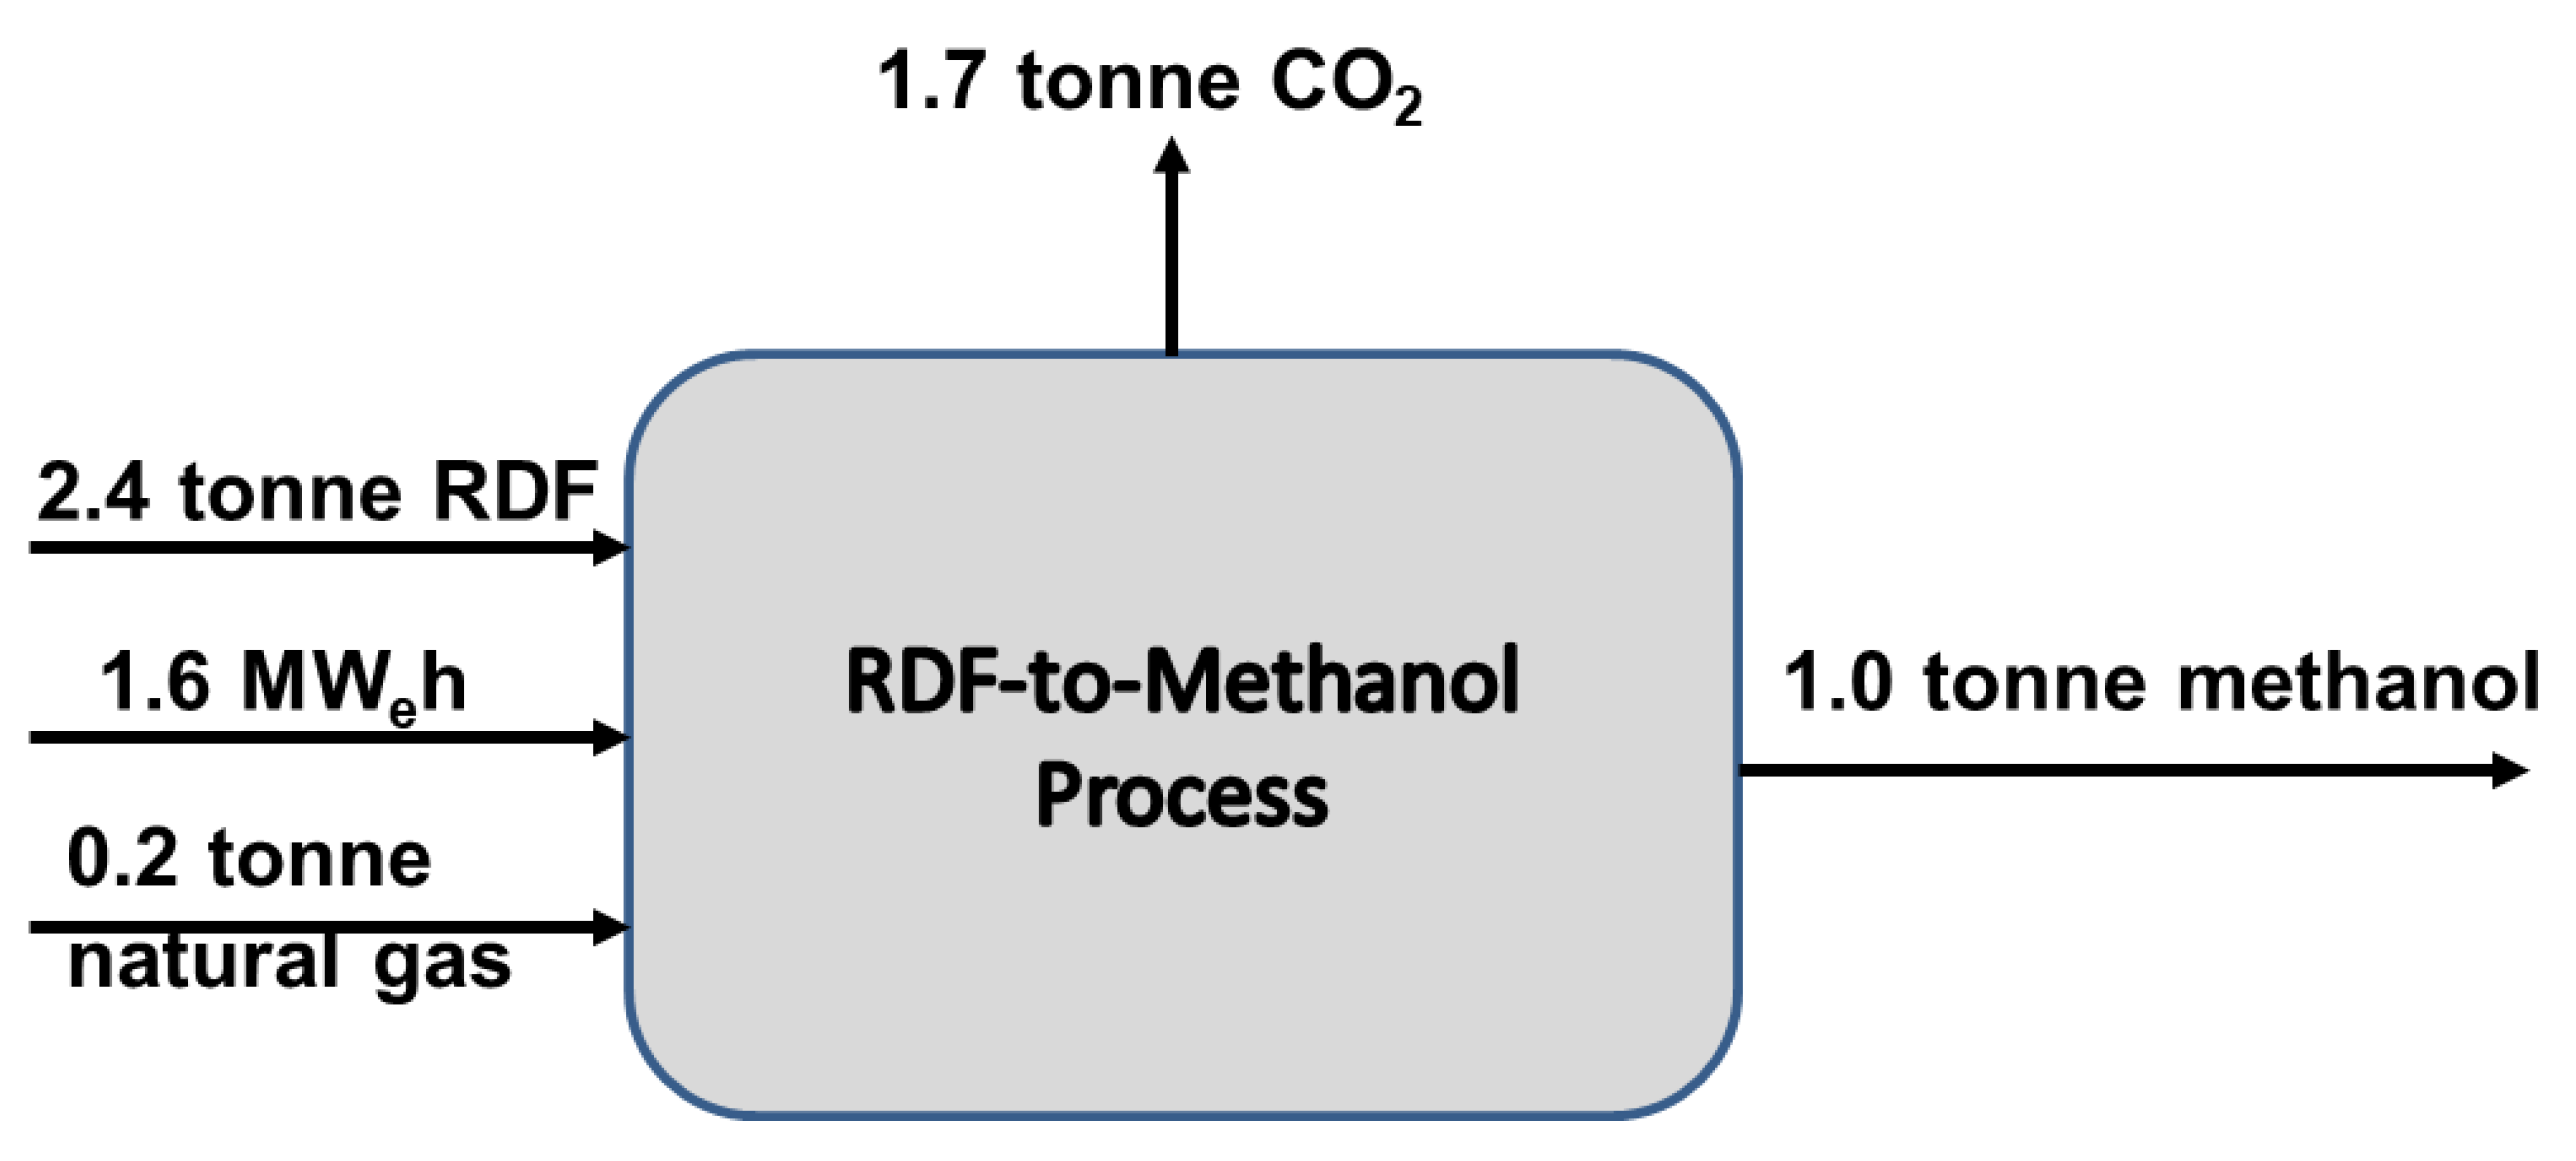
3.3. Life Cycle for RDF to Methanol Process

The centralized vs. decentralized processing for the RDF to methanol process needs an account of emissions at different stages of the life cycle. A life cycle assessment framework [43] is used to compute these emissions. For the process, the system boundaries are considered to be at the processing plant gate, where the RDF is brought. For the transportation emissions, the latest U.S. Environmental Protection Agency (EPA) emission factors for transportation are considered from the Emission Factors for Greenhouse Gas Inventories [44].

3.4. Safety Analysis

Two types of risks are evaluated for the process and for transportation. A relative risk approach is used to compare and rank the risks of the various alternatives. For process risk, hazard identification is carried out using the Hazardous Process Stream Index (HPSI) [45]. The HPSI is proposed to define and compare the level of hazard of each stream. The estimation is based on five normalized indicators, which consider pressure, density, molar flowrate, heat of combustion, and flash point, as follows:
I P =   pressure   value   of   individual   stream average   pressure   for   all   streams
I ρ =   density   value   of   individual   stream   average   density   for   all   streams
I M F =   molar   flow   value   of   individual   stream average   molar   flow   for   all   streams
I Δ H c =   heat   of   combustion   of   individual   stream   average   heat   of   combustion   for   all   streams
I F p =   flash   point   score   of   individual   stream   average   flash   point   score   for   all   streams
The result of HPSI is calculated through the following expression:
H P S I = ( I P · I M F · I Δ H c · I F P I ρ ) · W
This index accounts for the relationship between the five dimensionless indicators of each process stream, and W is used as a scaling factor. As such, an increase in the capacity implies an increase in flowrate and inherently a more significant mass release in the case of loss of containment and its consequences. Therefore, W is defined as the ratio of the production capacity of the process with capacity i ( C P i ) to the reference process capacity ( C P b a s e ). It is worth noting that the proposed index takes into account the impact of process capacity. For the same process technology and flowsheet, the smallest-scale process risk is considered the reference if the production capacity is different.
W = C P i C P b a s e
The process line with the highest value of HPSI poses the highest risk levels, reflecting the severity of the process stream in the loss of containment case, leading to a fire or explosion.
The relative process risk level is estimated from the HPSI value. A new normalization approach is proposed to enable the identification of relative risk using the following equation:
R i = H P S I i H P S I m i n H P S I m a x H P S I m i n
where H P S I i is the individual index value of the process streams, H P S I m i n is the smallest index value of the process streams, H P S I m a x is the maximum index value of the process streams, and R i is the individual risk of the process streams.
Once the individual risk has been estimated, the total relative process risk ( R T ) is estimated by the arithmetic average of the individual risks as follows:
R T = i n R i P S
where P S   is the total number of process streams. The risk scale is defined according to Table 1.
If different process technologies are compared, HPSI must be assessed for each process using the same production capacity and then the assessment is carried out for the total relative process risk.
It is worth noting that alternate approaches for risk assessment may be used. For instance, an alternative approach to the aforementioned HPSI to determine the risk of the process at a different production scale is to consider the sum of the individual risks instead of the average used in this work. To classify risk based on summation, a risk scale may be defined to categorize/classify the different processes based on the sum.
For the methanol transportation risk analysis, the approach proposed by Zhang et al. (2018) is adopted. The following is a summary of the approach. Two transportation modes are considered: highway and railroad. Three variables were defined to assess the risk factor of methanol transportation using the two alternatives: (1) value loss per accident ( C t ), (2) number of trips ( N t ) per year, and (3) overall probability of accident as a function of distance (d) when methanol is moved among cities ( P i , j , d ). The number of trips is calculated, dividing the maximum demand of each city by the load capacity of each transport. The overall probability of an accident during methanol transport is estimated by the product of general accident rate for transportation mode and the cumulative probability as a function of the natural logarithm of distance for methanol highway and railroad incidents. The product of these three variables provides the risk factor of each transport option

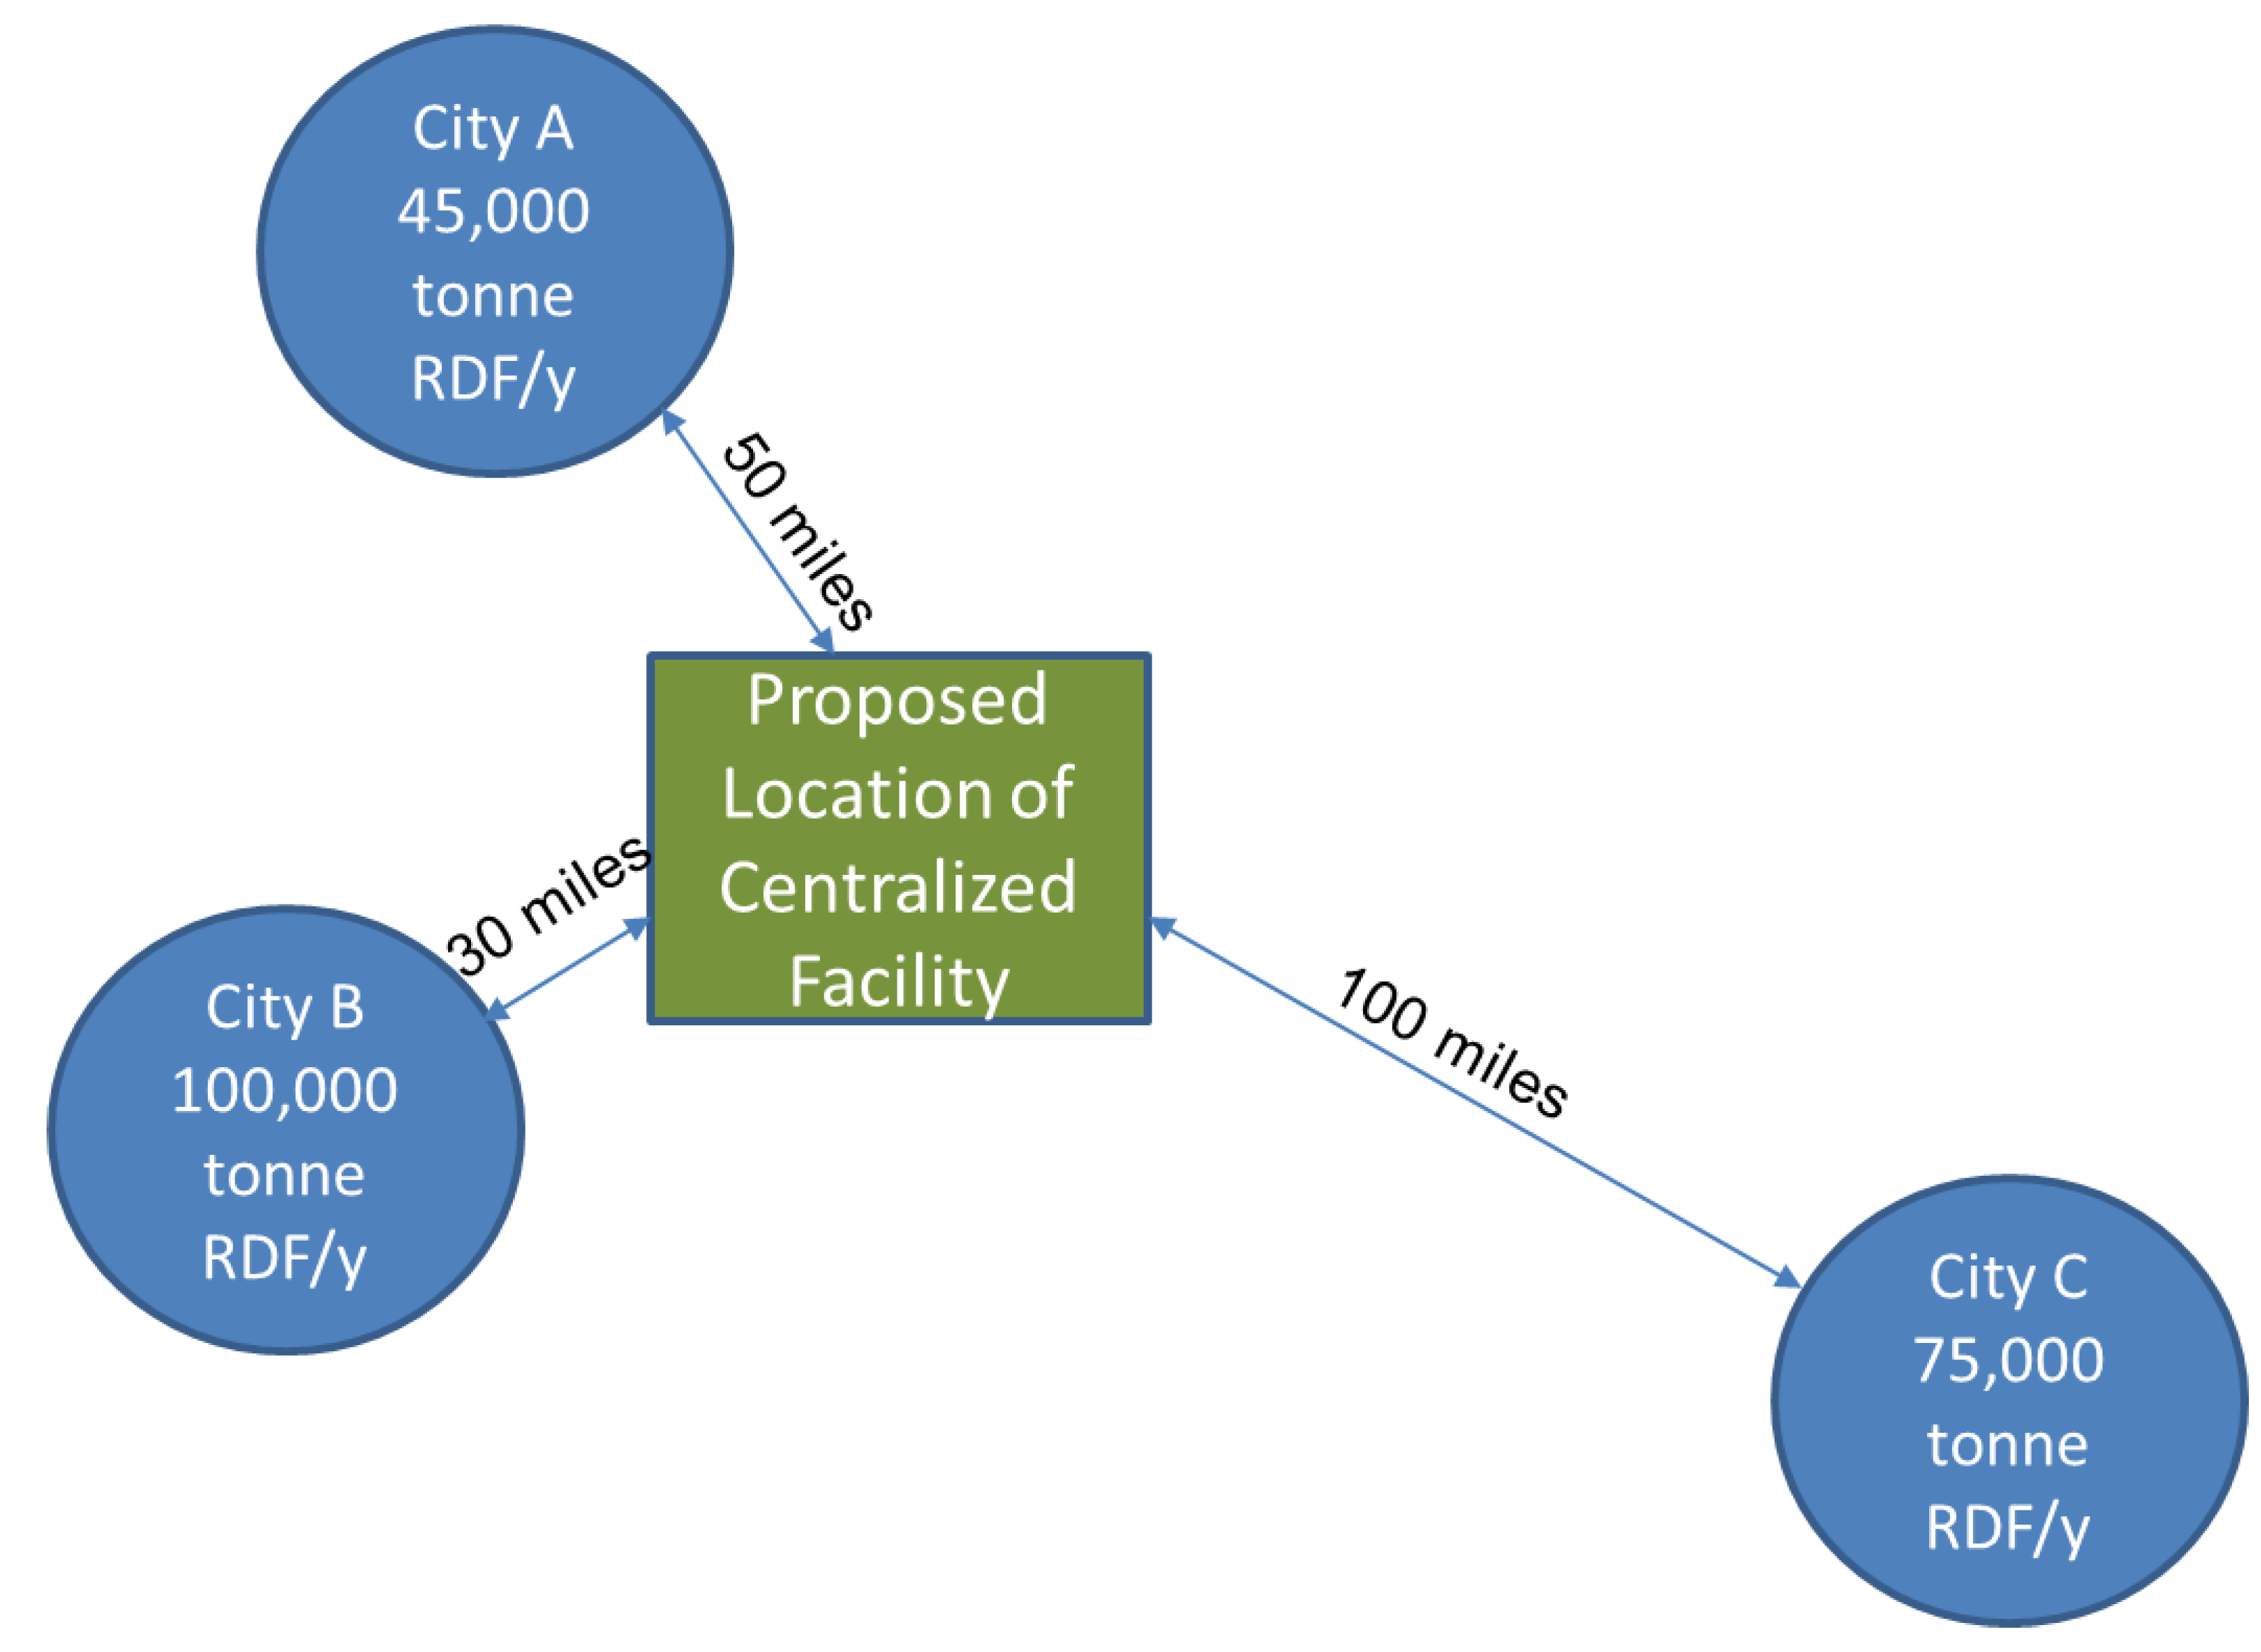
4. Case Study: Centralized vs. Decentralized Conversion of MSW to Methanol

Consider the case of three cities (A, B, and C) with known biomass type in the form of refuse derived fuels (RDF) obtained from MSW at a cost of USD55/tonne. Gasification-based technology is used to convert RDF to methanol. Detailed description of this process consists of three main stages: gasification, purification, and methanol synthesis. Description of the technical, design, and operational details are given in literature [46,47,48,49,50,51]. Simulation results for the streams, operating conditions, and design specifications are taken from literature [52,53,54]. Based on the data provided by Iaquaniello et al. [55], key process information (on the use of electric energy, water, methanol yield, and assumed costs of electric energy, water, and methanol) are shown in Table 2.
The flowrate of RDF available in each city and the relative locations of the cities and the proposed centralized facility are show by Figure 3. A decision needs to be made on whether to build one centralized facility or multiple decentralized (smaller) facilities. The tradeoffs include cost, transportation, environmental impact, and risk.
The maximum demands for methanol in cities A, B, and C are 0, 60,000, and 25,000 tonne/year, respectively. The transportation costs were based on data provided by Zhang et al. [56] and are USD0.011/(tonne RDF·mile) and USD0.015/(tonne methanol·mile).

Life Cycle Assessment for RDF to Methanol Process

The proposed approach and optimization formulation are generally applicable for any environmental metrics. For this case study, only greenhouse gas emissions and their global warming impacts are considered to illustrate the applicability of the proposed approach and to discuss the tradeoffs. For transportation, two methods are considered for service: railroad and diesel-fueled heavy trucks. When a decentralized facility is co-located within the same city sourcing RDF, the transportation distance is assumed to be negligible.
The data of the RDF-to-methanol process described by Salladini et al. [48] are adapted to calculate the process emissions and to create the diagram shown by Figure 4 for a functional unit of one tonne of methanol produced. A linear proportionality consumption of overall inputs and outputs is assumed.
The emissions for the upstream production of electricity (Table 3) and natural gas (Table 4) are computed from emission factors provided by the Emission Factors for Greenhouse Gas Inventories (EPA, 2020). Assuming a natural gas power plant, the average emission factors for electricity in the United States are used.
The ton-mile factors for medium and heavy-duty trucks are used for the transportation of methanol from the centralized facility to the cities A, B, and C. A tonne-mile is one tonne of freight carried one mile, as a unit of traffic.
For the HPSI evaluation, the stream data were taken from literature [48,52,53,54]. The smallest plant (25,000 tonne/year) was taken as the reference.

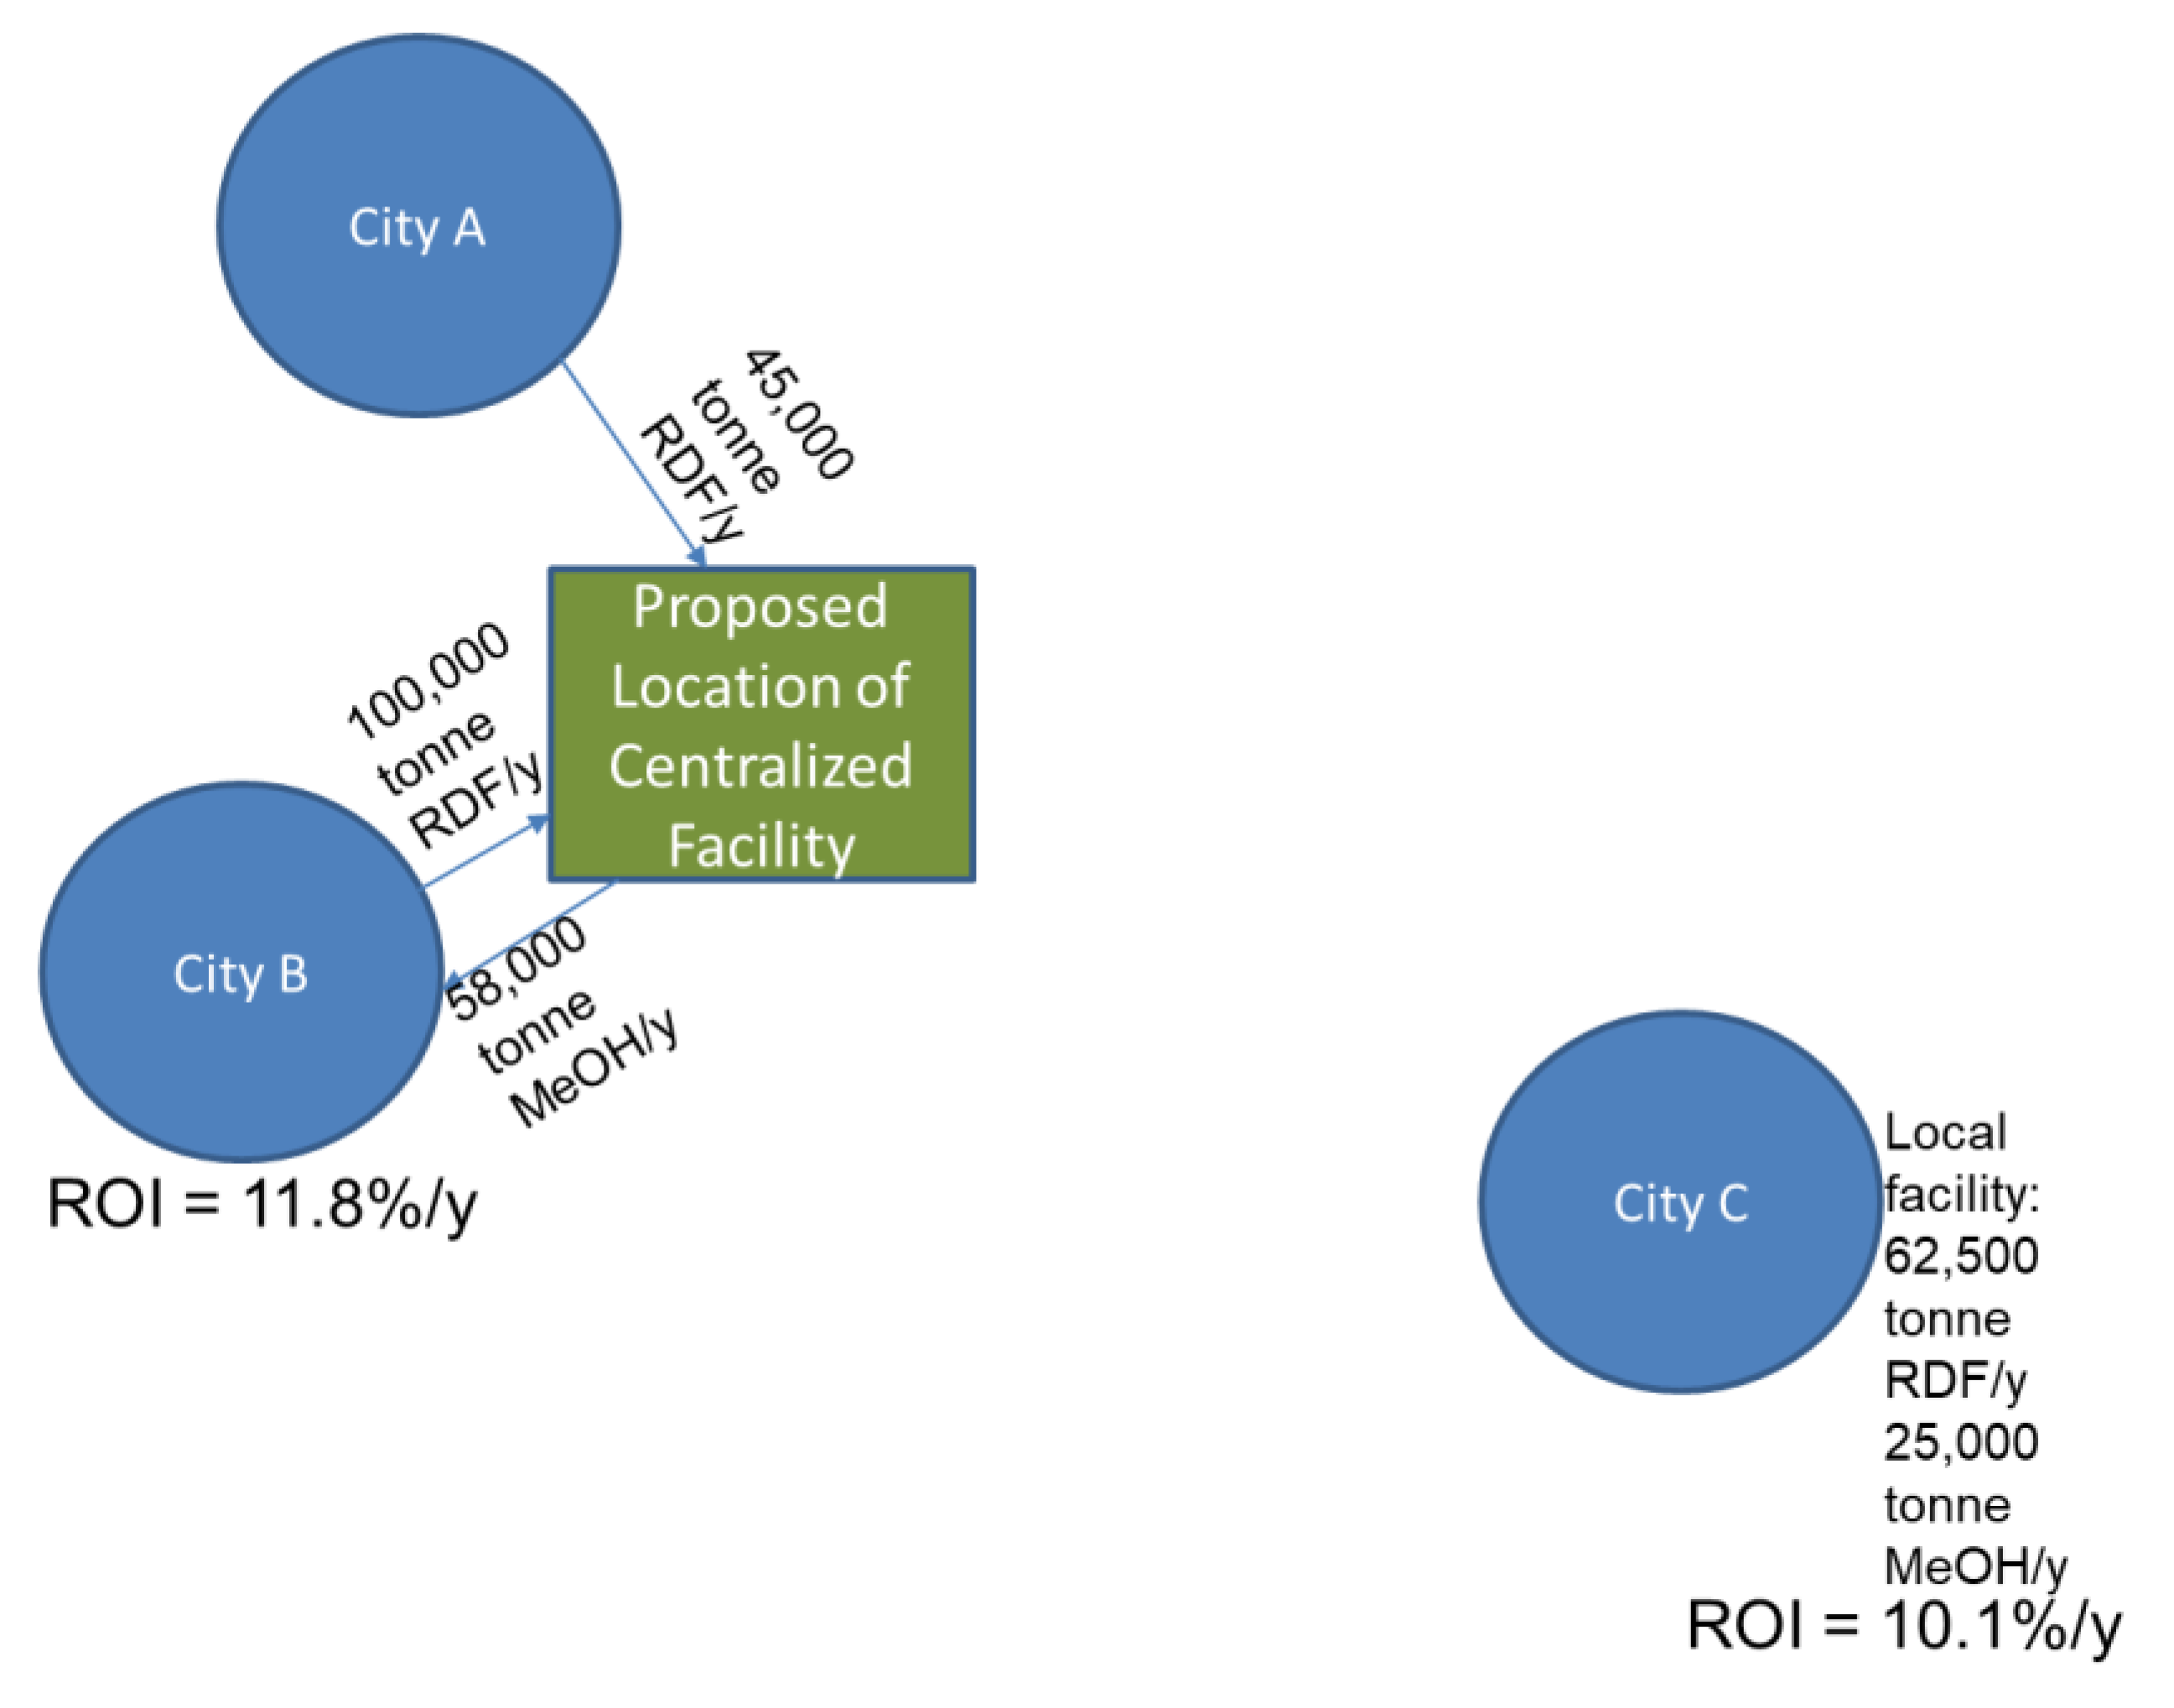
5. Results and Discussion

The optimization formulation is a mixed-integer nonlinear program (MINLP) with 68 variables. The solution of the relaxed problem with no bounds on the environmental or safety objectives (using the Global Solver of LINGO software) is shown by Figure 5. The global solution of the relaxed optimization problem features a centralized facility and achieves a return on investment (ROI) of 11.8%/year. The GHG emissions of the relaxed problem is 291 × 103 tonnes CO2eq/year and the process risk index, HPSI, is 0.75 (high risk). As described in the methodology, the ɛ-constraint method was used to establish the tradeoffs among the various objectives. Using bounds of 285 × 103 tonnes CO2eq/year on the GHG emissions and 0.5 on HPSI (medium risk), another solution (shown by Figure 6) is generated, which is economically suboptimal but superior for the environmental and safety objectives. It has a common facility for cities (A and B) and a local facility in city C. The ROI for the common facility matches that of the global solution, but there is a decrease in the ROI for the facility in city C to 10.1%/year. Table 5 shows the GHG emissions and safety for the optimal and suboptimal solutions.
The results of the transportation risk analysis resulting from spillage/noncontainment due to accidents are shown by Table 5. The risk for transporting biomass was assumed to be negligible compared to the risk of transporting methanol (which involves loss of containment, toxicity, flammability, and explosion issues). For the optimal solution, transporting methanol to cities B and C by highway is safer than by railroad. The total risk factor using a highway gives a value of 634.14, while the total risk factor using a railroad is 801.24. The differences in risk are attributed to distance. Therefore, the lower risk factor for transporting methanol from a centralized facility is obtained by using the railroad to supply methanol to city B and by using the highway for city C, giving a value of 554.95. In the suboptimal solution, the use of highway as a transport medium is safer than railroad. Table 6 summarizes the carbon footprint and risk for the economically optimal and the suboptimal solutions. Although the economically optimal solution offers a higher ROI, it involves higher carbon footprint and higher risk. The decision makers should balance these conflicting objectives and select a strategy that reconciles the importance of the economic, environmental, and safety objectives. Alternatively, the decision makers may use an economic platform to incorporate sustainability, risk, and resilience into the ROI calculations [57,58,59,60,61,62].

6. Conclusions and Recommendations for Future Research

This paper introduces a systematic approach to the design and comparison of centralized versus decentralized biorefining options. The paper provides the following new contributions: (1) a superstructure representation embedding all configurations of interest; (2) an optimization formulation with economic, environmental, and safety objectives that are solved using the ɛ-constraint method to establish the tradeoffs among the multiple objectives; and (3) incorporation of transportation risk (in addition to process risk using a new metric quantifying total process risk). Furthermore, a CAPEX cost correlation is developed for order-of-magnitude estimation purposes. This correlation offers the advantages of using few data (feed flowrate and number of functional steps) and enabling the explicit incorporation of cost functions in the optimization formulation without committing to the type of technology or the size of the plant. The limitation of this correlation is that its level of accuracy is an order-of-magnitude estimate and should therefore be used with caution, with the results checked using more detailed cost estimation methods once a detailed design is available. Alternatively, if more accurate cost correlations are available, they can be readily used in the optimization formulation, which does not depend on a specific correlation. A case study is solved to address centralized versus decentralized options for converting RDF to methanol. The centralized option showed better profitability but higher levels of carbon footprint and risk.
This work constitutes the basis for several future research directions. Specifically, the following topics are recommended for future research:
  • Inclusion of multiple environmental metrics—while the case study in this paper focused on GHG emissions, other environmental metrics may be used, such as land use change, water usage and discharge, pollutant discharge, acidification, and eutrophication;
  • Consideration of additional objectives such as resilience [57], reliability, availability, and maintainability [62];
  • Integration of centralized and decentralized biorefineries with other infrastructures through the concept of industrial symbiosis [63,64];
  • Consideration of feedstock variability and uncertainty [60,65].

Supplementary Materials

The following are available online at https://www.mdpi.com/2227-9717/8/12/1682/s1, Figure S1: Data used in developing FCI correlation, Table S1: Summary of extracted data.

Author Contributions

All authors contributed to conceptualization, methodology, validation, formal analysis, investigation, data curation, writing—original draft preparation, writing—review and editing, and visualization. All authors have read and agreed to the published version of the manuscript.

Funding

This research received no external funding.

Conflicts of Interest

The authors declare no conflict of interest.

Nomenclature

CpSelling price of product p
CostiCost of biomass in city i
C P i Process production capacity
C P b a s e Reference process capacity
EMEnvironmental metric
FiFlowrate of biomass available in city i
F i m a x Maximum flowrate of biomass available in city i
F i , j , p Flowrate of biomass assigned to city i and technology j to produce product p
F i , i , j , p Flowrate of biomass assigned from city i to city i’ and technology j to produce product p
FCIFixed capital investment
Gi, pNet production of product p in the plant in city i
Gi,j,pProduction capacity of product p in the plant in city i using technology j
G i , i , p T r a s p o r t e d Net amount of product p shipped out of city i
HPSIHazardous process stream index
H P S I m i n Smallest HPSI value of reference process
H P S I m a x Highest HPSI value of reference process
iIndex for cities/regions
Ii,j,pBinary integer variable that takes the value of 1 when product p is produced in city i using technology j.
I F p Flash point indicator
I Δ H c Heat of combustion indicator
I M F Molar flow indicator
I P Pressure indicator
I ρ Density indicator
jIndex for technologies
NCitiesTotal number of cities/regions
NTechTotal number of technologies
PIndex for products
R i Individual risk of process streams
R T Total process risk
RMRisk metric
TCITotal capital investment
W HPSE scaling factor
WCIWorking capital investment
Greek
A process yield function that relates products to reactants

References

  1. Santibañez-Aguilar, J.E.; González-Campos, J.B.; Ponce-Ortega, J.M.; Serna-González, M.; El-Halwagi, M.M. Optimal planning and site selection for distributed multiproduct biorefineries involving economic, environmental and social objectives. J. Clean. Prod. 2014, 65, 270–294. [Google Scholar] [CrossRef]
  2. Ubando, A.T.; Felix, C.B.; Chen, W.-H. Biorefineries in circular bioeconomy: A comprehensive review. Bioresour. Technol. 2020, 299, 122585. [Google Scholar] [CrossRef] [PubMed]
  3. Pyrgakis, K.; Kokossis, A.C.; Kokossis, A.C. A Total Site Synthesis approach for the selection, integration and planning of multiple-feedstock biorefineries. Comput. Chem. Eng. 2019, 122, 326–355. [Google Scholar] [CrossRef]
  4. Ng, D.K.; Tan, R.R.; Foo, D.C.; El-Halwagi, M.M. Process Design Strategies for Biomass Conversion Systems; John Wiley & Sons: Hoboken, NJ, USA, 2015. [Google Scholar]
  5. Sengupta, D.; Pike, R.W. Chemicals from Biomass: Integrating Bioprocesses into Chemical Production Complexes for Sustainable Development; CRC Press: Boca Raton, FL, USA, 2012. [Google Scholar]
  6. Stuart, P.; El-Halwagi, M.M. (Eds.) Integrated Biorefineries: Design, Analysis, and Optimization; Taylor and Francis/CRC: Boca Raton, FL, USA, 2013. [Google Scholar]
  7. Sadhukhan, J.; Kok, S.N.; Martinez, E. Biorefineries and Chemical Processes. Design, Integration and Sustainability Analysis; John Wiley & Sons: West Sussex, UK, 2014. [Google Scholar]
  8. El-Halwagi, A.M.; Rosas, C.; Ponce-Ortega, J.M.; Jiménez-Gutiérrez, A.; Mannan, M.S.; El-Halwagi, M.M. Multiobjective optimization of biorefineries with economic and safety objectives. AIChE J. 2013, 59, 2427–2434. [Google Scholar] [CrossRef]
  9. Conrad, K.; Wang, J. On the Design of Incentive Mechanisms in Environmental Policy. In Economic Incentives and Environmental Policies; Springer Science and Business Media LLC: Berlin, Germany, 1994; pp. 69–85. [Google Scholar]
  10. Cruce, J.R.; Quinn, J.C. Economic viability of multiple algal biorefining pathways and the impact of public policies. Appl. Energy 2019, 233, 735–746. [Google Scholar] [CrossRef]
  11. Lohman, L.D.S. Economic Incentives in Environmental Policy: Why are They White Ravens? In Economic Incentives and Environmental Policies; Springer Science and Business Media LLC: Berlin, Germany, 1994; pp. 55–67. [Google Scholar]
  12. Parry, I.W.; Heine, M.D.; Lis, E.; Li, S. Getting Energy Prices Right: From Principle to Practice; International Monetary Fund: Washington, DC, USA, 2014. [Google Scholar]
  13. Clements, M.B.J.; Coady, D.; Fabrizio, M.S.; Gupta, M.S.; Alleyne, M.T.S.C.; Sdralevich, M.C.A. Energy Subsidy Reform: Lessons and Implications; International Monetary Fund: Washington, DC, USA, 2014. [Google Scholar]
  14. Greene, D.L.; Patterson, P.D.; Singh, M.; Li, J. Feebates, rebates and gas-guzzler taxes: A study of incentives for increased fuel economy. Energy Policy 2005, 33, 757–775. [Google Scholar] [CrossRef]
  15. Aune, F.R.; Dalen, H.M.; Hagem, C. Implementing the EU renewable target through green certificate markets. Energy Econ. 2012, 34, 992–1000. [Google Scholar] [CrossRef]
  16. Brown, T.R.; Thilakaratne, R.; Brown, R.C.; Hu, G. Regional differences in the economic feasibility of advanced biorefineries: Fast pyrolysis and hydroprocessing. Energy Policy 2013, 57, 234–243. [Google Scholar] [CrossRef] [Green Version]
  17. SDGs Kenya Forum: Vision 2030s Medium Term Plan as a Framework for Implementation of the Sustainable Development Goals, SDGs Kenya Forum for Sustainable Development. Available online: http://www.developlocal.org/wp-content/uploads/2016/04/ImplementingTheSDGs.pdf (accessed on 1 August 2020).
  18. Sadhukhan, J.; Martinez-Hernandez, E.; Murphy, R.J.; Ng, D.K.; Hassim, M.H.; Ng, K.S.; Kin, W.Y.; Jaye, I.F.M.; Hang, M.Y.L.P.; Andiappan, V. Role of bioenergy, biorefinery and bioeconomy in sustainable development: Strategic pathways for Malaysia. Renew. Sustain. Energy Rev. 2018, 81, 1966–1987. [Google Scholar] [CrossRef]
  19. Sánchez, E.N.; Ojeda, K.; Elhalwagi, M.M.; Kafarov, V. Biodiesel from microalgae oil production in two sequential esterification/transesterification reactors: Pinch analysis of heat integration. Chem. Eng. J. 2011, 176–177, 211–216. [Google Scholar] [CrossRef]
  20. Dickinson, S.; Mientus, M.; Frey, D.; Amini-Hajibashi, A.; Ozturk, S.; Shaikh, F.; Sengupta, D.; El-Halwagi, M.M. A review of biodiesel production from microalgae. Clean Technol. Environ. Policy 2016, 19, 637–668. [Google Scholar] [CrossRef]
  21. Ng, R.T.L.; Ng, D.K.; Tan, R.R.; El-Halwagi, M.M. Disjunctive fuzzy optimisation for planning and synthesis of bioenergy-based industrial symbiosis system. J. Environ. Chem. Eng. 2014, 2, 652–664. [Google Scholar] [CrossRef]
  22. Ng, L.Y.; Andiappan, V.; Chemmangattuvalappil, N.G.; Ng, D.K. A systematic methodology for optimal mixture design in an integrated biorefinery. Comput. Chem. Eng. 2015, 81, 288–309. [Google Scholar] [CrossRef]
  23. Liew, W.H.; Hassim, M.H.; Ng, D.K.S. Review of evolution, technology and sustainability assessments of biofuel production. J. Clean. Prod. 2014, 71, 11–29. [Google Scholar] [CrossRef]
  24. Alamia, A.; Gardarsdottir, S.O.; Larsson, A.; Normann, F.; Thunman, H. Efficiency Comparison of Large-Scale Standalone, Centralized, and Distributed Thermochemical Biorefineries. Energy Technol. 2017, 5, 1435–1448. [Google Scholar] [CrossRef] [Green Version]
  25. Lan, K.; Ou, L.; Park, S.; Kelley, S.S.; Yao, Y. Life Cycle Analysis of Decentralized Preprocessing Systems for Fast Pyrolysis Biorefineries with Blended Feedstocks in the Southeastern United States. Energy Technol. 2020, 8. [Google Scholar] [CrossRef]
  26. Roni, M.S.; Thompson, D.N.; Hartley, D.S. Distributed biomass supply chain cost optimization to evaluate multiple feedstocks for a biorefinery. Appl. Energy 2019, 254, 113660. [Google Scholar] [CrossRef]
  27. Psycha, M.; Kapnisi, M.; Kokossis, A.C. Extended Value Chain Synthesis towards the Design of Multi-Feedstock Algae Biorefineries. In Computer Aided Chemical Engineering; Elsevier BV: Amsterdam, The Netherlands, 2018; Volume 43, pp. 645–650. [Google Scholar]
  28. Bao, B.; Ng, D.K.; Tay, D.H.; Jiménez-Gutiérrez, A.; El-Halwagi, M.M. A shortcut method for the preliminary synthesis of process-technology pathways: An optimization approach and application for the conceptual design of integrated biorefineries. Comput. Chem. Eng. 2011, 35, 1374–1383. [Google Scholar] [CrossRef]
  29. Tay, D.H.S.; Ng, D.K.; Kheireddine, H.; El-Halwagi, M.M. Synthesis of an integrated biorefinery via the C–H–O ternary diagram. Clean Technol. Environ. Policy 2011, 13, 567–579. [Google Scholar] [CrossRef] [Green Version]
  30. Tay, D.H.S.; Kheireddine, H.; Ng, D.K.S.; El-Halwagi, M.M.; Tan, R.R. Conceptual Synthesis of Gasification-Based Biorefineries Using Thermodynamic Equilibrium Optimization Models. Ind. Eng. Chem. Res. 2011, 50, 10681–10695. [Google Scholar] [CrossRef]
  31. Meramo-Hurtado, S.-I.; González-Delgado, Á.D. Biorefinery synthesis and design using sustainability parameters and hierarchical/3D multi-objective optimization. J. Clean. Prod. 2019, 240, 118134. [Google Scholar] [CrossRef]
  32. Parada, M.P.; Osseweijer, P.; Posada, J. Sustainable biorefineries, an analysis of practices for incorporating sustainability in biorefinery design. Ind. Crops Prod. 2017, 106, 105–123. [Google Scholar] [CrossRef]
  33. Andiappan, V.; Ko, A.S.Y.; Lau, V.W.S.; Ng, L.Y.; Ng, R.T.L.; Chemmangattuvalappil, N.G.; Ng, D.K. Synthesis of sustainable integrated biorefinery via reaction pathway synthesis: Economic, incremental environmental burden and energy assessment with multiobjective optimization. AIChE J. 2014, 61, 132–146. [Google Scholar] [CrossRef]
  34. Roy, N.; Eljack, F.; Jiménez-Gutiérrez, A.; Zhang, B.; Thiruvenkataswamy, P.; El-Halwagi, M.; Mannan, M.S. A review of safety indices for process design. Curr. Opin. Chem. Eng. 2016, 14, 42–48. [Google Scholar] [CrossRef]
  35. Park, S.; Xu, S.; Rogers, W.; Pasman, H.; El-Halwagi, M.M. Incorporating inherent safety during the conceptual process design stage: A literature review. J. Loss Prev. Process. Ind. 2020, 63, 104040. [Google Scholar] [CrossRef]
  36. Bowling, I.M.; Ponce-Ortega, J.M.; El-Halwagi, M.M. Facility Location and Supply Chain Optimization for a Biorefinery. Ind. Eng. Chem. Res. 2011, 50, 6276–6286. [Google Scholar] [CrossRef]
  37. Piñas, J.A.V.; Venturini, O.; Lora, E.E.S.; Del Olmo, O.A.; Roalcaba, O.D.C. An economic holistic feasibility assessment of centralized and decentralized biogas plants with mono-digestion and co-digestion systems. Renew. Energy 2019, 139, 40–51. [Google Scholar] [CrossRef]
  38. Tay, D.H.; Ng, D.K.; Sammons, N.E., Jr.; Eden, M.R. Fuzzy optimization approach for the synthesis of a sustainable integrated biorefinery. Ind. Eng. Chem. Res. 2011, 50, 1652–1665. [Google Scholar] [CrossRef]
  39. Ponce-Ortega, J.M.; Pham, V.; El-Halwagi, M.M.; El-Baz, A.A. A Disjunctive Programming Formulation for the Optimal Design of Biorefinery Configurations. Ind. Eng. Chem. Res. 2012, 51, 3381–3400. [Google Scholar] [CrossRef]
  40. Sun, O.; Fan, N. A Review on Optimization Methods for Biomass Supply Chain: Models and Algorithms, Sustainable Issues, and Challenges and Opportunities. Process. Integr. Optim. Sustain. 2020, 4, 203–226. [Google Scholar] [CrossRef]
  41. El-Halwagi, M.M. Sustainable Design through Process Integration: Fundamentals and Applications to Industrial Pollution Prevention, Resource Conservation, and Profitability Enhancement, 2nd ed.; Elsevier: Amsterdam, The Netherlands, 2017. [Google Scholar]
  42. Zhang, C.; El-Halwagi, M.M. Estimate the Capital Cost of Shale-Gas Monetization Projects. Chem. Eng. Prog. 2017, 113, 28–32. [Google Scholar]
  43. Chouinard-Dussault, P.; Bradt, L.; Ponce-Ortega, J.M.; El-Halwagi, M.M. Incorporation of process integration into life cycle analysis for the production of biofuels. Clean Technol. Environ. Policy 2010, 13, 673–685. [Google Scholar] [CrossRef]
  44. EPA (Environmental Protection Agency). Emission Factors for Greenhouse Gas Inventories. 2020. Available online: https://www.epa.gov/sites/production/files/2020-04/documents/ghg-emission-factors-hub.pdf (accessed on 4 June 2020).
  45. López-Molina, A.; Huerta-Martínez, Á.A.; Gómez-Castro, F.I.; Conde-Mejía, C. A novel approach to identify hazards in non-conventional/intensified biofuels production processes. Chem. Eng. Process. Process. Intensif. 2020, 157, 108139. [Google Scholar] [CrossRef]
  46. Park, J.; Cho, J.; Lee, Y.; Park, M.-J.; Lee, W.B. Practical Microkinetic Modeling Approach for Methanol Synthesis from Syngas over a Cu-Based Catalyst. Ind. Eng. Chem. Res. 2019, 58, 8663–8673. [Google Scholar] [CrossRef]
  47. Ramzan, N.; Ashraf, A.; Naveed, S.; Malik, A. Simulation of hybrid biomass gasification using Aspen plus: A comparative performance analysis for food, municipal solid and poultry waste. Biomass-Bioenergy 2011, 35, 3962–3969. [Google Scholar] [CrossRef]
  48. Salladini, A.; Agostini, E.; Borgogna, A.; Spadacini, L.; Annesini, M.; Iaquaniello, G. Analysis on High Temperature Gasification for Conversion of RDF into Bio-Methanol. Gasif. Low-grade Feedstock 2018, 143. [Google Scholar] [CrossRef] [Green Version]
  49. Julián-Durán, L.; Ortiz-Espinoza, A.P.; El-Halwagi, M.M.; Jiménez-Gutiérrez, A. Techno-economic assessment and environmental impact of shale gas alternatives to methanol. ACS Sustain. Chem. Eng. 2014, 2, 2338–2344. [Google Scholar] [CrossRef]
  50. Ehlinger, V.M.; Gabriel, K.J.; Noureldin, M.M.B.; El-Halwagi, M.M. Process Design and Integration of Shale Gas to Methanol. ACS Sustain. Chem. Eng. 2014, 2, 30–37. [Google Scholar] [CrossRef] [Green Version]
  51. Alsuhaibani, A.S.; Afzal, S.; Challiwala, M.; Elbashir, N.O.; El-Halwagi, M.M. The impact of the development of catalyst and reaction system of the methanol synthesis stage on the overall profitability of the entire plant: A techno-economic study. Catal. Today 2020, 343, 191–198. [Google Scholar] [CrossRef]
  52. Shehzad, A.; Bashir, M.J.; Sethupathi, S. System analysis for synthesis gas (syngas) production in Pakistan from municipal solid waste gasification using a circulating fluidized bed gasifier. Renew. Sustain. Energy Rev. 2016, 60, 1302–1311. [Google Scholar] [CrossRef]
  53. Leo, D. Process Modelling and Simulation of a Methanol Synthesis Plant Using Syngas Streams Obtained from Biomass. Master’s Thesis, Politecnico di Milano, Milan, Italy, 2018. Available online: https://www.politesi.polimi.it/bitstream/10589/142748/3/2018_10_Leo.pdf (accessed on 4 June 2020).
  54. Lücking, L.E. Methanol Production from Syngas: Process Modelling and Design Utilising Biomass Gasification and Integrating Hydrogen Supply. Master’s Thesis, Delft University of Technology, Delft, The Netherlands, 2017. Available online: http://repository.tudelft.nl/ (accessed on 4 June 2020).
  55. Iaquaniello, G.; Centi, G.; Salladini, A.; Palo, E.; Perathoner, S.; Spadaccini, L. Waste-to-methanol: Process and economics assessment. Bioresour. Technol. 2017, 243, 611–619. [Google Scholar] [CrossRef] [PubMed]
  56. Zhang, C.; Nguyen, C.; Eljack, F.; Linke, P.; El-Halwagi, M.M. Integration of Safety in the Optimization of Transporting Hazardous Materials. Process. Integr. Optim. Sustain. 2018, 2, 435–446. [Google Scholar] [CrossRef]
  57. El-Halwagi, M.M. A return on investment metric for incorporating sustainability in process integration and improvement projects. Clean Technol. Environ. Policy 2017, 19, 611–617. [Google Scholar] [CrossRef]
  58. El-Halwagi, M.M.; Sengupta, D.; Pistikopoulos, E.N.; Sammons, J.; Eljack, F.; Kazi, M.-K. Disaster-Resilient Design of Manufacturing Facilities Through Process Integration: Principal Strategies, Perspectives, and Research Challenges. Front. Sustain. Food Syst. 2020, 1. [Google Scholar] [CrossRef]
  59. Guillen-Cuevas, K.; Ortiz-Espinoza, A.P.; Ozinan, E.; Jiménez-Gutiérrez, A.; Kazantzis, N.K.; El-Halwagi, M.M. Incorporation of Safety and Sustainability in Conceptual Design via a Return on Investment Metric. ACS Sustain. Chem. Eng. 2018, 6, 1411–1416. [Google Scholar] [CrossRef]
  60. Ortiz-Espinoza, A.P.; Jiménez-Gutiérrez, A.; El-Halwagi, M.M.; Kazantzis, N.K.; Kazantzi, V. Comparison of safety indexes for chemical processes under uncertainty. Process. Saf. Environ. Prot. 2021, 148, 225–236. [Google Scholar] [CrossRef]
  61. Moreno-Sader, K.; Jain, P.; Tenorio, L.C.B.; Mannan, M.S.; El-Halwagi, M.M. Integrated Approach of Safety, Sustainability, Reliability, and Resilience Analysis via a Return on Investment Metric. ACS Sustain. Chem. Eng. 2019, 7, 19522–19536. [Google Scholar] [CrossRef]
  62. Al-Douri, A.; Kazantzi, V.; Eljack, F.T.; Mannan, M.S.; El-Halwagi, M.M. Mitigation of operational failures via an economic framework of reliability, availability, and maintainability (RAM) during conceptual design. J. Loss Prev. Process. Ind. 2020, 67, 104261. [Google Scholar] [CrossRef]
  63. El-Halwagi, M.M. A Shortcut Approach to the Multi-scale Atomic Targeting and Design of C–H–O Symbiosis Networks. Process. Integr. Optim. Sustain. 2017, 1, 3–13. [Google Scholar] [CrossRef]
  64. Noureldin, M.M.; El-Halwagi, M.M. Synthesis of C-H-O Symbiosis Networks. AIChE J. 2015, 61, 1242–1262. [Google Scholar] [CrossRef]
  65. Mukherjee, R.; Asani, R.R.; Boppana, N.; El-Halwagi, M.M. Performance evaluation of shale gas processing and NGL recovery plant under uncertainty of the feed composition. J. Nat. Gas Sci. Eng. 2020, 83, 103517. [Google Scholar] [CrossRef]
Figure 1. Flowchart summarizing the methodology.
Processes 08 01682 g001
Figure 2. Superstructure of centralized and decentralized biorefining options.
Processes 08 01682 g002
Figure 3. Biomass availability and relative locations for the case study.
Processes 08 01682 g003
Figure 4. Key process inputs and outputs for a basis of one tonne methanol.
Processes 08 01682 g004
Figure 5. Economically optimum solution with a centralized facility (ROI is return on investment).
Processes 08 01682 g005
Figure 6. Suboptimal solution with centralized and decentralized facilities.
Processes 08 01682 g006
Table 1. Risk scale based on the Hazardous Process Stream Index (HPSI).
Total Process Risk (RT)Risk Level
0.0–0.2Very Low Risk
0.2–0.4Low Risk
0.4–0.6Medium Risk
0.6–0.8High Risk
0.8–1.0Very High Risk
Table 2. Key process information.
RDF (Refuse-Derived Fuel)Electric Energy NeededCost of Electric Energy (Assuming USD0.05/kWh)Demineralized Water NeededCost of Water (Assuming USD3/Tonne)Produced MethanolValue of Methanol (Assuming USD350/Tonne)
1 tonne500 kWh250.15 tonneUSD0.450.4 tonneUSD140
Table 3. Non-baseload emission factors.
ItemCO2 Factor Tonne/MWhCH4 Factor
Tonne/MWh
N2O Factor
Tonne/MWh
US Average Energy Mix0.655.30 × 10−50.77 × 10⁻⁵
Table 4. Steam and heat emission factors assuming natural gas is entirely used at 80% efficiency.
ItemMMBtu per Tonne of Natural Gas (LNG Factor Used)CO2 Factor (kg CO2/MMBtu)CH4 Factor (g CH4/MMBtu)N2O Factor (g N2O/MMBtu)
Steam and Heat (from Natural Gas)51.753.06 1.00.10
Table 5. Risk results for methanol transportation.
SolutionRisk Factor by CityHighwayRailroad
OptimalTransporting methanol to city B207.27128.08
Transporting methanol to city C426.87673.17
Total risk factor from centralized facility 634.14801.24
SuboptimalTransporting methanol to city B200.39297.13
Table 6. Greenhouse gas (GHG) emissions and risk for the optimal and suboptimal solutions.
SolutionTotal GHG Emissions (Tonnes CO2eq/year)Process Risk (HPSI)Lower Transportation Risk Factor
Optimal with Maximum ROI (11.8%)290,877 Total (104,061 from electricity, 39,659 from natural gas, 144,500 from process emissions, 2269 from raw material transport, 388 from product transport)0.75 (High Risk)554.9 (using the highway to transport methanol to city B and using railroad to transport methanol to city C)
Suboptimal Solution282,760 Total (101,613 from electricity, 38,726 from natural gas, 141,100 from process emissions, 993 from raw material transport, 329 from product transport)0.50 (Medium Risk)200.4 (using the highway to transport methanol to city B)
Publisher’s Note: MDPI stays neutral with regard to jurisdictional claims in published maps and institutional affiliations.

