1. Introduction
In various industries, starting from pharmaceutical companies, processing of raw materials, agriculture, food processing and ending with civil engineering and many other branches, the product quality often depends on the quality of mixing of particulate substances. For many reasons, the homogeneous mixing of particles represents a key factor for a wide range of operations, such as intensification of chemical reactions, improvements in mechanical properties (e.g., spatial distribution of particle in concrete materials), API (active pharmaceutical ingredient) uniform distribution in dosage forms, uniform distribution of color pigments in paints and beauty products, constant flavor in the whole volume of flavoring preparations, etc. Therefore, the key prerequisite for the successful mixing of particulate substances is homogeneity of the resulting products achieved by online monitoring. To determine the resulting mixture quality, in general, the homogeneity index was introduced [
1,
2]. The homogeneity index correct value should be closely interconnected with specific properties of resulting mixtures regardless of the mixing process type used, and, in addition, its easy and precise determination should be provided. However, more than 40 various methods have been proposed for the homogeneity index determination by various authors so far. The number of factors influencing the degree of mixing points out to the complexity of the mixing process and difficulties in the effort of obtaining the optimal homogeneity and resulting mixture properties [
3].
Among other things, the rotary drum is quite often used for mixing of particulate materials [
4,
5,
6]. Depending on the mixer volumetric filling, drum rotational speed and friction or cohesive forces of the material [
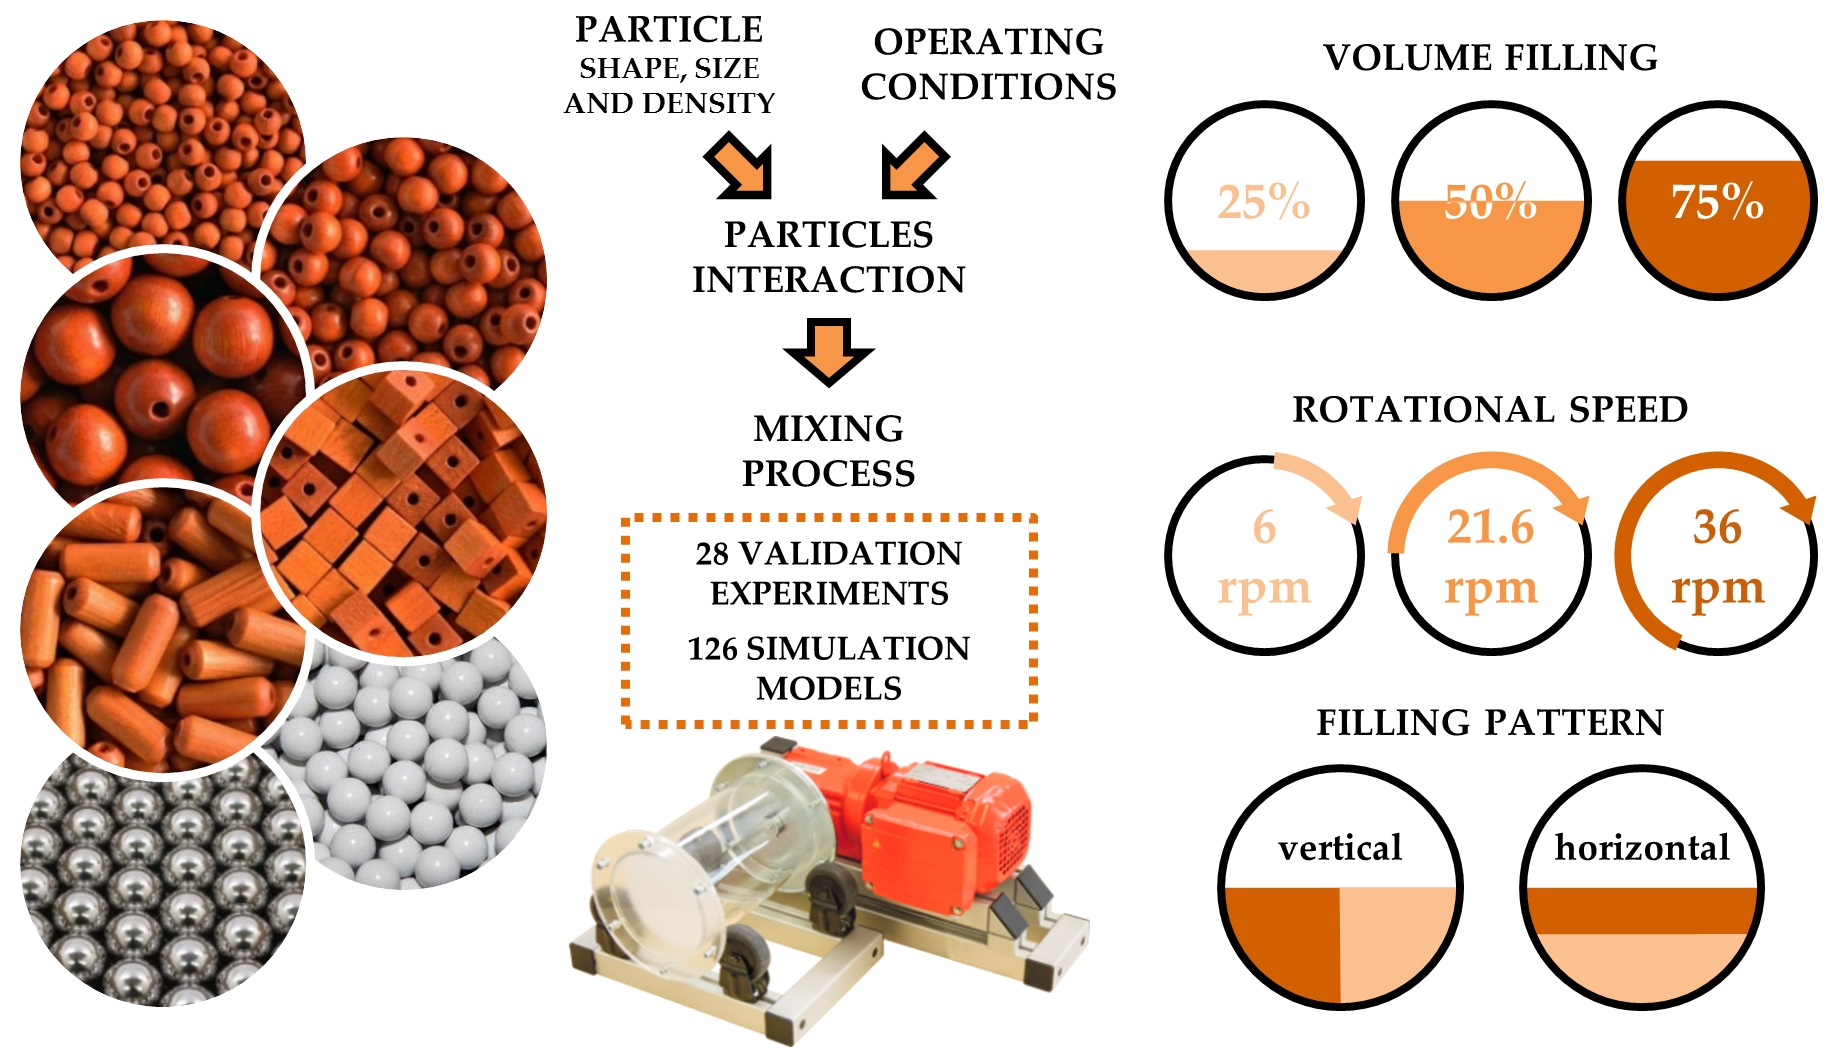
7], movements of particulate materials in this mixer can be characterized by several ways. In the case of a very low degree of volumetric filling, and low drum speed, the material will only slide along the drum wall (sliding or surging motion). With increasing drum speed, friction forces augmented by the centrifugal force will prevail and the material will rise and descend along the drum wall repeatedly (slumping). In addition, the dynamic angle of repose of the material will be formed and the material will be rolling. As the volumetric filling and revolution increase, a transition to the cascade and gravity takes place and the material fall over in waves back to the drum bottom section [
7]. The rolling, cascading, and cataracting movement modes are most suitable for industrial mixing processes (see
Figure 1) [
8,
9].
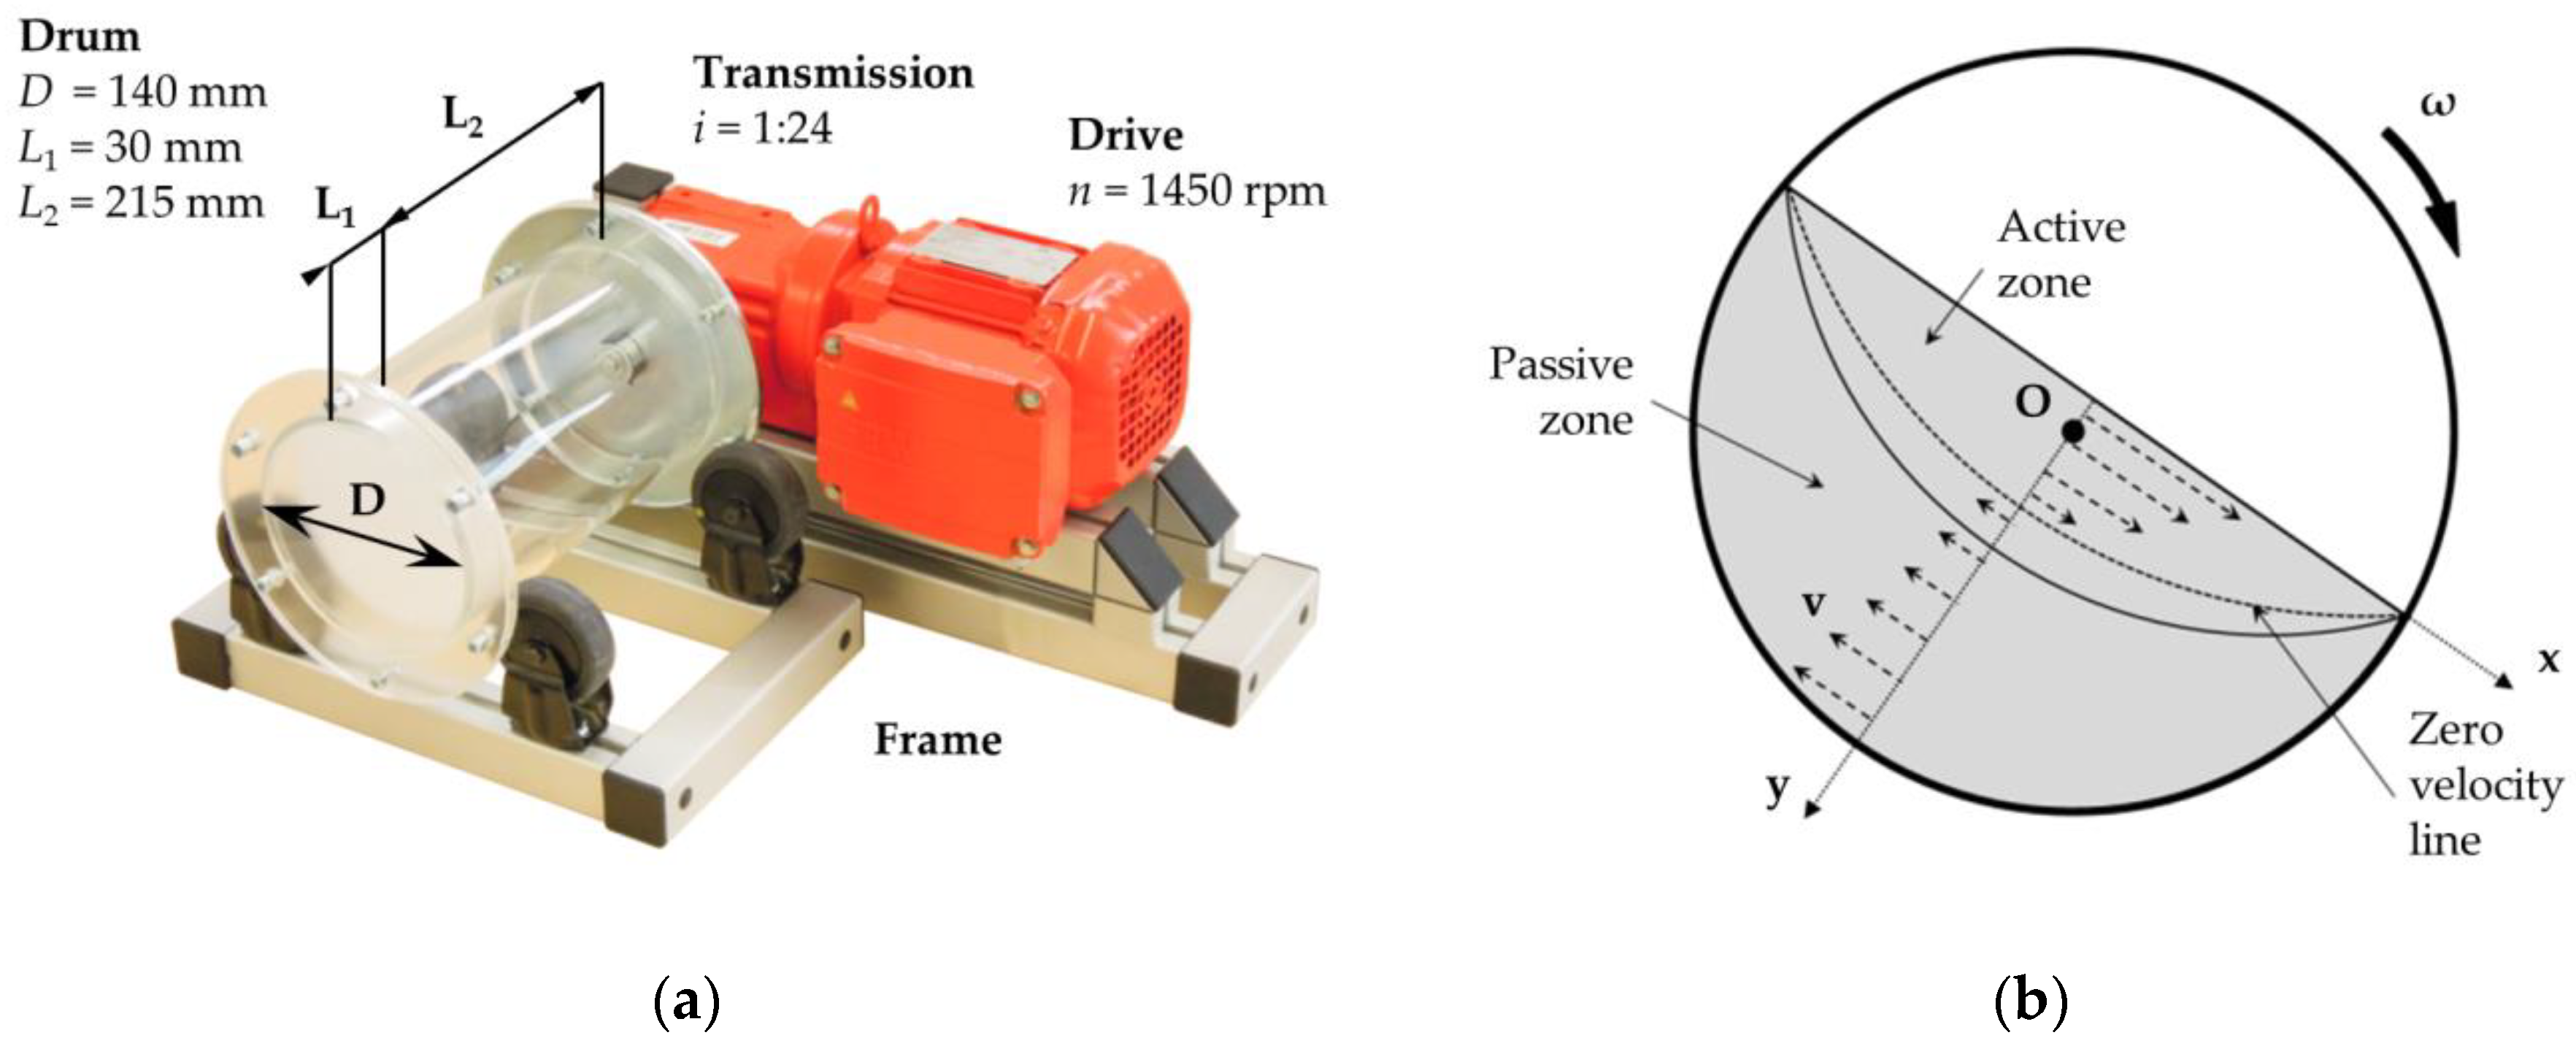
In the rolling mode, particle bed can be divided into two zones, namely the active zone and the static zone [
8]. Since the mixing behavior mainly occurs in the active region, particle motions in this region are crucial to evaluate the mixing performance of the whole drum. Depending on the operating drum revolutions, various movement types were defined for freely flowing particulate materials in the rotary drum. Among others, the criterion for individual types of movement is also the ratio of centrifugal and gravity forces affecting the particles, i.e., the Froude number [
7].
The studies of mixing of materials deal with various parameters influencing the kinetics and equilibria of this process. For instance, by examining of the active region thickness based on comparisons of the theoretic model with experimental results of velocity fields of particles in the rotary drum [
8,
10]. Further studies point out that the quality and performance of mixing of particles in the drum are related to some variables, such as particle sizes and densities, friction coefficient, degree of drum filling, and rotary speed [
11,
12,
13,
14]. The discrete element method (DEM) simulations are used for mixing processes [
14,
15,
16,
17,
18] because they are able to provide more heterogeneous and detailed data than the experimental results. At present, the ever-growing capacity of computers enables precise, universal and continuous simulation and monitoring of the mixing process. Therefore, the DEM methods are widely used for this purpose and its significantly increased application in the recent years is evidenced by the increasing number of publications.
The relevance between the active layer of mixing and the total mixing in the rotary drum, or mixing modes, was also studied by the use of DEM [
18,
19,
20]. There is an effort for high quality graphic evaluations of the particle arrangements depending on various process variables starting with the revolutions and ending with the drum filling degree. The course of the mixing process during such experiment is usually observed in 2D only. In order to evaluate the volume homogeneity, it is then necessary to choose a suitable sampling method, which is not often an easy task. In order to avoid “dead zones,” the use of passive elements placed inside the rotary drum is offered for practical applications [
17,
21]. Using the DEM, the mixing process can be analyzed in detail without the need to design intricately a prototype and substantial experimental works. Studies dealing with the energy consumption during mixing processes in the rotary drums based on the DEM are also common [
15,
22] because it is an important design parameter for the motors of drum mixing systems. In most cases, it is taken for granted that the particles are of the same size and/or uniformly distributed and that no axial tilting for the rotary drum is needed. In practice, such assumptions may be true, or maybe not. In order to study the energy demand of a polydisperse mixture of various degrees of volumetric filling of the drum, the DEM model can be used. Using the numerical model based on the DEM method, the particle segregation in the rotary drum can be also investigated. Segregation mechanisms in mixing of cohesive and non-cohesive particles are also analyzed in this way [
16,
23]. In addition, models for the description of mixing processes the diffusion equation [
24]. However, there is still only a few of papers dealing with experimentally verified DEM studies of a greater complexity, where a larger number of parameters is involved. Therefore, this paper is focused in this direction, which fills the research gap in the description of particle mixing in the rotary drum for combinations of several operating parameters at the same time.
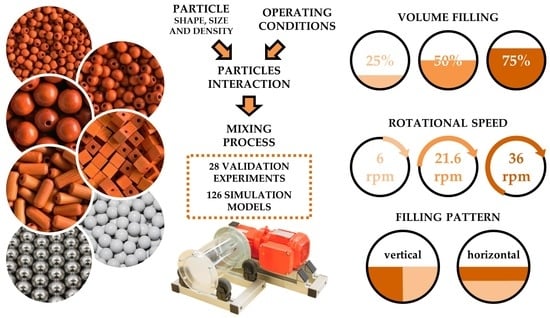
This paper presents a study of the influence of particle size, shape, density, method, and degree of filling, and rotational speed of the rotary drum to the process of mixing. The mixing quality is quantitatively evaluated by the homogeneity index. The rotary drum was selected as a representative of the diffusion mixing mechanism. It is an example relatively easily applicable to the possibilities of using the DEM method in both industry and research. The first part of the study was focused on calibration and validation of the DEM numerical model. In the second part, all influences of the above parameters of the homogeneity index are discussed in detail. Optimum values and conditions were evaluated and discussed, as well as the possibilities in combinations of particle shapes, sizes, and densities, based-for instance-on illustrations of sections from the inside of the rotating drum, as a possibility to acquire data of particle assemblies at an arbitrary moment of mixing.
2. Materials and Methods
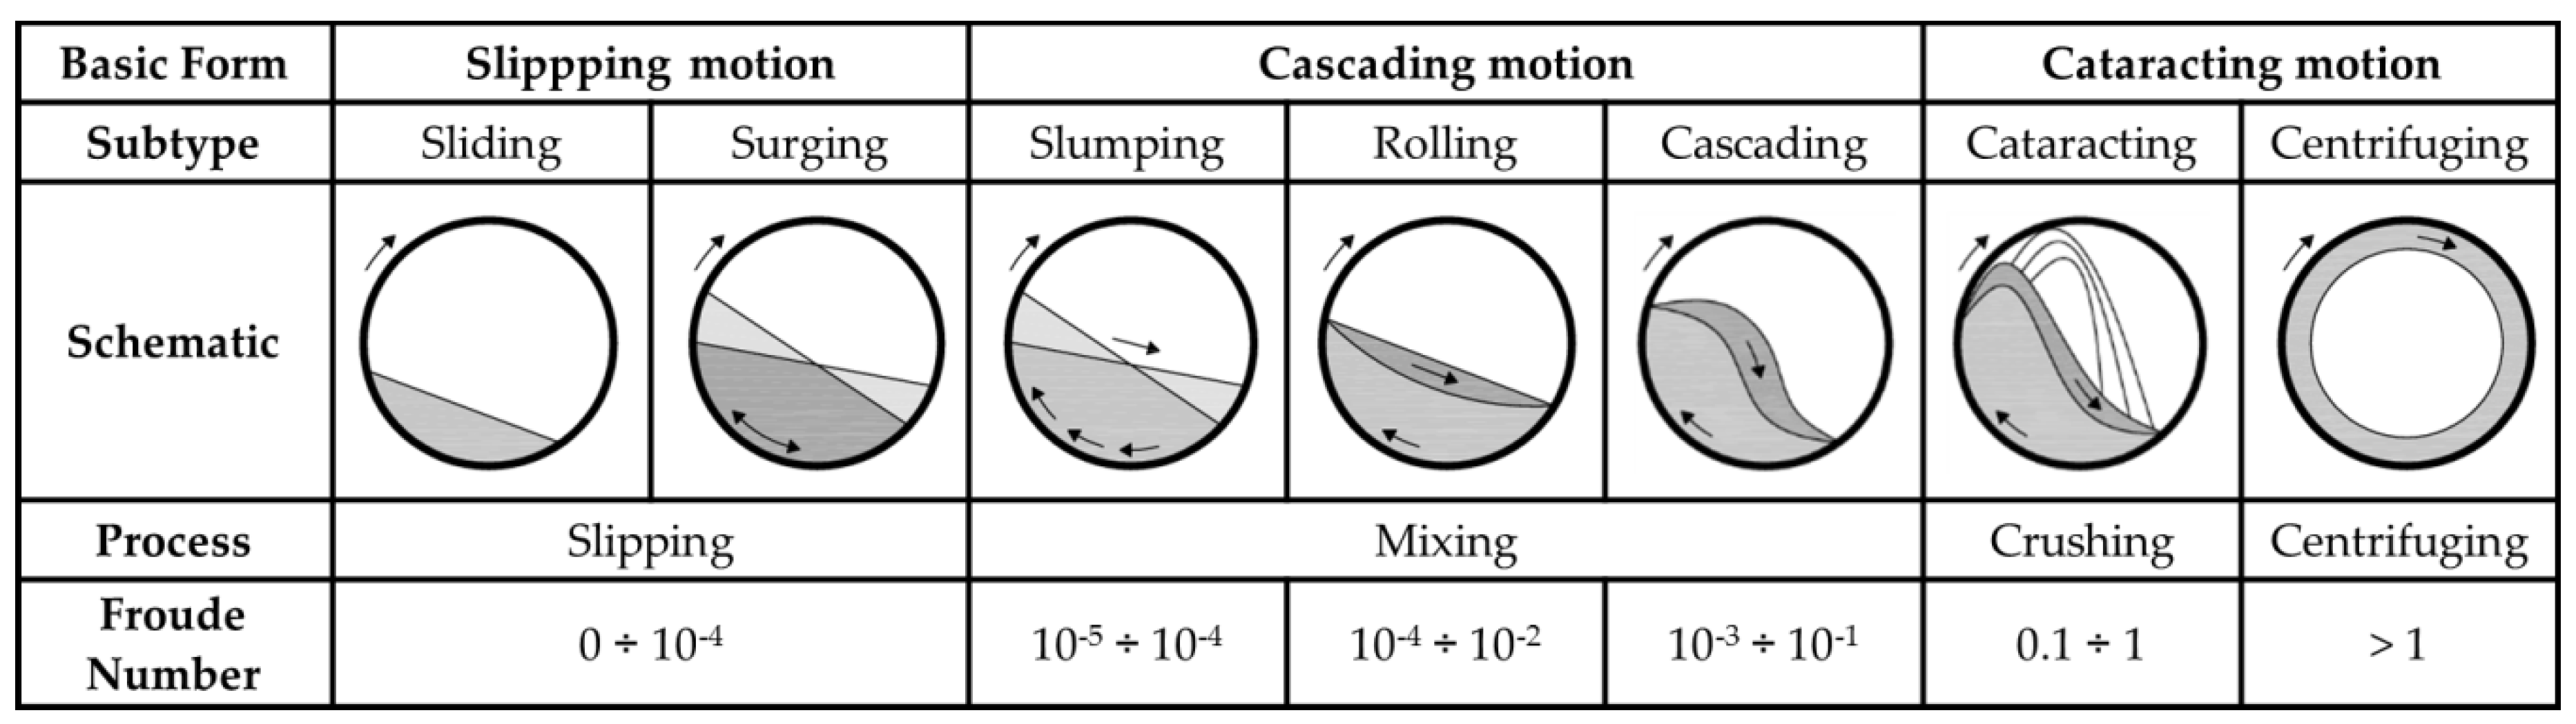
Seven various particulate materials were used in the study. The selection of materials represented particles of different sizes, shapes, and densities. These particulate materials are shown in
Figure 2. The selection includes various geometrical bodies, such as spheres, cubes, or cylinders that reflect the morphology of real particles in the industrial practice. In the spherical shape, a range of agricultural products can be shown—pea, chickpea, nuts, various seeds, etc. The cylindrical shape represents the wooden pellets in the energy industry (biomass processing), and the cubic shapes then sharp-edged particles of crushed stone, ore, or coal.
The experiments were conducted in the rotary drum (
Figure 3a). The assembly consists of a frame made of aluminum beams, on which an electric motor with a gearbox driving the drum is mounted. The drum is freely laid on four wheels placed on the frame. The driving torque is transferred by a key and keyseat inside the shaft. The electric motor is connected to the mains over a frequency converter, which enables the revolution control. The drum inner diameter of 140 mm was chosen with regard to the size of the used particulate materials. Approximately 25 particles of 6 mm size each were added corresponding to 140 mm diameter crosswise the surface profile. Adequate number of particles is important for the determination of the dynamic angle of repose. On the other hand, if there were too many particles in the drum, the DEM calculation times would increase significantly [
25]. Inside the drum, there is a partition dividing the drum into two parts. The shorter part is 30 mm wide and it serves mainly for calibration experiments. This size approximately corresponds to five particles (of 6 mm size), which is sufficient for the calibration experiments and still helps to avoid the undesirable increase in the calculation times. The second part is 215 mm wide and it serves for studying of mixing processes in rotary drum mixers, where it is possible to monitor the material distribution also in the axial direction. The drum rotary speed can be controlled by the frequency converter, where the range of drum revolutions is from 6 to 36 rpm. The gearbox is advantageously used for the increased driving torque due to which the rotary speed is not influenced by the weight of particulate materials. The whole drum is made of transparent and white PMMA (poly-methyl methacrylate = plexiglass) so that it is possible to analyze mechanisms and mixing zones (
Figure 3b). Transparent as well as white PMMA parts show the same frictional properties.
The analyses of material movements inside the drum during the experiments were conducted with the use of a high-speed camera and the PIV (particle image velocimetry) analysis. A typical way of the material rolling movements in the rotary drum is shown in
Figure 3b. The PIV method is an optical method based on flow visualization. If sufficiently small particles are used, where it is assumed that they truly copy the flow dynamics, the method is utilized for measurements of instantaneous velocities of flowing of fluids and gases, but it can be also used for visualization of bulk material. The monitored medium is lighted in a way making the drifting particles as visible as possible, and consequently, the movement of particles is used for the conversion of the speed and direction (velocity field) of the flow. The measurement results yielded by the PIV method represent either two-dimensional or also three-dimensional vector fields. At least two frame exposures are necessary for the flow analysis. Then it will be possible to calculate the shift vector per each region created in this way using the autocorrelation or cross-correlation methods. In this procedure, the velocity will be determined by the use of the time elapsed between the frames and the physical size of each pixel of the captured image. This method brings about a major advantage by the fact that the measuring equipment itself does not influence the examined flowing streams. On the other hand, the method disadvantage is that it is not possible to measure the particle velocity in the direction from/to the camera. Particle movements in this direction cannot be eliminated in any other way and it may therefore cause a distortion within the measured plane. This problem is eliminated with the stereoscopic PIV, where within the use of two cameras all three components of the movement are monitored [
26].
2.1. Tested Parameters
This study compares the mixing process course for selected couples of particulate materials and the influence of filling patterns, drum revolutions, shape, size, and density of particles to the resulting homogeneity index of the mixture [
27]. Seven couples of particulate materials were selected from the collection. These couples were examined in the experimental studies. The separate couples were selected for their respective shapes, sizes, and densities. Three degrees of volumetric filling of the drum with the material were tested at 25, 50, and 75%. In addition, three drum revolving speeds represent three modes of movement of the material in the drum. Sliding, rolling, and cascade movements were represented by the drum revolutions at 6, 21.6, and 36 rpm. The last monitored attribute was either the vertical or the horizontal method of filling the mixing drum.
2.2. Evaluation of Homogeneity
Validation experiments for all seven couples of particulate materials were conducted with 50% volumetric filling of the drum, at 6 and 21.6 rpm and both vertical and horizontal filling. For all 126 parameter combinations simulation models were created, out of which the resulting data were obtained. As a quantifiable parameter determining the degree of mixing of two groups of particles, the homogeneity index was chosen. This index is sometimes called the segregation (mixing) index defined by the number of contacts among the particles:
where
CAA is the number of contacts among the particles A,
CBB the number of contacts among the particles B, and
CAB is number of contacts among the particles A and B. The homogeneity index then assumes the value within the range 0 <
S < 2, where at random mixtures the value fluctuates around
S ≈ 1. The values lying on both sides from 1 are transient segregation states (
S > 1) and at an ordered mixed system (
S < 1). The value
S = 0 corresponds to an ideally ordered system, where not
CAA or
CBB contacts exist [
28,
29,
30].
Each of the validation experiments and simulation models were carried out for five drum revolutions, i.e., for rotation of 5 × 360°. After the five drum revolutions, the resulting homogeneity index was determined. At 28 validation experiments the drum was always filled up to its 25% of the total volume capacity (460 mL) with the A particles and up to its 25% of the total volume capacity with the B particles. After this, the whole charge was mixed by five revolutions of the drum. The whole experiment was recorded by a camera at the frequency of 120 frames per second. For the validation experiment evaluations and comparisons with numerical models, 11 frames were taken out of the record in times from t0 to t10 from the drum start-up always after ½ drum revolution. As the mutual movement of particles in the drum is strongly stochastic phenomenon, the correctness of the simulations was evaluated individually based on the particle movement behavior in the drum and graphical comparisons of the mixing quality in separate movement phases from t0 to t10.
2.3. Numerical Modelling
The DEM model used in this study uses the so-called “soft-sphere” method originally developed by Cundall and Strack. In this method, the particles in contact are capable of resisting to small deformations and these deformations are used for calculations of forces having effects among the particles. Tsuji et al. (1992) proposed a non-linear contact model by adaptation of the original model proposed by Cundall and Strack [
31]. The currently plentifully used model of Hertz-Mindlin is in commercial software EDEM characterized by the following Equations (2) and (3). This model is suitable for simulations of coarse-grained and non-cohesive materials.
where
E* is the equivalent Young’s modulus of two colliding particles,
R* is the equivalent contact radius,
δijn refers to the normal displacement of particles under the influence of the normal force,
m* is the equivalent mass of particles,
vijn is the normal component of relative velocity. The normal contact stiffness is then calculated as
. Damping coefficient t is a function of the coefficient of restitution e and ranges from 0 (absolutely viscous) to 1 (absolutely elastic). The tangential force
Fijt is given by the tangential displacement
δijt, the relative tangential velocity vijt and the tangential stiffness
. In EDEM, the tangential force is limited by the condition defined by Coulomb’s law of friction.
The input interaction parameters for the contact model such as static friction, rolling friction, and coefficient of restitution were determined experimentally by the use of experimental apparatuses. For instance, the double pendulum method for the restitution coefficient measurement is described by Hlosta et al. (2018) [
32]. All virtual particulate materials were calibrated by the use of the static angle of repose (S-AoR) and the dynamic angle of repose (D-AoR) and the discharge from the calibration model hopper. The issues of discharge calibration of the particles in the DEM are described in the study of Rozbroj et al. (2019) [
33]. These input data were additionally specified more exactly. No results from the calibration simulations exceeded the deviation of 5% as compared to the real calibration experiments. Examples from the C6 material calibration are shown in
Figure 4.
For the validation of material movement inside the drum, volume filling degrees of 30 and 60%, and revolutions of 36 and 60 rpm were chosen. In the first place, the virtual material behavior (the dynamic angle of repose, particle velocities, flow profiles, etc.,) depends on the entered interaction input parameters. Therefore, in spite of the basic calibration of the virtual material performed, it is necessary, for the use in process applications, to validate the movement of the whole complex of particles. In
Figure 5, there is an example of the material movement calibration in the drum as a graphic comparison between the PIV analysis and the DEM simulation. The particle velocity visualization is provided by the use of the identical scale of colors: white (zero velocity)–green–yellow–red (velocity of 0.5 m∙s
−1). The green regions above the particle bed in area without the particles are caused by reflections on PMMA front wall. PIV analysis analyses the particle motion as well as the reflections motion. It is a reason why the graphical evaluation of speeds is better than numerical one. Reflections can cause a deviation in results. Operator can evaluate shape and velocities of particle bed from the graphical presentation only from the region showing particles.
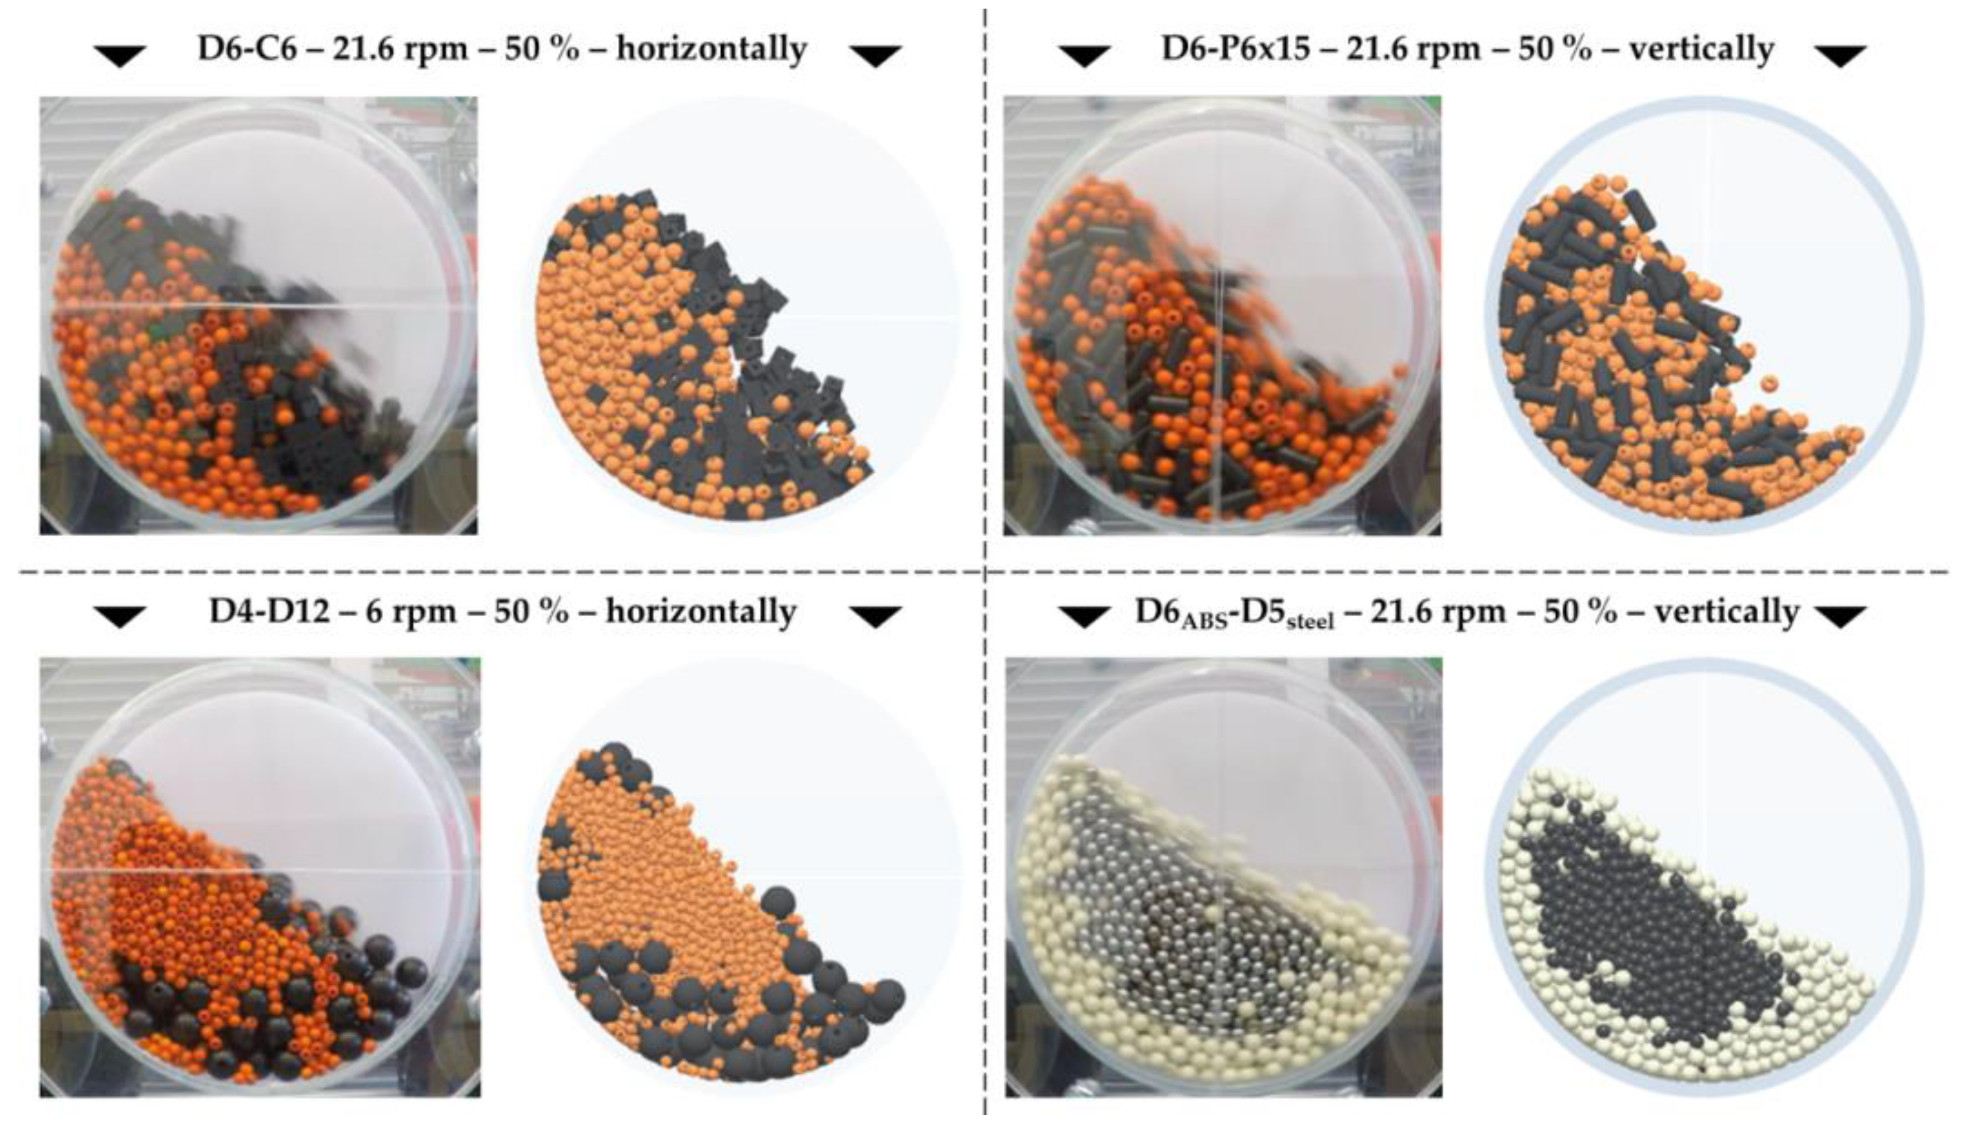
The used numerical model was validated based on the static and dynamic angles of repose, hopper discharge times, and the PIV analysis of the material movement in the drum. The graphic evaluation between the experiments and the simulations pointed out to a good consistence. The created model was further used for movement analyses and studies of combinations of selected particles. In this way, the mixing process was graphically validated. At the identical moment, the distribution of both particulate components in the mixture was visually compared with the dynamic angle of repose at both simulation and validation experiment. An example of comparisons of selected experiments and simulation models is shown in
Figure 6. Overall, 126 simulation models were validated by 28 experiments. For each particle combination 50% drum capacity was used and 6 and 21.6 rpm, always both for vertical and horizontal filling respectively. Very good agreement was achieved between numerical models and validation experiments. This way, the particulate materials were calibrated, the mixing process validated, and it was possible to set to the numerical study.
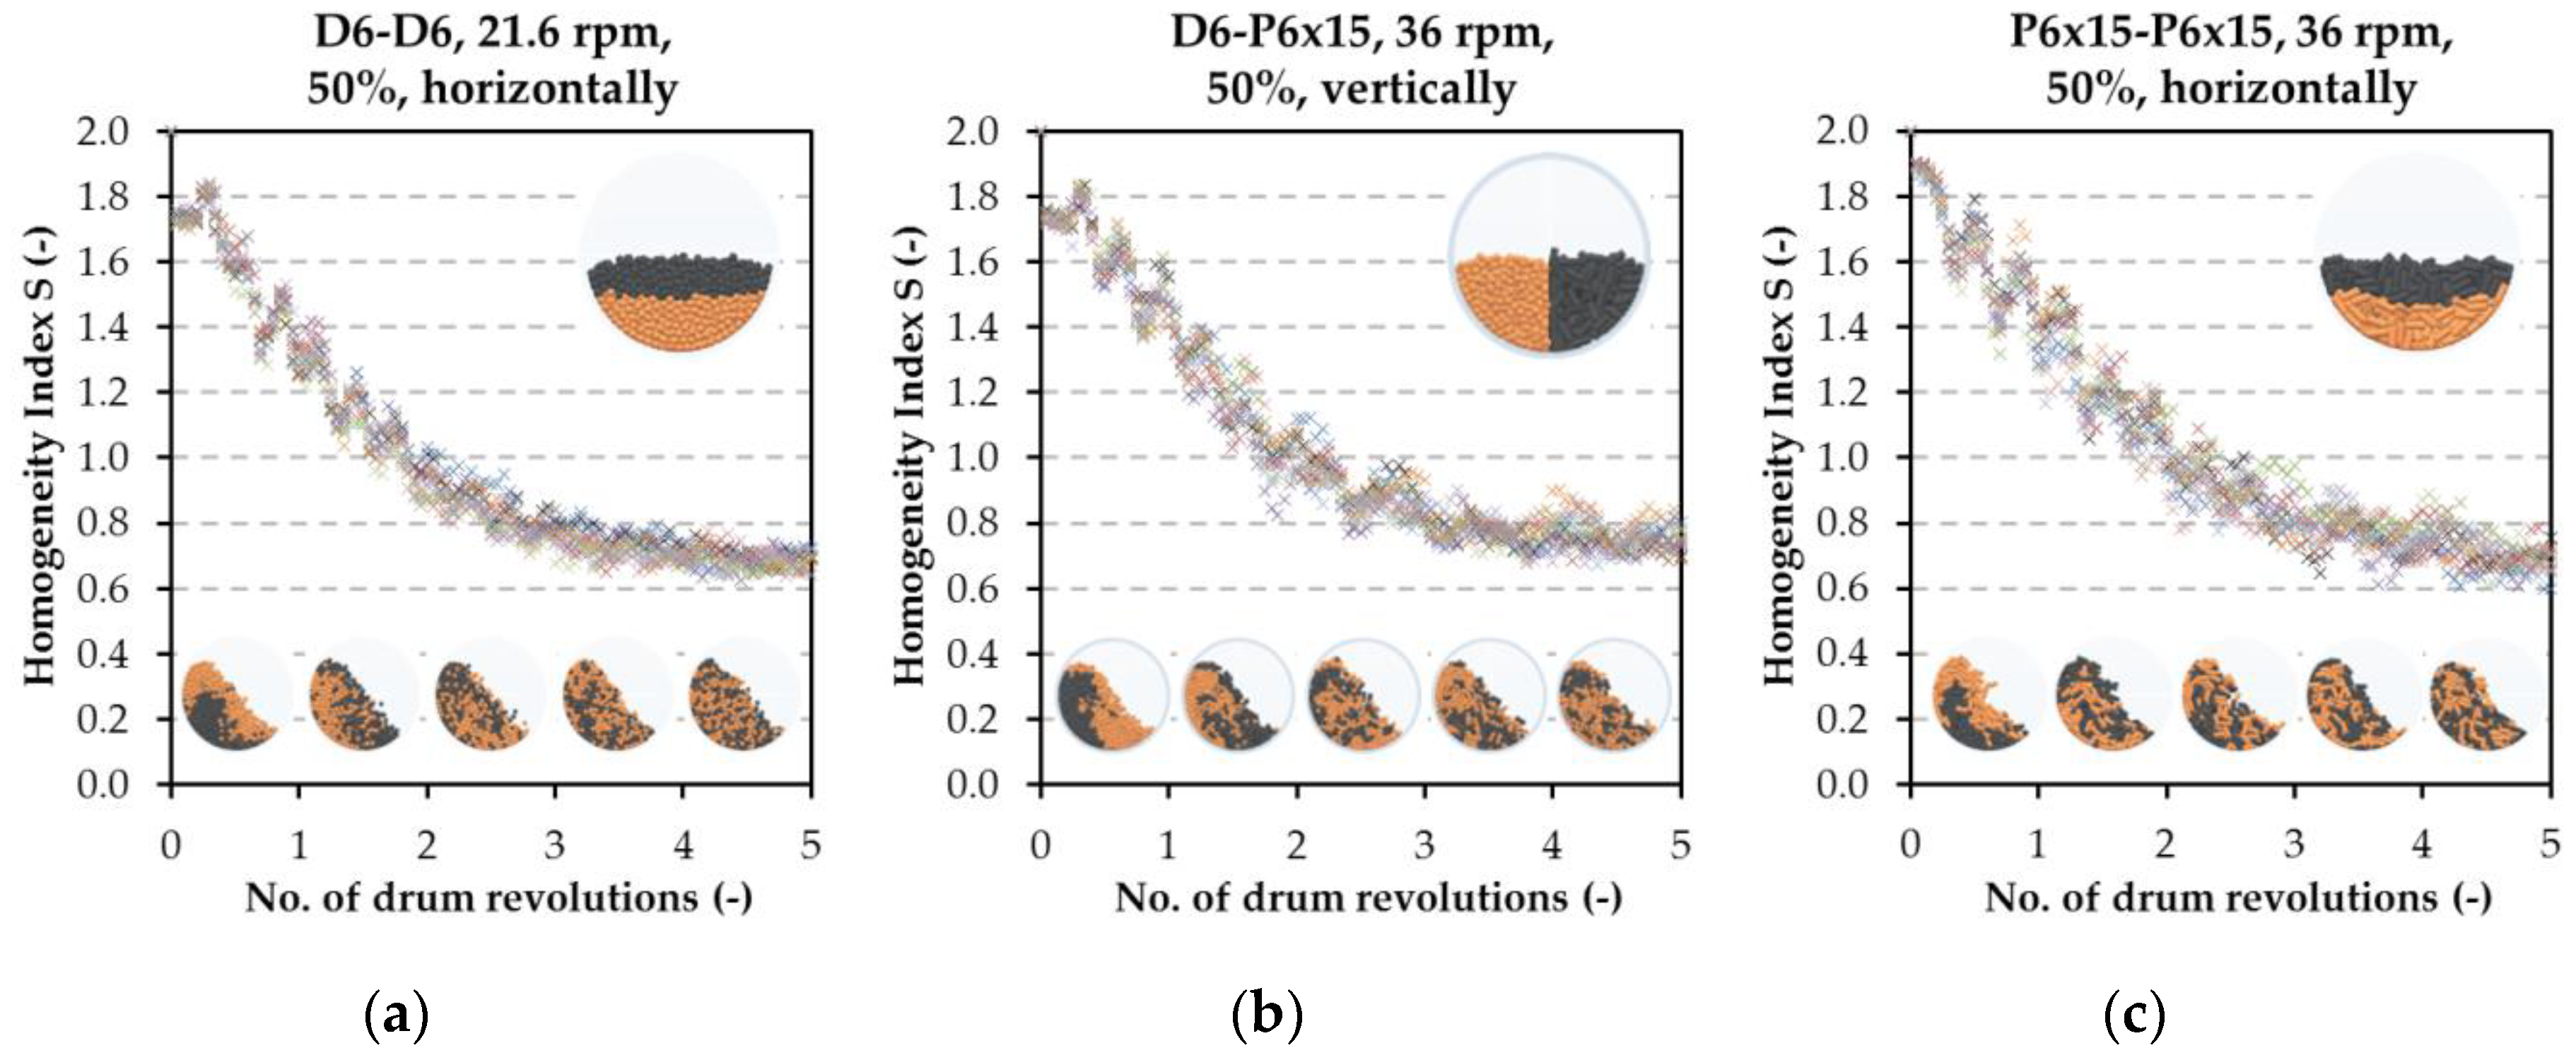
The results of all operating conditions were determined always based on a single simulation. This turned attention to the question of reproducibility of the results. Therefore, three simulation options were selected and for each of them ten simulations were created with the same numerical model, i.e., with the identical input data and operating conditions. Initial position of the particles was created randomly by “rainfalling” packing for each simulation with the same particles number. In these series of ten simulations, the homogeneity index development was observed in dependence on gradual turning of the drum. For this study, the following options were selected with regard to the tests of particle shapes, drum revolutions, and the drum filling method:
Combination of particles D6-D6, 21.6 rpm, 50% capacity filling, horizontal filling;
Combination of particles D6-P6 × 15, 36 rpm, 50% capacity filling, vertical filling;
Combination of particles P6 × 15-P6 × 15, 36 rpm, 50% capacity filling, horizontal filling.
The reproducibility study results are shown in
Figure 7. For ten repetitions of the given simulation, the homogeneity index values were obtained with the steps of 0.05 revolution of the drum (i.e., gradual turning of the drum by 18°). The data plotted into the graph create a band, the width of which defines the spread of values in the ten experiment repetitions. Out of the final values of the homogeneity index, the mean value with relative standard deviation was determined. This relative standard deviation fluctuates within the range of
, which represents the approximate error of 3%. The resulting values of the homogeneity index were 0.70 ± 0.02 for D6-D6 particles, 0.75 ± 0.03 for D6-P6 × 15 particles, and 0.69 ± 0.04 for P6 × 15-P6 × 15 particles. In both graphic outputs as well as data points, it is clear that none of the ten simulations differ in the results or its course. In all three series, a very good agreement and consistent results were achieved. The reproducibility of numerical models is therefore very good, and very credible data can be obtained even from a single simulation created.
4. Conclusions
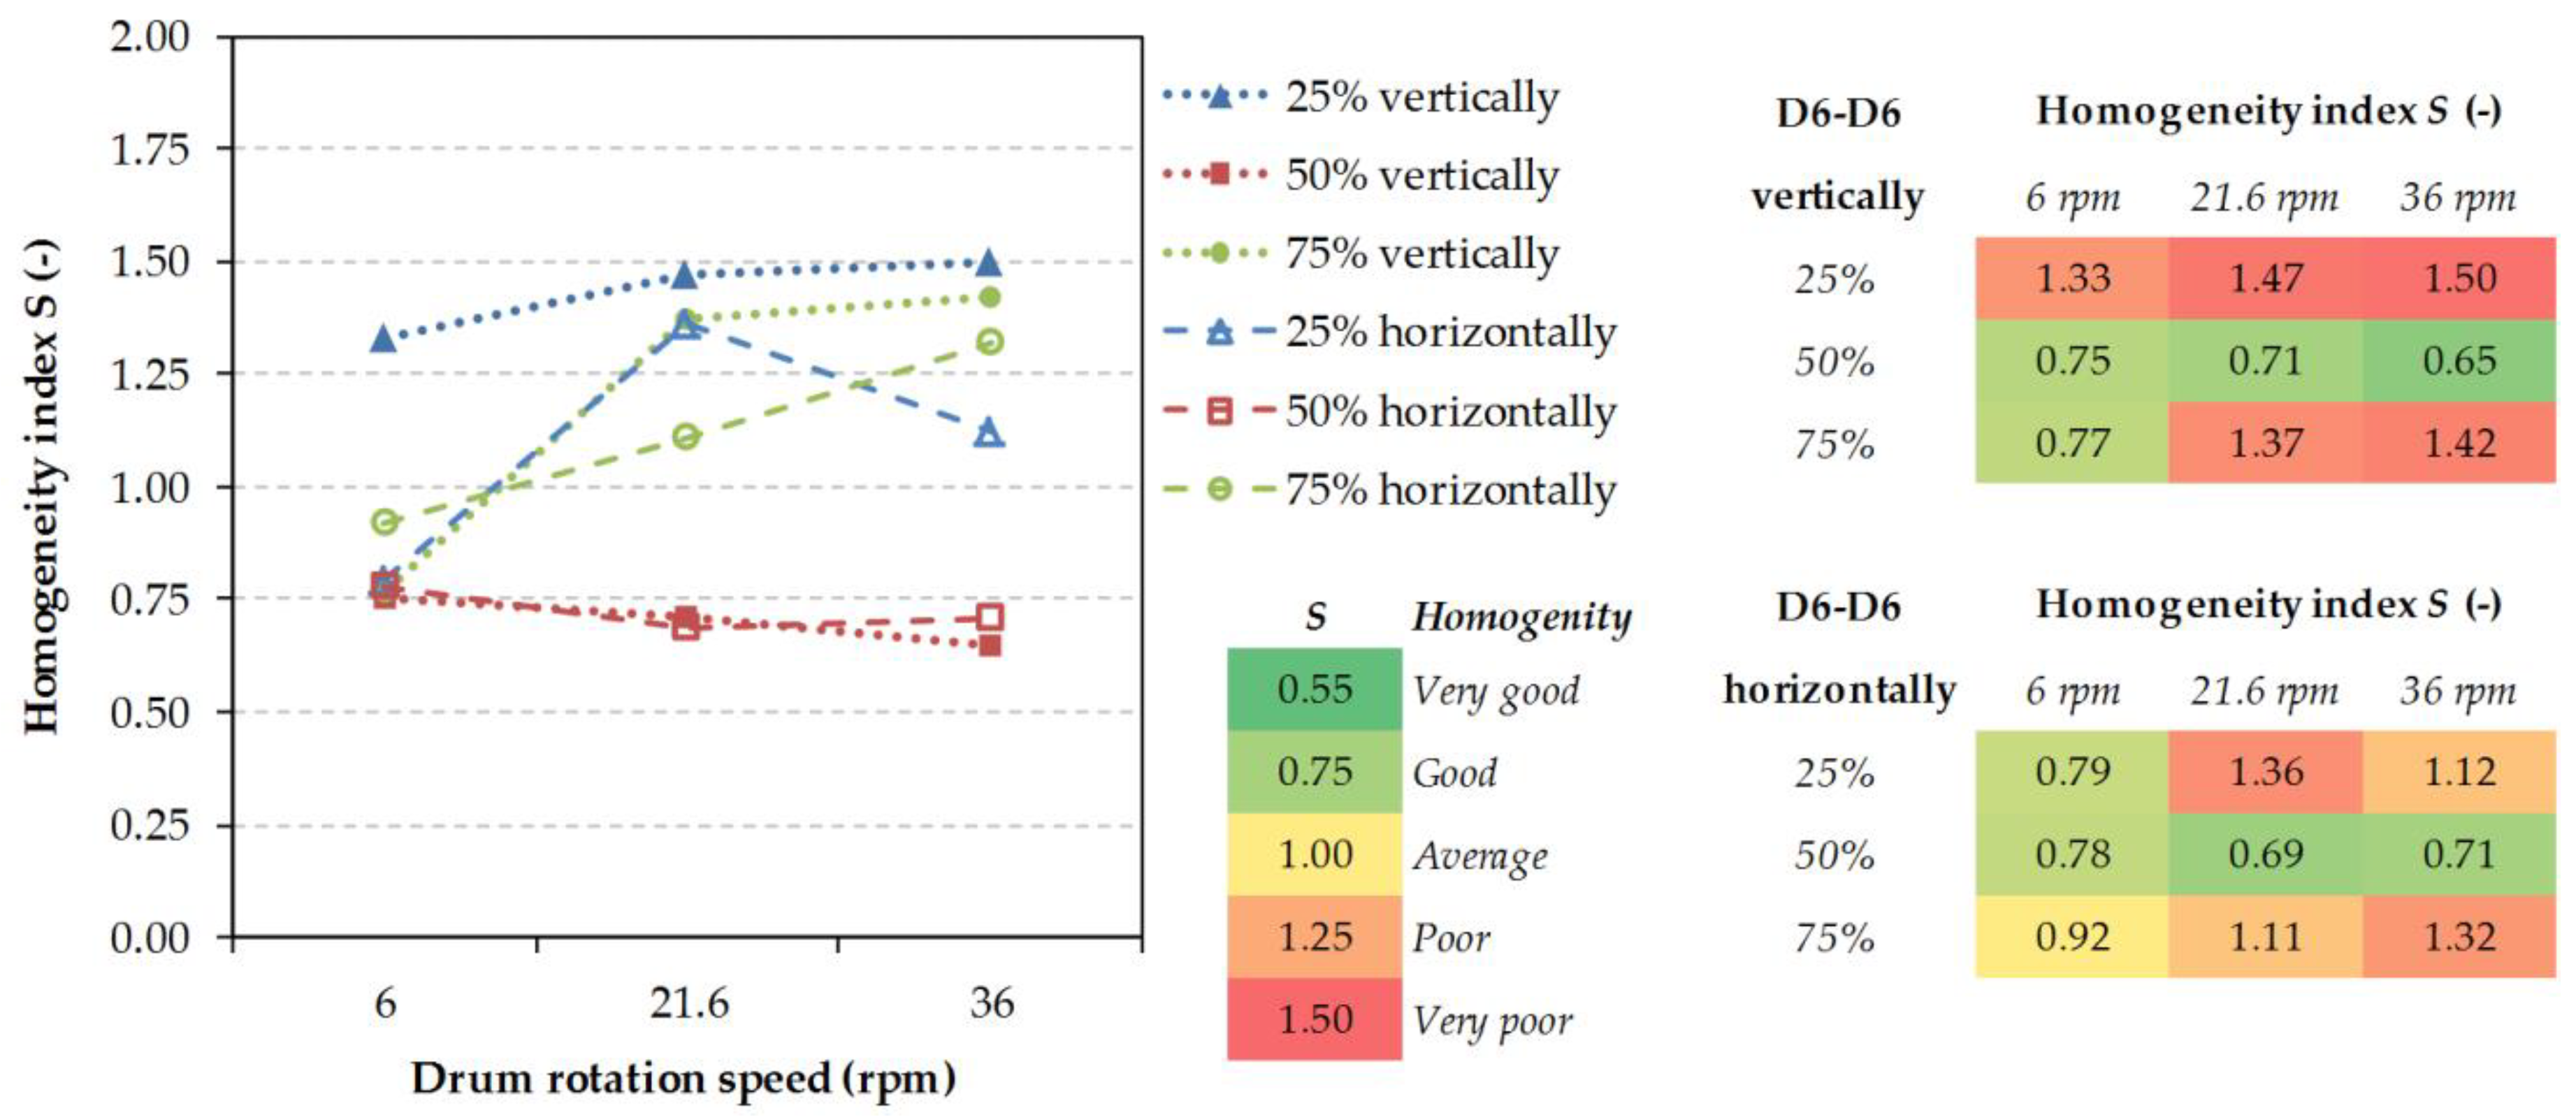
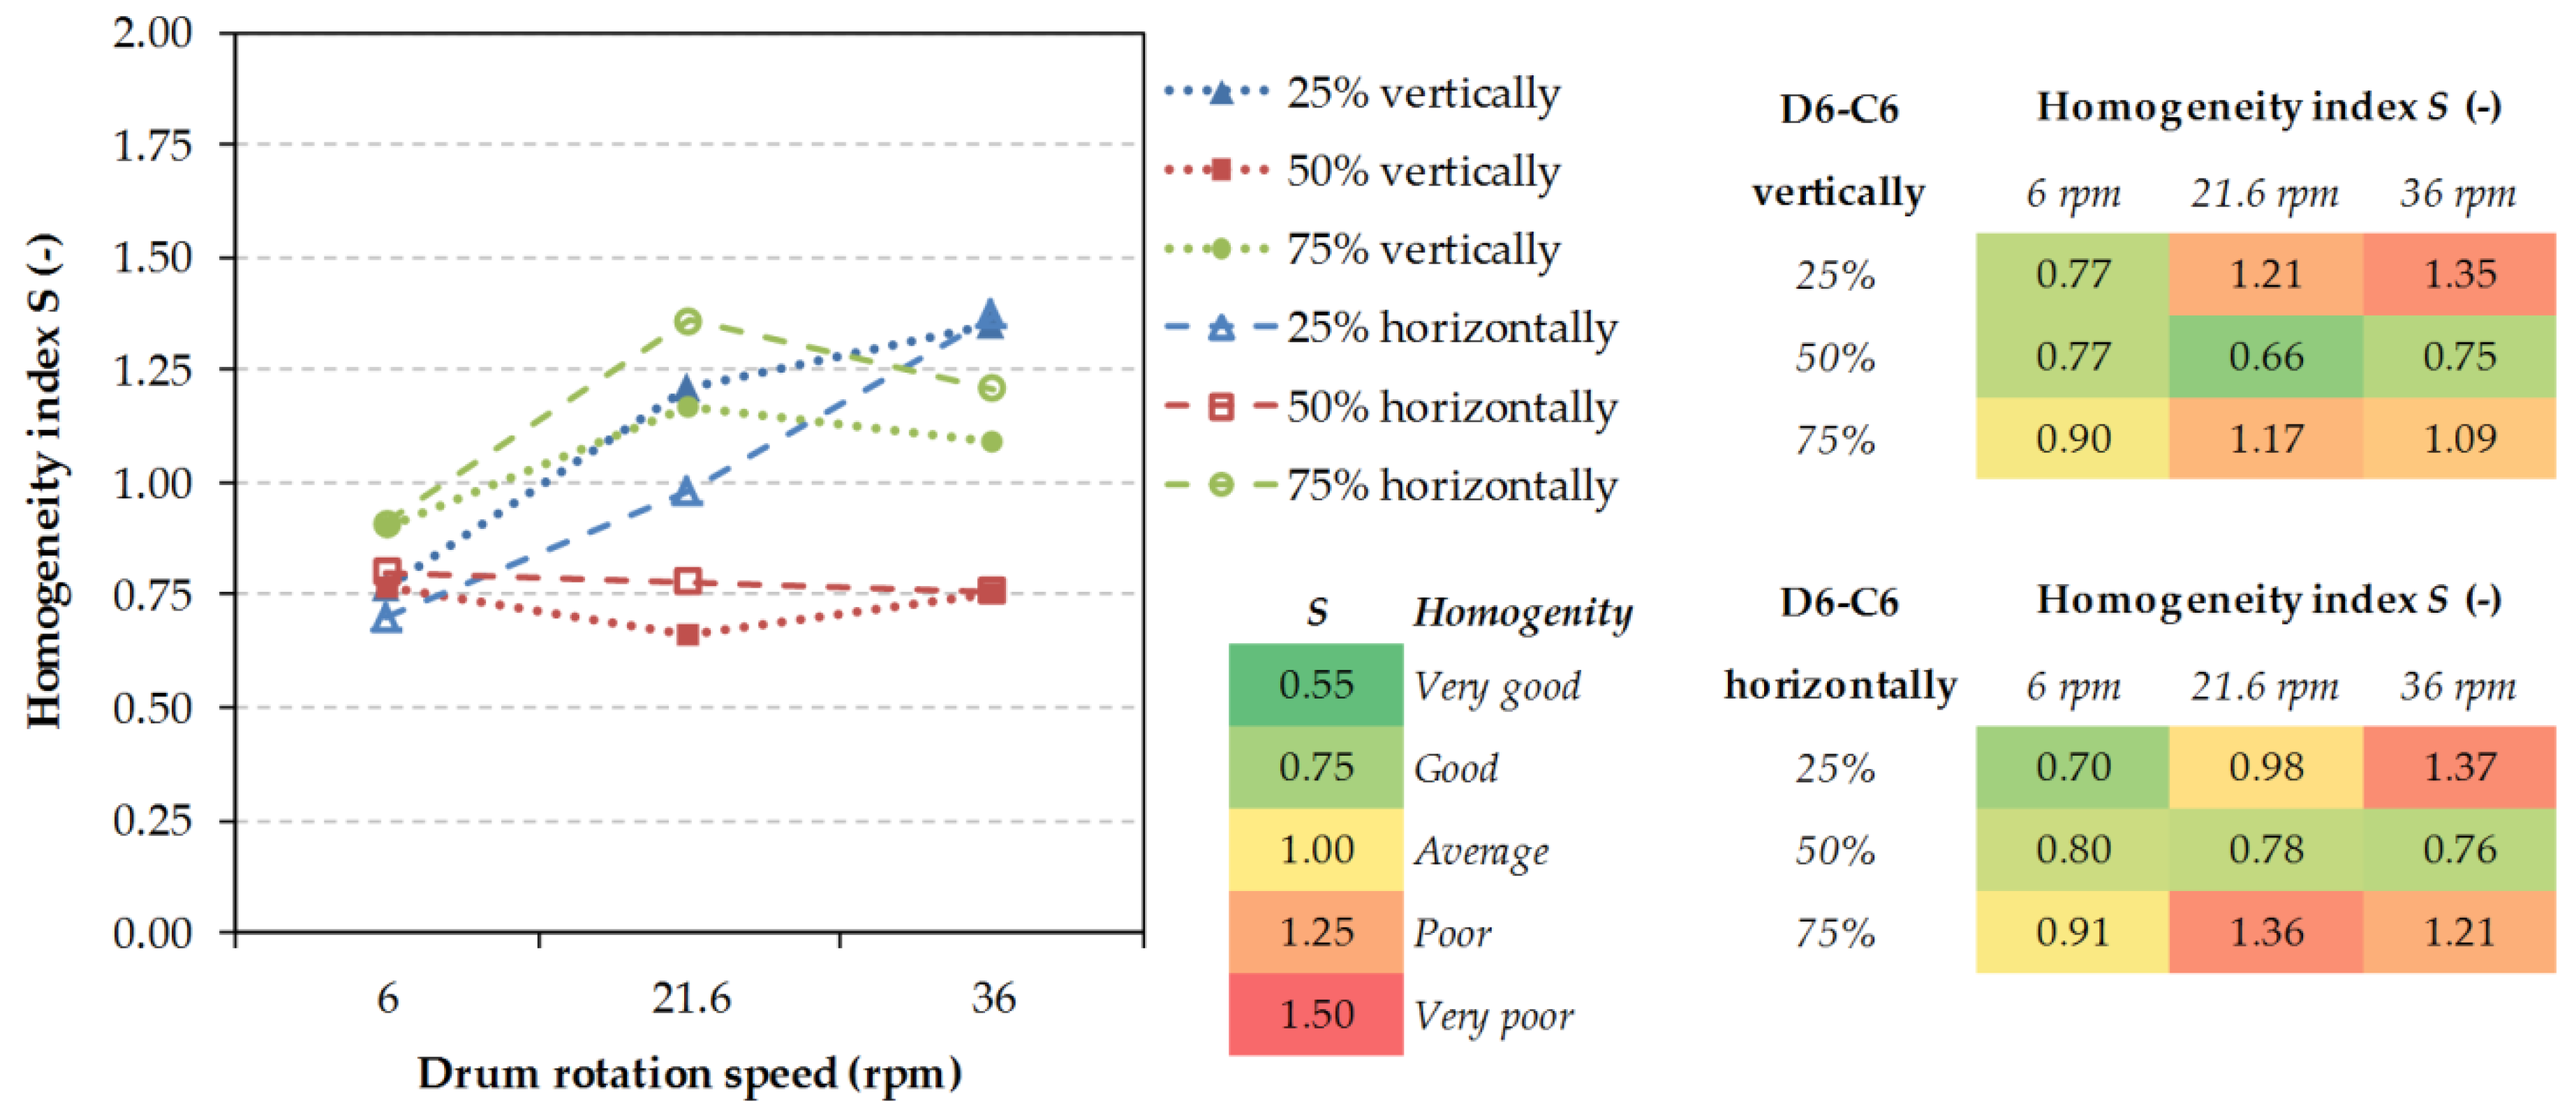
The objective of this study was to compare and evaluate homogenization of seven selected particulate materials in drum mixers. The influence of particle size, shape, and density as well as volumetric filling of the drum, drum rotational speed, and drum filling pattern on the mixing process were examined. First, 126 operating conditions were created combining the materials. Simulation models were validated using 28 experiments. The homogeneity index S was defined, which was consequently used to evaluate the resulting mixture homogeneity. The applicability of the discrete element method for the given drum mixer was tested. The experiments focusing on the repeatability of simulations showed the maximum relative standard deviation of the homogeneity index at 0.6% in ten identical simulations. Seven experimental and simulation series were created for the homogenization of selected particle mixtures. Each series were tested under 18 conditions for sliding (6 rpm), rolling (21.6 rpm), and cascade (36 rpm) material movements in the drum, for volumetric filling-up of the drum at 25, 50, and 75%, and this for the simultaneous (vertical) or gradual (horizontal) method of filling.
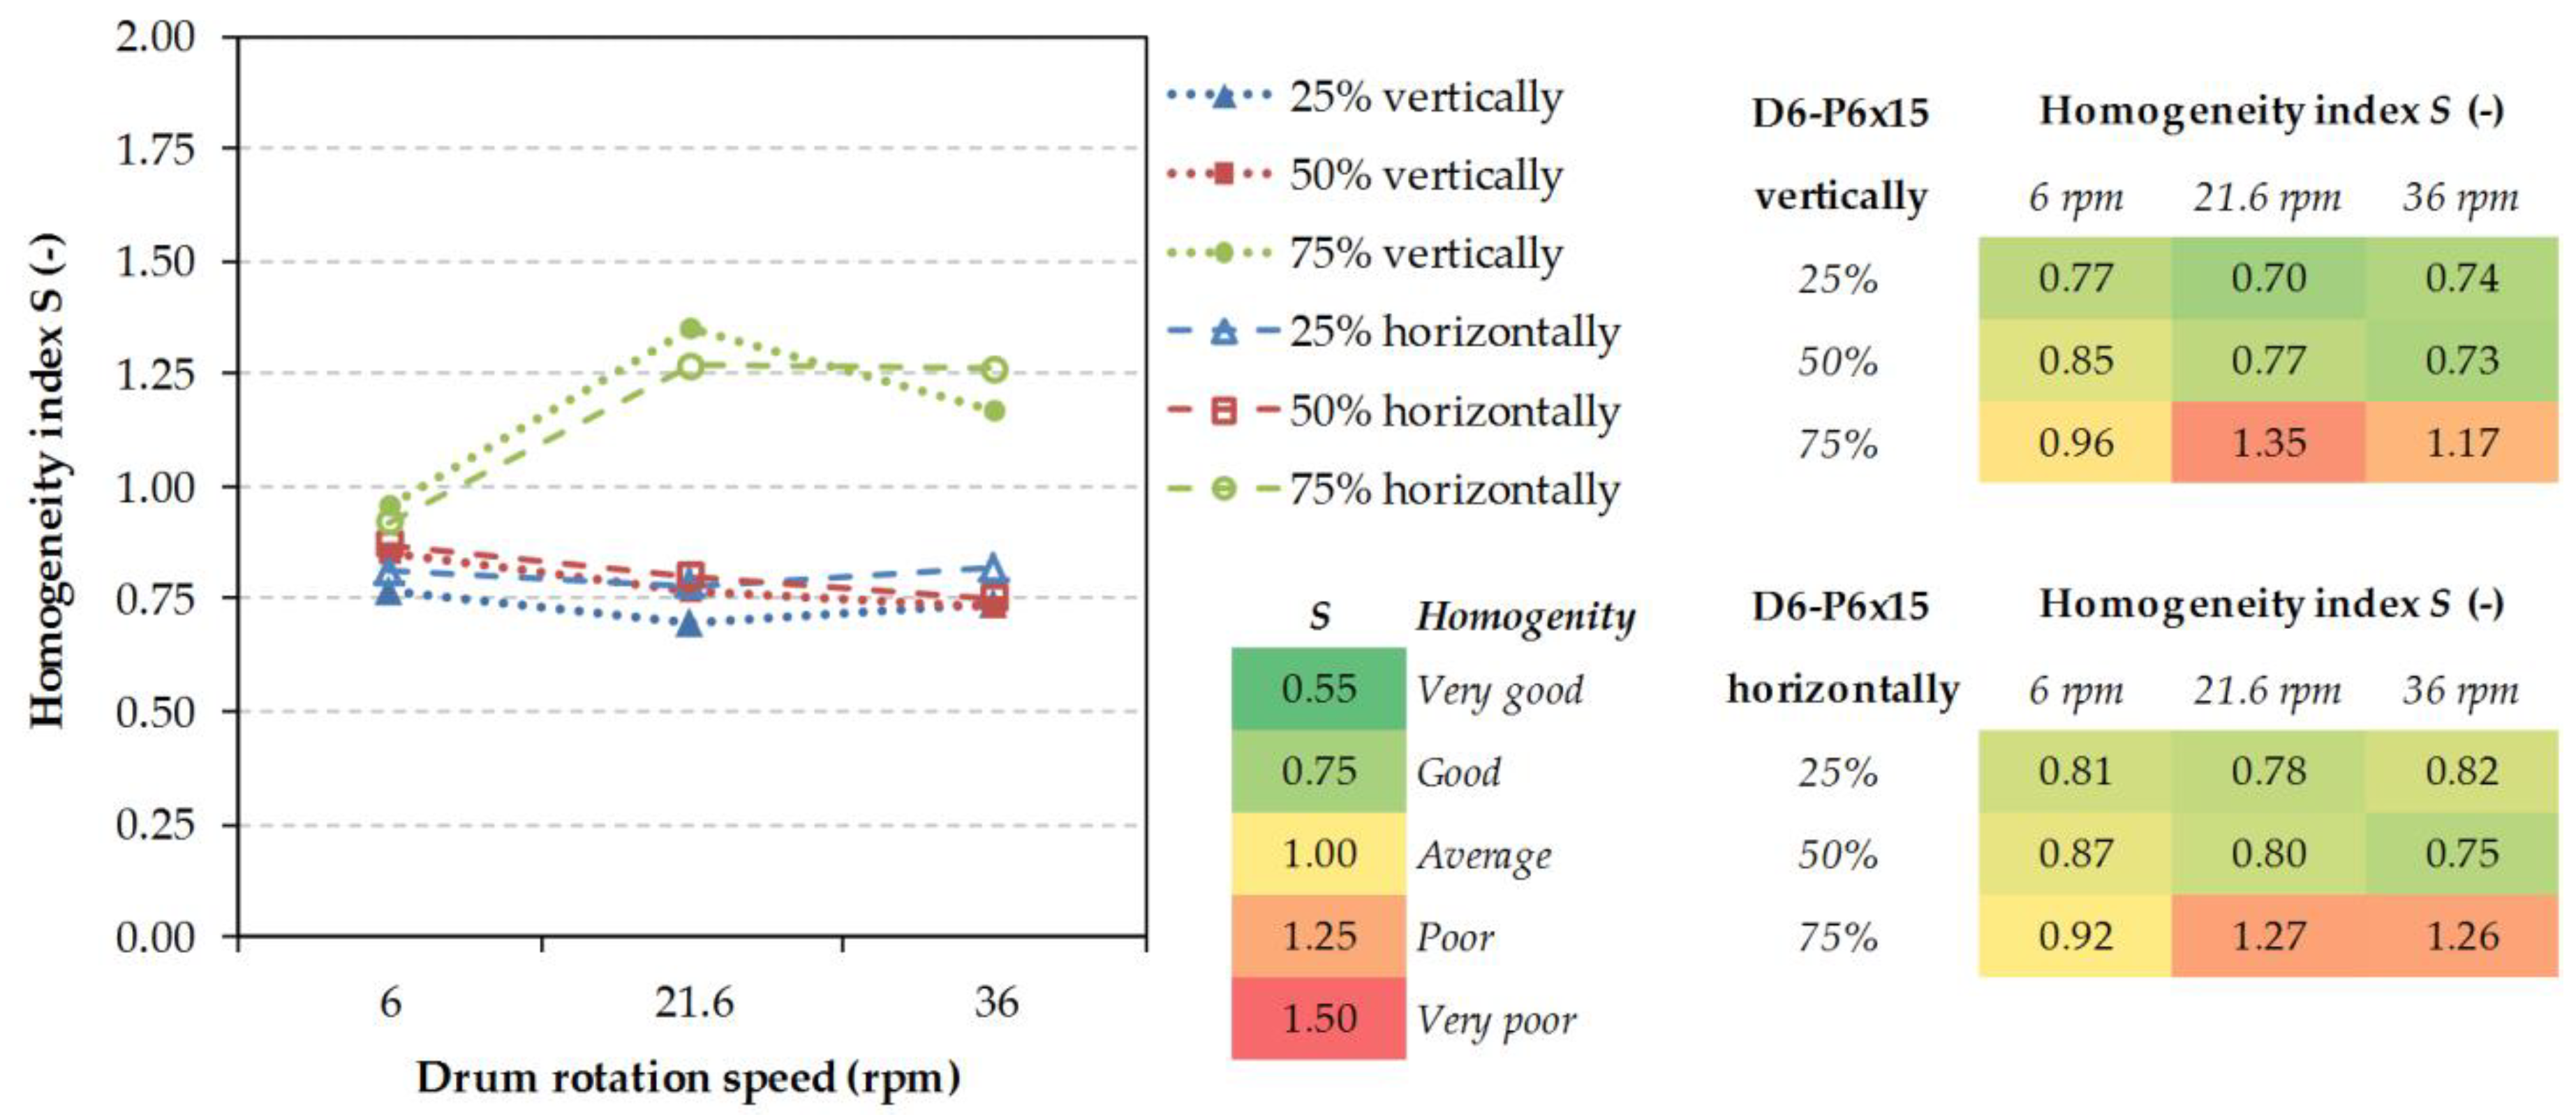
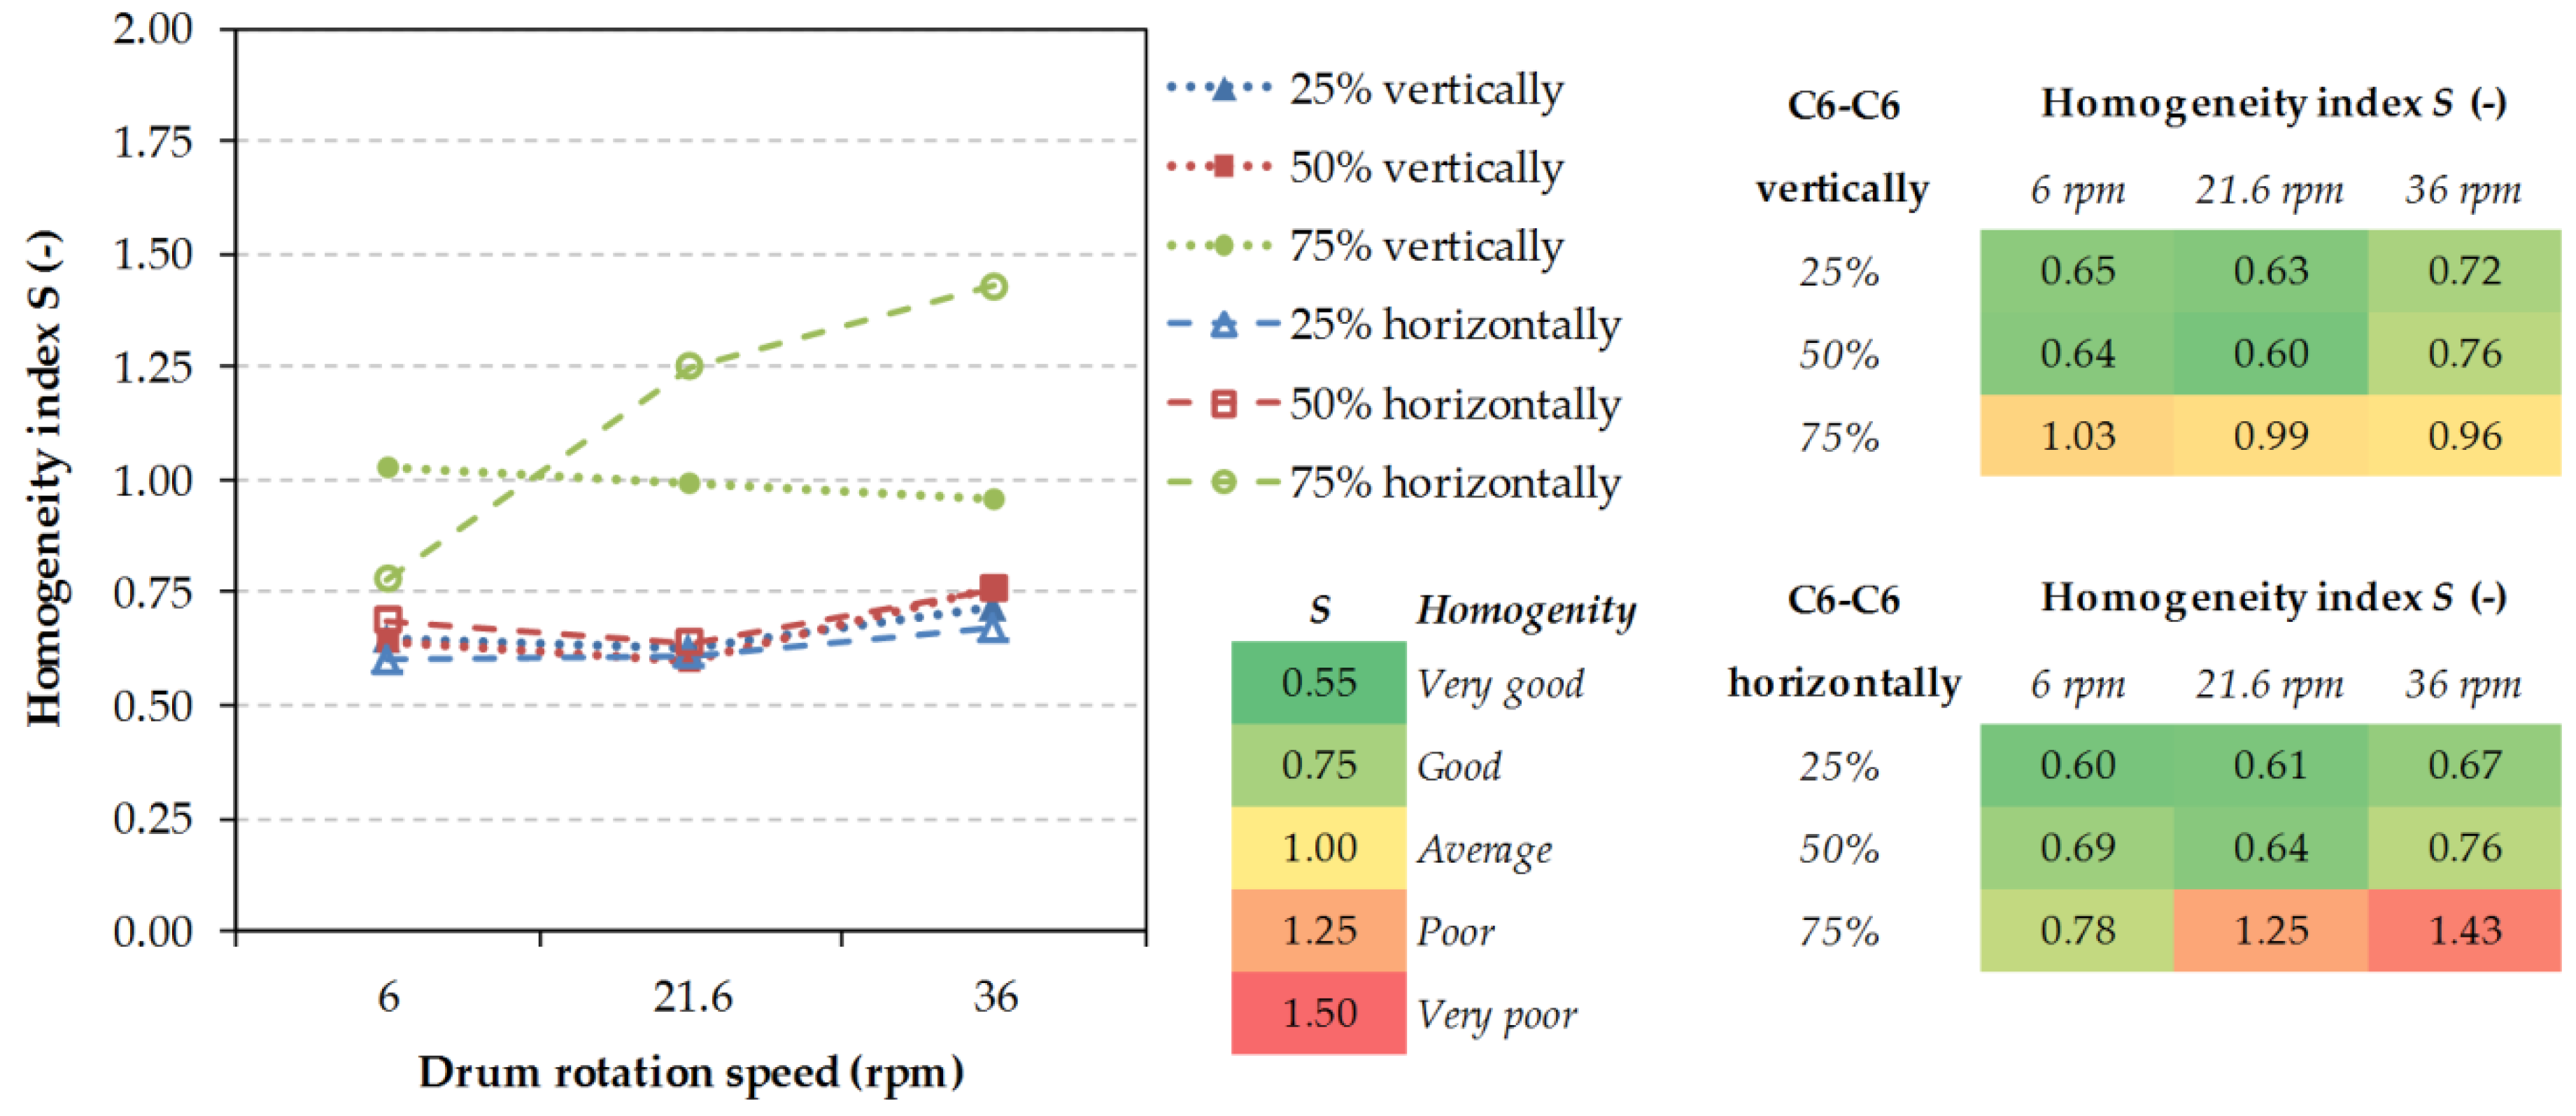
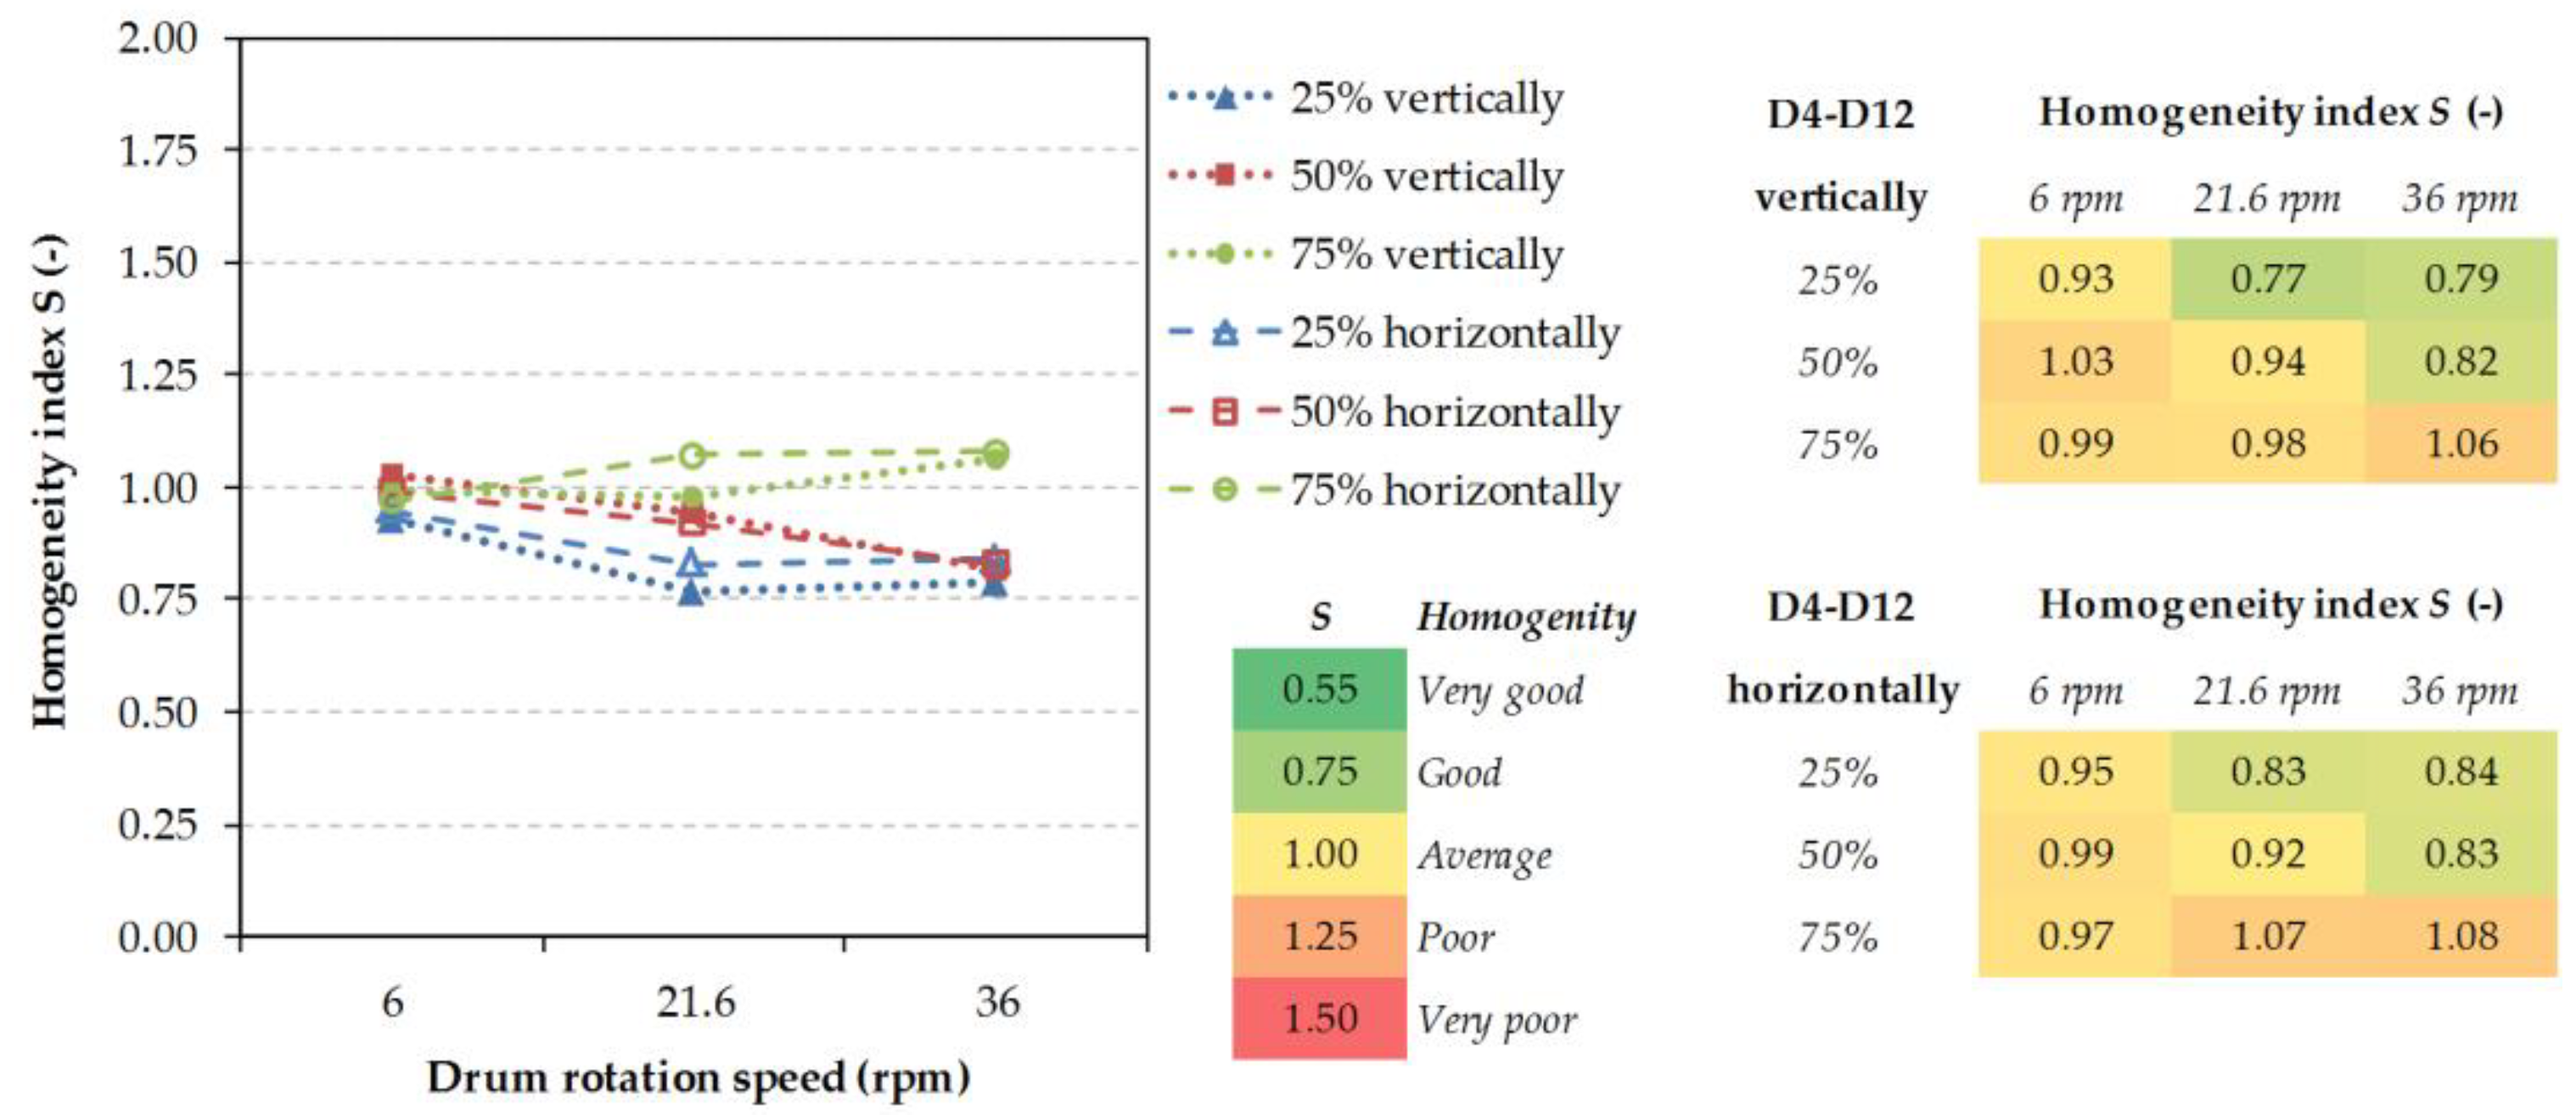
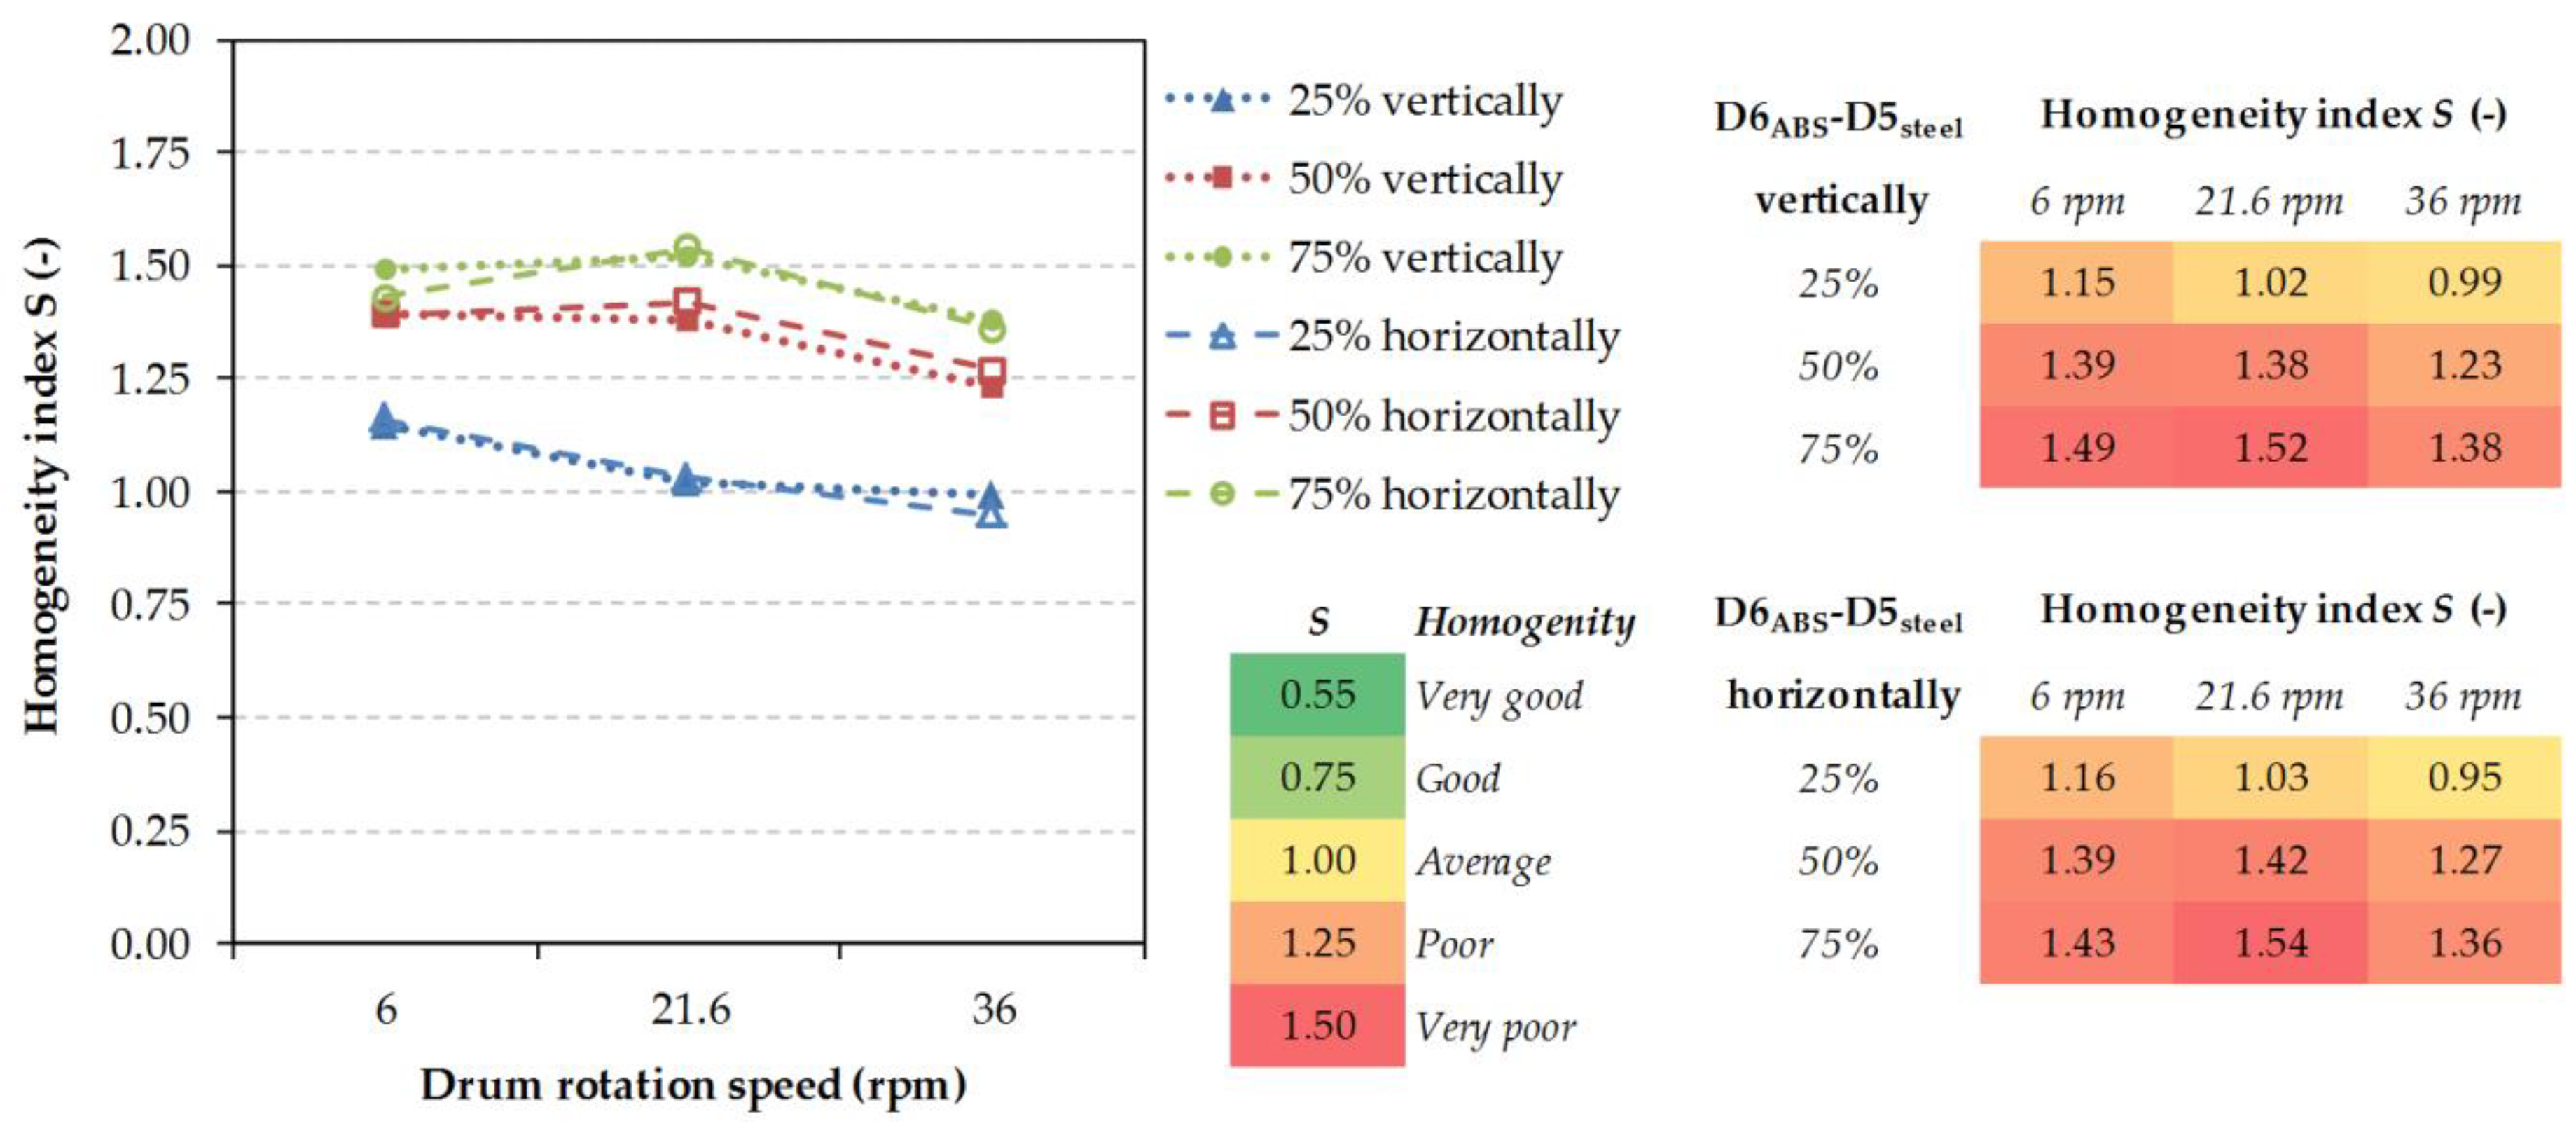
Each subsection contains its own conclusions from concrete measurement series, however it can be claimed that the least satisfactory values of the homogeneity index were achieved in mixing particles of various densities/weights. The segregation on a greater scale revealed itself with these than with the particles of various shapes and sizes. In mixing of 4 mm particles with 12 mm particles only mediocre results were achieved at all operating conditions because of the percolation segregation, where the smaller particles fall through the larger ones. The combination of the D6ABS–D5steel particulate material of various densities/weights showed the highest values of the homogeneity index, even up to S = 1.54. The mixture containing such a combination of particles is immiscible in an ordinary rotary drum. The lowest homogeneity indices were achieved for the mixture formed with the P6 × 15 cylindrical particles. In this combination, the dominating factor was the drum filling-up degree.
In the most cases of 75% filling level non-linearity was observed for different parametric conditions. There is a “homogeneity index minimum” which is always reached at 6 rpm (rolling material movement inside the drum). With increasing rotation speed, the likely segregation mechanisms cause a decrease in the homogeneity index. In higher speeds, the segregation process creates a reverse process to homogenization. In the case of the same sized particles (D6-D6; D6-C6; D6-P6 × 15; C6-C6) 50% filling level seems to be the best setup for the lowest homogeneity index independent of loading pattern. In the case of different sizes and weights/density (D4–D12; D6ABS-D5steel) 25% filling level is better than 50% filling during homogenization process. The special behavior showed “pellet-like” particles P6 × 15 (D6-P6 × 15; P6 × 15-P6 × 15) which are difficult to mix because of their shape. The long shape of particles makes it difficult to change particle position in particles bed volume. Because of this, a lower filling level is needed.
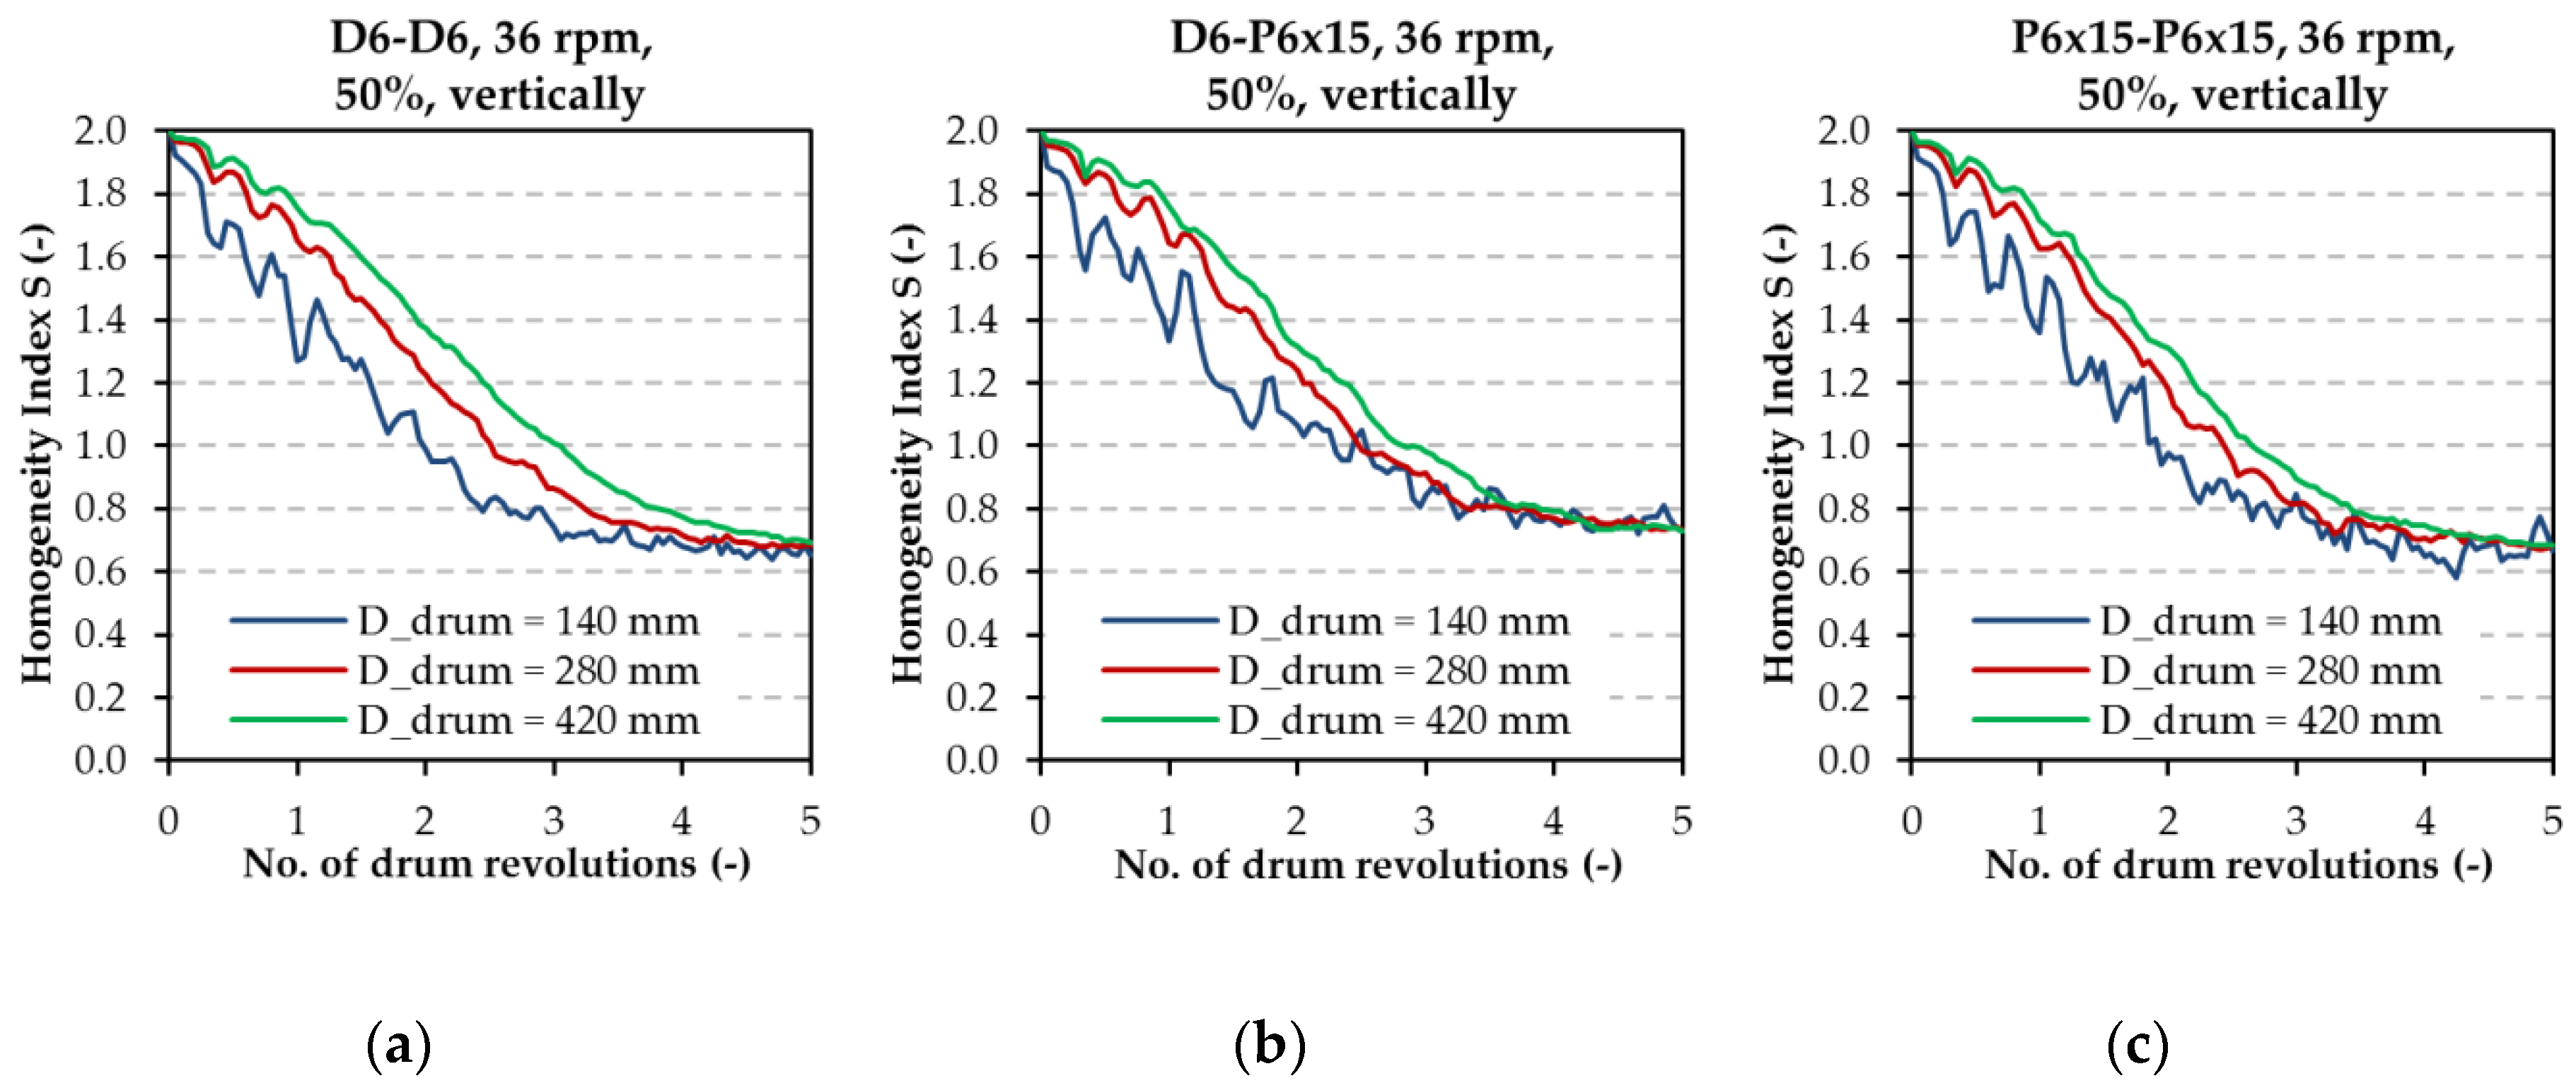
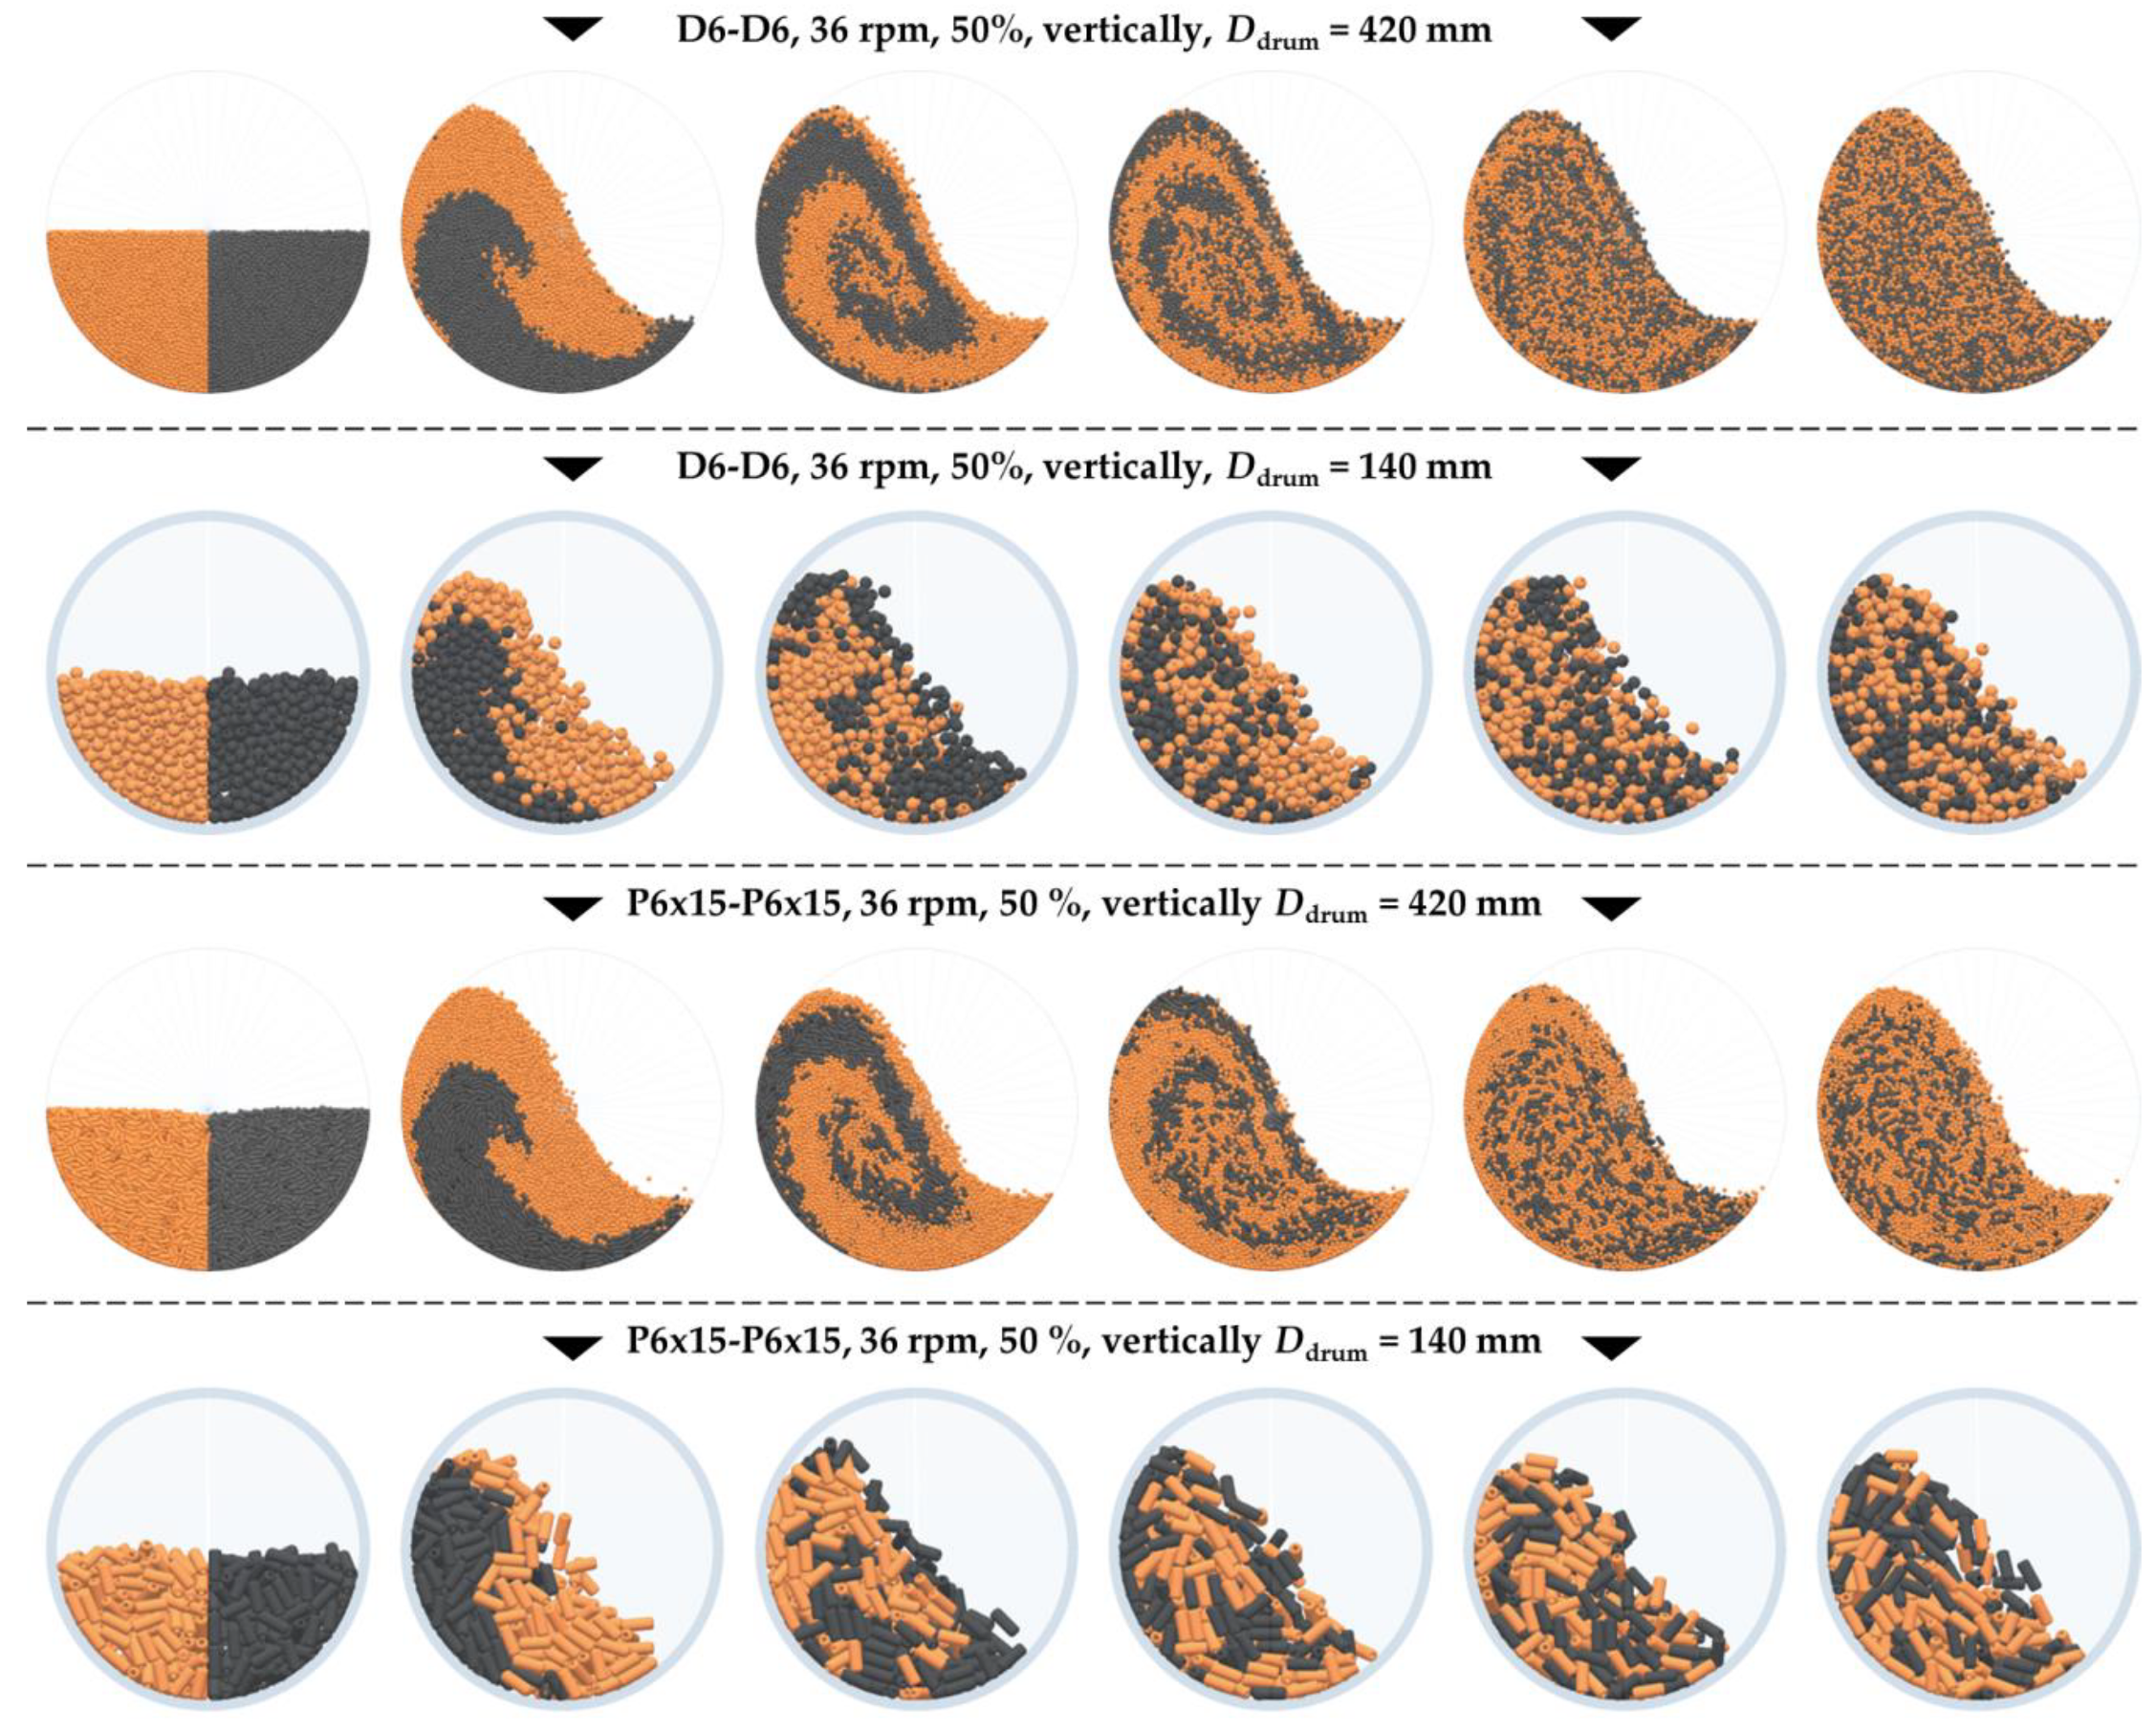
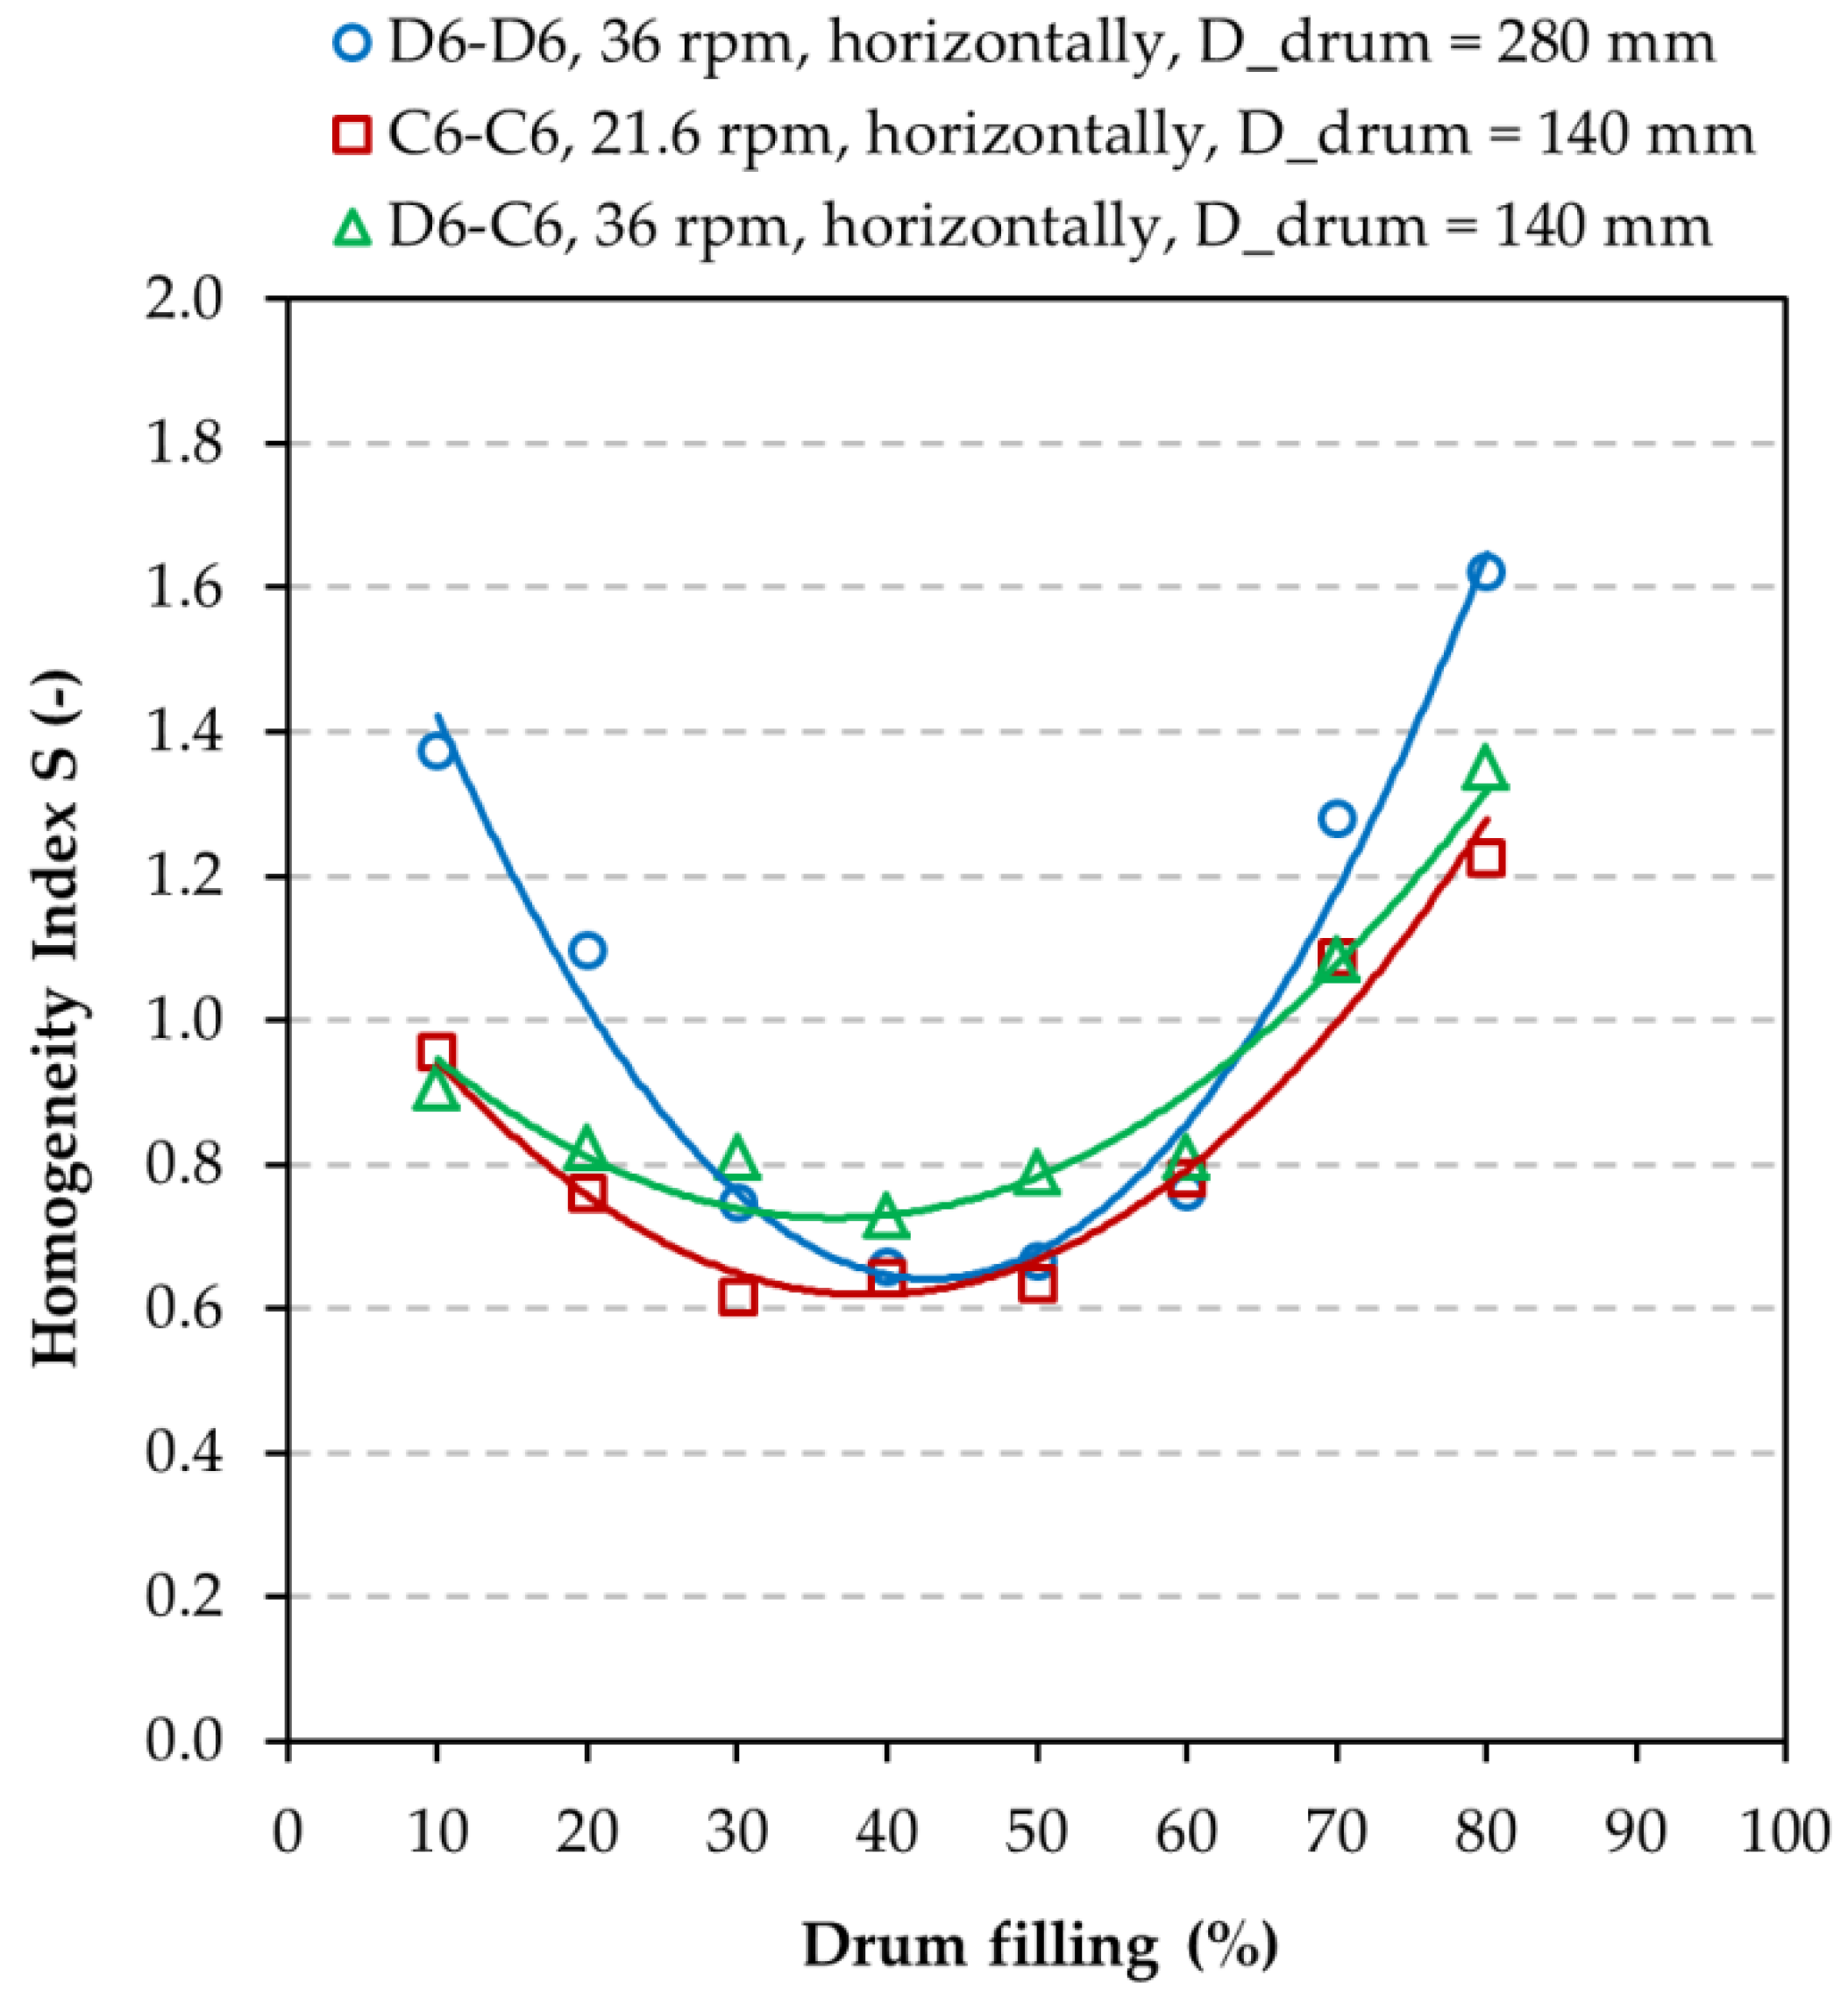
In the study dealing with the influence of the drum/particle ratio very consistent and stable results were obtained. The course of the homogeneity index in 140 mm, 280 mm, and 420 mm drums was very similar and after five revolutions of the drum, identical values of the homogeneity index were achieved for all the drum diameters. These experiments corroborated that the chosen drum diameter (140 mm) for the main experimental part of this study was sufficient and that, on the contrary, also the problems on the industrial scale can be solved assuming the simplification in the form of using larger virtual particles against the real ones. The simulation series focused on the influence of the volumetric drum filling-up on the homogenization process and illustrated the fact that the optimum degree of the drum filling is at 40–50% for the spherical particles and 30–40% for the sharp-edged particles. It can be claimed that the designed DEM model provides a possibility of detailed analyses of the mixing process in a rotary drum. Using DEM simulations and assuming an exact calibration of the model, it is possible to predict changes in the mixing process not only because of material properties (shape, size, density), but also because of process/operating conditions, such as the filling-up degree, mixing frequency, or filling method for various types of homogenizers in the industrial practice.


