Article

Spatial Life Cycle Analysis of Soybean-Based Biodiesel Production in Indiana, USA Using Process Modeling

by
Venkata Sai Gargeya Vunnava
1 and
Shweta Singh
1,2,*
1
Department of Agricultural and Biological Engineering, Purdue University, West Lafayette 47907, IN, USA
2
Division of Environmental and Ecological Engineering, Purdue University, West Lafayette 47907, IN, USA
*
Author to whom correspondence should be addressed.
Processes 2020, 8(4), 392; https://doi.org/10.3390/pr8040392
Submission received: 31 December 2019 / Revised: 28 February 2020 / Accepted: 19 March 2020 / Published: 27 March 2020
(This article belongs to the Special Issue Bioenergy Systems, Material Management, and Sustainability)

Abstract

:
Life Cycle Analysis (LCA) has long been utilized for decision making about the sustainability of products. LCA provides information about the total emissions generated for a given functional unit of a product, which is utilized by industries or consumers for comparing two products with regards to environmental performance. However, many existing LCAs utilize data that is representative of an average system with regards to life cycle stage, thus providing an aggregate picture. It has been shown that regional variation may lead to large variation in the environmental impacts of a product, specifically dealing with energy consumption, related emissions and resource consumptions. Hence, improving the reliability of LCA results for decision making with regards to environmental performance needs regional models to be incorporated for building a life cycle inventory that is representative of the origin of products from a certain region. In this work, we present the integration of regionalized data from process systems models and other sources to build regional LCA models and quantify the spatial variations per unit of biodiesel produced in the state of Indiana for environmental impact. In order to include regional variation, we have incorporated information about plant capacity for producing biodiesel from North and Central Indiana. The LCA model built is a cradle-to-gate. Once the region-specific models are built, the data were utilized in SimaPro to integrate with upstream processes to perform a life cycle impact assessment (LCIA). We report the results per liter of biodiesel from northern and central Indiana facilities in this work. The impact categories studied were global warming potential (kg CO2 eq) and freshwater eutrophication (kg P eq). While there were a lot of variations at individual county level, both regions had a similar global warming potential impact and the northern region had relatively lower eutrophication impacts.

1. Introduction

Life cycle assessment (LCA) models are widely used to assess the sustainability of bio-based energy or material production. These models are developed to quantify the environmental, societal, and/or economic impact of production systems [1]. While several LCA studies have highlighted the positive impacts of a shift to bio-based production, it has also been shown that a shift to bio-based energy or products leads to a “food vs. fuel” debate and also exacerbates the environmental challenges due to the Land Use and Land Use Change (LULUC) associated with bioenergy crops [2]. LCA studies have shown that biofuels from different cropping systems producing ethanol or biodiesel can reduce greenhouse gas emissions and non-renewable energy production, and increase other impacts such as eutrophication and acidification related to nitrogen release [3]. Thus, the choice of agricultural system and management has significant impact on the sustainability aspect of bio-based energy or products [4]. In their study, Qin et al. (2018), show that changing land management practices, such as reducing tillage intensity, can change the life cycle emissions for ethanol production significantly. Other studies have also shown similar results, highlighting how regional practices on agricultural systems result in significantly different life cycle emissions. Soybean-based biodiesel was shown to have 70% lower Green House Gas (GHG) emission if land use change impact in Argentina was not considered [5], highlighting the role of the regional sourcing of feedstock in accounting for true life cycle emissions. A 2018 study focused on the life cycle emissions of soybean-based biodiesel produced in the US, using a national average for farming practices and the pathway of soy-oil to biodiesel conversion through transesterification [6]. This study also found that soybean biodiesel significantly reduces GHG and nonrenewable energy consumption, however, accounting for LUC can result in additional GHG emissions. The comparison of sugarcane-based ethanol production in India and Brazil shows that Indian ethanol had lower impact, highlighting that the same product originating in different location can have different environmental impact [7]. Thus, it is important to account for regional variations and farm activities to improve the reliability of the life cycle environmental impacts of producing bioenergy. If the regional activity includes the clearing of tropical forests, the life cycle GHG can be worse than conventional diesel, as was the case for Brazilian soybean-based biodiesel production [8]. Further, whether the soybean is processed within a region to produce soybean biodiesel or imported as final product also has an impact on total life cycle impact, as was found in a study on soybean diesel being used in Europe from soybean grown in Brazil [9]. In this study, it was found that cultivation and transportation played an important role. Through several studies, it has been established that regional cultivation practices [10] and processing pathways play an important role in truly estimating the sustainability of bio-based energy or products.
Following this lead of variations in impact from regional practices, there has been a growing interest in incorporating spatially explicit information in LCA studies. To incorporate regional information in the calculation of life cycle emissions for bio-based products, methods like GIS [11] and detailed mechanistic models [12], or spatial land use models [13] for capturing the variations, are being increasingly used. Utilizing mechanistic model of DNDC Tabatabaie et al. [12] demonstrated the variations in life cycle emissions for biodiesel produced in Orgeon, USA as a result of temperature variation and soil organic carbon. Spatial models of LUC have been combined to show the impact on life cycle emissions from 1st generation biofuels in the European Union [13]. Another study focused on the Southwestern Michigan region and simulated the production of three different types of feedstock for corn–ethanol production in different watersheds using an EPIC model [14]. This study found the impact of feedstock type to be more prominent than the region where the second-generation feedstock was being cultivated.
While these studies have incorporated the impact of variations in feedstock growing stage, these studies have not accounted for the regional variations in the processing of the feedstock. Processing variations can have significant variation in life cycle emissions, as these form a significant step in the conversion to final product. Studies have shown that the size and capacity of power plants using biomass also impact the environmental impacts of products from these plants [15]. A critical review on integrating the spatial dimensions in LCA studies highlights that process recontextualization for a particular region should be adopted in order to develop regional life cycle inventories [16]. Hence, for spatial LCAs, utilizing process modeling for capturing the impact of variations in processing of biomass feedstock can contribute significantly to improving the representativeness of results for that region. However, such studies have not been widely done, mainly due to the lack of enough information about regional processing plants and for confidentiality reasons. In this work, we address this specific gap in the literature for soybean-based bio-diesel production. The focus of our work is on capturing the variation within a state. As it has been shown that different parts of states can experience huge variations in agricultural practices owing to soil quality changes or farm size, etc., this causes variations in the processing of feedstock as well. Further, the size and type of processing plant can also result in variation in life cycle emissions. To capture this effect, we focus on soybean-based biodiesel production in northern and central Indiana. A regionalized life cycle inventory is built on the farming, transportation and processing life cycle stages for the two regions. For capturing upstream life cycle stages, average data from SimaPro have been utilized. Results are presented for a functional unit of 1 L of soybean biodiesel produced in north and central Indiana. The rest of the paper is organized as follows: Section 2 presents the methodology for LCA system boundary selection, building-regionalized LCI, and the LCIA method utilized. Section 3 provides details on the spatial allocation of impacts and Section 4 presents results and analysis for variations in life cycle impacts for biodiesel from Northern vs. Central IN. Section 5 presents the conclusions of the study.

2. Materials and Methods

A cradle-to-gate process LCA methodology has been followed here using standard International Organization for Standards (ISO) practices. The first step involved identifying the soybean-based biodiesel production system in Indiana. The cradle-to-gate boundary includes all upstream processes required for the production of biodiesel up to the point of biodiesel output. Figure 1A,B shows the system boundary for the production of biodiesel in north and central Indiana. Once the system boundary was selected, a regionalized life cycle inventory (LCI) was built. In this case, the regionalization accounted only for the life cycle stages of farming, transportation and biodiesel processing. Upstream processes were modeled using unit process information from SimaPro, hence the upstream processes represent average production. Final LCA results were obtained using the TRACI 2.1 (US version) LCIA method and analyzed for global warming potential and eutrophication impact categories. The base year of analysis was 2013 and results have been normalized for per-liter biodiesel production for comparative analysis between the life cycle impacts of biodiesel from north vs. central Indiana.

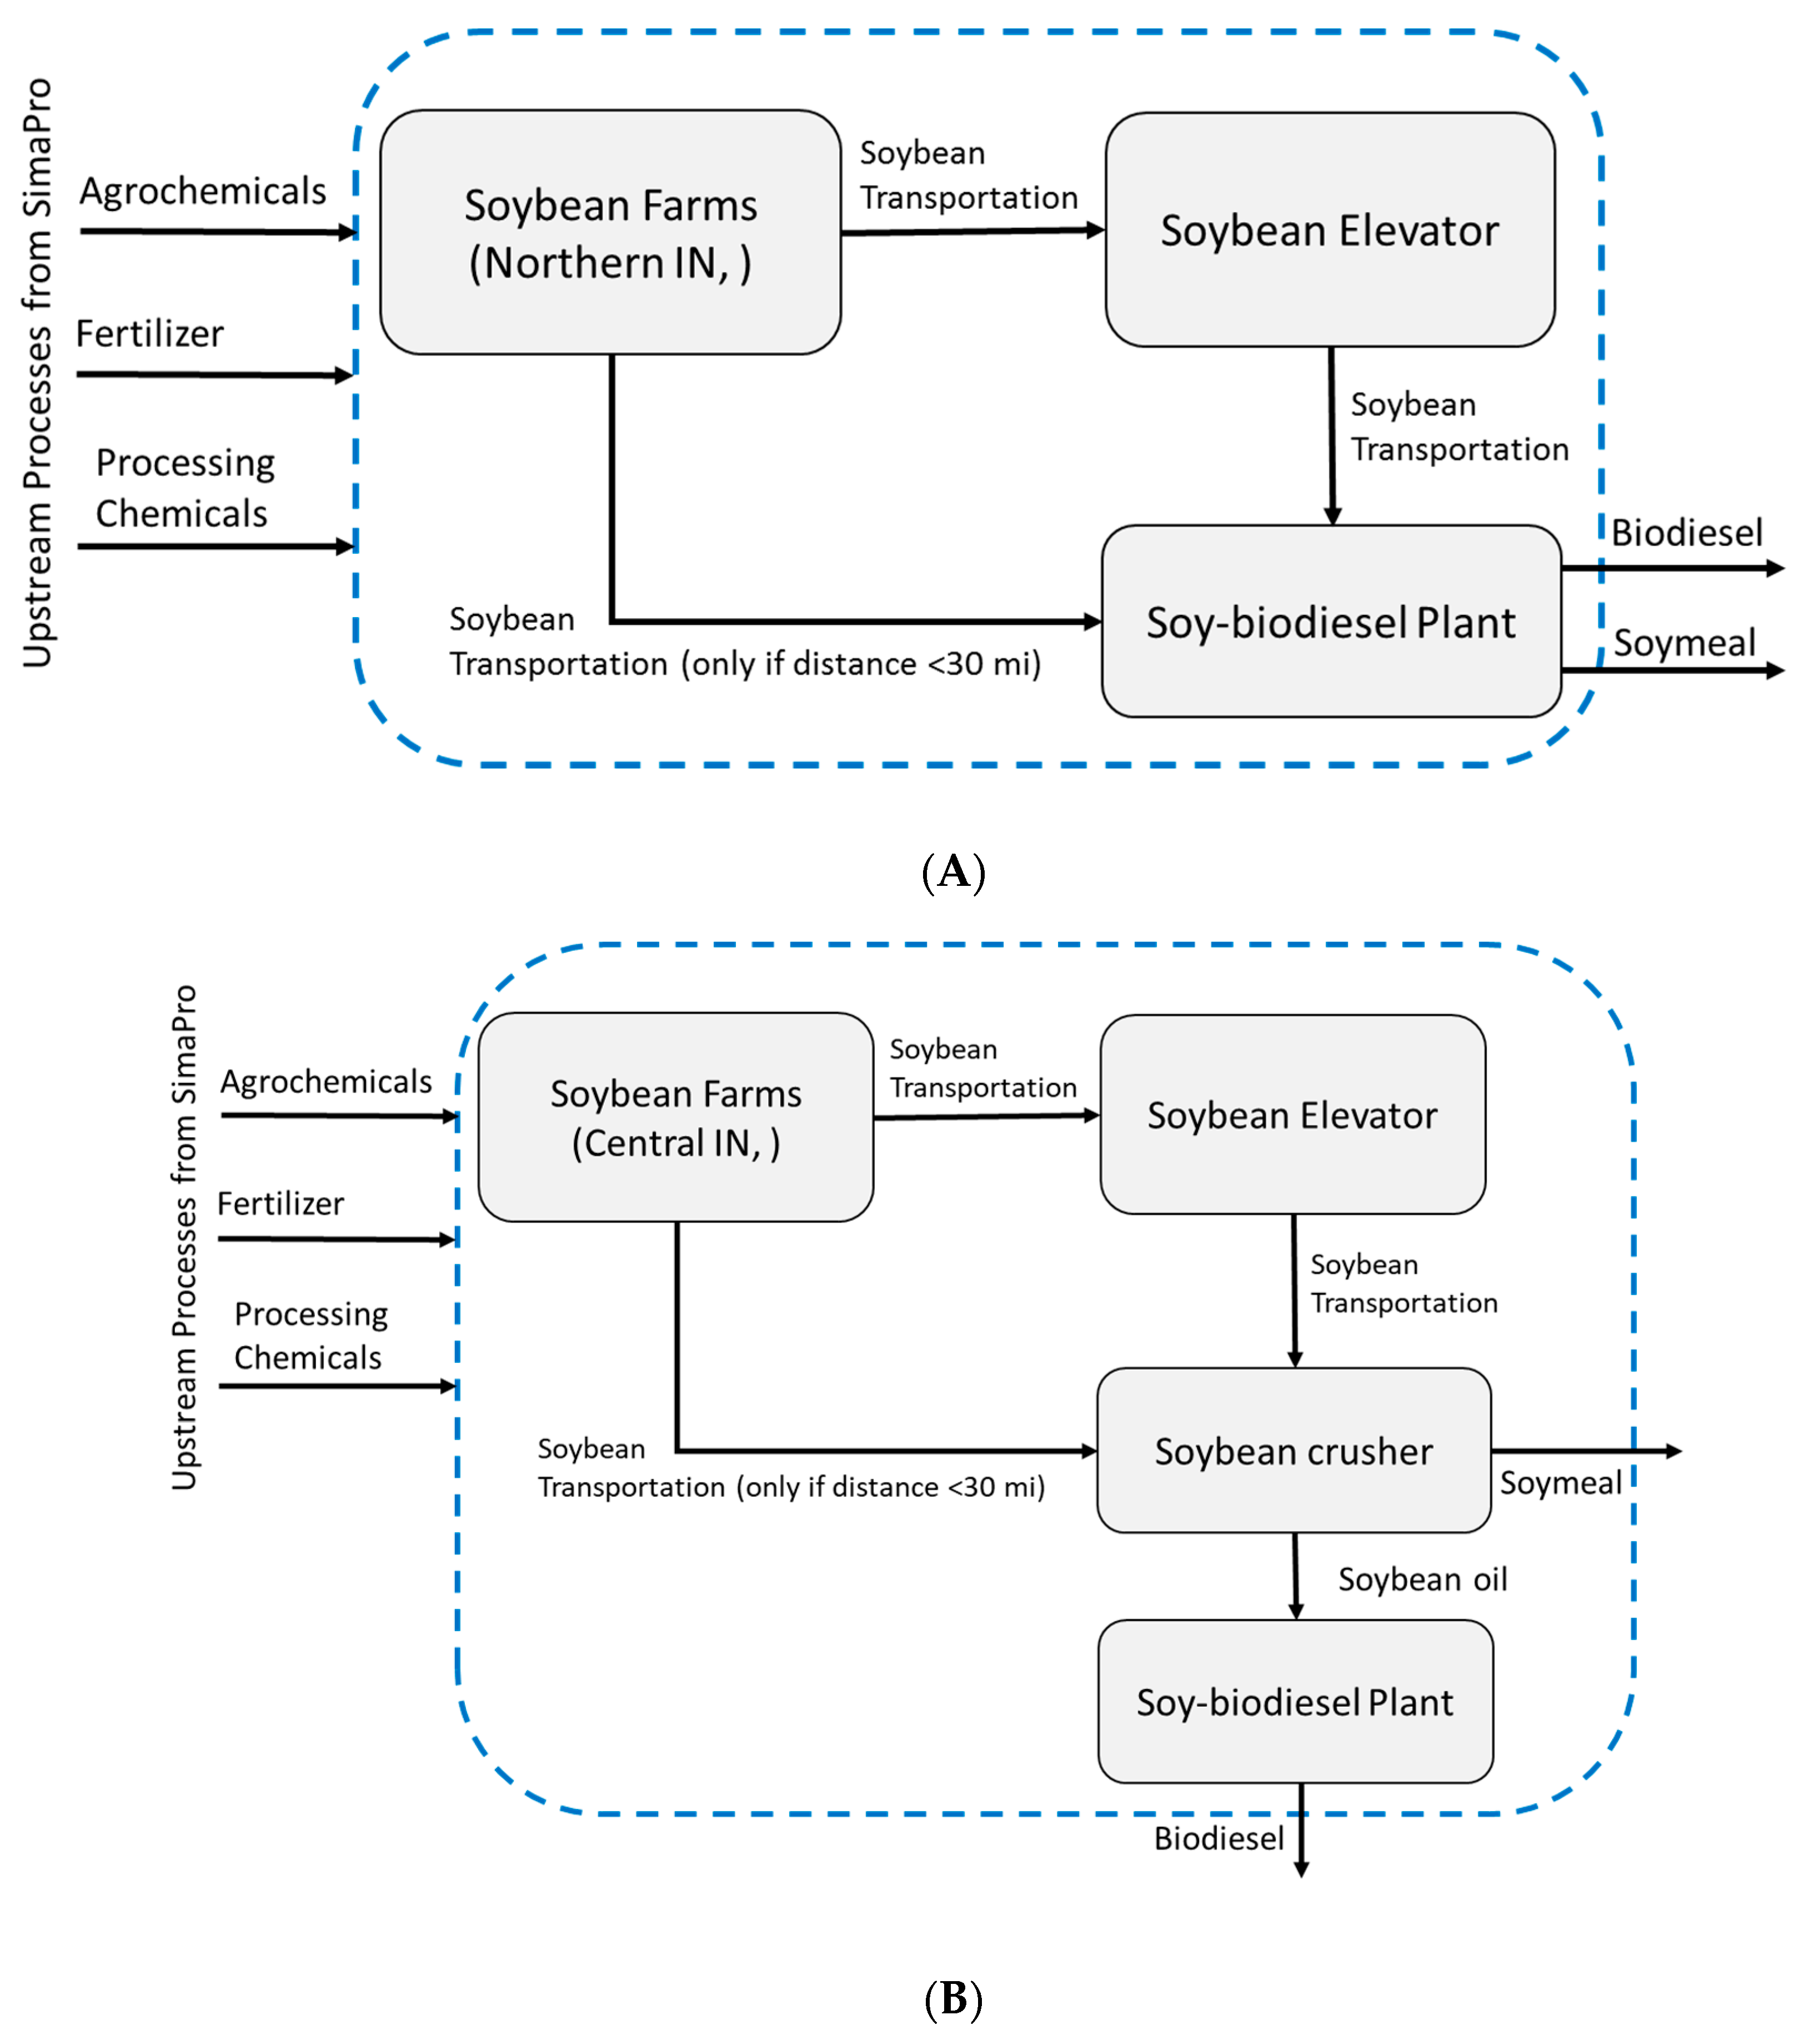
2.1. System and System Boundary

Indiana is a major producer of soybean in US and ranks among the top five producers (about 7% of total soybean produced in the USA [17]. US Energy Information Agency (EIA) provides a detailed, state-level biodiesel production capacity information for several years [18]. Table 1 shows the production processes for biodiesel in Indiana along with the feedstock type. In 2013, two biodiesel plants were active. The plant in northern Indiana utilizes soybean as feedstock and the facility has full soybean-to-biodiesel production process infrastructure. The plant in central Indiana utilizes soy-oil from a dedicated soy-oil producer to make biodiesel. This difference in biodiesel production process from these plant location leads to different system boundaries in performing LCA for biodiesel obtained from different locations. Hence, to quantify these differences, we chose two different system boundaries for biodiesel production in IN. Figure 1A and 1B show the cradle-to-gate system boundary for soybean-based biodiesel produced in northern and central IN.

2.2. Regional Life Cycle Inventory for Biodiesel from Soybean in Indiana

After identifying the system boundaries and pertinent life cycle stages for the life cycle of biodiesel production in northern and central Indiana, regional life cycle inventories were built as described below.

2.3. Soybean Farming

The life cycle stage of soybean farming for producing biodiesel in Northern and Central IN have differences in farm operations and resource consumption. Hence, the data for soybean yield, land used, water applied, and fertilizer applied to soybean fields, in 2013, for Indiana counties, were collected from the United States Department of Agriculture (USDA) and National Agriculture Statistics Service (NASS) [17]. The emissions from the soybean farms were calculated based on the Conservation Effects Assessment Project by Natural Resources Conservation Service [19]. Spatial data for farming stage were collected/calculated (shown in supplementary material along with calculation methods) for each northern and central Indiana county that grows soybeans. This dataset includes spatial variation in land harvested, fertilizer usage, land irrigated, water usage based on irrigation practices, yield and production and Nitrogen/phosphorus emissions. Aggregated data are shown in Table 2.

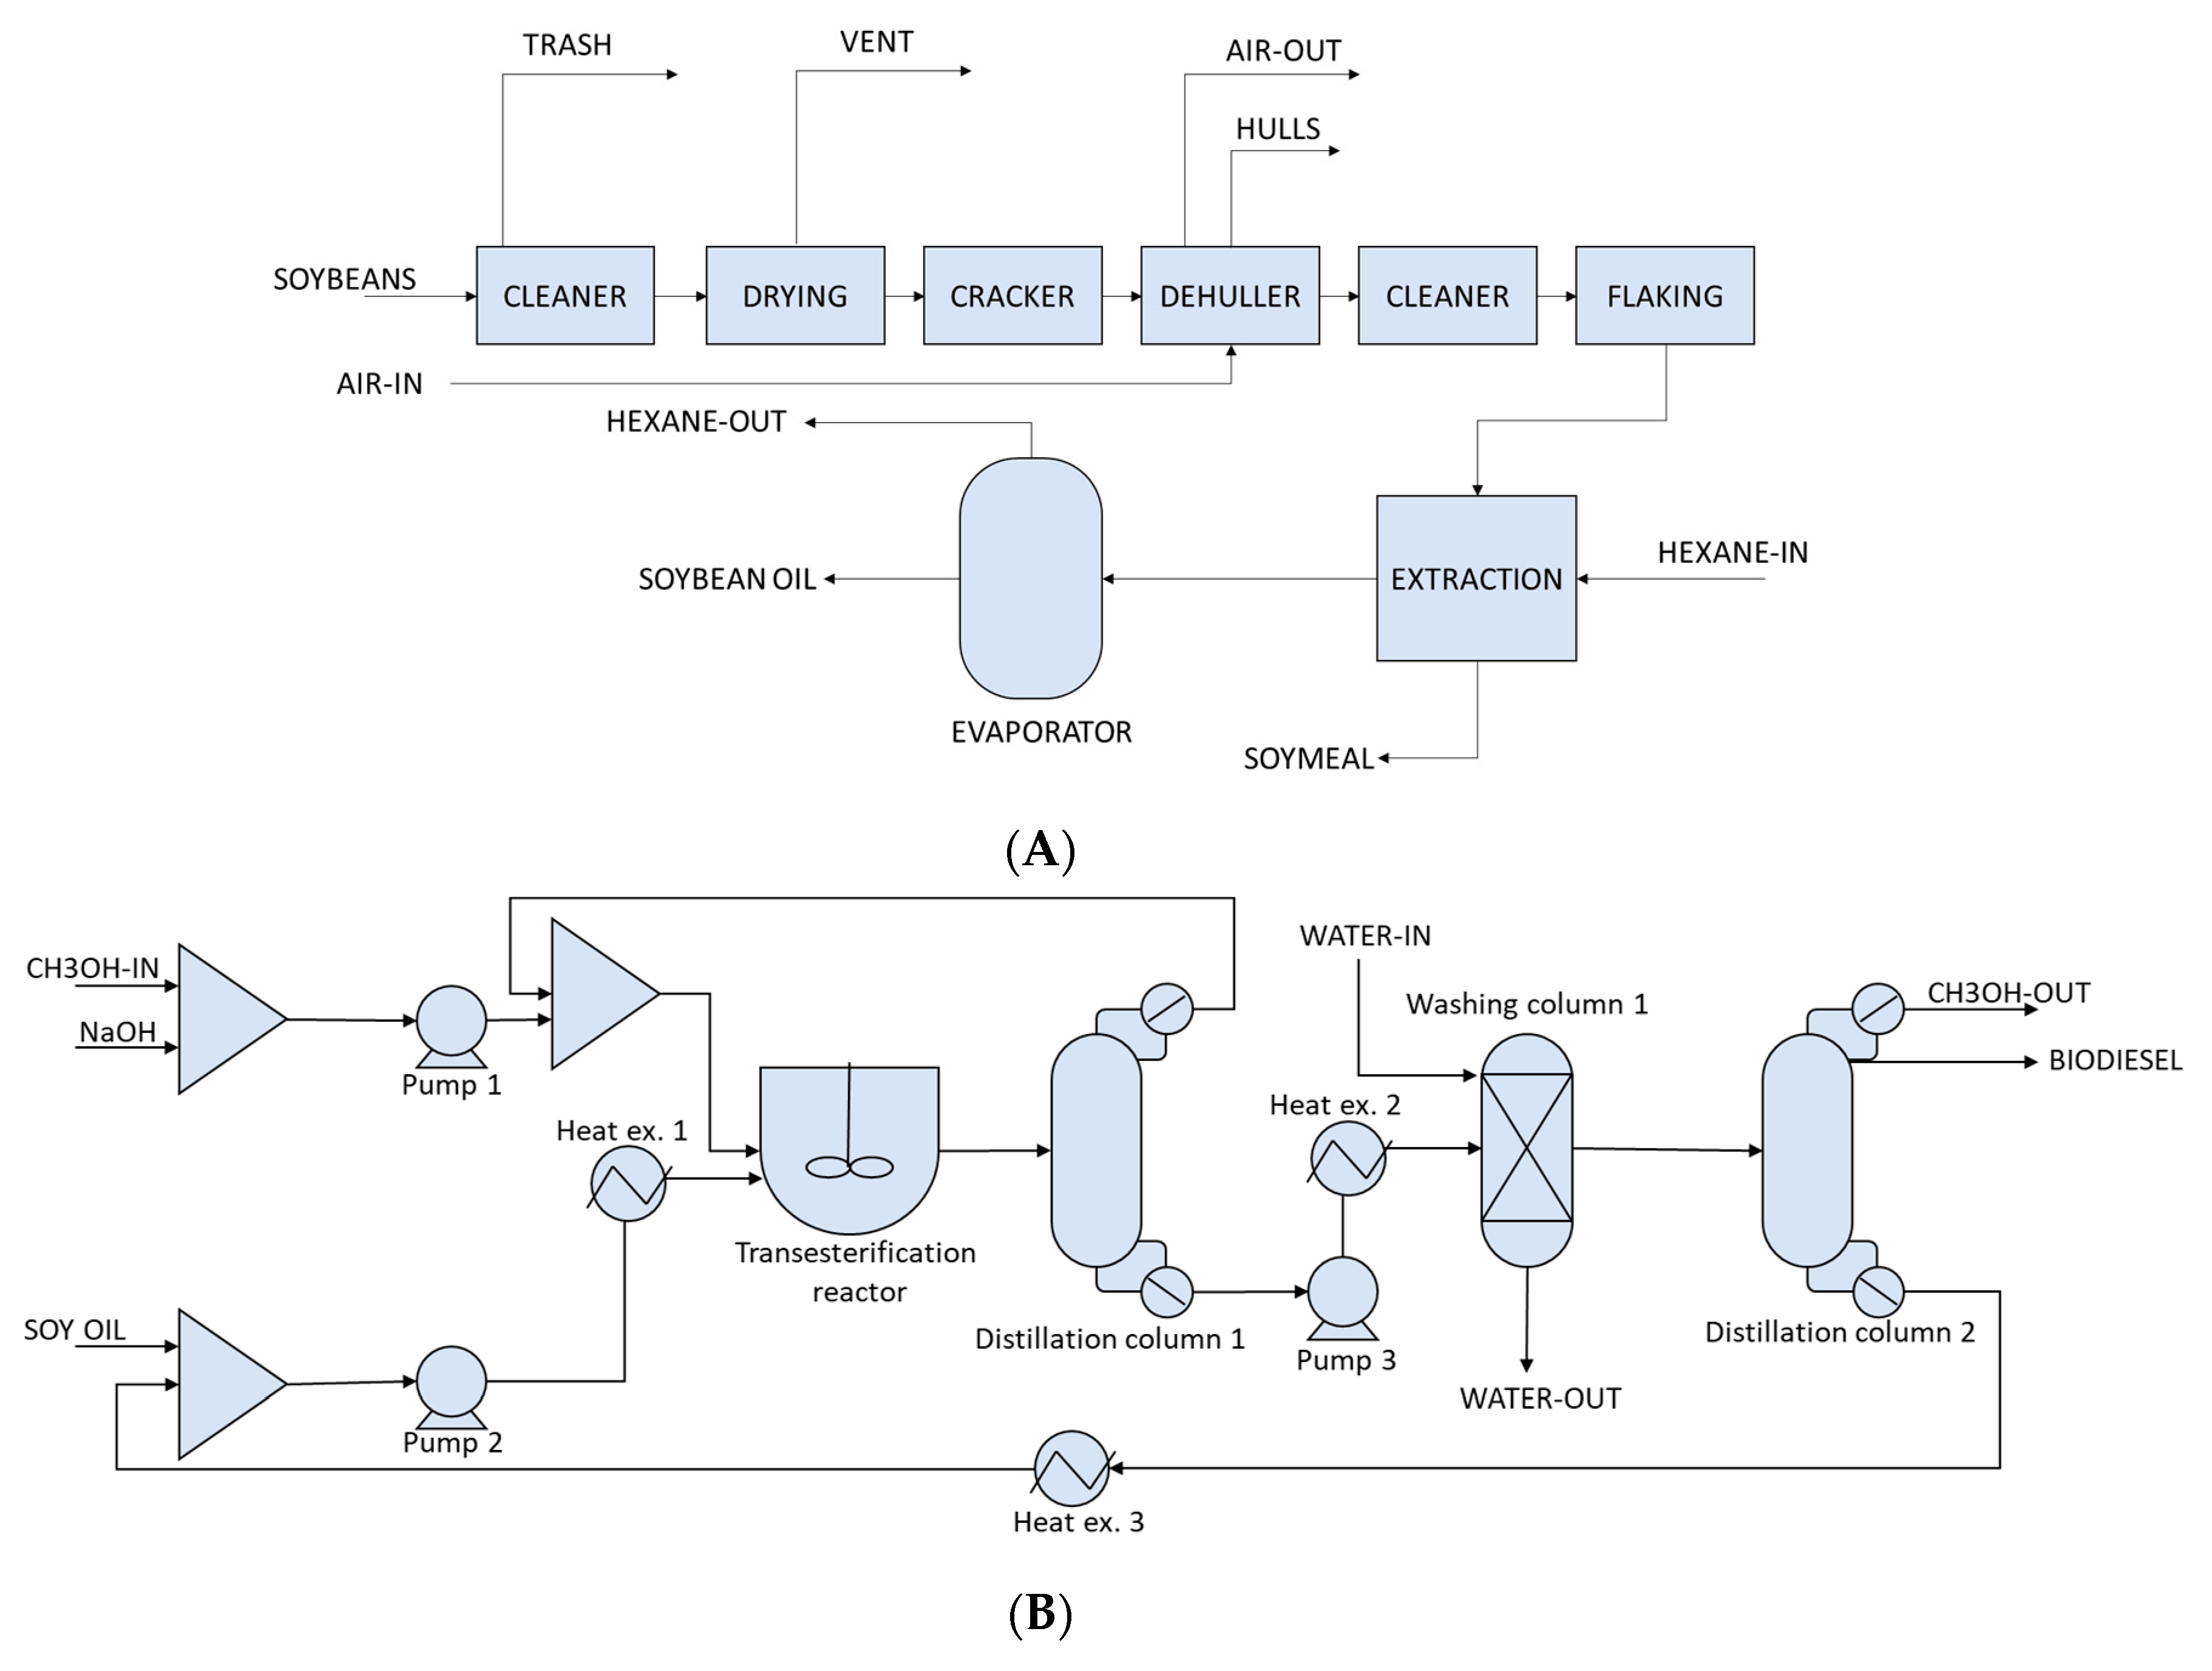
2.4. Soybean Biodiesel Production

For the life cycle stage of soybean processing, the industry standard to produce soy diesel is crushing soybeans, extracting the soy oil, then using transesterification to convert the soy oil to soy diesel. In 2013, two facilities in Indiana were capable of producing biodiesel—the plants are located in Shelby and Kosciusko county [20]. The soy diesel production capacity of Indiana is 104 million gallons, with 99 million coming from the northern processing plant (Kosciusko county) and the balance is produced at a central Indiana plant (Shelby county) [20]. In Kosciusko county, the facility manufactures soybean oil and soy diesel on the same property. Hence, in the northern facility, the whole process from soybean to biodiesel production is done. The co-product from the facility is soybean meal. The producer in Shelby county does not produce soybean oil onsite, and instead uses soybean oil from another facility in the same city of Morrisontown. Hence, in the central facility, the process involves buying soybean oil from the nearby soybean crusher. In this case, the co-product of soymeal is produced at the crusher unit, hence the impact was allocated using mass-based allocation to biodiesel production. As seen in Table 1, the capacity of production in the northern facility is significantly larger than central facility production. This implies that one can assume almost all soy-biodiesel to come from the northern facility, however, for the purpose of demonstrating the impact of variations in processing pathways, we have performed a comparative LCA here. The functional unit used for comparison in this study is per-liter biodiesel, which is being produced in both pathways. Mass-based allocation was used at the respective process units for the allocation of life cycle impacts to biodiesel and co-products. Process models were built for the conversion process in Aspen Plus (Version 8.8, Aspen Technologies, Bedford, MA, USA, 2019) to obtain the unit process data that were fed into SimaPro (Version 9, PRé Consultants, Amersfoort, Netherlands, 2019) for the life cycle stage of soybean processing to biodiesel.

2.5. Biodiesel Production Process Modeling

For soybean biodiesel production, a two-stage process is used.
Stage 1—Soybean to soybean oil conversion: In the first stage, soybeans are first cleaned to separate out any particulate contaminants before being cracked. After cracking open the beans, all the hulls are separated using blasts of air. Once hulls are separated, the beans are crushed into flakes and then processed to extract oil using a hexane extraction process. The soybeans are assumed to contain 19.2% oil in the form of three triglycerides: linoleic, oleic and palmitic fatty acids [20]. The various unit operational blocks used in Aspen plus are shown below in Figure 2A. Some of the assumptions about unit operations will result in variations from actual plant emissions, however, most of the chemical processes are captured.
Stage 2—Soybean oil to biodiesel conversion: Soybean oil is converted into biodiesel by a series of trans esterification reactions in the presence of NaOH. Soybean undergoes trans esterification in a reaction tank and the outputs of the reaction are a mixture of methylated fatty acid molecules (biodiesel) (ex: CH3-L, CH3-O and CH3-P), glycerol, and unreacted intermediate products, along with the catalyst NaOH. This mixture is then selectively distilled to separate out biodiesel. Reaction kinetics for soybean biodiesel production was obtained from literature [21]. Some of the assumptions about unit operations will result in variations from actual plant emissions, however most of the chemical processes are captured, hence it provides reliable estimates of the potential emissions (conservative estimate) from plants. The operational blocks modeled in Aspen plus are shown below in Figure 2B.
The northern facility combines both these stages in a single plant. Therefore, for northern biodiesel production, these two stages were combined as single plant data. The central IN uses the soybean oil from a soybean crushing facility nearly and is transported to the soybean biodiesel production facility by truck. A transportation stage for transport of soybean oil to soybean biodiesel production plant was added to capture this difference.

2.6. Transportation Life Cycle Stage

The next important difference in biodiesel production in North and Central facility is the logistics involved in moving the feedstock between processes. As seen in the system boundary diagram, the transportation in north and central biodiesel production involves moving soybean first to the grain elevators, and then to either the grain crusher, as in the central region, or to the biodiesel plant, as in the north region. The calculation of the transportation life cycle stage is described for both systems below.
Northern Biodiesel Production: In northern production system, soybeans are either directly transported to the facility (if the distance of the facility is <30 mi from the farm) [22] or transported to local grain elevator first, from which point the soybeans are then transferred to the processing facility. Since county elevator centers are present in almost all counties in Indiana [23], the distance between the production facility and all the northern county centers were calculated using Google maps (shortest driving time) and truck transportation was chosen as the mode of transport to ship the grains. The distances were used, along with the weight of the soybeans transported from each county to the biodiesel plant in SimaPro, to calculate the county-wise environmental impacts associated with transporting the soybeans.
Central Biodiesel Production: In the central facility, the feedstock is soybean oil which comes from a nearby crusher (Bunge North America) in Morrisontown. Once again, it is assumed that all central Indiana counties will ship their grains to the facility via grain elevators, with only one exception: the distance to facility is <30 mi, in which case the grains are directly shipped to the crushing facility. Similar to the northern counties, Google maps was used to calculate the distances and was used along with the weight transported in SimaPro to calculate the county-wise environmental impacts associated with transporting the soybeans.
Upstream Life Cycle Data: Additional inputs to the farming life cycle stage and processing stage for production of biodiesel were modeled using unit process information from SimaPro LCI. These upstream data include inputs to the farming stage such as various types of fertilizers and chemical inputs in soybean diesel production (hexane for extraction process). Hence, the upstream process representation is an average representation that does not capture any regional variation in manufacturing impact for those products. The material flow mapping to SimaPro is shown in supplementary material.

3. Allocating Spatial Impacts at County Scale to Soybean Based Biodiesel Production

Spatial variations of assessed impacts occur due to variations in farming stage at county scale and associated transportation to the biodiesel plants. Since only one soybean biodiesel plant exists for each region studied, the final impacts due to farming required for supporting biodiesel production and transportation are allocated back to the county based on their contribution to biodiesel production. It was assumed that all counties in a region contribute towards the supply of soybeans for biodiesel production. The amount each county supplies to the biodiesel production is equal to the county’s soybean relative production within a region times the demand for soybean at the biodiesel plant. For example, if a county ‘A’ produces ‘X’ % of the soybeans in the northern Indiana region, then it was assumed that ‘X’ % of the total demand of soybeans by the biodiesel plant in the north was met by the county ‘A’ and ‘X’ % of all the impacts associated with producing a gallon of biodiesel in the northern plant is allocated to county ‘A’. Similarly, impacts associated with transporting the ‘X’ % of soybean demand to the biodiesel plant was allocated to county ‘A’. The same allocation technique was applied to impacts of biodiesel production in central Indiana. The percentage calculation for each county is provided in the supplementary material.

4. Results and Discussion
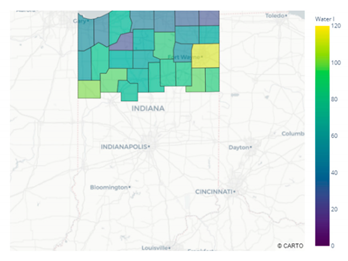
4.1. North Indiana

Table 3 (left column) shows the per-liter biodiesel environmental impacts of producing biodiesel at the north plant in Claypool, Indiana. Among the impact of all the north counties studied, specific patterns of environmental impacts were found. Allen and White county were the top counties in the north that had the highest environmental impacts in terms of global warming potential, eutrophication, water consumed, and land used. These results are consistent with the fertilizer and water application practices observed during the LCI collection. These counties tend to use some of the highest fertilizer and water per acre of soybean crop in the entire state. On the other hand, Starke and Steuben counties in the north had the lowest environmental impacts in all the categories studied. When assessing transportation-related global warming and eutrophication impacts, it may initially seem trivial that the farther the soybeans must be transported, the larger the impacts. However, since different counties produce different amounts of soybeans, Table 3’s figures show the impacts considering not only distance travelled, but also the county’s contribution to the total biodiesel plant’s soybean demand. The highest environmental impacts related to this distance, coupled with soybean contribution, were seen in the counties of Benton and Jasper.

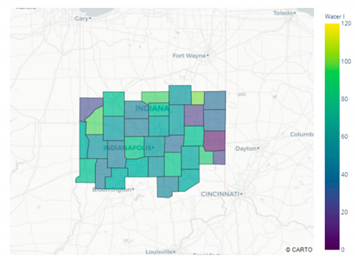
4.2. Central Indiana

Table 3 (right column) also shows the per-liter biodiesel environmental impacts of producing biodiesel at the central soybean oil plant in Morrisontown, Indiana. Similar to the northern counties, some specific patterns were also observed in the central counties. Montgomery and Randolph counties had the highest environmental impacts related to water and land use, global warming potential, and eutrophication. Like the northern counties, this observation is consistent with the high fertilizer and water usage data observed in the LCI data collected. Of all the counties studied in the central region, Vermillion and Marion counties had disproportionately low impacts per liter of biodiesel produced. This was again consistent with the very low fertilizer usage observed in the county based on the LCI data collection. When it comes to transporting the soybeans to Morrisontown, unlike the northern counties, the impacts were primarily related to distance transported and only slightly based on the contributions of the individual counties towards biodiesel production in the central plant. This can be explained by the disproportionately smaller biodiesel production capacity of the central plant coupled with a relatively uniform soybean production in the central counties. Since the soybeans are assumed to be first transported to the soybean oil processing center and then to the biodiesel plant (not directly to the biodiesel plant, as in the north counties), it is possible that the soybean oil processing center, which produces relatively generic commodities (oil and soymeal) compared to the biodiesel plant, sees a relatively uniform supply from the soybean farmers. Since the production facility is small, it may not be profitable in central Indiana for farmers to transport for biodiesel production, hence there is a lower impact from transportation in life cycle of biodiesel production in this part of state. Overall, at an aggregate level, both regions performed similarly in terms of global warming potential, but the northern region performed slightly better than the central in terms of eutrophication.

5. Conclusions

There are some commonalities between the studied environmental impacts of the northern and central Indiana counties. Irrespective of geographic region, the counties had higher environmental impacts if the fertilizer and water application was high. A gradual increase or decrease in impacts was observed in the east–west or north–south direction in neither region. From the LCI data and the impacts studied, it appears that the farming practices vary greatly from county to county in both northern and central Indiana, hence sourcing soybean from different counties can result in a different overall impact for biodiesel production. However, based on the transportation model assumed in this study, it appears that the transportation-related environmental impacts are different in northern and central regions. While the central region was not sensitive to the contribution of individual counties towards biodiesel production, and was mainly sensitive to the distance travelled, the northern region was sensitive to both distance and the contributions of individual counties. This can be attributed to the volume of transportation based on capacity of the biodiesel production plant, which is much lower in the central plant.
Based on the environmental impacts calculated and patterns observed in this study, it can be concluded that the spatial distribution of environmental impacts of bio-based energy production depend on at least four factors: (1) fertilizer and water application rates for feedstock, (2) land usage, (3) distance to the processing plant, and (4) the available options for soybean farmers to sell their harvested soybeans. While the technology for biobased processing can be same, it can have different spatial impacts based on these factors. Hence, from a life cycle perspective, these sub-regional spatial variations can make the same product being produced in a different facility more favorable from an environmental perspective. Thus, these sub-regional impacts of a processing facility must also be considered while deciding on the environmental friendliness of products made using almost the same technology. Such spatial impact variations are not currently included in LCAs for bio-based energy and production, however, they must be included for decision making. Although not included in this study, it is also recommended that other factors, such as soil quality and percentage of cover crops in a county, along with energy inputs, be included in future studies, as these can also influence the spatial environmental impacts.

Supplementary Materials

The following files are available online at https://www.mdpi.com/2227-9717/8/4/392/s1, S1: Central results per liter biodiesel, S2: North results per liter biodiesel, S3: Inventory and impact allocation, and S4: Formulas and data sources document.

Author Contributions

Conceptualization, S.S. and V.S.G.V.; Methodology, V.S.G.V.; Software, V.S.G.V.; Validation, V.S.G.V.; Formal Analysis, V.S.G.V..; Data Curation, V.S.G.V.; Writing-Original Draft Preparation, V.S.G.V. and S.S.; Writing-Review & Editing, S.S.; Visualization, V.S.G.V.; Supervision, S.S.; Project Administration, S.S.; Funding Acquisition, S.S. All authors have read and agreed to the published version of the manuscript.

Funding

Partial funding provided by Purdue SURF Pathways program that supported Esai Lopez during the SURF program and funding from NMSU for Esai Lopez’s summer research. We also acknowledge funding support from U.S. National Science Foundation (NSF CBET-1805741).

Acknowledgments

We acknowledge SURF Pathways student Esai Lopez who worked with Dr Singh as summer research assistant. Esai worked on preliminary data gathering and LCA model for soybean farming in Indiana along with preparing a draft of this manuscript. We also acknowledge three anonymous reviewers for providing feedback that has helped improve this manuscript.

Conflicts of Interest

The authors declare no conflict of interest.

References

  1. Nitschelm, L.; Aubin, J.; Corson, M.S.; Viaud, V.; Walter, C. Spatial differentiation in Life Cycle Assessment LCA applied to an agricultural territory: Current practices and method development. J. Clean. Prod. 2016, 112, 2472–2484. [Google Scholar] [CrossRef]
  2. Tilman, D.; Socolow, R.; Foley, J.A.; Hill, J.D.; Larson, E.; Lynd, L.R.; Pacala, S.; Reilly, J.; Searchinger, T.; Somerville, C.; et al. Beneficial Biofuels--The Food, Energy, and Environment Trilemma. Science 2009, 325, 270–271. [Google Scholar] [CrossRef] [PubMed] [Green Version]
  3. Kim, S.; Dale, B.E. Life cycle assessment of various cropping systems utilized for producing biofuels: Bioethanol and biodiesel. Biomass Bioenergy 2005, 29, 426–439. [Google Scholar] [CrossRef]
  4. Qin, Z.; Zhuang, Q.; Cai, X.; He, Y.; Huang, Y.; Jiang, N.; Lin, E.; Liu, Y.; Tang, Y.; Wang, M.Q. Biomass and biofuels in China: Toward bioenergy resource potentials and their impacts on the environment. Renew. Sustain. Energy Rev. 2018, 82, 2387–2400. [Google Scholar] [CrossRef]
  5. Kesieme, U.; Pazouki, K.; Murphy, A.; Chrysanthou, A. Attributional life cycle assessment of biofuels for shipping: Addressing alternative geographical locations and cultivation systems. J. Environ. Manag. 2019, 235, 96–104. [Google Scholar] [CrossRef] [PubMed] [Green Version]
  6. Chen, J.; Li, J.; Dong, W.; Zhang, X.; Tyagi, R.D.; Drogui, P.; Surampalli, R.Y. The potential of microalgae in biodiesel production. Renew. Sustain. Energy Rev. 2018, 90, 336–346. [Google Scholar] [CrossRef]
  7. Tsiropoulos, I.; Faaij, A.P.C.; Seabra, J.E.A.; Lundquist, L.; Schenker, U.; Briois, J.-F.; Patel, M.K. Life cycle assessment of sugarcane ethanol production in India in comparison to Brazil. Int. J. Life Cycle Assess. 2014, 19, 1049–1067. [Google Scholar] [CrossRef]
  8. Reijnders, L.; Huijbregts, M.A.J. Palm oil and the emission of carbon-based greenhouse gases. J. Clean. Prod. 2008, 16, 477–482. [Google Scholar] [CrossRef]
  9. Castanheira, E.; Grisoli, R.; Coelho, S.; Da Silva, G.A.; Freire, F. Life-cycle assessment of soybean-based biodiesel in Europe: Comparing grain, oil and biodiesel import from Brazil. J. Clean. Prod. 2015, 102, 188–201. [Google Scholar] [CrossRef]
  10. Rajaeifar, M.A.; Ghobadian, B.; Safa, M.; Heidari, M.D. Energy life-cycle assessment and CO2 emissions analysis of soybean-based biodiesel: A case study. J. Clean. Prod. 2014, 66, 233–241. [Google Scholar] [CrossRef]
  11. Hiloidhari, M.; Baruah, D.; Singh, A.; Kataki, S.; Medhi, K.; Kumari, S.; Ramachandra, T.V.; Jenkins, B.; Thakur, I.S. Emerging role of Geographical Information System (GIS), Life Cycle Assessment (LCA) and spatial LCA (GIS-LCA) in sustainable bioenergy planning. Bioresour. Technol. 2017, 242, 218–226. [Google Scholar] [CrossRef] [PubMed]
  12. Tabatabaie, S.M.H.; Tahami, H.; Murthy, G.S. A regional life cycle assessment and economic analysis of camelina biodiesel production in the Pacific Northwestern US. J. Clean. Prod. 2018, 172, 2389–2400. [Google Scholar] [CrossRef]
  13. Humpenöder, F.; Schaldach, R.; Cikovani, Y.; Schebek, L. Effects of land-use change on the carbon balance of 1st generation biofuels: An analysis for the European Union combining spatial modeling and LCA. Biomass Bioenergy 2013, 56, 166–178. [Google Scholar] [CrossRef]
  14. Cronin, K.R.; Runge, T.M.; Zhang, X.; Izaurralde, R.C.; Reinemann, D.J.; Sinistore, J.C. Spatially Explicit Life Cycle Analysis of Cellulosic Ethanol Production Scenarios in Southwestern Michigan. BioEnergy Res. 2016, 10, 13–25. [Google Scholar] [CrossRef] [Green Version]
  15. Butnar, I.; Rodrigo, J.; Gasol, C.M.; Castells, F. Life-cycle assessment of electricity from biomass: Case studies of two biocrops in Spain. Biomass Bioenergy 2010, 34, 1780–1788. [Google Scholar] [CrossRef]
  16. Patouillard, L.; Bulle, C.; Querleu, C.; Maxime, D.; Osset, P.; Margni, M. Critical review and practical recommendations to integrate the spatial dimension into life cycle assessment. J. Clean. Prod. 2018, 177, 398–412. [Google Scholar] [CrossRef] [Green Version]
  17. Crops and Plants; USDA-NASS: Washington, DC, USA, 2012. Available online: http://www.nass.usda.gov/ (accessed on 6 May 2013).
  18. U.S. Energy Information Administration (EIA). Available online: https://www.eia.gov/ (accessed on 26 February 2020).
  19. Potter, S.R.; Andrews, S.; Atwood, J.D.; Kellogg, R.L.; Lemunyon, J.; Norfleet, L. Model Simulation of Soil Loss, Nutrient Loss, and Change in Soil Organic Carbon Associated with Crop Production; United States Department of Agriculture: Washington, DC, USA, 2006.
  20. FACT SHEET: Biofuels Plants in Indiana; Indiana State Department of Agriculture: Indianapolis, IN, USA, 2013.
  21. Lee, K.W.; Yu, J.X.; Mei, J.H.; Yan, L.; Kim, Y.W.; Chung, K.W. A kinetic study on the transesterification of glyceryl monooleate and soybean used frying oil to biodiesel. J. Ind. Eng. Chem. 2007, 13, 799–807. [Google Scholar]
  22. Alexander, C.; Conley, S.P.; Dobbins, C.; Hurt, C.; Patrick, G. Soybean Production Systems: Where Do Indiana Soybean Producers Sell; Purdue Extension: West Lafayette, IN, USA, 2006. [Google Scholar]
  23. ISDA: Grain Licensee Listing. Available online: https://www.in.gov/isda/2399.htm (accessed on 30 December 2019).
Figure 1. (A) Cradle-to-Gate System boundary for northern Indiana biodiesel production; (B) Cradle-to-Gate System boundary for central Indiana biodiesel production.
Processes 08 00392 g001
Figure 2. (A) Soybean to soybean oil conversion process flow diagram as used in Aspen plus; (B) Soybean oil to soy biodiesel production Process Flow Diagram.
Processes 08 00392 g002
Table 1. Biodiesel Production Capacity in Indiana, 2013 [18].
LocationPlant CapacityFeedstock
Claypool, Kosciusko county, Indiana99 Mega gallons per yearSoybean
Morrisontown, Shelby county, Indiana5 Mega gallons per yearSoy-oil
Table 2. Aggregated inventory data for north and central biodiesel production life cycle stages (Source: USDA NASS [17] and USDA NRCS report [19]. More info in supplementary material.).
Life Cycle StageMaterial FlowNorth IndianaCentral Indiana
Soybean farmingAcres of soybean crop harvested—m25.53 × 1093.08 × 108
Water applied—m36.75 × 1083.75 × 107
Soybean—kg1.80 × 1099.12 × 107
Fertilizer applied—N (kg)2.84 × 1063.42 × 106
Bio fixation—N (kg)1.51 × 1081.92 × 108
Fertilizer applied—P2O5 (kg)1.72 × 1072.08 × 107
Fertilizer applied—K2O (kg)4.62 × 1075.57 × 107
N emissions air (kg)1.17 × 1071.49 × 107
N emissions soil (kg)3.85 × 1064.91 × 106
N emissions water (kg)1.00 × 1071.28 × 107
P emissions water (kg)1.20 × 1061.53 × 106
Soybean processingSoybeans used (kg)1.80 × 1099.12 × 107
Sodium hydroxide (kg)1.73 × 1078.78 × 105
Methanol (kg)3.49 × 1071.76 × 106
Hexane (kg)3.68 × 1081.86 × 107
Water (kg)1.73 × 1078.78 × 105
Table 3. Environmental impacts per liter of biodiesel produced. Impacts are distributed across the different life cycle stages.
Soybean Farming Stage
Water Consumption—Liter Per Liter Biodiesel Produced
Northern Counties Central Indiana Counties
Processes 08 00392 i001 Processes 08 00392 i002
Land use—m2/liter biodiesel produced
Northern Counties Central Indiana Counties
Processes 08 00392 i003 Processes 08 00392 i004
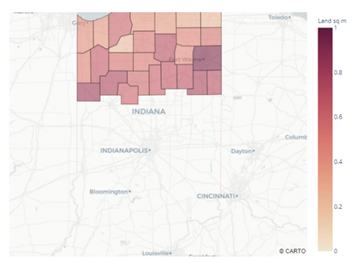
Global warming potential—kg CO2 eq per liter biodiesel produced
Northern Counties Central Indiana Counties
Processes 08 00392 i005 Processes 08 00392 i006
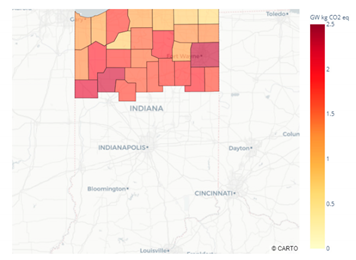
Eutrophication—kg N (10−3) eq per liter biodiesel produced
Northern Counties Central Indiana Counties
Processes 08 00392 i007 Processes 08 00392 i008
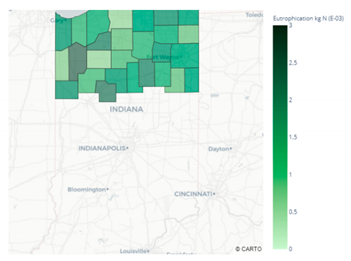
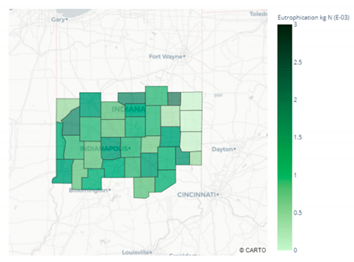
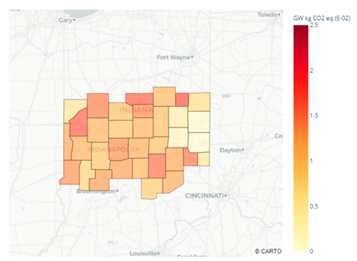
Transportation Stage
Global warming potential—kg CO2 (10−3) eq per liter biodiesel produced
Northern Counties Central Indiana Counties
Processes 08 00392 i009 Processes 08 00392 i010
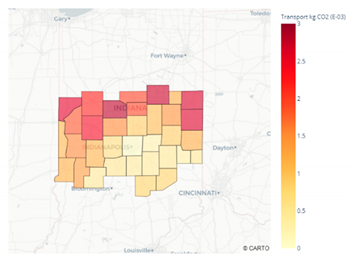
Eutrophication—kg N (10−7) eq per liter biodiesel produced
Northern Counties Central Indiana Counties
Processes 08 00392 i011 Processes 08 00392 i012
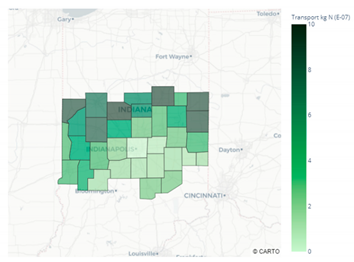
Soybean Biodiesel Production Stage
Northern Production FacilityCentral Production Facility
Soybean biodiesel production

Global warming potential—kg CO2 per liter of biodiesel produced = 0.39

Eutrophication—kg N eq per liter of biodiesel produced = 1.16 × 10⁻³
Soybean oil production
Global warming potential—kg CO2 per liter biodiesel produced = 0.23
Eutrophication—kg N eq per liter of biodiesel produced = 1.13 × 10⁻³
Soybean biodiesel production
Global warming potential—kg CO2 per liter biodiesel produced = 0.17
Eutrophication—kg N eq per liter of biodiesel produced = 2.54 × 10⁻⁵

