A Chemometric Tool to Monitor and Predict Cell Viability in Filamentous Fungi Bioprocesses Using UV Chromatogram Fingerprints

 , , and
Abstract
:1. Introduction
2. Materials and Methods
2.1. Bioreactor Cultivations
2.1.1. Bioreactor Set-Up
2.1.2. P. Chrysogenum
2.1.3. T. reesei Rut-C30
2.2. Viability Assays
2.2.1. P. Chrysogenum
PI Staining
2.2.2. T. reesei Rut-C30
FDA Staining
2.3. Data Analysis
2.3.1. Data Acquisition
P. Chrysogenum
T. reesei Rut-C30
2.3.2. Data Pre-Processing
2.3.3. Descriptive Analysis (PCA)
2.3.4. Predictive Analysis
2.3.5. Software
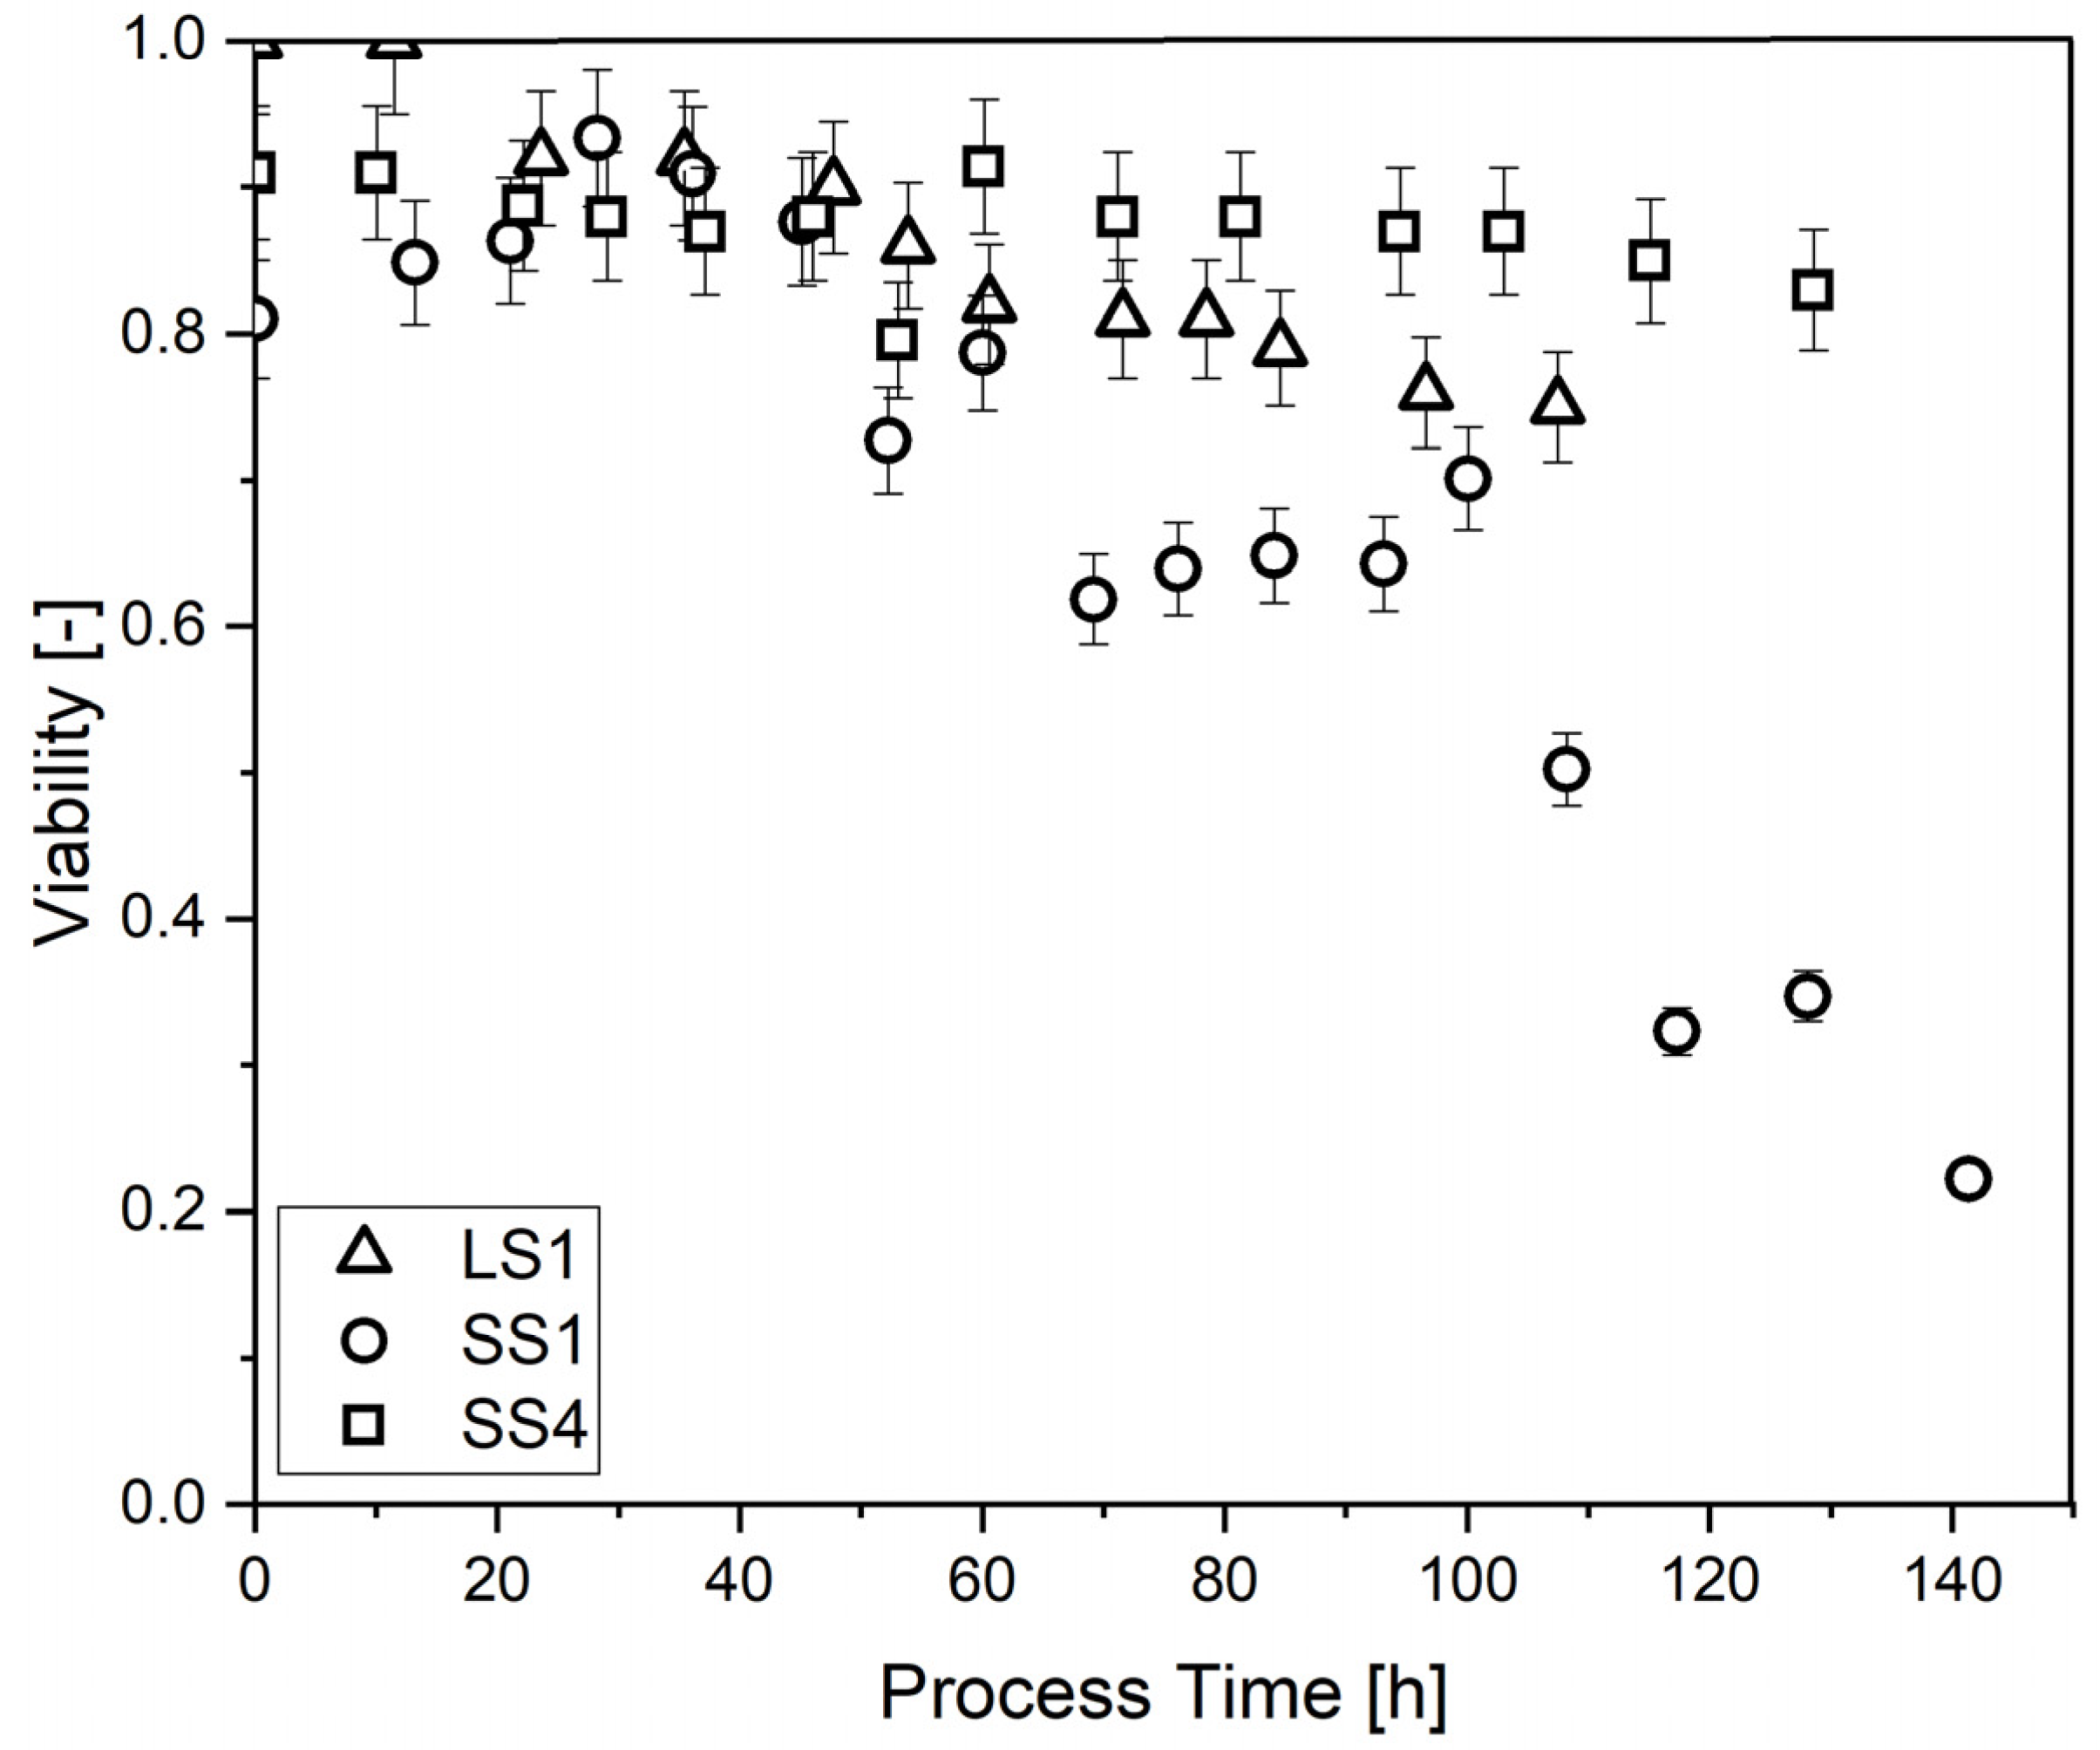
3. Results
3.1. Data Acquisiton
3.2. Data Pre-Processing
3.3. Descriptive Analysis
3.4. Predictive Analysis
3.5. Tool Versatility
4. Discussion and Conclusions
Author Contributions
Funding
Acknowledgments
Conflicts of Interest
Appendix A

| Name | Average qs [gs/gx/h] | Average Dissolved Oxygen Content [%] | Average Viability [-] |
|---|---|---|---|
| LS1 | 0.054 ± 0.005 | 40.0 ± 5.4 | 0.79 ± 0.05 |
| LS2 | 0.045 ± 0.004 | 40.0 ± 5.2 | 0.82 ± 0.09 |
| LS3 | 0.017 ± 0.003 | 40.0 ± 5.1 | 0.88 ± 0.05 |
| SS1 | 0.042 ± 0.004 | 40.0 ± 6.5 | 0.63 ± 0.24 |
| SS2 | 0.038 ± 0.003 | 22.5 ± 4.1 | 0.68 ± 0.18 |
| SS3 | 0.015 ± 0.004 | 05.0 ± 0.5 | 0.70 ± 0.17 |
| SS4 | 0.026 ± 0.003 | 22.5 ± 3.9 | 0.88 ± 0.06 |
| SS5 | 0.035 ± 0.003 | 22.5 ± 6.9 | 0.87 ± 0.03 |
| SS6 | 0.018 ± 0.001 | 5.0 ± 0.5 | 0.78 ± 0.12 |
| SS7 | 0.034 ± 0.005 | 22.5 ± 6.6 | 0.79 ± 0.06 |
| SS8 | 0.033 ± 0.005 | 22.5 ± 5.0 | 0.78 ± 0.10 |
| SS9 | 0.040 ± 0.012 | 5.0 ± 0.5 | 0.35 ± 0.18 |


| Raw Viability | Smoothed Viability | |
|---|---|---|
| PLS | 0.11 | 0.08 |
| OPLS | 0.10 | 0.07 |
| PCR | 0.12 | 0.10 |
References
- ICH. International Conference on Harmonisation Draft Guidance: Q8(R2) Pharmaceutical Development Revision 2; D.o.H.a.H. Services: Rockville, MD, USA, 2009. [Google Scholar]
- Ehgartner, D.; Fricke, J.; Schröder, A.; Herwig, C. At-line determining spore germination of Penicillium chrysogenum bioprocesses in complex media. Appl. Microbiol. Biotechnol. 2016, 100, 8923–8930. [Google Scholar] [CrossRef] [PubMed] [Green Version]
- Veiter, L.; Rajamanickam, V.; Herwig, C. The filamentous fungal pellet-relationship between morphology and productivity. Appl. Microbiol. Biotechnol. 2018, 102, 2997–3006. [Google Scholar] [CrossRef] [PubMed] [Green Version]
- Neves, A.A.; Pereira, D.A.; Vieira, L.M.; Menezes, J.C. Real time monitoring biomass concentration in Streptomyces clavuligerus cultivations with industrial media using a capacitance probe. J. Biotechnol. 2000, 84, 45–52. [Google Scholar] [CrossRef]
- Rønnest, N.P.; Stocks, S.M.; Lantz, A.E.; Gernaey, K.V. Introducing process analytical technology (PAT) in filamentous cultivation process development: Comparison of advanced online sensors for biomass measurement. J. Ind. Microbiol. Biotechnol. 2011, 38, 1679–1690. [Google Scholar] [CrossRef]
- Kiviharju, K.; Salonen, K.; Moilanen, U.; Eerikäinen, T. Biomass measurement online: The performance of in situ measurements and software sensors. J. Ind. Microbiol. Biotechnol. 2008, 35, 657–665. [Google Scholar] [CrossRef]
- Kiviharju, K.; Salonen, K.; Moilanen, U.; Meskanen, E.; Leisola, M.; Eerikäinen, T. On-line biomass measurements in bioreactor cultivations: Comparison study of two on-line probes. J. Ind. Microbiol. Biotechnol. 2007, 34, 561–566. [Google Scholar] [CrossRef]
- Ehgartner, D.; Herwig, C.; Fricke, J. Morphological analysis of the filamentous fungus Penicillium chrysogenum using flow cytometry-the fast alternative to microscopic image analysis. Appl. Microbiol. Biotechnol. 2017, 101, 7675–7688. [Google Scholar] [CrossRef] [Green Version]
- Ehgartner, D.; Sagmeister, P.; Herwig, C.; Wechselberger, P. A novel real-time method to estimate volumetric mass biodensity based on the combination of dielectric spectroscopy and soft-sensors. J. Chem. Technol. Biotechnol. 2014, 90, 262–272. [Google Scholar] [CrossRef]
- Dynesen, J.; Nielsen, J. Surface Hydrophobicity of Aspergillus nidulans Conidiospores and Its Role in Pellet Formation. Biotechnol. Prog. 2003, 19, 1049–1052. [Google Scholar] [CrossRef]
- Ehgartner, D.; Hartmann, T.; Heinzl, S.; Frank, M.; Veiter, L.; Kager, J.; Herwig, C.; Fricke, J. Controlling the specific growth rate via biomass trend regulation in filamentous fungi bioprocesses. Chem. Eng. Sci. 2017, 172, 32–41. [Google Scholar] [CrossRef]
- Bodizs, L.; Titica, M.; Faria, N.; Srinivasan, B.; Dochain, D.; Bonvin, D. Oxygen control for an industrial pilot-scale fed-batch filamentous fungal fermentation. J. Process. Control. 2007, 17, 595–606. [Google Scholar] [CrossRef] [Green Version]
- Veiter, L.; Kager, J.; Herwig, C. Optimal process design space to ensure maximum viability and productivity in Penicillium chrysogenum pellets during fed-batch cultivations through morphological and physiological control. Microb. Cell Factories 2020, 19, 1–14. [Google Scholar] [CrossRef] [PubMed]
- Buckley, K.; Ryder, A.G. Applications of Raman Spectroscopy in Biopharmaceutical Manufacturing: A Short Review. Appl. Spectrosc. 2017, 71, 1085–1116. [Google Scholar] [CrossRef] [PubMed]
- Golabgir, A.; Gutierrez, J.M.; Hefzi, H.; Li, S.; Palsson, B.O.; Herwig, C.; Lewis, N.E. Quantitative feature extraction from the Chinese hamster ovary bioprocess bibliome using a novel meta-analysis workflow. Biotechnol. Adv. 2016, 34, 621–633. [Google Scholar] [CrossRef] [PubMed] [Green Version]
- He, Y.; Friese, O.; Schlittler, M.R.; Wang, Q.; Yang, X.; Bass, L.A.; Jones, M.T. On-line coupling of size exclusion chromatography with mixed-mode liquid chromatography for comprehensive profiling of biopharmaceutical drug product. J. Chromatogr. A 2012, 1262, 122–129. [Google Scholar] [CrossRef] [PubMed]
- Luoma, P.; Golabgir, A.; Brandstetter, M.; Kasberger, J.; Herwig, C. Workflow for multi-analyte bioprocess monitoring demonstrated on inline NIR spectroscopy of P. chrysogenum fermentation. Anal. Bioanal. Chem. 2016, 409, 797–805. [Google Scholar] [CrossRef]
- Rathore, A.S.; Bhambure, R.; Ghare, V. Process analytical technology (PAT) for biopharmaceutical products. Anal. Bioanal. Chem. 2010, 398, 137–154. [Google Scholar] [CrossRef]
- FDA. Guidance for Industry PAT: A Framework for Innovative Pharmaceutical Development, Manufacuring, and Quality Assurance; FDA Official Document: Rocksville, MD, USA, 2004; p. 16.
- Rathore, A.S.; Agarwal, H.; Sharma, A.K.; Pathak, M.; Muthukumar, S. Continuous Processing for Production of Biopharmaceuticals. Prep. Biochem. Biotechnol. 2015, 45, 836–849. [Google Scholar] [CrossRef]
- Rathore, A.S.; Wood, R.; Sharma, A.; Dermawan, S. Case study and application of process analytical technology (PAT) towards bioprocessing: II. Use of ultra-performance liquid chromatography (UPLC) for making real-time pooling decisions for process chromatography. Biotechnol. Bioeng. 2008, 101, 1366–1374. [Google Scholar] [CrossRef]
- Rajamanickam, V.; Wurm, D.; Slouka, C.; Herwig, C.; Spadiut, O. A novel toolbox for E. coli lysis monitoring. Anal. Bioanal. Chem. 2016, 409, 667–671. [Google Scholar] [CrossRef] [Green Version]
- Eggenreich, B.; Rajamanickam, V.; Wurm, D.J.; Fricke, J.; Herwig, C.; Spadiut, O. A combination of HPLC and automated data analysis for monitoring the efficiency of high-pressure homogenization. Microb. Cell Factories 2017, 16, 134. [Google Scholar] [CrossRef] [PubMed] [Green Version]
- Rajamanickam, V.; Krippl, M.; Herwig, C.; Spadiut, O.; Josic, D. An automated data-driven DSP development approach for glycoproteins from yeast. Electrophor. 2017, 38, 2886–2891. [Google Scholar] [CrossRef] [PubMed]
- Peterson, R.; Nevalainen, H. Trichoderma reesei RUT-C30—Thirty years of strain improvement. Microbiology 2012, 158, 58–68. [Google Scholar] [CrossRef] [PubMed] [Green Version]
- Posch, A.E.; Herwig, C. Physiological description of multivariate interdependencies between process parameters, morphology and physiology during fed-batch penicillin production. Biotechnol. Prog. 2014, 30, 689–699. [Google Scholar] [CrossRef]
- Mandels, M.; Andreotti, R. Problems and challenges in the cellulose to cellulase fermentation. Process Biochem. 1978, 13, 6–13. [Google Scholar]
- Lecault, V.; Patel, N.; Thibault, J. Morphological Characterization and Viability Assessment of Trichoderma reesei by Image Analysis. Biotechnol. Prog. 2008, 23, 734–740. [Google Scholar] [CrossRef]
- Ehgartner, D.; Herwig, C.; Neutsch, L. At-line determination of spore inoculum quality in Penicillium chrysogenum bioprocesses. Appl. Microbiol. Biotechnol. 2016, 100, 5363–5373. [Google Scholar] [CrossRef]
- Pekarsky, A.; Veiter, L.; Rajamanickam, V.; Herwig, C.; Grünwald-Gruber, C.; Altmann, F.; Spadiut, O. Production of a recombinant peroxidase in different glyco-engineered Pichia pastoris strains: A morphological and physiological comparison. Microb. Cell Factories 2018, 17, 183. [Google Scholar] [CrossRef] [Green Version]
- Veiter, L.; Herwig, C. The filamentous fungus Penicillium chrysogenum analysed via flow cytometry-a fast and statistically sound insight into morphology and viability. Appl. Microbiol. Biotechnol. 2019, 103, 6725–6735. [Google Scholar] [CrossRef] [Green Version]
- Rajamanickam, V.; Sagmeister, P.; Spadiut, O.; Herwig, C. Impurity Monitoring as Novel PAT Tool for Continuous Biopharmaceutical Processes, in Repligen Yearly Reports; Repligen: Waltham, MA, USA, 2018. [Google Scholar]
- Tomasi, G.; Savorani, F.; Engelsen, S.B. icoshift: An effective tool for the alignment of chromatographic data. J. Chromatogr. A 2011, 1218, 7832–7840. [Google Scholar] [CrossRef]
- Wong, J.W.H.; Durante, C.; Cartwright, H. Application of Fast Fourier Transform Cross-Correlation for the Alignment of Large Chromatographic and Spectral Datasets. Anal. Chem. 2005, 77, 5655–5661. [Google Scholar] [CrossRef] [PubMed]
- Rajamanickam, V.; Herwig, C.; Spadiut, O. A Generic Workflow for Bioprocess Analytical Data: Screening Alignment Techniques and Analyzing their Effects on Multivariate Modeling. Biochem. Anal. Biochem. 2019, 8, 1–11. [Google Scholar]
- Sales, K.C.; Rosa, F.; Da Cunha, B.R.; Sampaio, P.; Lopes, M.B.; Calado, C. Metabolic profiling of recombinant Escherichia coli cultivations based on high-throughput FT-MIR spectroscopic analysis. Biotechnol. Prog. 2016, 33, 285–298. [Google Scholar] [CrossRef] [PubMed]
- Sampaio, P.; Sales, K.C.; Rosa, F.O.; Lopes, M.B.; Calado, C. High-throughput FTIR-based bioprocess analysis of recombinant cyprosin production. J. Ind. Microbiol. Biotechnol. 2016, 44, 49–61. [Google Scholar] [CrossRef]
- Zavatti, V.; Budman, H.; Legge, R.; Tamer, M. Monitoring of an antigen manufacturing process. Bioprocess Biosyst. Eng. 2016, 39, 855–869. [Google Scholar] [CrossRef]
- Kornecki, M.; Strube, J. Process Analytical Technology for Advanced Process Control in Biologics Manufacturing with the Aid of Macroscopic Kinetic Modeling. Bioengineering. 2018, 5, 25. [Google Scholar] [CrossRef] [Green Version]
- Glassey, J. Multivariate Data Analysis for Advancing the Interpretation of Bioprocess Measurement and Monitoring Data; Springer Science and Business Media LLC: Berlin, Germany, 2012; Volume 132, pp. 167–191. [Google Scholar]
- Rafferty, C.; Johnson, K.; O’Mahony, J.; Burgoyne, B.; Rea, R.; Balss, K.M. Analysis of chemometric models applied to Raman spectroscopy for monitoring key metabolites of cell culture. Biotechnol. Prog. 2020, e2977. [Google Scholar] [CrossRef]
- Chiappini, F.A.; Teglia, C.M.; Forno, Á.G.; Goicoechea, H.C. Modelling of bioprocess non-linear fluorescence data for at-line prediction of etanercept based on artificial neural networks optimized by response surface methodology. Talanta 2020, 210, 120664. [Google Scholar] [CrossRef]
- Zimmerleiter, R.; Kager, J.; Nikzad-Langerodi, R.; Berezhinskiy, V.; Westad, F.; Herwig, C.; Brandstetter, M. Probeless non-invasive near-infrared spectroscopic bioprocess monitoring using microspectrometer technology. Anal. Bioanal. Chem. 2019, 412, 2103–2109. [Google Scholar] [CrossRef] [Green Version]
- Stenlund, H.; Gorzsás, A.; Persson, P.; Sundberg, B.; Trygg, J. Orthogonal Projections to Latent Structures Discriminant Analysis Modeling on in Situ FT-IR Spectral Imaging of Liver Tissue for Identifying Sources of Variability. Anal. Chem. 2008, 80, 6898–6906. [Google Scholar] [CrossRef]
- Narayanan, H.; Luna, M.F.; Von Stosch, M.; Bournazou, M.N.C.; Polotti, G.; Morbidelli, M.; Butté, A.; Sokolov, M. Bioprocessing in the Digital Age: The Role of Process Models. Biotechnol. J. 2019, 15, e1900172. [Google Scholar] [CrossRef] [PubMed]
- Hemmateenejad, B.; Akhond, M.; Samari, F. A comparative study between PCR and PLS in simultaneous spectrophotometric determination of diphenylamine, aniline, and phenol: Effect of wavelength selection. Spectrochim. Acta Part A Mol. Biomol. Spectrosc. 2007, 67, 958–965. [Google Scholar] [CrossRef] [PubMed]
- Vu, T.N.; Laukens, K. Getting Your Peaks in Line: A Review of Alignment Methods for NMR Spectral Data. Metabolites 2013, 3, 259–276. [Google Scholar] [CrossRef] [PubMed]


© 2020 by the authors. Licensee MDPI, Basel, Switzerland. This article is an open access article distributed under the terms and conditions of the Creative Commons Attribution (CC BY) license (http://creativecommons.org/licenses/by/4.0/).
Share and Cite
Doppler, P.; Veiter, L.; Spadiut, O.; Herwig, C.; Rajamanickam, V. A Chemometric Tool to Monitor and Predict Cell Viability in Filamentous Fungi Bioprocesses Using UV Chromatogram Fingerprints. Processes 2020, 8, 461. https://doi.org/10.3390/pr8040461
Doppler P, Veiter L, Spadiut O, Herwig C, Rajamanickam V. A Chemometric Tool to Monitor and Predict Cell Viability in Filamentous Fungi Bioprocesses Using UV Chromatogram Fingerprints. Processes. 2020; 8(4):461. https://doi.org/10.3390/pr8040461
Chicago/Turabian StyleDoppler, Philipp, Lukas Veiter, Oliver Spadiut, Christoph Herwig, and Vignesh Rajamanickam. 2020. "A Chemometric Tool to Monitor and Predict Cell Viability in Filamentous Fungi Bioprocesses Using UV Chromatogram Fingerprints" Processes 8, no. 4: 461. https://doi.org/10.3390/pr8040461