Article

Effect of Gd and Dy Concentrations in Layered Double Hydroxides on Contrast in Magnetic Resonance Imaging

by
Karina Nava Andrade
*,
Gregorio Guadalupe Carbajal Arízaga
and
José Antonio Rivera Mayorga
Departamento de Química, Universidad de Guadalajara, Marcelino García Barragán 1421, C.P. 44430 Guadalajara, Jalisco, Mexico
*
Author to whom correspondence should be addressed.
Processes 2020, 8(4), 462; https://doi.org/10.3390/pr8040462
Submission received: 18 March 2020 / Revised: 3 April 2020 / Accepted: 9 April 2020 / Published: 14 April 2020
(This article belongs to the Special Issue Advances of Chemical Preparation Methods of Nanomaterials)

Abstract

:
In this work, we explore the synthesis of layered double hydroxide (LDH) particles containing different molar ratios of Gd3+ and Dy3+ cations. A single crystalline phase was obtained for Zn2.0Al0.75Gd0.125Dy0.125-LDH and Zn2.0Al0.5Gd0.25Dy0.25-LDH, and their efficiency as contrast agents was evaluated by T1- and T2-weighted magnetic resonance imaging (MRI). Both GdDy-LDHs exhibited longitudinal relaxivity (r1) higher than a commercial reference. The highest contrast in the T1 mode was achieved with the Zn2.0Al0.75Gd0.125Dy0.125-LDH, which contained the lowest concentration of lanthanides; this efficiency is related to the lowest amount of carbonate anions complexing the lanthanide sites. On the contrary, the best contrast in the T2 mode was achieved with Zn2.0Al0.5Gd0.25Dy0.25-LDH. Zn2.0Al0.75Gd0.125Dy0.125-LDH and Zn2.0Al0.5Gd0.25Dy0.25-LDH presented r2/r1 ratios of 7.9 and 22.5, respectively, indicating that the inclusion of gadolinium and dysprosium into layered structures is a promising approach to the development of efficient bimodal (T1/T2) MRI contrast agents.

1. Introduction

Cancer is a primary public health problem worldwide, and effective cancer treatment depends on timely detection. Magnetic resonance imaging (MRI) is a non-invasive diagnostic modality that allows the detection of soft tissue disorders using non-ionizing radiation [1]. In this technique, the water protons that constitute the tissues are excited by the application of a magnetic field and radiofrequency energy. The contrasts observed in the images show the differences in the water proton relaxation times in healthy and abnormal tissues [2,3]. The variation in proton density between tissues is small, but the use of contrast agents improves the MRI sensitivity and specificity for an accurate diagnosis [4].
Gadolinium chelates, such as Gadovist and Magnevist, are widely used as MRI contrast agents [5]. The paramagnetic susceptibility of Gd3+ induces a prolonged magnetic moment that decreases the longitudinal relaxation time (T1) of tissue water protons generating a positive contrast, that is, brighter images. Dysprosium is another lanthanide that has been explored as a MRI contrast agent. The high magnetic moment of Dy3+ reduces the transverse relaxation time (T2) of the water protons, generating a negative contrast [6,7,8]. The combination of Gd3+ and Dy3+ chelates, T1 and T2 agents, respectively, has been studied for the differentiation of cardiac anomalies, precise delineation of liver necrosis and the visualization of ischemic intestine using a double contrast technique [6].
Chelation of lanthanides decreases the toxicity of free ions, but also restricts the access of water molecules to their inner coordination sphere [8]. The stabilization of Gd3+ and Dy3+ into the layered double hydroxides (LDH) structure has been another strategy explored to reduce the toxicity of lanthanides without compromising their MRI contrast effect [9]. LDHs are anionic clays constituted of divalent (M2+) and trivalent (M3+) cations hexacoordinated to hydroxyl groups. The M3+ cations generate an excess positive charge on the layers, which is compensated by interlayer anions. The immobilization of Gd3+ [10,11,12] and Dy3+ [13,14] in LDH structures by partial isomorphic substitution of M3+ allows the obtaining of biocompatible nanomaterials with possible theragnostic applications [9].
On the other hand, particle size and the positive charge density of LDHs, which is generated by their capacity for anion exchange and the diffusion of surface-adsorbed anions into the environment, favor interaction with cell membranes and promote more efficient internalization [15]. Furthermore, the basicity of LDHs confers selective release of lanthanides under the slightly acidic conditions of the tumor microenvironment. In this way, the controlled administration and selective biodistribution of LDHs could reduce the effective dose of contrast agents and their toxicity in healthy tissues [15,16]. In this paper, we describe the synthesis and characterization of GdDy-doped LDHs as well as the influence of lanthanides concentration on MRI contrast.

2. Materials and Methods

2.1. Synthesis of LDH

LDHs with different concentrations of GdDy were prepared by the precipitation method. Briefly, 40 mL of salt solution containing Zn(NO3)2·6H2O (Meyer, Mexico), Al(NO3)3·9H2O (Meyer, Mexico), Gd(NO3)3·xH2O (Sigma-Aldrich, USA) and Dy(NO3)3·xH2O (Sigma-Aldrich, Missouri) was titrated with 6% NH4OH (Meyer, Mexico) under vigorous stirring in an environmental air atmosphere. The M2+/M3+ molar ratio (where M3+ = Al3+ + Gd3+ + Dy3+) in this mixture was equal to 2:1 (Table 1). The final pH of the solution was adjusted to 10 and the resulting suspension was stirred for 24 h at room temperature. Finally, the obtained precipitate was washed three times with deionized water and dried at 40 °C.

2.2. Characterization of Materials

X-ray diffraction (XRD) patterns were recorded on a PANalytical Empyrean diffractometer using Cu Kα radiation at 40 kV and 20 mA. Fourier transform infrared (FT-IR) spectra were collected in a Thermo-Scientific Nicolet iS5 iD5 ATR spectrometer with 32 scans and a resolution of 2 cm−1. The metallic composition was determined via inductively coupled plasma optical emission spectroscopy (ICP-OES) (Varian, Vista-MPX CCD) simultaneously. Thermal analysis was carried out using a Perkin-Elmer STA 6000 analyzer under a flowing nitrogen atmosphere and a rate of 10 °C min−1. Magnetic resonance imaging (MRI) analyses were performed on a Bruker BioSpec 70/16 scanner with a 7.0 T magnetic field and a pulse sequence RARE-VTR. The T1-relaxivity measurements were acquired using the following parameters: repetition time (RT) = 40, 100, 200, 500, 1000, 3000, 5000 and 7500 ms; echo time (ET) = 11.7 ms; field of view (FOV) = 40 × 24 mm2; matrix = 134 × 78; and slice thickness = 2 mm. For the T2-relaxivity measurements, the parameters were RT = 2000 ms, ET = 36 echoes, 40–1440 ms with a separation between echo times of 40 ms.

3. Results and Discussion

3.1. Characterization of LDH

The white solids obtained in the reactions were analyzed by XRD. As shown in Figure 1a–c, the diffraction patterns of samples containing Al = 1.0, 0.75 and 0.50 presented typical reflections of hydrotalcite-like compounds according to International Centre for Diffraction Data (ICDD) card number 48-1023 (Figure 1). Additional reflections were not observed in these XRD patterns, suggesting the formation of the pure LDH phase. The lower full width at half maximum (FWHM) of reflections in the samples with Al = 0.75 and 0.50 indicate that this concentration increased the crystallinity.
Meanwhile, the XRD pattern of the sample with Al = 0.25 contained reflections of an LDH structure (Figure 1d) and also signals of ZnO (ICDD card number 36-1451) indicated with asterisk in Figure 1. Although the nominal M2+/M3+ molar ratio was maintained, the low Al concentration and the addition of the large Gd3+ and Dy3+ cations did not promote the formation of the layered structures, generating ZnO from the remaining Zn cations. Finally, the pattern of the sample where Al = 0 (i.e., with the highest content of Gd3+ and Dy3+) corresponded to an amorphous phase (Figure 1e). Therefore, a content of Al = 0.50 or more favored the formation of LDH structures with the highest Gd3+ and Dy3+ content, allowing the successful incorporation of Zn cations into the layered structure.
According to the X-ray diffraction patterns, the three LDHs had a rhombohedral 3R symmetry. The first two reflections corresponded to the (003) and (006) planes, respectively. The basal spacing (d003) corresponded to the distance of two layered units and included the thickness of a layer (4.8 Å) and the interlaminar region. Then, by calculating the interlayer space, the size and orientation of the intercalated anion could be determined. The interlayer space equal to 2.9 Å in the obtained LDHs suggested the intercalation of carbonate anions with its molecular plane parallel to the layers [17]. The LDHs were prepared from metal nitrates without using a CO2-free atmosphere, promoting the intercalation of carbonate anions formed in situ due to the dissolution of atmospheric CO2 during synthesis. Several experimental conditions for the synthesis of GdDy-LDH intercalated with nitrates were explored as these anions favored the incorporation of interlayer water molecules [18], which could improve contrast on MRI. However, the Zn2.0Al0.5Gd0.25Dy0.25-LDH was only obtained with interlayer carbonate anions.
The XRD analysis of the LDHs obtained also provided information related to unit cell parameters. The lattice parameter a indicates the distance between cations (M-M) within the layers, which does not depend on the intercalated anion. For LDHs with 3R symmetry, the parameter a was equal to two times the spacing of the (110) reflection, assigned to the first peak of the doublet at around 60° (2θ), then, a = 2d110. The lattice parameter c is closely related to the basal spacing (d003) depending on the degree of hydration, size and orientation of the intercalated anion. The value c was three times the distance corresponding to the reflection of the (003) plane, c = 3d003. Compared to ZnAl-LDH, the low concentration of Gd3+ and Dy3+ cations in the LDH structure did not significantly modify the lattice parameters a and c (Table 2); these observations were in agreement with reported values for lanthanides-doped LDH [19,20].
The reaction products were also characterized by Fourier transform infrared spectroscopy (FT-IR). The FT-IR spectra of compounds with Al = 1.0, 0.75 and 0.50 presented characteristic bands of hydrotalcite-type compounds (Figure 2a–c). The broad band centered at 3410 cm−1 corresponded to O-H stretching of layer hydroxyl groups, as well as the adsorbed and intercalated water molecules. The broad band at 3000 cm−1 was attributed to stretching of O-H groups hydrogen bonded to intercalated carbonate anions [21], while the band at 1640 cm−1 was related to H-O-H bending of physically-adsorbed water. The broad bands at around 750, 600 and 550 cm−1 were due to the metal-OH (M-OH) translation mode [19,21]. For GdDy-LDHs, this band was more intense and was slightly shifted to higher frequencies than that for the ZnAl-LDH. The changes in the bands M-OH suggest the occurrence of GdDy-induced small modulations, which has also been observed for other lanthanide-doped ZnAl-LDHs [19]. For samples Zn2.0Al0.25Gd0.37Dy0.37 and Zn2.0Gd0.5Dy0.5, the bands in the range from 1000 to 525 cm1 did not correspond to M-OH vibrations for LDH structures (Figure 2d,e), as shown in their XRD patterns.
The presence of the interlayer carbonate was also corroborated by FT-IR. The band at 1360 cm−1 was attributed to ν3 stretching of the interlayer carbonates in a symmetric environment. The interactions of carbonates with other species decreased the symmetry of the anion from D3h to C2v or Cs, breaking the double degeneration of the ν3 stretching mode [21,22]. In the spectra of the GdDy-LDHs, an additional band was observed at around 1500 cm−1 due to the splitting of ν3 mode of the anion (Table 3), evidencing the interactions between carbonates and the lanthanides. As shown in Figure 2, the higher lanthanide content increased the intensity of the band located at 1500 cm−1, indicating a larger amount of lower-symmetry carbonate in the interlayer space of Zn2.0Al0.5Gd0.25Dy0.25-LDH. The change in the symmetry of carbonate could be due to the formation of a mono- or bidentate carbonate-metal complex [23]. Based on experimental data, Nakamoto [22] proposed that the separation of ν3 vibration bands (Δν3) indicates the coordination mode of carbonate. In GdDy-LDHs, the Δν3 ≈ 140 cm−1 (Table 3) suggested a monodentate coordination, since Δν3 >300 cm−1 is characteristic of bidentate carbonate metals [22]. Unlike transition metals, lanthanide cations have large coordination numbers, generally from 8 to 10 [24]. Therefore, carbonate anions and water molecules can complete the inner coordination sphere of Gd3+ and Dy3+.
The incorporation of lanthanides in LDH was confirmed by inductively coupled plasma optical emission spectroscopy (ICP-OES). The analysis of Zn2.0Al-LDH revealed a M2+/M3+ molar ratio equal to 1.3:1, which is lower than the expected value (2:1). On the contrary, the molar fractions in Table 4 indicate that the content of metals in Zn2.0Al0.75Gd0.125Dy0.125 was quite close to the nominal amounts used in synthesis. Likewise, ICP-OES analyses suggest that the addition of a higher concentration of Gd3+ and Dy3+ in the reaction mainly promoted the partial isomorphic substitution of Zn2+ by the lanthanide cations, which can be explained by Goldschmidt’s rules of ionic substitution [25]. Shannon-effective ionic radii of Zn2+, Al3+, Gd3+ and Dy3+ were 0.88, 0.67, 1.08 and 1.05 Å, respectively [26]. The ionic radius of lanthanide favors the substitution of zinc cations due to a greater similarity with its ionic radii compared to aluminum. Furthermore, this substitution was possible since the charge difference did not exceed the unit [25]. In all the preparations, the zinc and other remaining ions were removed by washing with deionized water.
The influence of lanthanides on the thermal stability of LDHs was studied by TGA (Figure 3). Thermal decomposition of the GdDy-LDHs occurred mainly in four stages, which are typical for hydrotalcite-like compounds [27]. Once the mass losses associated with each stage were not well-defined transitions, the first derivative of the TGA curves was calculated to determine the temperature of each step, and these data are reported in Table 3. The first mass loss occurred at temperatures below 100 °C and was related to the removal of physisorbed water, which constituted less than 5% of the initial mass of the analyzed LDHs. The second mass loss was observed between 100 and 200 °C, and it was attributed to the elimination of interlayer water and partial dehydroxylation of the layers [19]. In this step, Zn2.0Al0.75Gd0.125Dy0.125-LDH loses 16% of its initial mass, a greater amount compared to 12.8% and 10.2% for Zn2.0Al-LDH and Zn2.0Al0.5Gd0.25Dy0.25-LDH, respectively (Table 5). According to Posati et al. [19], the different thermal behavior of the LDHs is due to the ability of the lanthanide ions to coordinate interlayer water molecules to complete the coordination vacancies. Coordinated water loss occurs at temperatures below that observed for interlayer hydrogen-bonded water. Therefore, dehydration promotes dehydroxylation and the collapse of the GdDy-LDHs structures [19,20].
Additional mass losses, from 200 to 850 °C, were associated with complete dehydroxylation and decarbonation, generating the largest mass loss in all samples [28]. These mass losses occurred in different temperature ranges, which could be due to the diverse interactions between metal cations and carbonate anions [20], and the formation of mixed metal oxides [27]. In particular, LDH exhibited a significant mass loss around 500 °C, suggesting a greater amount of H2O and CO2 molecules removed during the dehydroxylation and decarbonization reactions, respectively [19,28].

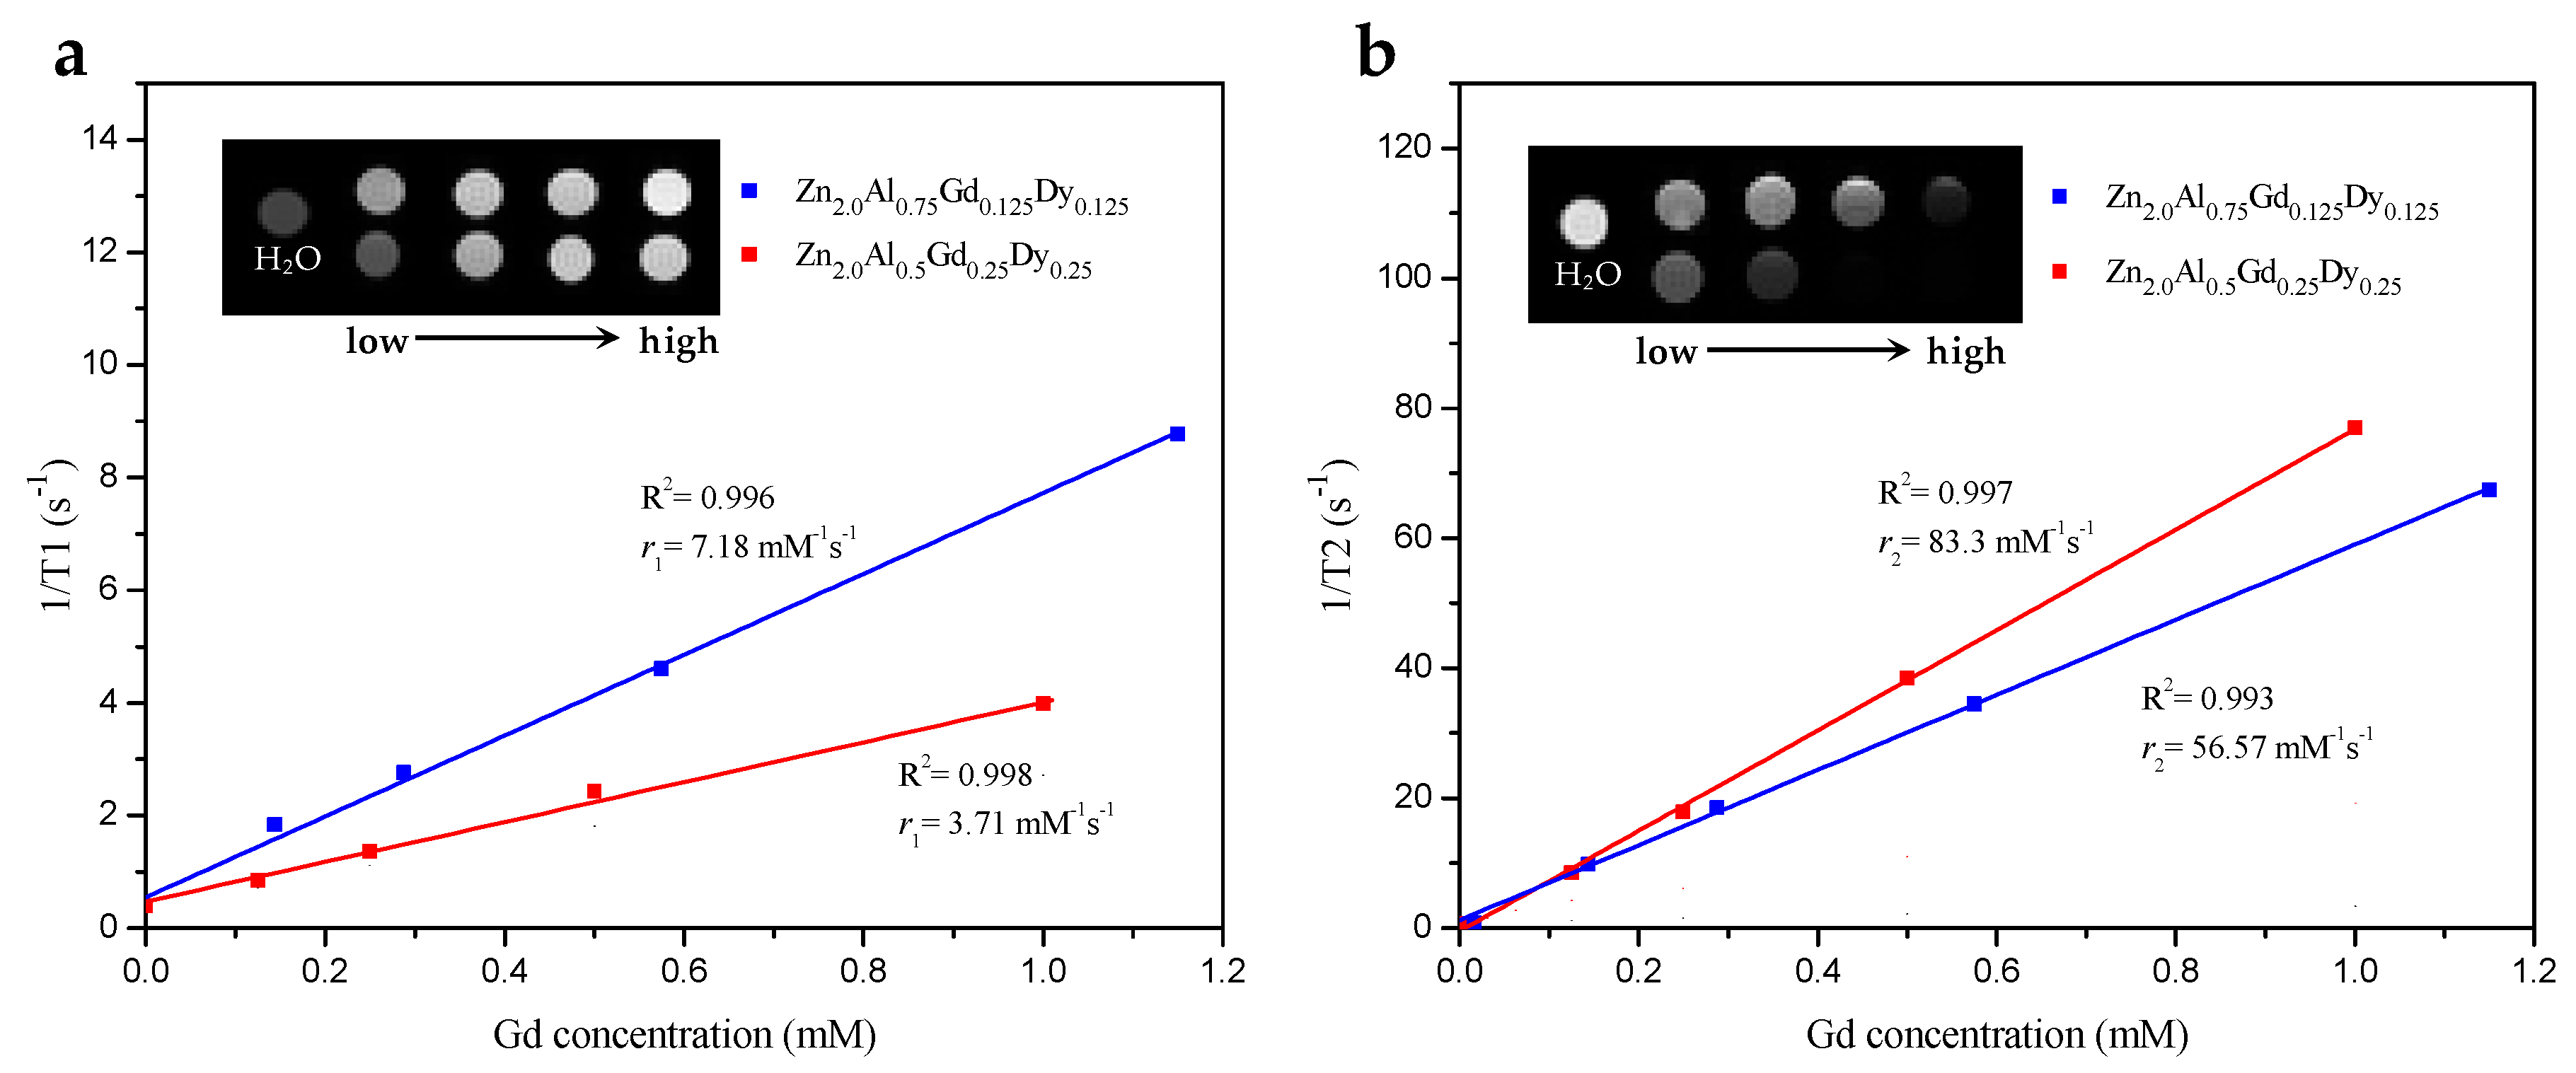
3.2. MRI Contrast Effect

Relaxometry was assessed in T1- and T2-weighted MRI images as a function of lanthanides concentration in aqueous suspensions of Zn2.0Al0.75Gd0.125Dy0.125-LDH and Zn2.0Al0.5Gd0.25Dy0.25-LDH. The T1-relaxivity plots of both GdDy-LDHs showed a linear correlation between the Gd3+ concentration and the longitudinal relaxation rate (Figure 4). The enhanced contrast was assigned to the presence of Gd3+ since the positive contrast (1/T1) increased proportionally to the Gd3+ concentration in the aqueous suspensions. The slope from this graph was defined as the longitudinal relaxivity (r1) and indicated the efficiency of a T1 contrast agent. The r1 values of Zn2.0Al0.75Gd0.125Dy0.125-LDH and Zn2.0Al0.5Gd0.25Dy0.25-LDH were 7.18 and 3.71 mM−1·s−1, respectively, which suggest that both GdDy-LDHs exhibited a higher contrast effect than Gadovist (r1 = 2.24 mM−1·s−1), a clinically-approved T1 contrast agent. In this Gd complex, the coordination of organic ligand only allowed a site of water binding to the inner sphere of Gd3+. GdDy-LDH possibly allowed more access of water molecules to the first coordination of the Gd3+, reducing the T1 of the water protons (Figure 5).
An important observation was the larger r1 value of Zn2.0Al0.75Gd0.125Dy0.125-LDH compared to that of Zn2.0Al0.5Gd0.25Dy0.25-LDH, i.e., the LDH composed with the lower amount of Gd3+ produced higher contrast. The r1 value of Zn2.0Al0.75Gd0.125Dy0.125-LDH indicates that Gd3+ sites were more effective for the contrast, very probably since they were more available for coordination with water molecules. This fact seems to be also related to competition with carbonate ions. As observed in the FT-IR spectrum, the higher content of gadolinium increased the band at 1500 cm−1 associated with the amount of carbonate coordinating lanthanides, while the band of the bending mode of water at 1640 cm−1 barely changed. The I1500/I1640 intensity ratio allowed for comparison of the changes; while the value for Zn2.0Al0.75Gd0.125Dy0.125-LDH was 3.0, it increased to 4.2 in Zn2.0Al0.5Gd0.25Dy0.25-LDH. These data indicate that Zn2.0Al0.75Gd0.125Dy0.125-LDH contains more interlayer water in agreement with TGA analysis. According to Perez et al. [29], the direct interaction of the carbonate anions with the layer hydroxyl groups is favored by the presence of less water in the layer space. Due to this, the higher interlayer water content in Zn2.0Al0.75Gd0.125Dy0.125-LDH reduces interactions between carbonate anions and lanthanides, improving the T1 contrast effect. Therefore, the design of an efficient MRI contrast agent does not mainly depend on the amount of lanthanides in the LDH structure.
On the other hand, Dy3+ cations produced a negligible T1 contrast effect as they promoted very fast electronic relaxation and lowered the T1 relaxation time. In addition, the slow exchange of water molecules in the inner sphere of dysprosium increased efficiency in transverse relaxivity (r2), generating a negative contrast [6,7]. T2-relaxivity plots (Figure 4) show the proportional increase of the transversal relaxation rate (1/T2) with Dy3+ concentration. The r2 values of Zn2.0Al0.75Gd0.125Dy0.125-LDH (56.57 mM−1·s−1) and Zn2.0Al0.5Gd0.25Dy0.25-LDH (83.86 mM−1·s−1) were significantly higher than sprodiamide, the Dy3+ complex most studied as a T2 contrast agent (r2 = 0.12 mM−1·s−1) [30,31]. Currently, Dy-based MRI contrast agents are not commercially available. These relaxometries confirm that T2 contrast increases with lanthanide content in GdDy-LDHs, which is mainly attributed to the high magnetic moment of dysprosium. However, Gd3+ content also contributes to T2-weighted MRI since this lanthanide increases 1/T1 and 1/T2 by roughly similar amounts but is best visualized using T1-weighted images [5,32]. Due to the absence of lanthanides, ZnAl-LDH does not exhibit an MRI contrast.
The relaxivity values indicate the type and efficiency of a contrast agent. According to Caravan [33], T1 agents usually have a r2/r1 ratio of 1–2, whereas, for T2 agents, the r2/r1 ratio is as high as 10 or more. Based on the MRI analyses, Zn2.0Al0.75Gd0.125Dy0.125-LDH and Zn2.0Al0.5Gd0.25Dy0.25-LDH are classified as T2 agents with r2/r1 ratios of 7.9 and 22.5, respectively. Therefore, the combination of gadolinium and dysprosium mainly enhances T2-weighted MRI and, particularly, Zn2.0Al0.5Gd0.25Dy0.25-LDH can be applied as an efficient T2 contrast agent.

4. Conclusions

The synthesis of ZnAlGdDy-layered double hydroxide was explored, using a Zn/M3+ ratio of 2 (M3+ = Al + Gd + Dy) and different molar ratios of Al and lanthanides. Zn2.0Al0.75Gd0.125Dy0.125-LDH and Zn2.0Al0.5Gd0.25Dy0.25-LDH were obtained as a single crystalline phase. The content of metal cations quantified experimentally for the Zn2.0Al0.75Gd0.125Dy0.125-LDH is in accordance with the nominal content used in synthesis, while for the Zn2.0Al0.5Gd0.25Dy0.25-LDH, the high lanthanide ion content isomorphically substitutes the Zn cations in the layers. The effect of concentrations of lanthanides in the GdDy-LDHs on contrast in magnetic resonance imaging was studied. The longitudinal relaxivity (r1) of Zn2.0Al0.75Gd0.125Dy0.125-LDH (7.18 mM−1·s−1) and Zn2.0Al0.5Gd0.25Dy0.25-LDH (3.71 mM−1·s−1) suggest that water protons access the Gd3+ coordination spheres, promoting better T1-weighted MRI than a commercial MRI agent. Zn2.0Al0.75Gd0.125Dy0.125-LDH exhibited the highest efficiency because the low concentration of lanthanides reduces the interactions between these cations and interlaminar carbonates, increasing the probabilities to coordinate water molecules. Meanwhile, the transversal relaxivity values (r2) of Zn2.0Al0.75Gd0.125Dy0.125 (56.6 mM−1·s−1) and Zn2.0Al0.5Gd0.25Dy0.25-LDH (83.3 mM−1·s−1) confirm the high T2 contrast effect exhibited by both GdDy-LDHs, mainly attributed to the inclusion of Dy cations in the layers. The efficiency is proportional to the lanthanides content within the LDH structure. Finally, the r2/r1 ratios of Zn2.0Al0.75Gd0.125Dy0.125 (7.9) and Zn2.0Al0.5Gd0.25Dy0.25-LDH (22.5) reveal that the combination of gadolinium and dysprosium mainly enhances T2-weighted MRI images. Based on this, Zn2.0Al0.5Gd0.25Dy0.25-LDH can be applied as an efficient bimodal contrast agent.

Author Contributions

K.N.A. performed experiments, analyzed the data and wrote the manuscript. J.A.R.M. analyzed the data. G.G.C.A. contributed reagents, materials and analysis tools, analyzed the data and reviewed the manuscript. All authors have read and agreed to the published version of the manuscript.

Funding

This research and APC was funded by CONACyT project 256690 (Fondo Sectorial de Investigación para la Educación).

Acknowledgments

K.N.A. thanks CONACyT for the scholarship. The authors thank Juan Ortiz and Luis Concha for their technical assistance and access to the imaging facilities at the National Laboratory for Magnetic Resonance in Medicine (LANIREM, CONACyT, UNAM, UAQ, CIMAT). Elena Smolentseva is acknowledged for the ICP-OES analyses at Centro de Nanociencias y Nanotecnología (CNYN, UNAM) and Santiago José Guevara Martínez for the TGA analysis at the Universidad Michoacana de San Nicolás de Hidalgo (UMSNH).

Conflicts of Interest

The authors declare no conflict of interest.

References

  1. Reith, W. Magnetic Resonance Imaging. In Diagnostic and Interventional Radiology; Vogl, T.J., Reith, W., Rummeny, E.J., Eds.; Springer: Berlin/Heidelberg, Germany, 2016; pp. 31–38. [Google Scholar] [CrossRef]
  2. Costa, S.J.; Soria, J.J.A. Resonancia Magnética Dirigida a Técnicos Superiores En Imagen Para El Diagnóstico; Elsevier: Barcelona, España, 2015. [Google Scholar]
  3. Zlatkin, M.B. MRI of the Shoulder: Diagnosis, 2nd ed.; Lippincott Williams & Wilkins: Philadelphia, PA, USA, 2003. [Google Scholar]
  4. Merbach, A.; Helm, L.; Tóth, É. The Chemistry of Contrast Agents in Medical Magnetic Resonance Imaging, 2nd ed.; John Wiley & Sons, Ltd.: Chichester, UK, 2013. [Google Scholar] [CrossRef]
  5. Zhou, Z.; Lu, Z.R. Gadolinium-Based Contrast Agents for Magnetic Resonance Cancer Imaging. Wiley Interdiscip. Rev. Nanomed. Nanobiotechnol. 2013, 5, 1–18. [Google Scholar] [CrossRef] [PubMed] [Green Version]
  6. Norek, M.; Peters, J.A. MRI Contrast Agents Based on Dysprosium or Holmium. Prog. Nucl. Magn. Reson. Spectrosc. 2011, 59, 64–82. [Google Scholar] [CrossRef] [PubMed]
  7. Rocklage, S.M.; Watson, A.D. Chelates of Gadolinium and Dysprosium as Contrast Agents for MR Imaging. J. Magn. Reson. Imaging 1993, 3, 167–178. [Google Scholar] [CrossRef] [PubMed]
  8. Bottrill, M.; Kwok, L.; Long, N.J. Lanthanides in Magnetic Resonance Imaging. Chem. Soc. Rev. 2006, 35, 557–571. [Google Scholar] [CrossRef]
  9. Sánchez, J.C.; Pacheco, M.F.P.; Cano, M.E.; Nava, A.K.; Briones, T.A.L.; Carbajal, A.G.G. Folate- and Glucuronate-Functionalization of Layered Double Hydroxides Containing Dysprosium and Gadolinium and the Effect on Oxidative Stress in Rat Liver Mitochondria. Heliyon 2020, 6. [Google Scholar] [CrossRef] [Green Version]
  10. Wang, L.; Xing, H.; Zhang, S.; Ren, Q.; Pan, L.; Zhang, K.; Bu, W.; Zheng, X.; Zhou, L.; Peng, W.; et al. A Gd-Doped Mg-Al-LDH/Au Nanocomposite for CT/MR Bimodal Imagings and Simultaneous Drug Delivery. Biomaterials 2013, 34, 3390–3401. [Google Scholar] [CrossRef]
  11. Guan, S.; Liang, R.; Li, C.; Wei, M. A Supramolecular Material for Dual-Modal Imaging and Targeted Cancer Therapy. Talanta 2017, 165, 297–303. [Google Scholar] [CrossRef]
  12. Guan, S.; Weng, Y.; Li, M.; Liang, R.; Sun, C.; Qu, X.; Zhou, S. An NIR-Sensitive Layered Supramolecular Nanovehicle for Combined Dual-Modal Imaging and Synergistic Therapy. Nanoscale 2017, 9, 10367–10374. [Google Scholar] [CrossRef] [Green Version]
  13. Vargas, D.R.M.; Oviedo, M.J.; Da Silva Lisboa, F.; Wypych, F.; Hirata, G.A.; Arizaga, G.G.C. Phosphor Dysprosium-Doped Layered Double Hydroxides Exchanged with Different Organic Functional Groups. J. Nanomater. 2013. [Google Scholar] [CrossRef]
  14. Viruete, A.; Carbajal, G.G.A.; Hernández Gutiérrez, R.; Oaxaca Camacho, A.R.; Arratia-Quijada, J. Passive Targeting Effect of Dy-Doped LDH Nanoparticles Hybridized with Folic Acid and Gallic Acid on HEK293 Human Kidney Cells and HT29 Human Cells. J. Nanopart. Res. 2018, 20, 1–10. [Google Scholar] [CrossRef]
  15. Xu, Z.P.; Zeng, Q.H.; Lu, G.Q.; Yu, A.B. Inorganic nanoparticles as carriers for efficient cellular delivery. Chem. Eng. Sci. 2006, 61, 1027–1040. [Google Scholar] [CrossRef]
  16. Nava, K.; Puebla, A.M.; Carbajal, G.G. Passive and active targeting strategies in hybrid layered double hydroxides nanoparticles for tumor bioimaging and therapy. Appl. Clay Sci. 2019, 181, 105214. [Google Scholar] [CrossRef]
  17. Cavani, F.; Trifiro, F.; Vaccari, A. Hydrotalcite-Type Anionic Clays: Preparation, Properties and Applications. Catal. Today 1991, 11, 173–301. [Google Scholar] [CrossRef]
  18. Hou, X.; Bish, D.L.; Wang, S.L.; Johnston, C.T.; Kirkpatrick, R.J. Hydration, expansion, structure, and dynamics of layered double hydroxides. Am. Mineral. 2003, 88, 167–179. [Google Scholar] [CrossRef]
  19. Posati, T.; Costantino, F.; Latterini, L.; Nocchetti, M.; Tarpani, L. New Insights on the Incorporation of Lanthanide Ions Into. Inorg. Chem. 2012, 51, 13229–13236. [Google Scholar] [CrossRef]
  20. Vicente, P.; Pérez-Bernal, M.E.; Ruano-Casero, R.J.; Ananias, D.; Almeida Paz, F.A.; Rocha, J.; Rives, V. Luminescence Properties of Lanthanide-Containing Layered Double Hydroxides. Microporous Mesoporous Mater. 2016, 226, 209–220. [Google Scholar] [CrossRef]
  21. Kloprogge, J.T.; Hickey, L.; Frost, R.L. FT-Raman and FT-IR spectroscopic study of synthetic Mg/Zn/Al-hydrotalcites. J. Raman Spectrosc. 2004, 35, 967–974. [Google Scholar] [CrossRef] [Green Version]
  22. Nakamoto, K. Infrared and Raman Spectra of Inorganic and Coordination Compounds Part B: Applications in Coordination, Organometallic and Bioinorganic Chemistry, 6th ed.; John Wiley & Sons, Inc.: Hoboken, NJ, USA, 2009. [Google Scholar] [CrossRef]
  23. Miyata, S. The Syntheses of Hydrotalcite-like Compounds and Their Structures and Physico-Chemical Properties-i: The Systems Mg2+-Al3+-NO3 -, Mg2+-Al3+-Cl-, Mg2+-Al3+-ClO4 -, Ni2+-Al3+-Cl- and Zn2+-Al3+-Cl-. Clays Clay Miner. 1975, 23, 369–375. [Google Scholar] [CrossRef]
  24. Busca, G.; Lorenzelli, V. Infrared Spectroscopic Identification of Species Arising from Reactive Adsorption of Carbon Oxides on Metal Oxide Surfaces. Mater. Chem. 1982, 7, 89–126. [Google Scholar] [CrossRef]
  25. Goldschmidt, V.M. The Principles of Distribution of Chemical Elements in Minerals and Rocks. J. Chem. Soc. 1937, 655–673. [Google Scholar] [CrossRef]
  26. Shannon, R.D. Revised Effective Ionic Radii in Halides and Chalcogenides. Acta Crystallogr. 1976, 32, 751–767. [Google Scholar] [CrossRef]
  27. Theiss, F.L.; Ayoko, G.A.; Frost, R.L. Thermogravimetric Analysis of Selected Layered Double Hydroxides. J. Therm. Anal. Calorim. 2013, 112, 649–657. [Google Scholar] [CrossRef]
  28. Liu, J.; Song, J.; Xiao, H.; Zhang, L.; Qin, Y.; Liu, D.; Hou, W.; Du, N. Synthesis and Thermal Properties of ZnAl Layered Double Hydroxide by Urea Hydrolysis. Powder Technol. 2014, 253, 41–45. [Google Scholar] [CrossRef]
  29. Perez, J.R.; Mul, G.; Kapteijn, F.; Moulijn, J.A. A spectroscopic study of the effect of the trivalent cation on the thermal decomposition behaviour of Co-based hydrotalcites. J. Mater. Chem. 2001, 11, 2529–2536. [Google Scholar] [CrossRef]
  30. Fowler, R.A.; Fossheim, S.L.; Mestas, J.L.; Ngo, J.; Canet-Soulas, E.; Lafon, C. Non-Invasive Magnetic Resonance Imaging Follow-up of Sono-Sensitive Liposome Tumor Delivery and Controlled Release After High-Intensity Focused Ultrasound. Ultrasound Med. Biol. 2013, 39, 2342–2350. [Google Scholar] [CrossRef]
  31. Haraldseth, O.; Jones, R.A.; Müller, T.B.; Fahlvik, A.K.; Øksendal, A.N. Comparison of Dysprosium DTPA BMA and Superparamagnetic Iron Oxide Particles as Susceptibility Contrast Agents for Perfusion Imaging of Regional Cerebral Ischemia in the Rat. J. Magn. Reson. Imaging 1996, 6, 714–717. [Google Scholar] [CrossRef]
  32. Sherry, A.D.; Caravan, P.; Lenkinski, R.E. Primer on Gadolinium Chemistry. J. Magn. Reson. Imaging 2009, 30, 1240–1248. [Google Scholar] [CrossRef] [Green Version]
  33. Caravan, P.; Ellison, J.J.; Mcmurry, T.J.; Lauffer, R.B. Gadolinium (III) Chelates as MRI Contrast Agents: Structure, Dynamics and Applications. Chem. Rev. 1999, 99, 2293–2352. [Google Scholar] [CrossRef]
Figure 1. XRD pattern of the samples: (a) Zn2.0Al1.0, (b) Zn2.0Al0.75Gd0.125Dy0.125, (c) Zn2.0Al0.5Gd0.25Dy0.25, (d) Zn2.0Al0.25Gd0.37Dy0.37 and (e) Zn2.0Gd0.5Dy0.5.
Processes 08 00462 g001
Figure 2. FT-IR spectra of the samples: (a) Zn2.0Al1.0, (b) Zn2.0Al0.75Gd0.125Dy0.125, (c) Zn2.0Al0.5Gd0.25Dy0.25, (d) Zn2.0Al0.25Gd0.37Dy0.37 and (e) Zn2.0Gd0.5Dy0.5.
Processes 08 00462 g002
Figure 3. TGA curves of the LDH prepared.
Processes 08 00462 g003
Figure 4. (a) T1- and (b) T2-relaxivity plots of aqueous suspensions of GdDy-LDHs with different Gd3+ concentrations, and MRI images.
Processes 08 00462 g004
Figure 5. Schematic representation of (a) Gadovist and (b) GdDy-LDH.
Processes 08 00462 g005
Table 1. Amount of metal salts used in the synthesis.
SampleMetal Salts, g (mmol)
Zn(NO3)2·6H2OAl(NO3)3·9H2OGd(NO3)3·xH2ODy(NO3)3·xH2O
Zn2.0Al1.01.190 (4)0.720 (1.92)--
Zn2.0Al0.75Gd0.125Dy0.1251.190 (4)0.562 (1.50)0.116 (0.25)0.087 (0.25)
Zn2.0Al0.5Gd0.25Dy0.250.595 (2)0.188 (0.50)0.113 (0.25)0.102 (0.29)
Zn2.0Al0.25Gd0.37Dy0.370.595 (2)0.094 (0.25)0.170 (0.37)0.141 (0.40)
Zn2.0Gd0.5Dy0.50.595 (2)-0.225 (0.50)0.174 (0.50)
Table 2. The lattice parameters and basal spacing of LDH prepared.
Samplea (Å)c (Å)d003
Zn2.0Al1.03.09523.17.70
Zn2.0Al0.75Gd0.125Dy0.1253.08722.537.51
Zn2.0Al0.5Gd0.25Dy0.253.09623.017.67
Table 3. Position of the bands assigned to the ν3 stretching modes of the carbonate anion.
Sampleν3(CO32-) cm−1, (intensity, %)Δν3
Zn2.0Al1.01356-
Zn2.0Al0.75Gd0.125Dy0.1251359 (86), 1505 (40)146
Zn2.0Al0.5Gd0.25Dy0.251363 (99), 1502 (63)139
Table 4. Molar fractions of metal cations in the samples.
SampleMolar Fraction 1 (Nominal)Molar Fraction 1 (Experimental)
ZnAlGdDyZnAlGdDy
Zn2.0Al1.00.670.33--0.570.43--
Zn2.0Al0.75Gd0.125Dy0.1250.670.250.040.040.680.250.040.03
Zn2.0Al0.5Gd0.25Dy0.250.670.170.080.080.410.280.170.15
1 Molar fraction = Mx/Mtotal, where Mx = Zn, Al, Gd or Dy; and Mtotal = Zn +Al + Gd + Dy.
Table 5. TGA data of the sample LDH structures.
SampleTemperature Range (°C) and Mass Loss (%)
1st Loss2nd Loss3rd Loss4th Loss
Zn2.0Al1.025–100 (4.4)100–200 (12.8)200–450 (13.7)450–850 (2.6)
Zn2.0Al0.75Gd0.125Dy0.12525–80 (2.6)80–210 (16.1)210–560 (19.4)560–850 (4.7)
Zn2.0Al0.5Gd0.25Dy0.2525–100 (4.3)100–180 (10.2)180–440 (11.7)440–850 (4.6)

